Global Technology, Media and Telecom (TMT) M&A Quarterly...portfolio company of One Equity Partners....
20
Global Technology, Media and Telecom (TMT) M&A Quarterly Q4’2017
Transcript of Global Technology, Media and Telecom (TMT) M&A Quarterly...portfolio company of One Equity Partners....
Global Technology, Media and Telecom (TMT) M&A QuarterlyQ4’2017

©2018 KPMG Corporate Finance, a Delaware limited liability company. Member FINRA and SIPC. KPMG CorporateFinance is a subsidiary of KPMG LLP, a Delaware limited liability partnership and the U.S. member firm of the KPMGnetwork of independent member firms affiliated with KPMG International Cooperative (“KPMG International”), a Swiss entity.All rights reserved. NDPPS 640221
2
Selected Recent Transactions (1)
2013-2017 Advisor Rankings(2) # of Deals
1. KPMG(1) 2,100
2. PwC 2,068
3. Ernst & Young LLP 1,398
4. Rothschild & 1,287
5. Deloitte 1,179
6. BDO 1,077
7. Houlihan Lokey 1,006
8. Lazard 892
9. Goldman Sachs & 858
10. IMAP 835
Source: Thomson Reuters SDC
(1) Represents the Corporate Finance practices of KPMG International’s network of independent member firms.(2) League tables include completed deals which have value between $0 to $500mm and also where deal value is not disclosed.
2017 Advisor Rankings(2) # of Deals
1. KPMG(1) 395
2. Rothschild & 311
3. PwC 309
4. BDO 223
5. Ernst & Young LLP 222
6. Houlihan Lokey 219
7. Deloitte 206
8. Lazard 189
9. ICBC 184
10. IMAP 177
Co
mm
un
ication
Tech
no
log
yan
d E
lectron
icsIT
Services an
d B
PO
KPMG CF Canada
Logiq3
Value not disclosedDecember 2017
advised Logiq3 on its sale to Reinsurance Group of America
KPMG CF Netherlands
Inspark
Value not disclosedOctober 2017
advised Inspark on its sale to KPN
Intern
et and
Med
ia
KPMG CF Sweden
EQT Partners
Value not disclosedNovember 2017
advised EQT Partners on the acquisition of The Epidemic Sound AB
So
ftware
LCL
Value not disclosedDecember 2017
advised LCL on its sale to Kakaku.com
KPMG CF Japan
2013-2017 TMT Advisor Rankings(2) # of Deals
1. KPMG(1) 420
2. PwC 380
3. Ernst & Young LLP 333
4. Deloitte 247
5. BDO 230
6. Rothschild & 213
7. Goldman Sachs & 203
8. Lazard 197
9. Houlihan Lokey 183
9*. Morgan Stanley 183
KPMG CF Switzerland
JLS Digital
Value not disclosedOctober 2017
advised JLS Digital on its sale to Renaissance Capital
KPMG CF UnitedKingdom
The DMW Group
Value not disclosedNovember 2017
advised The DMW Group on the capital raise from Growth Capital Partners
KPMG CF United Kingdom
Giacom
Value not disclosedDecember 2017
advised Giacomon the sale of the business to Livingbridge
KPMG CF Ireland
Shaw Academy
Value not disclosedAugust 2017
advised Shaw Academy on its venture debt fundraising
Reclamefolder.nl
Value not disclosedAugust 2017
advised Reclamefolder.nl on its sale to De Persgroep NV
KPMG CF Netherlands
KPMG CF Netherlands
FRISS
US$17.7 millionDecember 2017
advised FRISS on the capital raise from Aquiline Technology Growth (ATG) and
Blackfin Capital Partners
KPMG CF Sweden
Vitruvian Partners
Value not disclosedDecember 2017
advised Vitruvian Partners on its acquisition of The EasyPark Group
KPMG CF United States
3M Company
Value not disclosedJune 2017
advised 3M on the divestiture of its Smart Traffic and tolling technologies business
to Neology, part of SmarTrac, NV, a portfolio company of One Equity Partners
KPMG CF Netherlands
QSightIT
Value not disclosedOctober 2017
advised Inspark on its sale to KPN
KPMG CF United States
PRT
Value not disclosedNovember 2017
advised PRT (Pattern Recognition Technologies,) on its sale to DrillingInfo
KPMG CF United Kingdom
LDC (Part of Lloyds Banking Group)
US$21 millionNovember 2017
advised LDC on the acquisition of Eque2
KPMG CF Canada
AVS Systems
US$35.1 millionDecember 2017
advised AVS Systems on its sale to ESC Corp Services, a unit of Information
Services Corp
©2018 KPMG Corporate Finance, a Delaware limited liability company. Member FINRA and SIPC. KPMG CorporateFinance is a subsidiary of KPMG LLP, a Delaware limited liability partnership and the U.S. member firm of the KPMGnetwork of independent member firms affiliated with KPMG International Cooperative (“KPMG International”), a Swiss entity.All rights reserved. NDPPS 640221
3
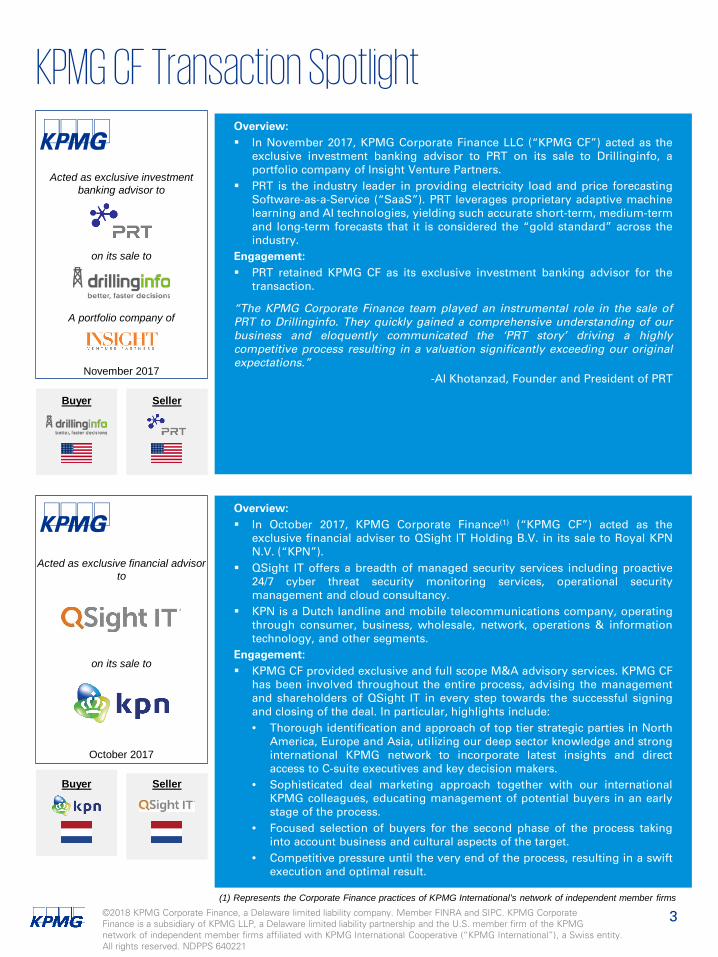
KPMG CF Transaction Spotlight
Overview: In October 2017, KPMG Corporate Finance(1) (“KPMG CF”) acted as the
exclusive financial adviser to QSight IT Holding B.V. in its sale to Royal KPNN.V. (“KPN”).
QSight IT offers a breadth of managed security services including proactive24/7 cyber threat security monitoring services, operational securitymanagement and cloud consultancy.
KPN is a Dutch landline and mobile telecommunications company, operatingthrough consumer, business, wholesale, network, operations & informationtechnology, and other segments.
Engagement: KPMG CF provided exclusive and full scope M&A advisory services. KPMG CF
has been involved throughout the entire process, advising the managementand shareholders of QSight IT in every step towards the successful signingand closing of the deal. In particular, highlights include:• Thorough identification and approach of top tier strategic parties in North
America, Europe and Asia, utilizing our deep sector knowledge and stronginternational KPMG network to incorporate latest insights and directaccess to C-suite executives and key decision makers.
• Sophisticated deal marketing approach together with our internationalKPMG colleagues, educating management of potential buyers in an earlystage of the process.
• Focused selection of buyers for the second phase of the process takinginto account business and cultural aspects of the target.
• Competitive pressure until the very end of the process, resulting in a swiftexecution and optimal result.
October 2017
Acted as exclusive financial advisor to
on its sale to
Buyer Seller
November 2017
Acted as exclusive investment banking advisor to
on its sale to
Buyer Seller
Overview: In November 2017, KPMG Corporate Finance LLC (“KPMG CF”) acted as the
exclusive investment banking advisor to PRT on its sale to Drillinginfo, aportfolio company of Insight Venture Partners.
PRT is the industry leader in providing electricity load and price forecastingSoftware-as-a-Service (“SaaS”). PRT leverages proprietary adaptive machinelearning and AI technologies, yielding such accurate short-term, medium-termand long-term forecasts that it is considered the “gold standard” across theindustry.
Engagement: PRT retained KPMG CF as its exclusive investment banking advisor for the
transaction.
“The KPMG Corporate Finance team played an instrumental role in the sale ofPRT to Drillinginfo. They quickly gained a comprehensive understanding of ourbusiness and eloquently communicated the ‘PRT story’ driving a highlycompetitive process resulting in a valuation significantly exceeding our originalexpectations.”
-Al Khotanzad, Founder and President of PRT
A portfolio company of
(1) Represents the Corporate Finance practices of KPMG International’s network of independent member firms
©2018 KPMG Corporate Finance, a Delaware limited liability company. Member FINRA and SIPC. KPMG CorporateFinance is a subsidiary of KPMG LLP, a Delaware limited liability partnership and the U.S. member firm of the KPMGnetwork of independent member firms affiliated with KPMG International Cooperative (“KPMG International”), a Swiss entity.All rights reserved. NDPPS 640221
4
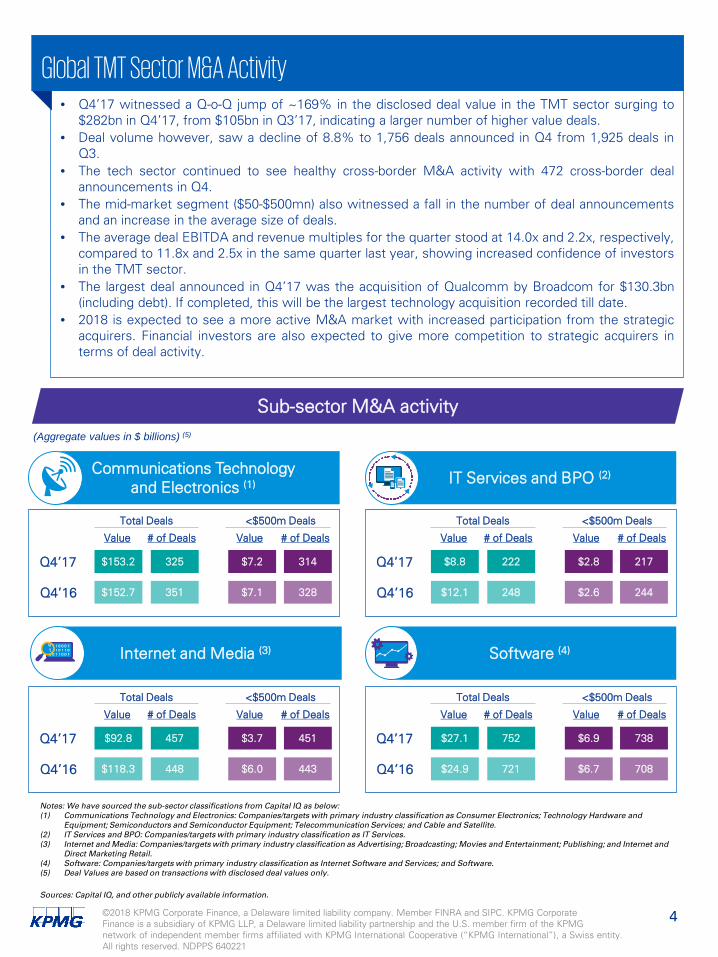
• Q4’17 witnessed a Q-o-Q jump of ~169% in the disclosed deal value in the TMT sector surging to$282bn in Q4’17, from $105bn in Q3’17, indicating a larger number of higher value deals.
• Deal volume however, saw a decline of 8.8% to 1,756 deals announced in Q4 from 1,925 deals inQ3.
• The tech sector continued to see healthy cross-border M&A activity with 472 cross-border dealannouncements in Q4.
• The mid-market segment ($50-$500mn) also witnessed a fall in the number of deal announcementsand an increase in the average size of deals.
• The average deal EBITDA and revenue multiples for the quarter stood at 14.0x and 2.2x, respectively,compared to 11.8x and 2.5x in the same quarter last year, showing increased confidence of investorsin the TMT sector.
• The largest deal announced in Q4’17 was the acquisition of Qualcomm by Broadcom for $130.3bn(including debt). If completed, this will be the largest technology acquisition recorded till date.
• 2018 is expected to see a more active M&A market with increased participation from the strategicacquirers. Financial investors are also expected to give more competition to strategic acquirers interms of deal activity.
Global TMT Sector M&A Activity
Sub-sector M&A activity
IT Services and BPO (2)
Internet and Media (3) Software (4)
Sources: Capital IQ, and other publicly available information.
Notes: We have sourced the sub-sector classifications from Capital IQ as below:(1) Communications Technology and Electronics: Companies/targets with primary industry classification as Consumer Electronics; Technology Hardware and
Equipment; Semiconductors and Semiconductor Equipment; Telecommunication Services; and Cable and Satellite.(2) IT Services and BPO: Companies/targets with primary industry classification as IT Services.(3) Internet and Media: Companies/targets with primary industry classification as Advertising; Broadcasting; Movies and Entertainment; Publishing; and Internet and
Direct Marketing Retail.(4) Software: Companies/targets with primary industry classification as Internet Software and Services; and Software.(5) Deal Values are based on transactions with disclosed deal values only.
(Aggregate values in $ billions) (5)
Value # of Deals Value
Q4’17 $153.2 325 $7.2 314
Q4’16
# of Deals
$152.7 351 $7.1 328
Total Deals <$500m Deals
Value # of Deals Value
Q4’17 $8.8 222 $2.8 217
Q4’16
# of Deals
$12.1 248 $2.6 244
Total Deals <$500m Deals
Value # of Deals Value
Q4’17 $92.8 457 $3.7 451
Q4’16
# of Deals
$118.3 448 $6.0 443
Total Deals <$500m Deals
Value # of Deals Value
Q4’17 $27.1 752 $6.9 738
Q4’16
# of Deals
$24.9 721 $6.7 708
Total Deals <$500m Deals
Communications Technology and Electronics (1)
©2018 KPMG Corporate Finance, a Delaware limited liability company. Member FINRA and SIPC. KPMG CorporateFinance is a subsidiary of KPMG LLP, a Delaware limited liability partnership and the U.S. member firm of the KPMGnetwork of independent member firms affiliated with KPMG International Cooperative (“KPMG International”), a Swiss entity.All rights reserved. NDPPS 640221
5
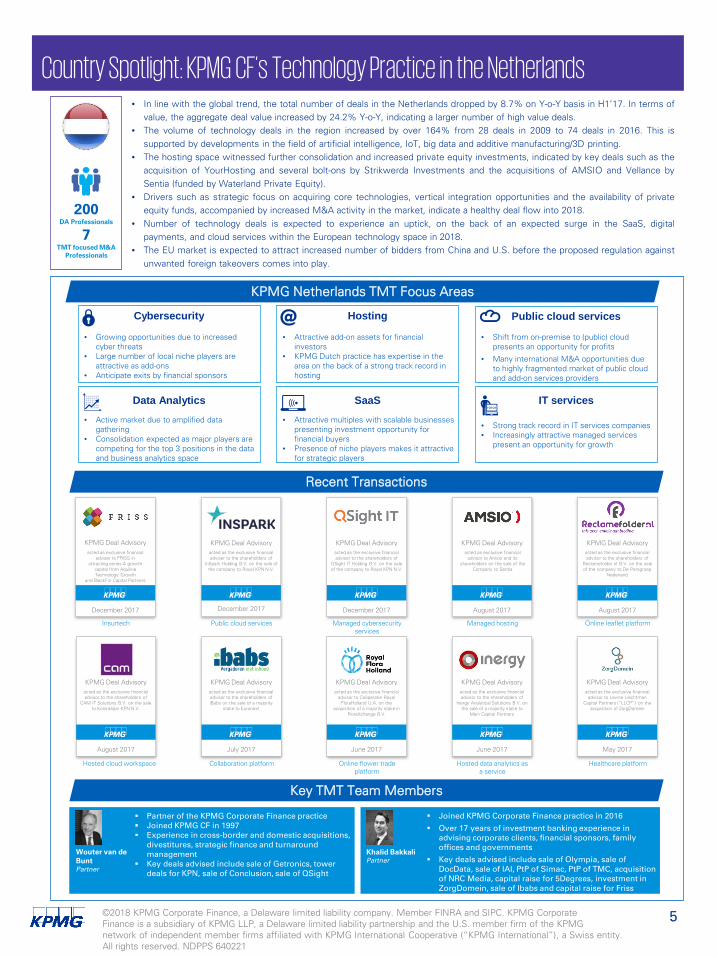
Country Spotlight: KPMG CF’s Technology Practice in the Netherlands
Recent Transactions
Key TMT Team Members
KPMG Netherlands TMT Focus Areas
• In line with the global trend, the total number of deals in the Netherlands dropped by 8.7% on Y-o-Y basis in H1’17. In terms ofvalue, the aggregate deal value increased by 24.2% Y-o-Y, indicating a larger number of high value deals.
• The volume of technology deals in the region increased by over 164% from 28 deals in 2009 to 74 deals in 2016. This issupported by developments in the field of artificial intelligence, IoT, big data and additive manufacturing/3D printing.
• The hosting space witnessed further consolidation and increased private equity investments, indicated by key deals such as theacquisition of YourHosting and several bolt-ons by Strikwerda Investments and the acquisitions of AMSIO and Vellance bySentia (funded by Waterland Private Equity).
• Drivers such as strategic focus on acquiring core technologies, vertical integration opportunities and the availability of privateequity funds, accompanied by increased M&A activity in the market, indicate a healthy deal flow into 2018.
• Number of technology deals is expected to experience an uptick, on the back of an expected surge in the SaaS, digitalpayments, and cloud services within the European technology space in 2018.
• The EU market is expected to attract increased number of bidders from China and U.S. before the proposed regulation againstunwanted foreign takeovers comes into play.
KPMG Deal Advisoryacted as the exclusive financial adviser to the shareholders of
QSight IT Holding B.V. on the sale of the company to Royal KPN N.V.
December 2017
KPMG Deal Advisoryacted as the exclusive financial adviser to the shareholders of
InSpark Holding B.V. on the sale of the company to Royal KPN N.V.
December 2017
KPMG Deal Advisoryacted as exclusive financial
advisor to Amsio and its shareholders on the sale of the
Company to Sentia
August 2017
KPMG Deal Advisoryacted as exclusive financial
adviser to FRISS in attracting series-A growth
capital from Aquiline Technology Growth
and BlackFin Capital Partners
December 2017
KPMG Deal Advisoryacted as the exclusive financial advisor to the shareholders of
Inergy Analytical Solutions B.V. on the sale of a majority stake to
Main Capital Partners
June 2017
KPMG Deal Advisoryacted as the exclusive financial
advisor to Coöperatie Royal FloraHolland U.A. on the
acquisition of a majority stake in FloraXchange B.V.
June 2017
KPMG Deal Advisoryacted as the exclusive financial advisor to the shareholders of iBabs on the sale of a majority
stake to Euronext
July 2017
KPMG Deal Advisoryacted as the exclusive financial advisor to the shareholders of
CAM IT Solutions B.V. on the sale to Koninklijke KPN N.V.
August 2017
KPMG Deal Advisoryacted as the exclusive financial
advisor to Levine LeichtmanCapital Partners (“LLCP”) on the
acquisition of ZorgDomein
May 2017
Hosting
• Attractive add-on assets for financial investors
• KPMG Dutch practice has expertise in the area on the back of a strong track record in hosting
Data Analytics• Active market due to amplified data
gathering• Consolidation expected as major players are
competing for the top 3 positions in the data and business analytics space
SaaS• Attractive multiples with scalable businesses
presenting investment opportunity for financial buyers
• Presence of niche players makes it attractive for strategic players
• Growing opportunities due to increased cyber threats
• Large number of local niche players are attractive as add-ons
• Anticipate exits by financial sponsors
Cybersecurity Public cloud services
• Shift from on-premise to (public) cloud presents an opportunity for profits
• Many international M&A opportunities due to highly fragmented market of public cloud and add-on services providers
IT services
• Strong track record in IT services companies• Increasingly attractive managed services
present an opportunity for growth
200DA Professionals
7TMT focused M&A
Professionals
Partner of the KPMG Corporate Finance practice Joined KPMG CF in 1997 Experience in cross-border and domestic acquisitions,
divestitures, strategic finance and turnaround management
Key deals advised include sale of Getronics, tower deals for KPN, sale of Conclusion, sale of QSight
Wouter van de BuntPartner
KPMG Deal Advisoryacted as the exclusive financial advisor to the shareholders of
Reclamefolder.nl B.V. on the sale of the company to De Persgroep
Nederland
August 2017
Joined KPMG Corporate Finance practice in 2016
Over 17 years of investment banking experience in advising corporate clients, financial sponsors, family offices and governments
Key deals advised include sale of Olympia, sale of DocData, sale of IAI, PtP of Simac, PtP of TMC, acquisition of NRC Media, capital raise for 5Degrees, investment in ZorgDomein, sale of Ibabs and capital raise for Friss
Khalid BakkaliPartner
Insurtech Public cloud services Managed cybersecurity services
Managed hosting Online leaflet platform
Healthcare platformHosted data analytics as a service
Online flower tradeplatform
Collaboration platformHosted cloud workspace

©2018 KPMG Corporate Finance, a Delaware limited liability company. Member FINRA and SIPC. KPMG CorporateFinance is a subsidiary of KPMG LLP, a Delaware limited liability partnership and the U.S. member firm of the KPMGnetwork of independent member firms affiliated with KPMG International Cooperative (“KPMG International”), a Swiss entity.All rights reserved. NDPPS 640221
6
95.1% 94.2% 94.4% 94.2% 95.4% 92.5% 93.1% 95.0% 95.0% 94.5% 94.3% 94.6%
4.9% 5.8% 5.6% 5.8% 4.6% 7.5% 6.9% 5.0% 5.0% 5.5% 5.7% 5.4%
0%
20%
40%
60%
80%
100%
Q1'15 Q2'15 Q3'15 Q4'15 Q1'16 Q2'16 Q3'16 Q4'16 Q1'17 Q2'17 Q3'17 Q4'17
Dea
l Vo
lum
e (%
)
Strategic Buyers Financial Buyers
$20 $23 $23 $26$19 $22
$15$19 $21 $19
$22$18
125 135 138
150
102
122
94
112 124 119
132
104
0
40
80
120
160
$0
$8
$16
$24
$32
$40
Q1'15 Q2'15 Q3'15 Q4'15 Q1'16 Q2'16 Q3'16 Q4'16 Q1'17 Q2'17 Q3'17 Q4'17
Deal V
olu
me
Dea
l Val
ue
($ b
n)
Deal Value ($ bn) Deal Volume
$125
$259
$122
$254
$61 $159 $155
$308
$86 $80 $105
$282
1,931 2,043 1,997 2,027 1,821 1,783 1,690
1,768 1,981 2,005 1,925 1,756
0
700
1,400
2,100
2,800
3,500
$0
$100
$200
$300
$400
$500
Q1'15 Q2'15 Q3'15 Q4'15 Q1'16 Q2'16 Q3'16 Q4'16 Q1'17 Q2'17 Q3'17 Q4'17
Deal V
olu
me
Dea
l Val
ue
($ b
n)
Deal Value ($ bn) Deal Volume
$116 $129 $138 $134 $137 $125 $131 $129 $137 $112 $134 $118Median ($ mm)
Global TMT M&A Trend: Q1’15 – Q4’17
Global TMT M&A Trend by Buyer Type: Q1’15 – Q4’17
Global TMT Mid-Market M&A Trend ($50-$500 mm) (1): Q1’15 – Q4’17
Source: Capital IQ.(1) Analysis is based on the deals with disclosed deal values only.
Q4’17Change (%) Deal Value # of DealsYoY (8.5%) (0.7%)
QoQ 168.8% (8.8%)

©2018 KPMG Corporate Finance, a Delaware limited liability company. Member FINRA and SIPC. KPMG CorporateFinance is a subsidiary of KPMG LLP, a Delaware limited liability partnership and the U.S. member firm of the KPMGnetwork of independent member firms affiliated with KPMG International Cooperative (“KPMG International”), a Swiss entity.All rights reserved. NDPPS 640221
7
Note: 1. PE deals include bolt-on acquisitions to existing portfolio companies.Source: Capital IQ
Top 10 Active Global TMT Strategic Buyers: 2017
Top 10 Active Global TMT Financial Buyers: 2017 (1)
Number of acquisitions in the period
20 2019
16
1211 11
10 10 10
ConstellationSoftware
Accenture Dentsu WPP TeliaCompany
Wisetech Alphabet Vivendi Microsoft Liberty Global
Number of acquisitions in the period
7
6 6
5 5 5 5
4 4
3
Thoma Bravo Blackstone EQT Partners Vista EquityPartners
Apax Partners InsightVenturePartners
Marlin EquityPartners
Main CapitalPartners
H.I.G. CapitalPartners
InvestcorpBank B.S.C.
©2018 KPMG Corporate Finance, a Delaware limited liability company. Member FINRA and SIPC. KPMG CorporateFinance is a subsidiary of KPMG LLP, a Delaware limited liability partnership and the U.S. member firm of the KPMGnetwork of independent member firms affiliated with KPMG International Cooperative (“KPMG International”), a Swiss entity.All rights reserved. NDPPS 640221
8
+7.4%
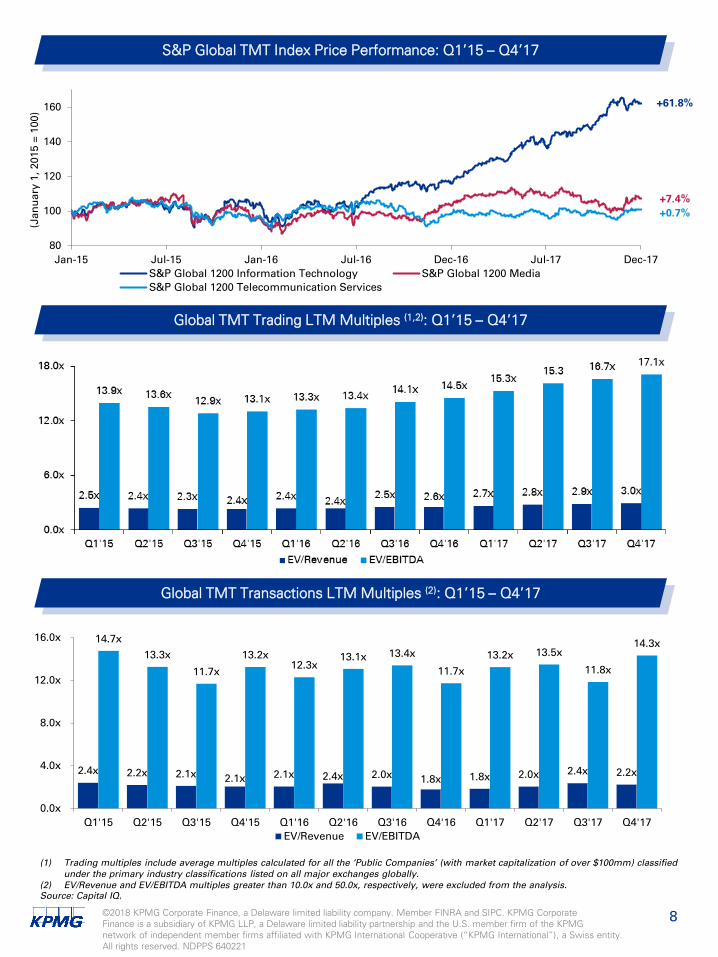
S&P Global TMT Index Price Performance: Q1’15 – Q4’17
Global TMT Trading LTM Multiples (1,2): Q1’15 – Q4’17
Global TMT Transactions LTM Multiples (2): Q1’15 – Q4’17
Source: Capital IQ.
(1) Trading multiples include average multiples calculated for all the ‘Public Companies’ (with market capitalization of over $100mm) classified under the primary industry classifications listed on all major exchanges globally.
(2) EV/Revenue and EV/EBITDA multiples greater than 10.0x and 50.0x, respectively, were excluded from the analysis.
+61.8%
+0.7%
2.4x 2.2x 2.1x 2.1x 2.1x 2.4x 2.0x 1.8x 1.8x 2.0x 2.4x 2.2x
14.7x 13.3x
11.7x
13.2x 12.3x
13.1x 13.4x
11.7x 13.2x 13.5x
11.8x
14.3x
0.0x
4.0x
8.0x
12.0x
16.0x
Q1'15 Q2'15 Q3'15 Q4'15 Q1'16 Q2'16 Q3'16 Q4'16 Q1'17 Q2'17 Q3'17 Q4'17EV/Revenue EV/EBITDA
80
100
120
140
160
Jan-15 Jul-15 Jan-16 Jul-16 Dec-16 Jul-17 Dec-17
(Jan
uar
y 1,
201
5 =
100)
S&P Global 1200 Information Technology S&P Global 1200 MediaS&P Global 1200 Telecommunication Services
©2018 KPMG Corporate Finance, a Delaware limited liability company. Member FINRA and SIPC. KPMG CorporateFinance is a subsidiary of KPMG LLP, a Delaware limited liability partnership and the U.S. member firm of the KPMGnetwork of independent member firms affiliated with KPMG International Cooperative (“KPMG International”), a Swiss entity.All rights reserved. NDPPS 640221
9
Market Data Operating Metrics Valuation Multiples$ value millions, except per share
LatestQuarterEnding
SharePrice
% of 52Week High
Market Cap. (1)
EnterpriseValue (2)
Revenue Revenue Growth (3)LTM
GrossLTM
EBITDA EV / Revenue EV / EBITDA
Company Name LTM 2018E 2019E 2017 – 2018E 2018E – 2019E Margin% Margin% LTM 2018E 2019E LTM 2018E 2019E
Communication Services
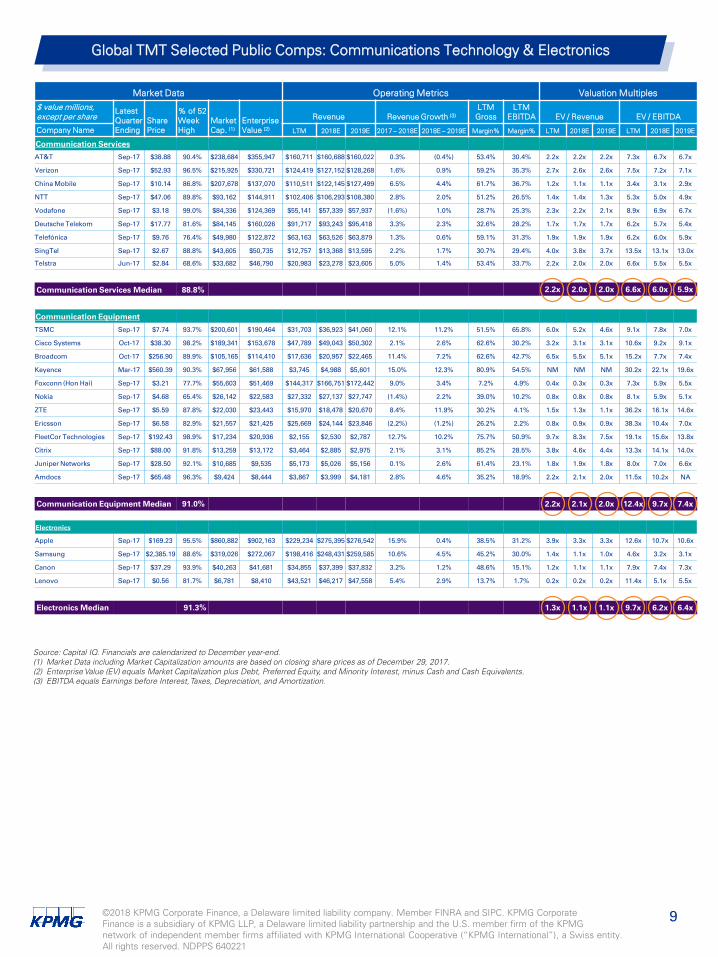
AT&T Sep-17 $38.88 90.4% $238,684 $355,947 $160,711 $160,688 $160,022 0.3% (0.4%) 53.4% 30.4% 2.2x 2.2x 2.2x 7.3x 6.7x 6.7x
Verizon Sep-17 $52.93 96.5% $215,925 $330,721 $124,419 $127,152 $128,268 1.6% 0.9% 59.2% 35.3% 2.7x 2.6x 2.6x 7.5x 7.2x 7.1x
China Mobile Sep-17 $10.14 86.8% $207,678 $137,070 $110,511 $122,145 $127,499 6.5% 4.4% 61.7% 36.7% 1.2x 1.1x 1.1x 3.4x 3.1x 2.9x
NTT Sep-17 $47.06 89.8% $93,162 $144,911 $102,406 $106,293 $108,380 2.8% 2.0% 51.2% 26.5% 1.4x 1.4x 1.3x 5.3x 5.0x 4.9x
Vodafone Sep-17 $3.18 99.0% $84,336 $124,369 $55,141 $57,339 $57,937 (1.6%) 1.0% 28.7% 25.3% 2.3x 2.2x 2.1x 8.9x 6.9x 6.7x
Deutsche Telekom Sep-17 $17.77 81.6% $84,145 $160,026 $91,717 $93,243 $95,418 3.3% 2.3% 32.6% 28.2% 1.7x 1.7x 1.7x 6.2x 5.7x 5.4x
Telefónica Sep-17 $9.76 76.4% $49,980 $122,872 $63,163 $63,526 $63,879 1.3% 0.6% 59.1% 31.3% 1.9x 1.9x 1.9x 6.2x 6.0x 5.9x
SingTel Sep-17 $2.67 88.8% $43,605 $50,735 $12,757 $13,368 $13,595 2.2% 1.7% 30.7% 29.4% 4.0x 3.8x 3.7x 13.5x 13.1x 13.0x
Telstra Jun-17 $2.84 68.6% $33,682 $46,790 $20,983 $23,278 $23,605 5.0% 1.4% 53.4% 33.7% 2.2x 2.0x 2.0x 6.6x 5.5x 5.5x
Communication Services Median 88.8% 2.2x 2.0x 2.0x 6.6x 6.0x 5.9x
Communication Equipment
TSMC Sep-17 $7.74 93.7% $200,601 $190,464 $31,703 $36,923 $41,060 12.1% 11.2% 51.5% 65.8% 6.0x 5.2x 4.6x 9.1x 7.8x 7.0x
Cisco Systems Oct-17 $38.30 98.2% $189,341 $153,678 $47,789 $49,043 $50,302 2.1% 2.6% 62.6% 30.2% 3.2x 3.1x 3.1x 10.6x 9.2x 9.1x
Broadcom Oct-17 $256.90 89.9% $105,165 $114,410 $17,636 $20,957 $22,465 11.4% 7.2% 62.6% 42.7% 6.5x 5.5x 5.1x 15.2x 7.7x 7.4x
Keyence Mar-17 $560.39 90.3% $67,956 $61,588 $3,745 $4,988 $5,601 15.0% 12.3% 80.9% 54.5% NM NM NM 30.2x 22.1x 19.6x
Foxconn (Hon Hai) Sep-17 $3.21 77.7% $55,603 $51,469 $144,317 $166,751 $172,442 9.0% 3.4% 7.2% 4.9% 0.4x 0.3x 0.3x 7.3x 5.9x 5.5x
Nokia Sep-17 $4.68 65.4% $26,142 $22,583 $27,332 $27,137 $27,747 (1.4%) 2.2% 39.0% 10.2% 0.8x 0.8x 0.8x 8.1x 5.9x 5.1x
ZTE Sep-17 $5.59 87.8% $22,030 $23,443 $15,970 $18,478 $20,670 8.4% 11.9% 30.2% 4.1% 1.5x 1.3x 1.1x 36.2x 16.1x 14.6x
Ericsson Sep-17 $6.58 82.9% $21,557 $21,425 $25,669 $24,144 $23,846 (2.2%) (1.2%) 26.2% 2.2% 0.8x 0.9x 0.9x 38.3x 10.4x 7.0x
FleetCor Technologies Sep-17 $192.43 98.9% $17,234 $20,936 $2,155 $2,530 $2,787 12.7% 10.2% 75.7% 50.9% 9.7x 8.3x 7.5x 19.1x 15.6x 13.8x
Citrix Sep-17 $88.00 91.8% $13,259 $13,172 $3,464 $2,885 $2,975 2.1% 3.1% 85.2% 28.5% 3.8x 4.6x 4.4x 13.3x 14.1x 14.0x
Juniper Networks Sep-17 $28.50 92.1% $10,685 $9,535 $5,173 $5,026 $5,156 0.1% 2.6% 61.4% 23.1% 1.8x 1.9x 1.8x 8.0x 7.0x 6.6x
Amdocs Sep-17 $65.48 96.3% $9,424 $8,444 $3,867 $3,999 $4,181 2.8% 4.6% 35.2% 18.9% 2.2x 2.1x 2.0x 11.5x 10.2x NA
Communication Equipment Median 91.0% 2.2x 2.1x 2.0x 12.4x 9.7x 7.4x
Electronics
Apple Sep-17 $169.23 95.5% $860,882 $902,163 $229,234 $275,395 $276,542 15.9% 0.4% 38.5% 31.2% 3.9x 3.3x 3.3x 12.6x 10.7x 10.6x
Samsung Sep-17 $2,385.19 88.6% $319,026 $272,067 $198,416 $248,431 $259,585 10.6% 4.5% 45.2% 30.0% 1.4x 1.1x 1.0x 4.6x 3.2x 3.1x
Canon Sep-17 $37.29 93.9% $40,263 $41,681 $34,855 $37,399 $37,832 3.2% 1.2% 48.6% 15.1% 1.2x 1.1x 1.1x 7.9x 7.4x 7.3x
Lenovo Sep-17 $0.56 81.7% $6,781 $8,410 $43,521 $46,217 $47,558 5.4% 2.9% 13.7% 1.7% 0.2x 0.2x 0.2x 11.4x 5.1x 5.5x
Electronics Median 91.3% 1.3x 1.1x 1.1x 9.7x 6.2x 6.4x
Global TMT Selected Public Comps: Communications Technology & Electronics
Source: Capital IQ. Financials are calendarized to December year-end.(1) Market Data including Market Capitalization amounts are based on closing share prices as of December 29, 2017.(2) Enterprise Value (EV) equals Market Capitalization plus Debt, Preferred Equity, and Minority Interest, minus Cash and Cash Equivalents.(3) EBITDA equals Earnings before Interest,Taxes, Depreciation, and Amortization.

©2018 KPMG Corporate Finance, a Delaware limited liability company. Member FINRA and SIPC. KPMG CorporateFinance is a subsidiary of KPMG LLP, a Delaware limited liability partnership and the U.S. member firm of the KPMGnetwork of independent member firms affiliated with KPMG International Cooperative (“KPMG International”), a Swiss entity.All rights reserved. NDPPS 640221
10
Source: 451research.
Announced Date Target Name Target Country Acquirer Name Deal Value
($ mm)EV /
RevenueEV /
EBITDA
27-Dec-2017 AvanStrate [Carlyle Group] Japan Cairn India Holdings [Vedanta] $158.0 0.9x 2.1x
26-Dec-2017 CPS Comunicaciones SA Argentina Riverwood Capital / Blackstone Group $190.0 - -
21-Dec-2017 Themis Computer U.S. Mercury Systems $180.0 - -
21-Dec-2017 UPC Austria [Liberty Global] Austria T-Mobile Austria [Deutsche Telekom] $2,244.3 6.4x 9.5x
15-Dec-2017 Tele2 Nederland BV Netherlands T-Mobile Netherlands BV [Deutsche Telekom] $223.5 - -
11-Dec-2017 3M (communication markets division) U.S. Corning $900.0 2.3x -
07-Dec-2017 Sigma Designs U.S. Silicon Laboratories $282.0 1.8x -
04-Dec-2017 General Cable Corporation U.S. Prysmian Group $1,552.6 0.8x -
03-Dec-2017 Anaren [Veritas Capital] U.S. TTM Technologies $775.0 3.5x -
27-Nov-2017 Spread Networks U.S. Zayo Group Holdings $127.0 - -
20-Nov-2017 Cavium U.S. Marvell Technology Group $5,973.9 6.8x 50.4x
12-Nov-2017 Idea Cellular (tower assets) India American Tower Corporation $1,200.0 - -
09-Nov-2017 AOPEN U.S. Acer $13.9 - -
09-Nov-2017 magicJack VocalTec Israel B. Riley Financial $143.0 1.5x -
08-Nov-2017 Sonian U.S. Barracuda Networks $50.0 2.5x -
07-Nov-2017 Peak Games (mobile card game assets) Turkey Zynga $100.0 - -
02-Nov-2017 Fujitsu Client Computing Japan Lenovo Group $157.4 0.1x -
02-Nov-2017 VeloCloud Networks U.S. VMware $525.0 - -
31-Oct-2017 KIO Networks (infrastructure assets) Mexico American Tower Corporation $500.0 - -
26-Oct-2017 Gigamon U.S. Elliott Management $1,600.0 5.3x NM
26-Oct-2017Vectron International (timing business assets) [Knowles Corporation]
U.S. Microsemi Corporation $130.0 - -
25-Oct-2017 SkyGiraffe U.S. ServiceNow $32.0 - -
23-Oct-2017 BroadSoft U.S. Cisco Systems $1,737.1 5.4x NM
23-Oct-2017 TempAlert U.S. Digi International $45.0 - -
18-Oct-2017 Cogeon Germany Chegg $15.0 - -
13-Oct-2017 NOORSAT W.L.L. Bahrain Eutelsat Communications $75.0 - -
05-Oct-2017 Silego Technology U.S. Dialog Semiconductor $276.0 - -
03-Oct-2017
Brocade Communications Systems (datacenter switching, routing, and analytics business)
U.S. Extreme Networks $43.0 - -
03-Oct-2017 Transbeam U.S. GTT Communications $28.0 - -
02-Oct-2017 Blue Tree Systems Ireland ORBCOMM $36.8 - -
(1) Top M&A transactions on the basis of disclosed deal value in Q4’17.
Global TMT Selected Transactions (1): Communications Technology & Electronics
©2018 KPMG Corporate Finance, a Delaware limited liability company. Member FINRA and SIPC. KPMG CorporateFinance is a subsidiary of KPMG LLP, a Delaware limited liability partnership and the U.S. member firm of the KPMGnetwork of independent member firms affiliated with KPMG International Cooperative (“KPMG International”), a Swiss entity.All rights reserved. NDPPS 640221
11
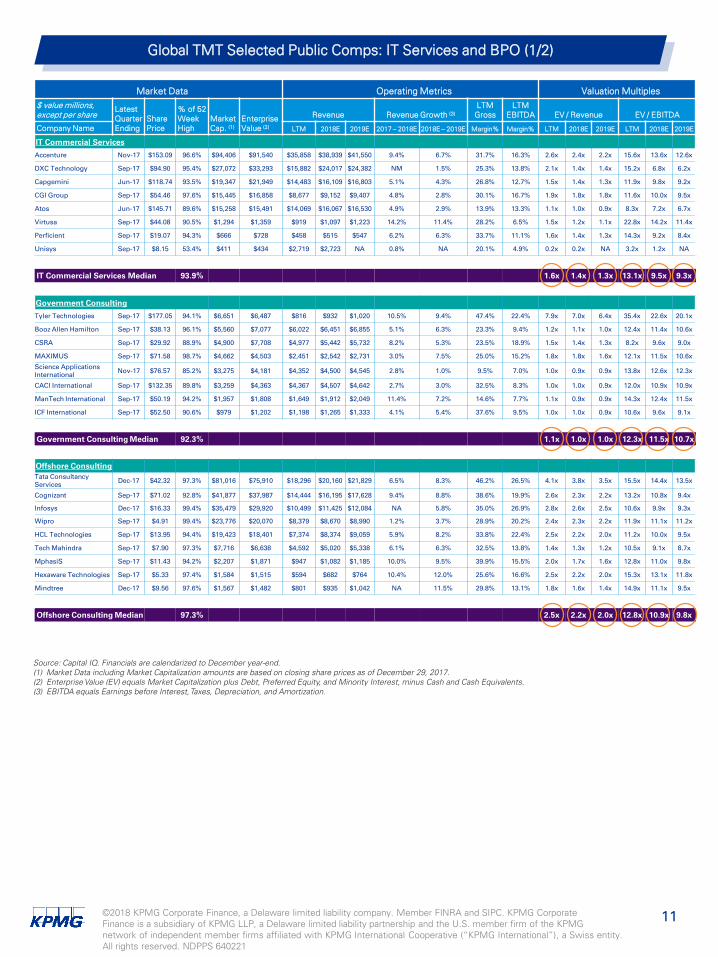
Global TMT Selected Public Comps: IT Services and BPO (1/2)
Market Data Operating Metrics Valuation Multiples$ value millions, except per share
LatestQuarterEnding
SharePrice
% of 52Week High
Market Cap. (1)
EnterpriseValue (2)
Revenue Revenue Growth (3)LTM
GrossLTM
EBITDA EV / Revenue EV / EBITDA
Company Name LTM 2018E 2019E 2017 – 2018E 2018E – 2019E Margin% Margin% LTM 2018E 2019E LTM 2018E 2019E
IT Commercial Services
Accenture Nov-17 $153.09 96.6% $94,406 $91,540 $35,858 $38,939 $41,550 9.4% 6.7% 31.7% 16.3% 2.6x 2.4x 2.2x 15.6x 13.6x 12.6x
DXC Technology Sep-17 $94.90 95.4% $27,072 $33,293 $15,882 $24,017 $24,382 NM 1.5% 25.3% 13.8% 2.1x 1.4x 1.4x 15.2x 6.8x 6.2x
Capgemini Jun-17 $118.74 93.5% $19,347 $21,949 $14,483 $16,109 $16,803 5.1% 4.3% 26.8% 12.7% 1.5x 1.4x 1.3x 11.9x 9.8x 9.2x
CGI Group Sep-17 $54.46 97.6% $15,445 $16,858 $8,677 $9,152 $9,407 4.8% 2.8% 30.1% 16.7% 1.9x 1.8x 1.8x 11.6x 10.0x 9.5x
Atos Jun-17 $145.71 89.6% $15,258 $15,491 $14,069 $16,067 $16,530 4.9% 2.9% 13.9% 13.3% 1.1x 1.0x 0.9x 8.3x 7.2x 6.7x
Virtusa Sep-17 $44.08 90.5% $1,294 $1,359 $919 $1,097 $1,223 14.2% 11.4% 28.2% 6.5% 1.5x 1.2x 1.1x 22.8x 14.2x 11.4x
Perficient Sep-17 $19.07 94.3% $666 $728 $458 $515 $547 6.2% 6.3% 33.7% 11.1% 1.6x 1.4x 1.3x 14.3x 9.2x 8.4x
Unisys Sep-17 $8.15 53.4% $411 $434 $2,719 $2,723 NA 0.8% NA 20.1% 4.9% 0.2x 0.2x NA 3.2x 1.2x NA
IT Commercial Services Median 93.9% 1.6x 1.4x 1.3x 13.1x 9.5x 9.3x
Government Consulting
Tyler Technologies Sep-17 $177.05 94.1% $6,651 $6,487 $816 $932 $1,020 10.5% 9.4% 47.4% 22.4% 7.9x 7.0x 6.4x 35.4x 22.6x 20.1x
Booz Allen Hamilton Sep-17 $38.13 96.1% $5,560 $7,077 $6,022 $6,451 $6,855 5.1% 6.3% 23.3% 9.4% 1.2x 1.1x 1.0x 12.4x 11.4x 10.6x
CSRA Sep-17 $29.92 88.9% $4,900 $7,708 $4,977 $5,442 $5,732 8.2% 5.3% 23.5% 18.9% 1.5x 1.4x 1.3x 8.2x 9.6x 9.0x
MAXIMUS Sep-17 $71.58 98.7% $4,662 $4,503 $2,451 $2,542 $2,731 3.0% 7.5% 25.0% 15.2% 1.8x 1.8x 1.6x 12.1x 11.5x 10.6x
Science Applications International Nov-17 $76.57 85.2% $3,275 $4,181 $4,352 $4,500 $4,545 2.8% 1.0% 9.5% 7.0% 1.0x 0.9x 0.9x 13.8x 12.6x 12.3x
CACI International Sep-17 $132.35 89.8% $3,259 $4,363 $4,367 $4,507 $4,642 2.7% 3.0% 32.5% 8.3% 1.0x 1.0x 0.9x 12.0x 10.9x 10.9x
ManTech International Sep-17 $50.19 94.2% $1,957 $1,808 $1,649 $1,912 $2,049 11.4% 7.2% 14.6% 7.7% 1.1x 0.9x 0.9x 14.3x 12.4x 11.5x
ICF International Sep-17 $52.50 90.6% $979 $1,202 $1,198 $1,265 $1,333 4.1% 5.4% 37.6% 9.5% 1.0x 1.0x 0.9x 10.6x 9.6x 9.1x
Government Consulting Median 92.3% 1.1x 1.0x 1.0x 12.3x 11.5x 10.7x
Offshore ConsultingTata Consultancy Services Dec-17 $42.32 97.3% $81,016 $75,910 $18,296 $20,160 $21,829 6.5% 8.3% 46.2% 26.5% 4.1x 3.8x 3.5x 15.5x 14.4x 13.5x
Cognizant Sep-17 $71.02 92.8% $41,877 $37,987 $14,444 $16,195 $17,628 9.4% 8.8% 38.6% 19.9% 2.6x 2.3x 2.2x 13.2x 10.8x 9.4x
Infosys Dec-17 $16.33 99.4% $35,479 $29,920 $10,499 $11,425 $12,084 NA 5.8% 35.0% 26.9% 2.8x 2.6x 2.5x 10.6x 9.9x 9.3x
Wipro Sep-17 $4.91 99.4% $23,776 $20,070 $8,379 $8,670 $8,990 1.2% 3.7% 28.9% 20.2% 2.4x 2.3x 2.2x 11.9x 11.1x 11.2x
HCL Technologies Sep-17 $13.95 94.4% $19,423 $18,401 $7,374 $8,374 $9,059 5.9% 8.2% 33.8% 22.4% 2.5x 2.2x 2.0x 11.2x 10.0x 9.5x
Tech Mahindra Sep-17 $7.90 97.3% $7,716 $6,638 $4,592 $5,020 $5,338 6.1% 6.3% 32.5% 13.8% 1.4x 1.3x 1.2x 10.5x 9.1x 8.7x
MphasiS Sep-17 $11.43 94.2% $2,207 $1,871 $947 $1,082 $1,185 10.0% 9.5% 39.9% 15.5% 2.0x 1.7x 1.6x 12.8x 11.0x 9.8x
Hexaware Technologies Sep-17 $5.33 97.4% $1,584 $1,515 $594 $682 $764 10.4% 12.0% 25.6% 16.6% 2.5x 2.2x 2.0x 15.3x 13.1x 11.8x
Mindtree Dec-17 $9.56 97.6% $1,567 $1,482 $801 $935 $1,042 NA 11.5% 29.8% 13.1% 1.8x 1.6x 1.4x 14.9x 11.1x 9.5x
Offshore Consulting Median 97.3% 2.5x 2.2x 2.0x 12.8x 10.9x 9.8x
Source: Capital IQ. Financials are calendarized to December year-end.(1) Market Data including Market Capitalization amounts are based on closing share prices as of December 29, 2017.(2) Enterprise Value (EV) equals Market Capitalization plus Debt, Preferred Equity, and Minority Interest, minus Cash and Cash Equivalents.(3) EBITDA equals Earnings before Interest,Taxes, Depreciation, and Amortization.
©2018 KPMG Corporate Finance, a Delaware limited liability company. Member FINRA and SIPC. KPMG CorporateFinance is a subsidiary of KPMG LLP, a Delaware limited liability partnership and the U.S. member firm of the KPMGnetwork of independent member firms affiliated with KPMG International Cooperative (“KPMG International”), a Swiss entity.All rights reserved. NDPPS 640221
12
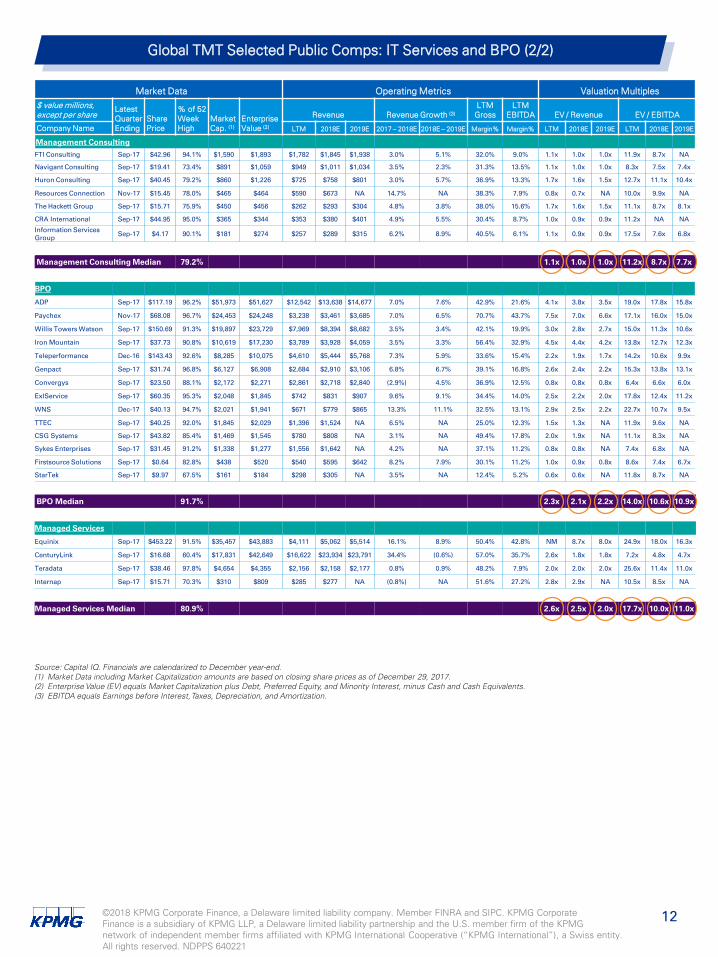
Global TMT Selected Public Comps: IT Services and BPO (2/2)
Market Data Operating Metrics Valuation Multiples$ value millions, except per share
LatestQuarterEnding
SharePrice
% of 52Week High
Market Cap. (1)
EnterpriseValue (2)
Revenue Revenue Growth (3)LTM
GrossLTM
EBITDA EV / Revenue EV / EBITDA
Company Name LTM 2018E 2019E 2017 – 2018E 2018E – 2019E Margin% Margin% LTM 2018E 2019E LTM 2018E 2019E
Management ConsultingFTI Consulting Sep-17 $42.96 94.1% $1,590 $1,893 $1,782 $1,845 $1,938 3.0% 5.1% 32.0% 9.0% 1.1x 1.0x 1.0x 11.9x 8.7x NA
Navigant Consulting Sep-17 $19.41 73.4% $891 $1,059 $949 $1,011 $1,034 3.5% 2.3% 31.3% 13.5% 1.1x 1.0x 1.0x 8.3x 7.5x 7.4x
Huron Consulting Sep-17 $40.45 79.2% $860 $1,226 $725 $758 $801 3.0% 5.7% 36.9% 13.3% 1.7x 1.6x 1.5x 12.7x 11.1x 10.4x
Resources Connection Nov-17 $15.45 78.0% $465 $464 $590 $673 NA 14.7% NA 38.3% 7.9% 0.8x 0.7x NA 10.0x 9.9x NA
The Hackett Group Sep-17 $15.71 75.9% $450 $456 $262 $293 $304 4.8% 3.8% 38.0% 15.6% 1.7x 1.6x 1.5x 11.1x 8.7x 8.1x
CRA International Sep-17 $44.95 95.0% $365 $344 $353 $380 $401 4.9% 5.5% 30.4% 8.7% 1.0x 0.9x 0.9x 11.2x NA NA
Information Services Group Sep-17 $4.17 90.1% $181 $274 $257 $289 $315 6.2% 8.9% 40.5% 6.1% 1.1x 0.9x 0.9x 17.5x 7.6x 6.8x
Management Consulting Median 79.2% 1.1x 1.0x 1.0x 11.2x 8.7x 7.7x
BPO
ADP Sep-17 $117.19 96.2% $51,973 $51,627 $12,542 $13,638 $14,677 7.0% 7.6% 42.9% 21.6% 4.1x 3.8x 3.5x 19.0x 17.8x 15.8x
Paychex Nov-17 $68.08 96.7% $24,453 $24,248 $3,238 $3,461 $3,685 7.0% 6.5% 70.7% 43.7% 7.5x 7.0x 6.6x 17.1x 16.0x 15.0x
Willis Towers Watson Sep-17 $150.69 91.3% $19,897 $23,729 $7,969 $8,394 $8,682 3.5% 3.4% 42.1% 19.9% 3.0x 2.8x 2.7x 15.0x 11.3x 10.6x
Iron Mountain Sep-17 $37.73 90.8% $10,619 $17,230 $3,789 $3,928 $4,059 3.5% 3.3% 56.4% 32.9% 4.5x 4.4x 4.2x 13.8x 12.7x 12.3x
Teleperformance Dec-16 $143.43 92.6% $8,285 $10,075 $4,610 $5,444 $5,768 7.3% 5.9% 33.6% 15.4% 2.2x 1.9x 1.7x 14.2x 10.6x 9.9x
Genpact Sep-17 $31.74 96.8% $6,127 $6,908 $2,684 $2,910 $3,106 6.8% 6.7% 39.1% 16.8% 2.6x 2.4x 2.2x 15.3x 13.8x 13.1x
Convergys Sep-17 $23.50 88.1% $2,172 $2,271 $2,861 $2,718 $2,840 (2.9%) 4.5% 36.9% 12.5% 0.8x 0.8x 0.8x 6.4x 6.6x 6.0x
ExlService Sep-17 $60.35 95.3% $2,048 $1,845 $742 $831 $907 9.6% 9.1% 34.4% 14.0% 2.5x 2.2x 2.0x 17.8x 12.4x 11.2x
WNS Dec-17 $40.13 94.7% $2,021 $1,941 $671 $779 $865 13.3% 11.1% 32.5% 13.1% 2.9x 2.5x 2.2x 22.7x 10.7x 9.5x
TTEC Sep-17 $40.25 92.0% $1,845 $2,029 $1,396 $1,524 NA 6.5% NA 25.0% 12.3% 1.5x 1.3x NA 11.9x 9.6x NA
CSG Systems Sep-17 $43.82 85.4% $1,469 $1,545 $780 $808 NA 3.1% NA 49.4% 17.8% 2.0x 1.9x NA 11.1x 8.3x NA
Sykes Enterprises Sep-17 $31.45 91.2% $1,338 $1,277 $1,556 $1,642 NA 4.2% NA 37.1% 11.2% 0.8x 0.8x NA 7.4x 6.8x NA
Firstsource Solutions Sep-17 $0.64 82.8% $438 $520 $540 $595 $642 8.2% 7.9% 30.1% 11.2% 1.0x 0.9x 0.8x 8.6x 7.4x 6.7x
StarTek Sep-17 $9.97 67.5% $161 $184 $298 $305 NA 3.5% NA 12.4% 5.2% 0.6x 0.6x NA 11.8x 8.7x NA
BPO Median 91.7% 2.3x 2.1x 2.2x 14.0x 10.6x 10.9x
Managed Services
Equinix Sep-17 $453.22 91.5% $35,457 $43,883 $4,111 $5,062 $5,514 16.1% 8.9% 50.4% 42.8% NM 8.7x 8.0x 24.9x 18.0x 16.3x
CenturyLink Sep-17 $16.68 60.4% $17,831 $42,649 $16,622 $23,934 $23,791 34.4% (0.6%) 57.0% 35.7% 2.6x 1.8x 1.8x 7.2x 4.8x 4.7x
Teradata Sep-17 $38.46 97.8% $4,654 $4,355 $2,156 $2,158 $2,177 0.8% 0.9% 48.2% 7.9% 2.0x 2.0x 2.0x 25.6x 11.4x 11.0x
Internap Sep-17 $15.71 70.3% $310 $809 $285 $277 NA (0.8%) NA 51.6% 27.2% 2.8x 2.9x NA 10.5x 8.5x NA
Managed Services Median 80.9% 2.6x 2.5x 2.0x 17.7x 10.0x 11.0x
Source: Capital IQ. Financials are calendarized to December year-end.(1) Market Data including Market Capitalization amounts are based on closing share prices as of December 29, 2017.(2) Enterprise Value (EV) equals Market Capitalization plus Debt, Preferred Equity, and Minority Interest, minus Cash and Cash Equivalents.(3) EBITDA equals Earnings before Interest,Taxes, Depreciation, and Amortization.
©2018 KPMG Corporate Finance, a Delaware limited liability company. Member FINRA and SIPC. KPMG CorporateFinance is a subsidiary of KPMG LLP, a Delaware limited liability partnership and the U.S. member firm of the KPMGnetwork of independent member firms affiliated with KPMG International Cooperative (“KPMG International”), a Swiss entity.All rights reserved. NDPPS 640221
13
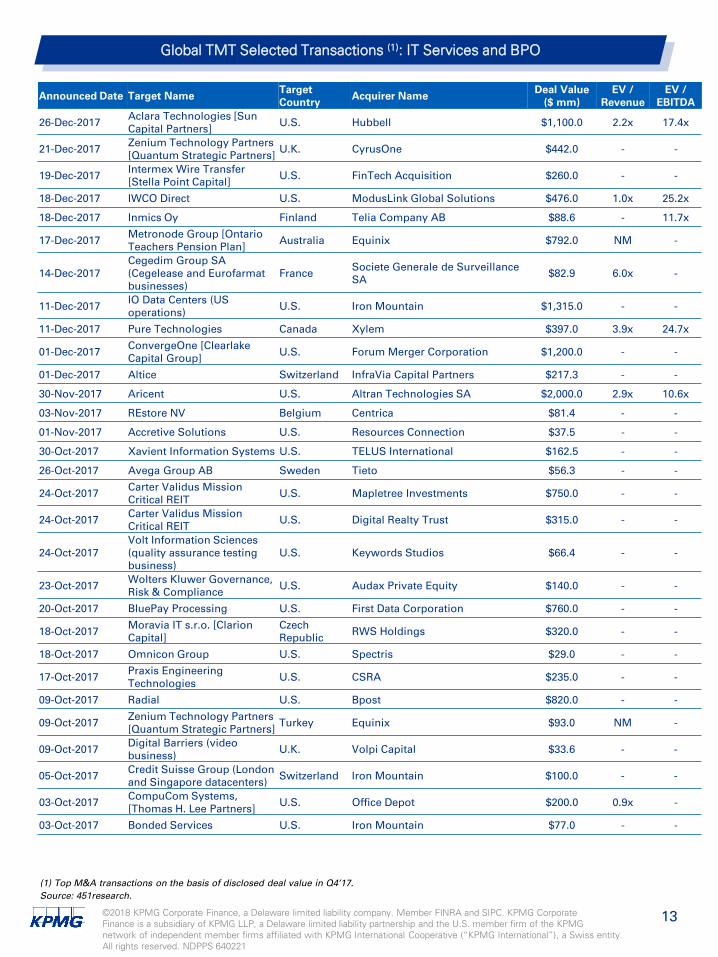
Global TMT Selected Transactions (1): IT Services and BPO
Source: 451research.
Announced Date Target Name Target Country Acquirer Name Deal Value
($ mm)EV /
RevenueEV /
EBITDA
26-Dec-2017 Aclara Technologies [Sun Capital Partners] U.S. Hubbell $1,100.0 2.2x 17.4x
21-Dec-2017 Zenium Technology Partners [Quantum Strategic Partners] U.K. CyrusOne $442.0 - -
19-Dec-2017 Intermex Wire Transfer [Stella Point Capital] U.S. FinTech Acquisition $260.0 - -
18-Dec-2017 IWCO Direct U.S. ModusLink Global Solutions $476.0 1.0x 25.2x
18-Dec-2017 Inmics Oy Finland Telia Company AB $88.6 - 11.7x
17-Dec-2017 Metronode Group [Ontario Teachers Pension Plan] Australia Equinix $792.0 NM -
14-Dec-2017Cegedim Group SA (Cegelease and Eurofarmatbusinesses)
France Societe Generale de Surveillance SA $82.9 6.0x -
11-Dec-2017 IO Data Centers (US operations) U.S. Iron Mountain $1,315.0 - -
11-Dec-2017 Pure Technologies Canada Xylem $397.0 3.9x 24.7x
01-Dec-2017 ConvergeOne [Clearlake Capital Group] U.S. Forum Merger Corporation $1,200.0 - -
01-Dec-2017 Altice Switzerland InfraVia Capital Partners $217.3 - -
30-Nov-2017 Aricent U.S. Altran Technologies SA $2,000.0 2.9x 10.6x
03-Nov-2017 REstore NV Belgium Centrica $81.4 - -
01-Nov-2017 Accretive Solutions U.S. Resources Connection $37.5 - -
30-Oct-2017 Xavient Information Systems U.S. TELUS International $162.5 - -
26-Oct-2017 Avega Group AB Sweden Tieto $56.3 - -
24-Oct-2017 Carter Validus Mission Critical REIT U.S. Mapletree Investments $750.0 - -
24-Oct-2017 Carter Validus Mission Critical REIT U.S. Digital Realty Trust $315.0 - -
24-Oct-2017Volt Information Sciences (quality assurance testing business)
U.S. Keywords Studios $66.4 - -
23-Oct-2017 Wolters Kluwer Governance, Risk & Compliance U.S. Audax Private Equity $140.0 - -
20-Oct-2017 BluePay Processing U.S. First Data Corporation $760.0 - -
18-Oct-2017 Moravia IT s.r.o. [Clarion Capital]
Czech Republic RWS Holdings $320.0 - -
18-Oct-2017 Omnicon Group U.S. Spectris $29.0 - -
17-Oct-2017 Praxis Engineering Technologies U.S. CSRA $235.0 - -
09-Oct-2017 Radial U.S. Bpost $820.0 - -
09-Oct-2017 Zenium Technology Partners [Quantum Strategic Partners] Turkey Equinix $93.0 NM -
09-Oct-2017 Digital Barriers (video business) U.K. Volpi Capital $33.6 - -
05-Oct-2017 Credit Suisse Group (London and Singapore datacenters) Switzerland Iron Mountain $100.0 - -
03-Oct-2017 CompuCom Systems, [Thomas H. Lee Partners] U.S. Office Depot $200.0 0.9x -
03-Oct-2017 Bonded Services U.S. Iron Mountain $77.0 - -
(1) Top M&A transactions on the basis of disclosed deal value in Q4’17.

©2018 KPMG Corporate Finance, a Delaware limited liability company. Member FINRA and SIPC. KPMG CorporateFinance is a subsidiary of KPMG LLP, a Delaware limited liability partnership and the U.S. member firm of the KPMGnetwork of independent member firms affiliated with KPMG International Cooperative (“KPMG International”), a Swiss entity.All rights reserved. NDPPS 640221
14
Global TMT Selected Public Comps: Internet and Media
Source: Capital IQ. Financials are calendarized to December year-end.(1) Market Data including Market Capitalization amounts are based on closing share prices as of December 29, 2017.(2) Enterprise Value (EV) equals Market Capitalization plus Debt, Preferred Equity, and Minority Interest, minus Cash and Cash Equivalents.(3) EBITDA equals Earnings before Interest,Taxes, Depreciation, and Amortization.
Market Data Operating Metrics Valuation Multiples$ value millions, except per share
LatestQuarterEnding
SharePrice
% of 52Week High
Market Cap. (1)
EnterpriseValue (2)
Revenue Revenue Growth (3)LTM
GrossLTM
EBITDA EV / Revenue EV / EBITDA
Company Name LTM 2018E 2019E 2017 – 2018E 2018E – 2019E Margin% Margin% LTM 2018E 2019E LTM 2018E 2019E
Internet
Alphabet Sep-17 $1,053.40 97.0% $729,458 $633,279 $104,596 $131,237 $152,787 19.1% 16.4% 59.9% 32.9% 6.1x 4.8x 4.1x 18.4x 12.2x 10.4x
Amazon.com Sep-17 $1,169.47 96.4% $563,535 $582,411 $161,154 $228,584 $276,113 28.9% 20.8% 36.5% 8.0% 3.6x 2.5x 2.1x 45.0x 22.8x 17.2x
Facebook Sep-17 $176.46 95.8% $512,759 $474,470 $36,490 $53,774 $67,752 33.7% 26.0% 86.6% 55.5% NM 8.8x 7.0x 23.4x 14.5x 11.6x
Tencent Sep-17 $51.96 92.4% $489,722 $489,586 $32,352 $51,637 $66,952 40.1% 29.7% 50.7% 41.4% NM 9.5x 7.3x 36.6x 26.2x 20.2x
Alibaba Sep-17 $172.43 89.9% $442,426 $438,165 $29,631 $47,039 $63,284 40.0% 34.5% 62.9% 41.9% NM 9.3x 6.9x 35.3x 21.2x 16.5x
Baidu Sep-17 $234.21 85.2% $81,324 $71,179 $11,945 $15,677 $18,873 22.5% 20.4% 55.2% 29.3% 6.0x 4.5x 3.8x 20.3x 17.2x 13.3x
eBay Sep-17 $37.74 96.1% $39,422 $43,390 $9,349 $10,265 $10,949 7.3% 6.7% 76.8% 31.2% 4.6x 4.2x 4.0x 14.9x 11.7x 11.0x
Twitter Sep-17 $24.01 93.9% $17,759 $15,273 $2,429 $2,572 $2,803 7.4% 9.0% 63.0% 9.3% 6.3x 5.9x 5.4x NM 17.6x 15.6x
Snap Sep-17 $14.61 49.6% $17,594 $15,312 $705 $1,292 $2,001 63.2% 54.8% 3.6% NA NM NM 7.7x NM NM NM
Etsy Sep-17 $20.45 93.5% $2,489 $2,190 $415 $519 $606 18.5% 16.8% 65.8% 8.1% 5.3x 4.2x 3.6x NM 20.3x 16.4x
Internet Median 93.7% 5.6x 4.8x 4.8x 23.4x 17.9x 16.2x
Media
Walt Disney Sep-17 $107.51 92.6% $162,048 $188,159 $55,137 $59,071 $68,594 5.8% 16.1% 45.2% 30.4% 3.4x 3.2x 2.7x 11.2x 10.4x 10.1x
Time Warner Sep-17 $91.47 88.0% $71,218 $91,689 $30,551 $32,429 $33,829 4.6% 4.3% 44.7% 29.4% 3.0x 2.8x 2.7x 10.2x 9.8x 9.5x
Twenty-First Century Fox Sep-17 $34.53 96.3% $63,640 $78,539 $28,996 $30,785 $32,004 5.1% 4.0% 37.1% 24.5% 2.7x 2.6x 2.5x 11.1x 10.1x 9.8x
Sky Jun-17 $13.68 98.4% $23,420 $32,462 $16,774 $19,376 $20,267 8.0% 4.6% 44.4% 14.2% 1.9x 1.7x 1.6x 13.7x 9.7x 9.4x
CBS Sep-17 $59.00 84.2% $22,586 $32,131 $13,289 $14,158 $15,129 4.5% 6.9% 39.2% 22.8% 2.4x 2.3x 2.1x 10.6x 9.5x 8.8x
News Sep-17 $16.21 96.1% $9,527 $8,339 $8,232 $8,267 $8,215 0.2% (0.6%) 45.1% 9.9% 1.0x 1.0x 1.0x 10.3x 8.7x 8.2x
REA Group Jun-17 $59.87 94.5% $7,886 $7,992 $515 $687 $766 20.2% 11.4% 78.3% 52.0% NM NM NM 29.8x 20.1x 17.7x
Lagardère Jun-17 $32.10 92.3% $4,113 $6,289 $8,561 $8,792 $9,073 3.7% 3.2% 46.0% 8.7% 0.7x 0.7x 0.7x 8.5x 7.8x 7.4x
Singapore Press Nov-17 $1.98 71.2% $3,202 $4,376 $756 $725 $704 (2.1%) (2.9%) 50.3% 35.4% 5.8x 6.0x 6.2x 16.3x 18.0x 18.7x
DMGT Sep-17 $8.06 74.0% $2,690 $3,334 $2,097 $2,157 $2,101 (10.3%) (2.6%) 39.0% 10.6% 1.6x 1.5x 1.6x 15.1x 10.2x 9.5x
Media Median 92.5% 2.4x 2.3x 2.1x 11.1x 10.0x 9.7x
Information Services
S&P Global Sep-17 $169.40 97.3% $43,197 $45,668 $5,874 $6,324 $6,714 5.9% 6.2% 71.1% 46.7% 7.8x 7.2x 6.8x 16.6x 14.8x 13.9x
Thomson Reuters Sep-17 $43.69 87.2% $31,012 $37,863 $11,249 $11,628 $11,942 2.5% 2.7% 29.3% 22.7% 3.4x 3.3x 3.2x 14.9x 10.7x 10.2x
Moody's Sep-17 $147.61 95.9% $28,208 $33,071 $3,981 $4,513 $4,803 9.8% 6.4% 71.2% 47.6% 8.3x 7.3x 6.9x 17.5x 15.2x 14.1x
Experian Sep-17 $22.11 95.8% $20,074 $23,577 $4,439 $4,829 $5,129 12.3% 6.2% 43.2% 34.9% 5.3x 4.9x 4.6x 15.2x 14.3x 13.5x
Pearson Jun-17 $9.95 89.2% $8,022 $10,447 $6,147 $6,126 $6,118 (1.4%) (0.1%) 54.1% 17.4% 1.7x 1.7x 1.7x 9.8x 10.9x 10.2x
Information Services Median 95.8% 5.3x 4.9x 4.6x 15.2x 14.5x 13.3x

©2018 KPMG Corporate Finance, a Delaware limited liability company. Member FINRA and SIPC. KPMG CorporateFinance is a subsidiary of KPMG LLP, a Delaware limited liability partnership and the U.S. member firm of the KPMGnetwork of independent member firms affiliated with KPMG International Cooperative (“KPMG International”), a Swiss entity.All rights reserved. NDPPS 640221
15
Global TMT Selected Transactions (1): Internet and Media
Announced Date Target Name Target Country Acquirer Name Deal Value
($ mm)EV /
RevenueEV /
EBITDA
19-Dec-2017 Global Voucher Group, The U.K. Gocompare.com [Esure] $48.6 - -
14-Dec-2017(Pending) Twenty-First Century Fox U.S. The Walt Disney Company $77,072 2.4x 9.9x
13-Dec-2017 Shipt U.S. Target Corporation $550.0 - -
06-Dec-2017 Altigi Germany Stillfront Group AB $320.2 2.8x -
04-Dec-2017 Health eCareers [DHI Group] U.S. Everyday Health [Ziff Davis Media][j2 Global] $15.0 - -
26-Nov-2017(Pending) Time U.S. Meredith Corporation $3,137 1.0x 7.2x
01-Nov-2017 Cinedigm Digital Cinema U.S. Bison Capital Asset Management $30.0 0.4x -
31-Oct-2017 Via.com India Ebix [Goldman Sachs] $74.9 - -
30-Oct-2017 Capella Education U.S. Strayer Education $912.0 1.8x 9.4x
24-Oct-2017 Web Investments Malta LeoVegas Group AB $70.7 - -
19-Oct-2017Great Lakes Educational Loan Services [Great Lakes Education Corp]
U.S. Nelnet $150.0 - -
16-Oct-2017Concurrent Computer Corporation (content delivery and storage software)
U.S. Vecima Networks $29.0 1.1x -
05-Oct-2017 Onvia U.S. Deltek [Roper Technologies] $70.0 2.8x NM
04-Oct-2017 Earnest Operations U.S. Navient $155.0 - -
Source: 451research.(1) Top M&A transactions on the basis of disclosed deal value in Q4’17.

©2018 KPMG Corporate Finance, a Delaware limited liability company. Member FINRA and SIPC. KPMG CorporateFinance is a subsidiary of KPMG LLP, a Delaware limited liability partnership and the U.S. member firm of the KPMGnetwork of independent member firms affiliated with KPMG International Cooperative (“KPMG International”), a Swiss entity.All rights reserved. NDPPS 640221
16
Global TMT Selected Public Comps: Software (1/2)
Market Data Operating Metrics Valuation Multiples$ value millions, except per share
LatestQuarterEnding
SharePrice
% of 52Week High
Market Cap. (1)
EnterpriseValue (2)
Revenue Revenue Growth (3)LTM
GrossLTM
EBITDA EV / Revenue EV / EBITDA
Company Name LTM 2018E 2019E 2017– 2018E 2018E – 2019E Margin% Margin% LTM 2018E 2019E LTM 2018E 2019E
Diversified SoftwareAlphabet Sep-17 $1,053.40 97.0% $729,458 $633,279 $104,596 $131,237 $152,787 19.1% 16.4% 59.9% 32.9% 6.1x 4.8x 4.1x 18.4x 12.2x 10.4x
Microsoft Sep-17 $85.54 97.8% $659,906 $615,246 $92,560 $110,315 $118,560 9.0% 7.5% 62.5% 34.7% 6.6x 5.6x 5.2x 19.2x 13.9x 12.2x
Oracle Nov-17 $47.28 89.0% $195,720 $185,248 $38,907 $40,523 $42,216 3.9% 4.2% 58.4% 38.9% 4.8x 4.6x 4.4x 12.2x 9.8x 9.3x
Cisco Systems Oct-17 $38.30 98.2% $189,341 $153,678 $47,789 $49,043 $50,302 2.1% 2.6% 62.6% 30.2% 3.2x 3.1x 3.1x 10.6x 9.2x 9.1x
IBM Dec-17 $153.42 83.9% $142,035 $176,292 $78,366 $79,901 $79,917 1.6% 0.0% 45.8% 20.6% 2.2x 2.2x 2.2x 10.5x 9.0x 9.0x
SAP Sep-17 $112.32 93.0% $134,660 $135,356 $27,631 $30,476 $32,409 8.4% 6.3% 69.6% 25.2% 4.9x 4.4x 4.2x 19.5x 13.4x 12.4x
Adobe Systems Dec-17 $175.24 94.1% $86,383 $82,445 $7,302 $8,764 $10,245 20.9% 16.9% 86.2% 34.2% NM 9.4x 8.0x 33.1x 21.0x 17.7x
Salesforce.com Oct-17 $102.23 93.6% $73,841 $72,800 $9,923 $12,536 $14,952 20.0% 19.3% 73.2% 5.6% 7.3x 5.8x 4.9x NM 26.4x 21.0x
Hewlett Packard Enterprise Oct-17 $14.36 57.7% $22,888 $27,380 $28,871 $29,215 $29,732 (11.0%) 1.8% 30.1% 15.3% 0.9x 0.9x 0.9x 6.2x 5.0x 4.9x
CA Sep-17 $33.28 91.1% $13,929 $14,029 $4,078 $4,291 $4,321 3.6% 0.7% 85.7% 29.4% 3.4x 3.3x 3.2x 11.7x 8.6x 8.3x
Diversified Software Median 93.3% 4.8x 4.5x 4.1x 12.2x 11.0x 9.8x
Large-Cap SaaS (> $2B Market Cap)
Salesforce.com Oct-17 $102.23 93.6% $73,841 $72,800 $9,923 $12,536 $14,952 20.0% 19.3% 73.2% 5.6% 7.3x 5.8x 4.9x NM 26.4x 21.0x
ServiceNow Sep-17 $130.39 99.3% $22,519 $22,004 $1,772 $2,517 $3,225 31.0% 28.1% 73.5% (0.3%) NM 8.7x 6.8x NM 34.2x 23.6x
Workday Oct-17 $101.74 87.0% $21,365 $19,628 $1,995 $2,665 $3,270 24.8% 22.7% 70.5% (10.3%) 9.8x 7.4x 6.0x NM 43.3x 32.3x
Atlassian Dec-17 $45.52 85.2% $10,280 $9,666 $677 $971 $1,235 32.6% 27.2% 79.3% (3.2%) NM 10.0x 7.8x NM 35.0x 29.1x
Shopify Sep-17 $101.00 81.5% $10,088 $9,161 $581 $955 $1,281 44.6% 34.2% 56.3% (6.1%) NM 9.6x 7.1x NM NM NM
Veeva Systems Oct-17 $55.28 81.2% $7,813 $7,055 $651 $806 $952 18.5% 18.1% 69.4% 25.0% NM 8.7x 7.4x 43.4x 27.0x 22.6x
The Ultimate Software Group Sep-17 $218.23 93.5% $6,520 $6,391 $900 $1,112 $1,317 19.1% 18.5% 62.0% 7.7% 7.1x 5.7x 4.9x NM 23.3x 19.2x
LogMeIn Sep-17 $114.50 88.4% $6,027 $5,751 $802 $1,144 $1,218 12.4% 6.4% 80.2% 24.6% 7.2x 5.0x 4.7x 29.2x 13.1x 11.9x
Tableau Software Sep-17 $69.20 84.1% $5,518 $4,575 $878 $943 $1,066 8.6% 13.0% 87.4% (12.8%) 5.2x 4.8x 4.3x NM NM 37.0x
athenahealth Sep-17 $133.04 83.9% $5,324 $5,478 $1,179 $1,343 $1,492 10.7% 11.1% 52.0% 11.0% 4.6x 4.1x 3.7x 42.1x 16.3x 14.0x
Proofpoint Sep-17 $88.81 90.7% $3,982 $3,903 $477 $662 $842 29.9% 27.3% 72.2% (7.1%) 8.2x 5.9x 4.6x NM 43.0x 30.5x
RingCentral Sep-17 $48.40 96.9% $3,744 $3,572 $465 $614 $753 23.2% 22.8% 75.9% (2.5%) 7.7x 5.8x 4.7x NM NM NM
Medidata Solutions Sep-17 $63.37 73.8% $3,707 $3,583 $529 $641 $753 17.6% 17.5% 76.6% 15.5% 6.8x 5.6x 4.8x 43.6x 22.2x 18.2x
RealPage Sep-17 $44.30 94.7% $3,672 $3,960 $632 $837 $931 24.5% 11.2% 58.7% 14.0% 6.3x 4.7x 4.3x 44.8x 18.2x 15.4x
Zendesk Sep-17 $33.84 94.3% $3,435 $3,208 $396 $554 $710 29.8% 28.3% 70.2% (22.2%) 8.1x 5.8x 4.5x NM NM NM
2U Sep-17 $64.51 93.1% $3,369 $3,184 $257 $395 $526 38.5% 33.2% 80.6% (7.2%) NM 8.1x 6.1x NM NM NM
HubSpot Sep-17 $88.40 94.5% $3,304 $3,105 $346 $473 $586 27.5% 23.9% 79.3% (10.4%) 9.0x 6.6x 5.3x NM NM NM
New Relic Sep-17 $57.77 94.9% $3,181 $2,953 $306 $416 $518 27.2% 24.3% 81.3% (15.1%) 9.6x 7.1x 5.7x NM NM 49.7x
Xero Sep-17 $22.36 88.7% $3,071 $3,014 $250 $381 $487 38.5% 28.0% 78.9% (11.1%) NM 7.9x 6.2x NM NM 32.5x
MuleSoft Sep-17 $23.26 80.2% $3,023 $2,841 $263 $396 $515 35.9% 30.2% 73.1% (24.2%) NM 7.2x 5.5x NM NM NM
Box Oct-17 $21.12 87.6% $2,875 $2,787 $479 $626 $769 23.7% 22.9% 73.0% (25.2%) 5.8x 4.5x 3.6x NM NM NM
Wix.com Sep-17 $57.55 66.8% $2,616 $2,409 $391 $557 $704 31.4% 26.3% 83.5% (9.1%) 6.2x 4.3x 3.4x NM 22.0x 14.6x
Okta Oct-17 $25.61 76.1% $2,610 $2,387 $231 $335 $447 32.5% 33.4% 68.0% (45.5%) NM 7.1x 5.3x NM NM NM
Cloudera Oct-17 $16.52 70.7% $2,333 $1,944 $337 $460 $569 26.9% 23.6% 56.2% (110.4%) 5.8x 4.2x 3.4x NM NM NM
Qualys Sep-17 $59.35 95.2% $2,251 $1,948 $220 $268 $311 16.4% 16.3% 78.0% 25.8% 8.8x 7.3x 6.3x 34.3x 20.0x 17.5x
Twilio Sep-17 $23.60 67.5% $2,196 $1,912 $366 $481 $598 24.2% 24.1% 55.7% (12.4%) 5.2x 4.0x 3.2x NM NM NM
Cornerstone OnDemand Sep-17 $35.33 79.8% $2,046 $1,983 $459 $505 $558 4.4% 10.5% 69.6% (10.4%) 4.3x 3.9x 3.6x NM 21.3x 17.6x
Large-Cap SaaS (> $2B Market Cap) 87.6% 7.1x 5.8x 4.9x 42.8x 22.8x 21.0x
Source: Capital IQ. Financials are calendarized to December year-end.(1) Market Data including Market Capitalization amounts are based on closing share prices as of December 29, 2017.(2) Enterprise Value (EV) equals Market Capitalization plus Debt, Preferred Equity, and Minority Interest, minus Cash and Cash Equivalents.(3) EBITDA equals Earnings before Interest,Taxes, Depreciation, and Amortization.

©2018 KPMG Corporate Finance, a Delaware limited liability company. Member FINRA and SIPC. KPMG CorporateFinance is a subsidiary of KPMG LLP, a Delaware limited liability partnership and the U.S. member firm of the KPMGnetwork of independent member firms affiliated with KPMG International Cooperative (“KPMG International”), a Swiss entity.All rights reserved. NDPPS 640221
17
Global TMT Selected Public Comps: Software (2/2)
Market Data Operating Metrics Valuation Multiples$ value millions, except per share
LatestQuarterEnding
SharePrice
% of 52Week High
Market Cap. (1)
EnterpriseValue (2)
Revenue Revenue Growth (3)LTM
GrossLTM
EBITDA EV / Revenue EV / EBITDA
Company Name LTM 2018E 2019E 2017– 2018E 2018E – 2019E Margin% Margin% LTM 2018E 2019E LTM 2018E 2019E
Mid-Cap SaaS (< $2B Market Cap)
BroadSoft Sep-17 $54.90 99.7% $1,745 $1,585 $362 $432 $488 12.2% 13.1% 72.0% 6.6% 4.4x 3.7x 3.2x NM 15.6x NA
BlackLine Sep-17 $32.80 81.4% $1,734 $1,625 $162 $224 $286 28.6% 27.6% 75.8% (11.3%) NM 7.2x 5.7x NM NM NM
Coupa Software Oct-17 $31.22 82.8% $1,719 $1,499 $171 $226 $279 24.4% 23.5% 67.9% (22.3%) 8.8x 6.6x 5.4x NM NM NM
Mimecast Sep-17 $28.67 89.6% $1,643 $1,555 $222 $295 $351 23.9% 18.7% 73.7% 3.5% 7.0x 5.3x 4.4x NM NM 40.9x
Alteryx Sep-17 $25.27 86.7% $1,495 $1,339 $118 $176 $233 36.9% 32.5% 83.2% (14.9%) NM 7.6x 5.8x NM NM NM
Mindbody Sep-17 $30.45 84.0% $1,422 $1,212 $171 $228 $287 25.6% 25.7% 71.2% (4.5%) 7.1x 5.3x 4.2x NM NM 30.4x
AppFolio Sep-17 $41.50 79.4% $1,409 $1,366 $134 $181 $232 27.6% 28.0% 61.2% 7.0% NM 7.5x 5.9x NM 37.7x 20.1x
Yext Oct-17 $12.03 79.6% $1,098 $984 $158 $225 $299 32.4% 32.6% 73.6% (37.3%) 6.2x 4.4x 3.3x NM NM NM
Instructure Sep-17 $33.10 90.4% $1,002 $935 $147 $201 $253 28.3% 26.2% 71.2% (32.3%) 6.4x 4.7x 3.7x NM NM NM
Apptio Sep-17 $23.52 92.3% $950 $814 $180 $214 $247 15.3% 15.3% 67.7% (11.3%) 4.5x 3.8x 3.3x NM NM 47.2x
Workiva Sep-17 $21.40 90.3% $897 $839 $200 $235 $267 13.9% 13.7% 71.3% (16.8%) 4.2x 3.6x 3.1x NM NM NM
Benefitfocus Sep-17 $27.00 72.8% $844 $910 $253 $282 $323 9.8% 14.6% 51.1% (1.1%) 3.6x 3.2x 2.8x NM 32.7x 23.3x
Everbridge Sep-17 $29.72 98.4% $840 $792 $96 $131 $163 26.3% 24.2% 69.5% (12.5%) 8.2x 6.0x 4.9x NM NM NM
SPS Commerce Sep-17 $48.59 66.9% $837 $673 $213 $244 $270 11.0% 10.8% 66.5% 10.9% 3.2x 2.8x 2.5x 29.0x 17.5x 14.8x
LivePerson Sep-17 $11.50 76.2% $685 $630 $218 $234 $254 7.2% 8.7% 73.2% 5.3% 2.9x 2.7x 2.5x NM 28.7x 21.6x
Castlight Health Sep-17 $3.75 73.5% $502 $420 $124 $163 $194 24.7% 18.8% 66.1% (41.8%) 3.4x 2.6x 2.2x NM NM 33.4x
Bazaarvoice Oct-17 $5.45 99.1% $469 $404 $206 $218 $226 4.6% 3.6% 62.1% 0.4% 2.0x 1.9x 1.8x NM 13.0x 10.8x
MobileIron Sep-17 $3.90 57.6% $375 $292 $173 $187 $205 7.3% 9.4% 82.5% (30.6%) 1.7x 1.6x 1.4x NM NM NM
Mid-Cap SaaS (< $2B Market Cap) 83.4% 4.4x 4.1x 3.3x 29.0x 23.1x 23.3x
Source: Capital IQ. Financials are calendarized to December year-end.(1) Market Data including Market Capitalization amounts are based on closing share prices as of December 29, 2017.(2) Enterprise Value (EV) equals Market Capitalization plus Debt, Preferred Equity, and Minority Interest, minus Cash and Cash Equivalents.(3) EBITDA equals Earnings before Interest,Taxes, Depreciation, and Amortization.

©2018 KPMG Corporate Finance, a Delaware limited liability company. Member FINRA and SIPC. KPMG CorporateFinance is a subsidiary of KPMG LLP, a Delaware limited liability partnership and the U.S. member firm of the KPMGnetwork of independent member firms affiliated with KPMG International Cooperative (“KPMG International”), a Swiss entity.All rights reserved. NDPPS 640221
18
Global TMT Selected Transactions (1): Software
Source: 451research.
Announced Date Target Name Target Country Acquirer Name Deal Value
($ mm)EV /
RevenueEV /
EBITDA
18-Dec-2017 Cayan [Parthenon Capital Partners] U.S. Total System Services $1,050.0 - -
17-Dec-2017 Aconex Australia Oracle Corporation $1,200.0 9.7x NM
14-Dec-2017 Imascap SAS France Wright Medical Group N.V. $62.5 - -
12-Dec-2017 ClearSlide U.S. Corel Corporation [Vector Capital] $60.0 1.7x -
11-Dec-2017 3M (communication markets division) U.S. Corning $900.0 2.3x -
07-Dec-2017 LKQD Technologies U.S. Nexstar Media Group $90.0 - -
05-Dec-2017 TSheets.com U.S. Intuit $340.0 - -
04-Dec-2017 General Cable Corporation U.S. Prysmian Group $1,552.6 0.8x -
30-Nov-2017 Power Advocate U.S. Verisk Analytics $200.0 - -
29-Nov-2017 Big Fish Games [Churchill Downs] U.S. Aristocrat Technologies Australia $990.0 2.2x 12.2x
27-Nov-2017 Bazaarvoice U.S. Marlin Equity Partners $521.0 2.3x NM
27-Nov-2017 Spread Networks U.S. Zayo Group Holdings $127.0 - -
16-Nov-2017 Reckon (accounting and tax compliance software) Australia MYOB Technology $137.3 5.6x -
16-Nov-2017 Outward U.S. Williams-Sonoma $112.0 - -
12-Nov-2017 Idea Cellular (tower assets) India American Tower Corporation $1,200.0 - -
09-Nov-2017 Respawn Entertainment U.S. Electronic Arts $315.0 - -
07-Nov-2017 Cantaloupe Systems U.S. USA Technologies $85.0 - -
02-Nov-2017 Black Duck Software U.S. Synopsys $565.0 - -
31-Oct-2017 KIO Networks (infrastructure assets) Mexico American Tower Corporation $500.0 - -
27-Oct-2017 Trayport [Intercontinental Exchange aka ICE] U.K. TMX Group $726.2 - -
26-Oct-2017 Planet Payment U.S. Fintrax Group Holdings [Eurazeo] $250.0 4.7x 18.8x
26-Oct-2017 Logi Analytics U.S. Marlin Equity Partners $130.0 3.7x -
24-Oct-2017 nuTonomy U.S. Delphi Automotive $400.0 - -
24-Oct-2017 Virtu Financial (VirtuBondPoint asset) U.S. Intercontinental Exchange $400.0 - -
23-Oct-2017 Bullhorn [Vista Equity Partners] U.S. Insight Venture Partners $500.0 - 20.0x
19-Oct-2017 Trust Company of America U.S. E*Trade Financial Corporation $275.0 - -
17-Oct-2017 Intralinks Holdings [Synchronoss] U.S. Siris Capital Group $977.0 - -
16-Oct-2017 Paradigm [Apax Partners/JMI Equity] U.S. Emerson Electric $510.0 - -
10-Oct-2017 eviCore Healthcare [General Atlantic] U.S. Express Scripts Holding $3,600.0 - -
06-Oct-2017 Cyence U.S. Guidewire Software $275.0 - -
(1) Top M&A transactions on the basis of disclosed deal value in Q4’17.

©2018 KPMG Corporate Finance, a Delaware limited liability company. Member FINRA and SIPC. KPMG CorporateFinance is a subsidiary of KPMG LLP, a Delaware limited liability partnership and the U.S. member firm of the KPMGnetwork of independent member firms affiliated with KPMG International Cooperative (“KPMG International”), a Swiss entity.All rights reserved. NDPPS 640221
19
Global TMT Coverage TeamGlobal Coverage. Industry Knowledge. Middle-Market Focus.
The Corporate Finance practices of KPMG International’s network of independent member firms (KPMG) have been ranked collectively as the number two global mid-market advisor based on total deal volume announced in 2016, according to Thomson Reuters SDC. KPMG firms operate in 155 countries with over 2,600 professionals who are able to meet the needs of clients across the globe.
Global
Americas
Cyrus LamManaging DirectorNew York, U.S.T: +1-212-872-5540E: [email protected]
JP DittyManaging DirectorSanta Clara, U.S.T: +1-408-367-3826E: [email protected]
Mihir JobaliaManaging DirectorSanta Clara, U.S.T: +1-408-367-2850E: [email protected]
Luis MottaPartnerSão Paulo, BrazilT: +55-113-940-8314E: [email protected]
Joseph RadeckiManaging DirectorDenver, U.S.T: +1-303-295-8890E: [email protected]
Alexander M AldenManaging DirectorSan Francisco, U.S.T: +1-415-963-5511E: [email protected]
Patrick CoadyPartnerOttawa, CanadaT: +1-613-212-2841E: [email protected]
Neil C BlairManaging DirectorToronto, CanadaT: +1-416-777-8657E: [email protected]
Saul VillaPartnerMexico City, MexicoT: +52-555-246-8449E: [email protected]
EMEA
Jorn De NevePartnerBrussels, BelgiumT: +32-2-708-4778E: [email protected]
Kim Harpoeth JespersenPartnerCopenhagen, DenmarkT: +45-521-50-243E: [email protected]
Harri RasanenPartnerHelsinki, FinlandT: +358-207-603-215E: [email protected]
Mark WyattPartnerParis, FranceT: +33-155-689-300E: [email protected]
Tom NymanPartnerHelsinki, FinlandT: +358-207-603-372E: [email protected]
Florian FreiPartnerFrankfurt/Main, Germany T: +49-699-587-2834 E: [email protected]
Michele ConnollyPartnerDublin, IrelandT: +35-314-101-546E: [email protected]
Amir ShaniPrincipalTel Aviv, IsraelT: +972-3-684-8661E: [email protected]
Maurizio NitratiPartnerRome, ItalyT: +39-06-809-711E: [email protected]
Paolo MascarettiPartnerMilan, ItalyT: +39-02-676-431E: [email protected]
Maximilian Peter FianiPartnerMilan, ItalyT: +39-02-676-431E: [email protected]
Khalid BakkaliPartnerAmsterdam, NetherlandsT: +31-206-567-507E: [email protected]
Wouter Van de BuntPartnerAmsterdam, NetherlandsT: +31-206-567-968E:[email protected]
João Sousa LealPartnerLisbon, PortugalT: +351-210-110-049E: [email protected]
Robert VartevanianPartnerMoscow, RussiaT: +7-495-937-4444 (x11777)E:[email protected]
Eloy Serrano BufalaPartnerMadrid, SpainT: +34-91-456-3870E: [email protected]
Asia Pacific
Bjorn HallinPartnerStockholm, SwedenT: +46-070-548-9626E: [email protected]
Christian MayoPartnerLeeds, U.K.T: +44-113-231-3179E: [email protected]
David J ElmsPartnerLondon, U.K.T: +44-20-731-18568E: [email protected]
Ed WirgmanDirectorLondon, U.K.T: +44-20-769-45168E: [email protected]
Graham PearceDirectorLeeds, U.K.T: +44-113-231-3855E:[email protected]
Patrick KerlerPartnerZürich, SwitzerlandT: +41-58-249-42-02E: [email protected]
Brendan LarsenPartnerBrisbane, AustraliaT: +61-7-3233-9373E: [email protected]
Peter TurnerPartnerMelbourne, AustraliaT: +61-3-9288-6022E: [email protected]
Michael JiangPartnerBeijing, ChinaT: +86-108-508-7077E: [email protected]
Jayant KumaarPartnerNew Delhi, IndiaT: +91-124-334-5115E: [email protected]
Takeo TakanashiPartnerTokyo, JapanT: +81-335-485-178E:[email protected]
Takeshi MoriyaPartnerTokyo, JapanT: +81-335-485-171E:[email protected]
Eric LauPartnerHong KongT: +85-229-132-576E: [email protected]
Sung-Won ParkPartnerSeoul, South KoreaT: +82-221-127-090E:[email protected]
Sumit PunwaniPartnerSingaporeT: +65-621-32-922E: [email protected]
Jesse C.S. ChenDirectorTaipei, TaiwanT: +886281016666 (x13372)E: [email protected]
Philip NgPartnerShenzhen, ChinaT: +86-755-254-73-308E: [email protected]
Nigel RousePartnerStockholm, SwedenT: +46-8-723-9706E: [email protected]
Hillel SchusterPartnerTel Aviv, IsraelT: +972-3-684-8000 E: [email protected]
Guillaume CauchoixPartnerParis, FranceT: +33-155-688-611E: [email protected]

©2018 KPMG Corporate Finance, a Delaware limited liability company. Member FINRA and SIPC. KPMG CorporateFinance is a subsidiary of KPMG LLP, a Delaware limited liability partnership and the U.S. member firm of the KPMGnetwork of independent member firms affiliated with KPMG International Cooperative (“KPMG International”), a Swiss entity.All rights reserved. NDPPS 640221
Important NoticeThe information contained herein is of a general nature and is not intended toaddress the circumstances of any particular individual or entity. Although weendeavor to provide accurate and timely information, there can be no guaranteethat such information is accurate as of the date it is received or that it will continueto be accurate in the future. No one should act upon such information withoutappropriate professional advice after a thorough examination of the particularsituation. The information contained in this communication may not berepresentative of the experience of other clients and does not constitute arecommendation, offer, or solicitation to buy, sell or hold any security of any issuer.Past performance does not guarantee future results.