Global Supply Chain - icv-controlling.com · measure of value creation that ties our strategic...
28
April 2018 Global Supply Chain Michael Prado, Chief Purchasing Officer
Transcript of Global Supply Chain - icv-controlling.com · measure of value creation that ties our strategic...
April 2018
Global Supply ChainMichael Prado, Chief Purchasing Officer

Cautionary Statements
This presentation contains “forward-looking statements,” that is, statements that address future, not past events. In this context,
forward-looking statements often address our expected future business and financial performance and financial condition, and often
contain words such as: “expect,” “anticipate,” “intend,” “plan,” “believe,” “seek,” or “will.” Forward- looking statements by their nature
address matters that are, to different degrees, uncertain. These statements are based on assumptions of future events that may not
prove accurate. They are also based on our current plans and strategy and such plans and strategy could change in the future. Actual
results may differ materially from those projected or implied in any forward-looking statements. Please refer to our most recent SEC
filings, including our 2017 Annual Report on Form 10-K, subsequently filed Quarterly reports on Form 10-Q, as well as our other filings
with the SEC, for detailed information regarding factors that could cause or contribute to actual results differing materially from those
expressed or implied in such forward-looking statements. We do not undertake to update our forward-lookingstatements.
This presentation also contains non-GAAP financial information, including CFROI. CFROI is defined as cash flow from operations
plus after-tax interest expense divided by a 2-point average of debt and equity. CFROI is considered important as it is a cash-based
measure of value creation that ties our strategic focus to returns. Reconciliations of other non-GAAP measures are provided in our
annual SEC filings announcing financial results, and may be found in the accompanying appendix. We use this information in our
internal analysis of results and believe that this information may be informative to investors.
Global Supply Chain |2

Dividend Paid Consecutively For 141 Years; Increased For Past 50 Consecutive Years
A Diversified Global Leader
Tools & Storage
Industrial
Security
Industrial $2.0B • STANLEY Engineered Fastening
• Infrastructure
Tools & Storage $9.0B• Power Tools & Equipment
• Hand Tools, Accessories & Storage
Security $2.0B• Commercial Electronic Security
• Mechanical Access*
STANLEY BLACK & DECKER (NYSE: SWK)
2017 Revenue: ~$13.0B Market Cap: $26.1B Cash Dividend Yield: 1.4%
Social ResponsibilityContinued Top Quartile PerformanceKnown For Innovation
Market Cap & Dividend Yield Are As Of Market Close 12/29/2017 $169.69
Revenue Is Adjusted For The 1Q’18 Adoption Of New Revenue Recognition & Retirement Benefit Accounting Standards Global Supply Chain |3

Continue Organic Growth Momentum
Be Selective And Operate In Markets Where
Pursue Acquisitive Growth
Consistent, Rigorous & Disciplined Strategic Framework Executed Over The Last Decade
• Utilize SFS 2.0 As A Catalyst• Mix Into Higher Growth. Higher Margin Businesses• Increase SBD Weighting of Emerging Markets (Goal = 20% +)
• Brand Is Meaningful• Innovation Drives Definable & Sustainable Value Proposition• Global Cost Leadership Is Achievable
• Build Upon Global Tools Platform• Expand Industrial Platform (Engineered Fastening | Infrastructure)• Commercial Electronic Security Acquisitions• Pursue Industrial Adjacency Opportunities
Strategic Framework
Global Supply Chain |4
Accelerate Progress Via Stanley Fulfillment System

FY2017
$13B Revenue
Tools &Storage
$9B69%
Security$2B15%
Industrial$2B15%
~12%Total Revenue CAGR
~$5-7BAcquired Revenue
~4-6%Organic
Revenue GrowthAssumptions
2022 Vision
~$22B Revenue
Tools &Storage
~$12-14B59%
Security~$3-4B
16%
Industrial~$5-6B
25%
Financial Vision
Global Supply Chain |5
Our Long Term Financial Goals

Peer Group Includes DHR, DOV, EMR, GE, HON, IR, ITW, MM, SPXC, TXT And UTX
We Continue To Perform In The Same League As Elite Industrials
794%
S & P
500158%
394%Peer Group
Average
Data From: Jan 2000 – Dec 2017
>620%
380% - 620%
280% - 380%
<280%
Top Quartile
3rd Quartile
2nd Quartile
1st Quartile
2000 – 2017 Peer Group TSR Quartiles
Total Shareholder Return Since The Turn Of The Century
Global Supply Chain |6

A Company That Has Built Well Established, Global Franchises…
Business Value Drivers
…Around Powerful Brands That Supports A Consistent Strategic Framework
In Tools &
Storage
A Global Leader
In Engineered
Fastening
In Commercial
Electronic
Security
#1
#2
Global Franchises
Global Supply Chain |7

Core SFS
S&OP
Global Supply
Management
S1R1
Commercial Excellence
Functional Transformation
Core SFS
BreakthroughInnovation
Digital Excellence
Our Commitment To Drive Operational Efficiency & Strong Free Cash Flow Generation Continues…
…Opportunities Remain To Accelerate Progress Toward Our Vision Of 10 WCT
Order-To-Cash
Excellence
Complexity
Reduction
Operational
Lean

SFS 2.0 – Digital Excellence
Global Supply Chain |9
Global Supply Management
(GSM)
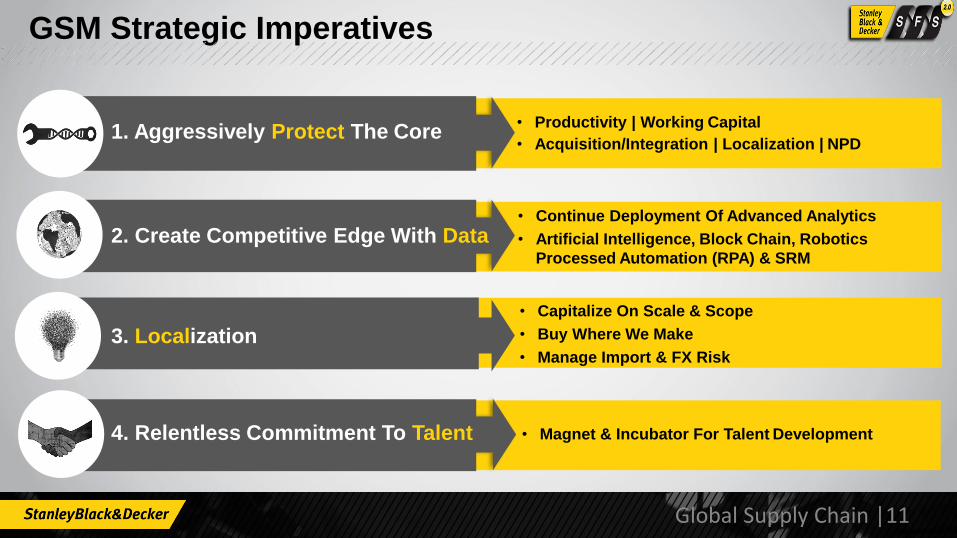
GSM Strategic Imperatives
• Productivity | Working Capital
• Acquisition/Integration | Localization | NPD
• Continue Deployment Of Advanced Analytics
• Artificial Intelligence, Block Chain, Robotics
Processed Automation (RPA) & SRM
• Capitalize On Scale & Scope
• Buy Where We Make
• Manage Import & FX Risk
• Magnet & Incubator For Talent Development
1. Aggressively Protect The Core
2. Create Competitive Edge With Data
3. Localization
4. Relentless Commitment To Talent
Global Supply Chain |11

GTS
71%
IND
14%
SEC
12%
CORP
3%
FG
1.9
COMP
1.7
INDIR
1.0
RM
1.0
TRANS
0.4
Productivity
By
BU
By
Typ
e
Working Capital
~$6B Spend
GSM Proven Track Record Of Outperformance
$$$$$$
$$$
2015 2016 2017
$$$$$
$$
2015 2016 2017
Global Supply Chain |12
Acquisitions
Target 3% To 5% YOY Improvement

Supplier Portfolio Management
• Define Optimal Number Of Suppliers Per Category
• Shared View Of Supply Base Across Multiple Functions
• Asses Capability & Performance
• Vary Relationship By Criticality.
• Focus On Competitive Advantage With Partner Suppliers
• Mitigate Risk For Key Availability Suppliers.
Relationship Management Sourcing Strategy

Relationship
Performance
Human Resources
Supply Chain Disruption
Financial Health
EnvironmentalIndicators
Supplier Risk Score
(RPI)
Influence, Alignment, Information, Sharing, Change in Ownership
Quality (Recall / Patent Infringement), Delivery, Capability, Service, Flexibility, Capacity, Sub-supplier
Turnover, Union Issues, Pay Position, Health & Welfare (Pandemic)
Market Power, Information Visibility, Concentration, Disruption Potential, Transportation, Flexibility
Size, Asset Utilization, Capitalization, Profitability, Solvency
Market Dynamics, Mergers, Regulatory, Disasters, Transportation, Location Risk Exposure
1
6
5
4
3
2
Key Drivers Of Success
• Standardized & Quantified Approach
• Integrated & Aligned To SBU Operations
• Focused On Multi-Facet Risk Factors… “Six Point” Key Focus Areas
• Very Strong Cross Functional Reactive Engagement
GSM Risk Management Model
Global Supply Chain |14
Gross Sales Value (GSV) @ RISK
0
50
100
150
200
250
0 1000 2000 3000 4000 5000 6000
AB
CD E
“Six Point” Risk Model Allows Predictive Versus Reaction
F
Quantitative Point Structure
GSV

GSM – Commitment To Talent
ASIAUS
EMEA
SourcingQuality
SC
Finance HR/Other
30 Offices In 14 Countries GSM Global HC

Productivity

$15.5 $20.0 2.8
( 2.0 ) ( 0.7 )
1.5
5.5
( 1.9 ) ( 0.6 )
Year 1 Volume Price FX Prodt'y Inf / Def Mix Other Year 2
Sales $100 $90 11%
Std Cost of Sales 40 37 8%
Standard Margin (SM) $60 $53 13%SM% 60% 59% 1.1Pts
Manufacturing (Mfg) 5 10 5% Other Cost of Sales (OCOS) 10 14 7%
Adjusted Gross Margin (AGM) $35 $30 19%AGM% 35% 33% 2.2Pts
Sales, General & Admin (SG&A) 15 14 7%
Operating Margin (OM) $20 $16 29%OM% 20% 17% 2.8Pts
Income Statement (P&L)
Yr 2 Yr 1 V%
GSM Financial Position
Operating Margin Walk
OM Walks Are One Of The Most Powerful Tools A GSM Business Leader Can Utilize…
Global Supply Chain |17

• $ Of Net Project Execution
• Planned Other (Unfavorable)
• Favorable Gross Productivity
Productivity Guidelines: 8% | 5% | 3% Rule
Total Plant Cost (4-Wall)
Feed Funnel
2 Identify Project Deck:
5% To 7%
Green Deck (SS|SNS)
1
3
4
Project Funnel Should Include:
Ensure Projects:
• Target 8% To 10% Gross 5% To 7% Net Inflation 3% To 5% Rule
• Drives YOY Organic Productivity
Cost Categories
Global Supply Chain |18

Inflation

Due in large part to massive demand from emerging economies, the price of major raw materials used in the manufacture of automobiles have increased considerable over the past several years. The materials include rubber, plastic, copper, steel, and aluminum. The price of these commodities have increased 45%, 20%, 23%, 66%, and 40%, respectively, since the beginning of 2010...Strong demand from emerging markets for these commodities continue to increase the price of Ford’s raw materials, and this trend will likely be long-term.
“We just see the inflation trends creeping in on many parts of our value chain,”…The Michigan-based appliance giant projected that additional raw material costs, driven by rising prices of steel and resin, would shave as much as $250M off it’s profit this year.
Caterpillar Inc., have pointed to rising material costs as a hurdle in the coming year.
3M Co., the St. Paul, MN based maker of myriad products including Scotch tape and industrial films and adhesives, has signaled it may raise its prices more than expected to offset inflation if it accelerates this year.
Harley-Davidson Inc., has benefited from a weaker dollar in recent months that has helped U.S. manufacturers boost overseas sales. But CFO John Olin told analysts last month that the help from the currency exchange will be “more than offset” by expenses including rising steel and aluminum costs this year.
Macro Impact Of Material Inflation
Global Inflationary Pressure Across All Sectors
Global Supply Chain |20

Inflation / (Deflation) Management
Mitigating Inflation through Pricing and Projects
Example: Copper & Rare Earth PeakCredit Bubble
Deflationary TroughFinancial Crash
Aggregate Market Commodity Index
• Price Recovery
• Clean Sheet (Cost Analysis)
• Stall, Deny, Delay

Working Capital

How Can We Improve WC Turns?
Working Capital Days
Days Sales Of A/R Outstanding (DSO)
• Credit & Risk• Negotiated Terms• Billing Milestones• Letters of Credit• Standby Letters of Credit
Days Of Sales Inventory (DSI)
• Consignment & JIT• Inco Terms• MOQ & Lead Time• Plant Utilization• Make Versus Buy
Days Of Sales Payables Outstanding (DPO)
• Negotiated Terms• Citi Financing
DSO DSI DPO
Leveraging SFS 1.0 & 2.0 Strategies Maximize Working Capital Efficiency…
Global Supply Chain |23
minus equals
$40 + $50 = $90 $60 $30
Inventory Accounts Payable Working CapitalAR Current Assets

Return On Capital Employed
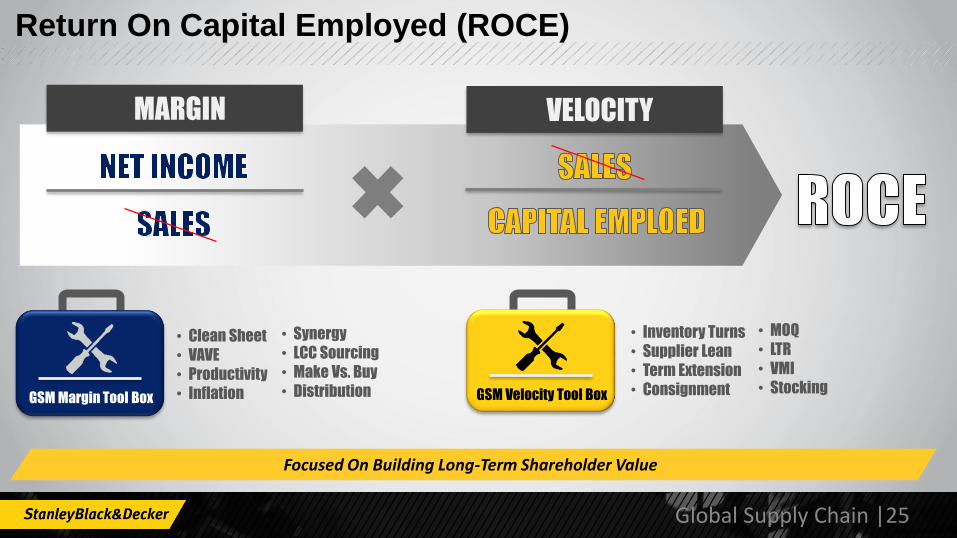
Focused On Building Long-Term Shareholder Value
Return On Capital Employed (ROCE)
Global Supply Chain |25
MARGIN VELOCITY
GSM Margin Tool Box GSM Velocity Tool Box
• Clean Sheet
• VAVE
• Productivity
• Inflation
• Synergy
• LCC Sourcing
• Make Vs. Buy
• Distribution
• Inventory Turns
• Supplier Lean
• Term Extension
• Consignment
• MOQ
• LTR
• VMI
• Stocking

THE WORLD IS CHANGING… LEADERS ADAPT
We Have Entered A New Transformational Era…
• Higher Volatility/Unpredictability
• Increasing Velocity Of Change
• Disruptive Business Models
• Disruptive Technology
…More Risk, More Opportunity
Link Finance Results With Supply Chain Excellence…How do you execute in your business?

SBD Vision
Global Supply Chain |27

Q&A
Thank you!