Education in Estonia May 2009, Funchal. Where is Estonia located? Estonia is here!
-
Global Strategy on Diet, PhysicalActivity and Health
Ursula TruebswasserNutrition and Food Security
WHO Regional Office for Europe

-
Overview of the presentation
Global disease burdenRisk factorsPhysical activity/Diet HealthProcess of the Global Strategy on Diet,Physical Activity and Health (DPAS)Content of DPASImplementation of DPAS and activities atthe European level
-
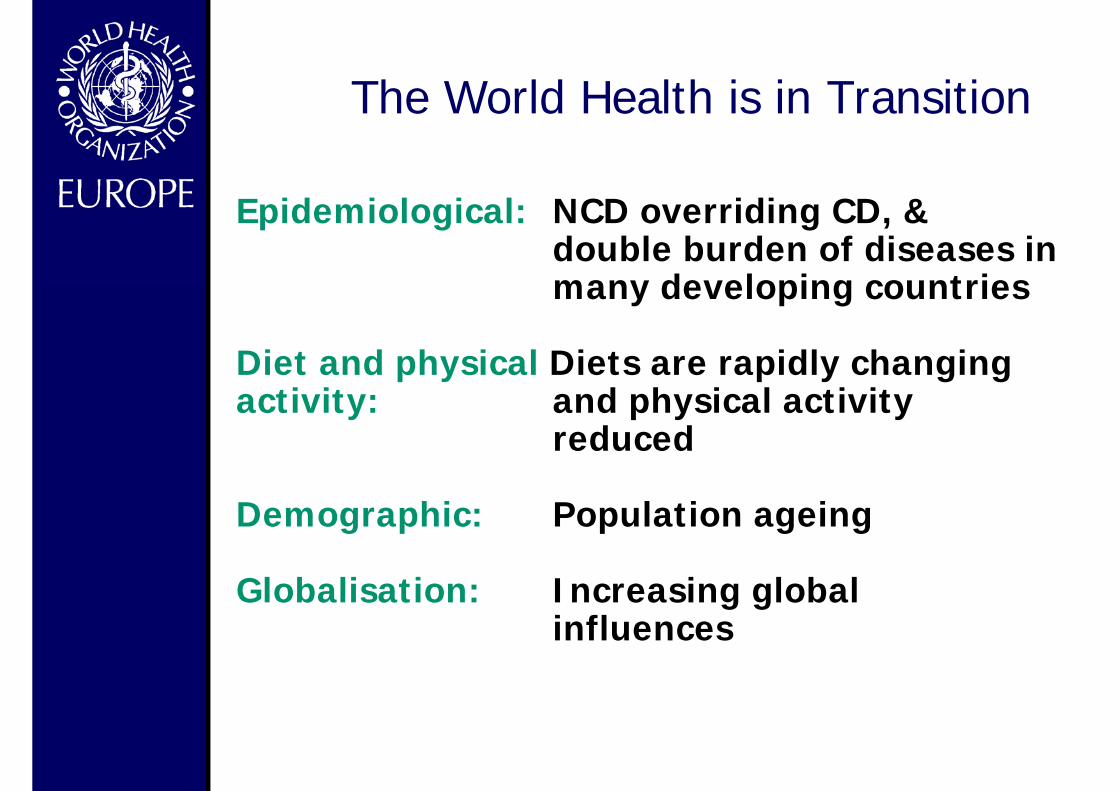
Epidemiological: NCD overriding CD, & double burden of diseases inmany developing countries
Diet and physical Diets are rapidly changingactivity: and physical activity
reduced
Demographic: Population ageing
Globalisation: Increasing global influences
The World Health is in Transition
-
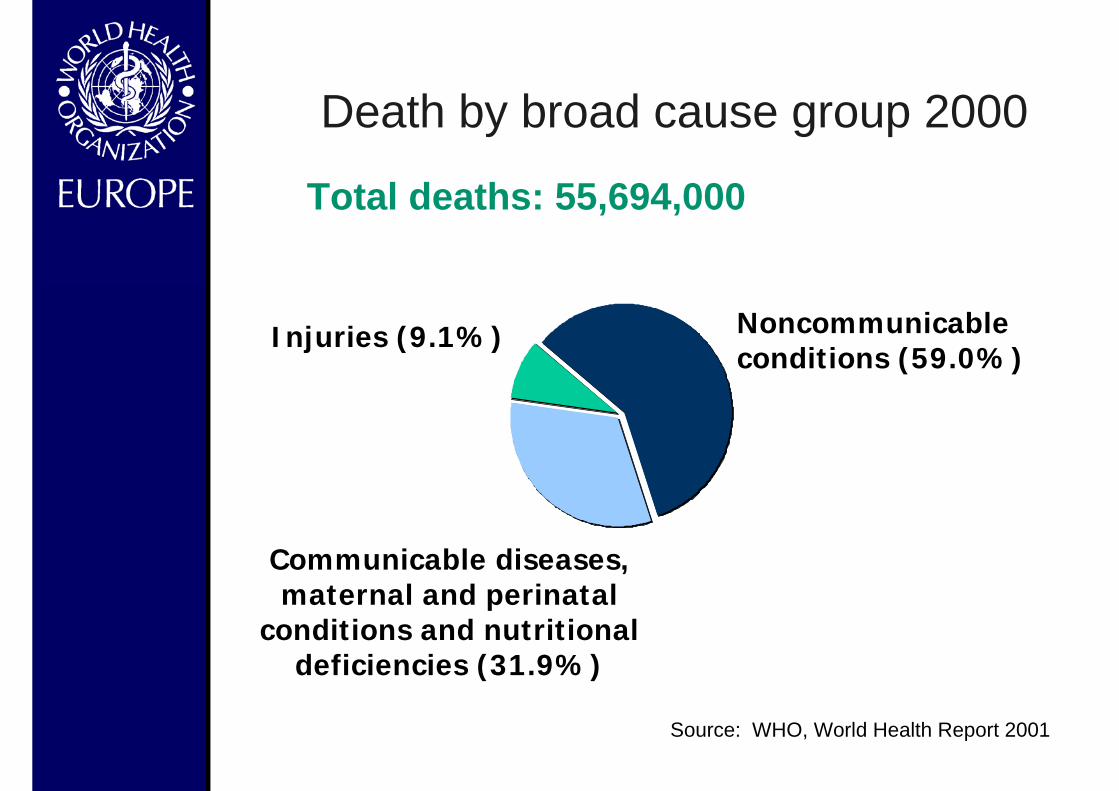
Injuries (9.1%) Noncommunicableconditions (59.0%)
Communicable diseases,maternal and perinatal
conditions and nutritionaldeficiencies (31.9%)
Total deaths: 55,694,000
Source: WHO, World Health Report 2001
Death by broad cause group 2000

-
Deaths, by broad cause group and WHO Region,2000
InjuriesNoncommunicableconditions
Communicable diseases, maternaland perinatal conditions andnutritional deficiencies
AFR EMR EURSEAR WPR AMR
25
50
75
%
Source: WHO, World Health Report 2001
-
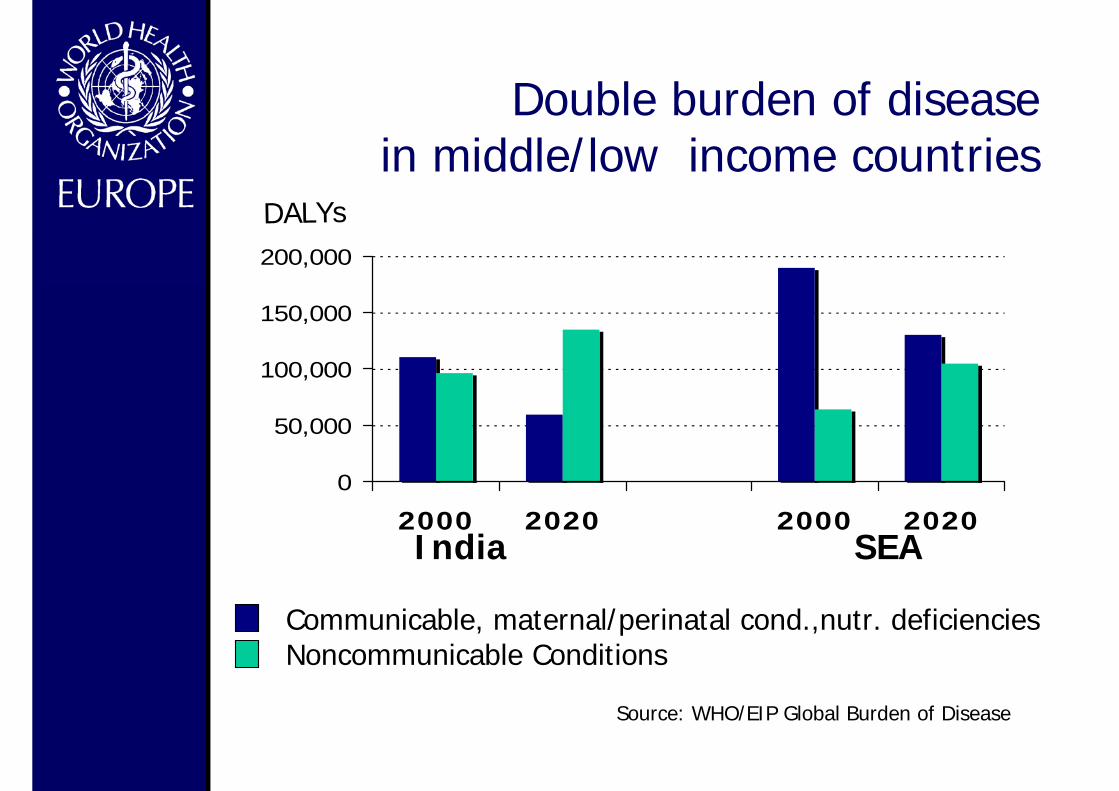
0
50,000
100,000
150,000
200,000
2000 2020 2000 2020 India SEA
Double burden of disease in middle/low income countries
DALYs
Communicable, maternal/perinatal cond.,nutr. deficienciesNoncommunicable Conditions
Source: WHO/EIP Global Burden of Disease

-
Deaths due to CVD by WHO Region,2000
Strokes Heart attacks
AFR EMR EURSEAR WPR AMR
10
20
30% Deaths
Source: WHO, World Health Report 2000

-
0102030405060708090
Afr Eur SEA W Pa Amer E Med
199520002025
World Health Report, 1997
The prevalence of diabetes in adults(millions of people)

-
Prevalence of overweight and obesitya among adults in countries in the WHO European Region based on surveys with an ending year of 1999 or later
42.236.233.733.135.533.532.539.830.931.329.031.028.732.532.429.931.129.323.928.827.428.925.728.026.728.226.928.624.425.122.426.023.725.824.919.921.321.818.420.719.6
18.220.418.0
15.918.216.3
16.919.5
13.5
12.314.912.313.511.4
11.89.5
13.4
15.011.0
11.38.79.1
9.17.5
25.826.0
25.235.6
5.9
22.723.5
23.012.5
20.1
19.915.9
14.1
12.4
12.7
10.37.1
44.341.037.442.139.8
54.337.5
26.531.4
44.644.840.541.038.138.7
32.044.1
38.830.138.343.041.141.846.341.042.041.641.843.044.843.2
46.745.843.048.656.522.8
16.522.419.9
21.6
13.922.2
14.317.1
26.617.0
15.720.1
13.426.0
13.714.2
11.911.3
13.613.7
12.414.9
9.912.9
7.711.9
13.512.0
11.49.3
9.8
9.17.9
5.46.4
100 80 60 40 20 0 20 40 60 80 100
Albania: Tirana city , 2001, 25+Bosnia and Herzegov ina, 2002, 25-64
United Kingdom: Scotland, 2003-2004, 16+Israel, 1999-2001, 25-64
Croatia, 2003, 18+Turkey , 2003, 15-49
United Kingdom: England, 2003, 16+Georgia: Chugureti district, 2004, 25-64
Serbia and Montenegro, 2000, 20+Hungary , 2003-2004, 18+
Malta, 2002, 20-64United Kingdom: Wales, 2003-2004, 16+
Poland, 2000, 19+Ireland, 1997-1999, 18-64
Portugal, 1999, 15+Greece, 2003, 20-70
Czech Republic, 2002, 16+Lithuania, 2004, 20-64
Latv ia, 2004, 15-64Bulgaria, 2001, 15+
Armenia, 2000-2001, 15-49Germany , 2003, 18+Estonia, 2004, 16-64Iceland, 2002, 15-80Finland, 2005, 15-64
Netherlands, 2005, 20+Cy prus, 2003, 15+
Romania, 2000, 15+Belgium, 2004, 18+
Azerbaijan, 2001, 15-44Slov akia, 2002, 15+
Sw eden, 2005, 16-84France, 2003, 15+
Italy , 2003, 18+Denmark, 2000, 16+
Kazakhstan, 1999, 15-49Austria, 1999, 20+
Sw itzerland, 2002, 15+Turkmenistan, 2000, 15-49
Uzbekistan, 2002, F:15-49;M:15-59Norw ay , 2002, 16+
Surv
ey c
hara
cter
istic
sb : cou
ntry
, yea
r, a
ge r
ange
(yea
rs)
Percentage (%)
Men Women
Pre-obese, measured data
Pre-obese, self-reported data
Obese, measured data
Obese, self-reported data
WHO Regional Office for Europe, 2006
Adults

-
ChildrenPrevalence of overweight and obesitya among children 11 years or younger in countries in the WHO European Region based on surveys with an ending year of 1999 or later
21.421.9
21.719.518.014.816.617.0
15.514.814.716.012.69.84.911.711.39.9
12.310.5
7.56.98.3
6.34.4
4.0
3.6
4.26.7
11.4
4.45.7
20.0
15.2
22.5 7.0
2.0
4.5
3.0
4.0
18.9
7.410.310.56.99.18.7
15.014.014.312.9
16.011.515.813.313.716.7
19.919.1
5.9
5.43.9
2.411.2
7.64.9
4.03.93.04.1
3.05.5
7.06.6
4.65.8
10.310.3
10.1
17.0
40 30 20 10 0 10 20 30 40
Portugal, 2002-2003, 7-9Spain, 1998-2000, 2-9
Italy : fiv e v illages in Milan prov ince, 2000-2002, 6-11Ireland, 2001-2002, 4-9
United Kingdom: three South Wales localities, 2001-2002, 5Cy prus, 1999-2000, 6-9
Poland, 2000, 1-9Germany : Zerbst, Hettstedt and Bitterfeld counties, 1998-
Sw eden, 2003, 8Iceland, 2004, 9
Sw itzerland, 2002-2003, 6-9Norw ay , 2000, 8-9France, 2000, 7-9Sw eden, 2003, 4
Slov akia, 2001, 7-9Italy : Perugia, Terni and Rieti prov inces, 1993-2001, 3-9
Greece, 2003, 2-6Netherlands, 2005, 2-9
Serbia and Montenegro: North Backa region, 1995-2002, 6-10Cy prus, 2004, 2-6
Germany : Aachen city , 2001-2002, 5-6
Surv
ey c
hara
cter
istic
sb : cou
ntry
, yea
r, a
gera
nge
(yea
rs)
Percentage (%)
GirlsBoys
Pre-obese, measured data
Obese, measured data
Pre-obese, self-reported or parent-reported dataObese, self-reported or parent-reported dataOverweight, measured data
WHO Regional Office for Europe, 2006
Children

-
0 1000 2000 3000 4000 5000 6000 7000 800
Unsafe water, sanitation, and hygiene
Alcohol
Physical inactivity
High Body Mass Index
Fruit and vegetable intake
Unsafe sex
Underweight
Cholesterol
Tobacco
Blood pressure
Deaths worldwide in 2000 attributableto selected leading risk factors
Number of deaths (000s) Source: WHR 2002
-
The impact of risk factors on diseasesand deaths I
High salt (NaCl) intake:– sodium intake is directly associated with
High blood pressure
Saturated fats and trans fatty acids:– raise total and LDL cholesterol– usually animal fat based or hardened
vegetable oil– replacement by unsaturated vegetable
oils effectively lowers blood cholesteroland coronary heart disease risk
Source: WHR 2002

-
The impact of risk factors on diseasesand deaths II
Obesity:– 58% of DM, 21% of ischaemic heart
diseases and 8-42% of certain cancersare attributable globally to a BMI > 21kg/m2
Low fruit and vegetable intake:– causes 19% of gastro-intestinal cancers
and 31% of ischaemic heart diseases– causes 2.7 million deaths / year (5%)
Source: WHR 2002
-
Diet, physical activity and risk ofNCD
Up to 80 % of cases of coronary heartdisease and up to 90 % of type 2diabetes could be avoided throughchanging lifestyle factors
About one third of cancers could beprevented by eating healthily,maintaining normal weight and beingphysically active throughout the lifespan.

-
Physical activity and health
Physical inactivity is estimated to cause1.9 million deaths worldwide annually10-16% of cases each of breastcancer, colon cancers and diabetes22% of ischemic heart diseases

-
Physical activity and health
Improves glucose metabolism,reduces body fat, lowers bloodpressure, effects on hormonalmetabolism and improvesmuscoloskeletal conditionsHeart diseases, stroke, breast andcolon cancers, osteoporosis

-
Healthy diet and physical activity are
For the individual:
an effective way toprevent disease andpromote health
For society:
a cost effective andsustainable way toimprove publichealth
The Global Strategy on Diet, PhysicalActivity
and Health is of great importancefor global public health.
-
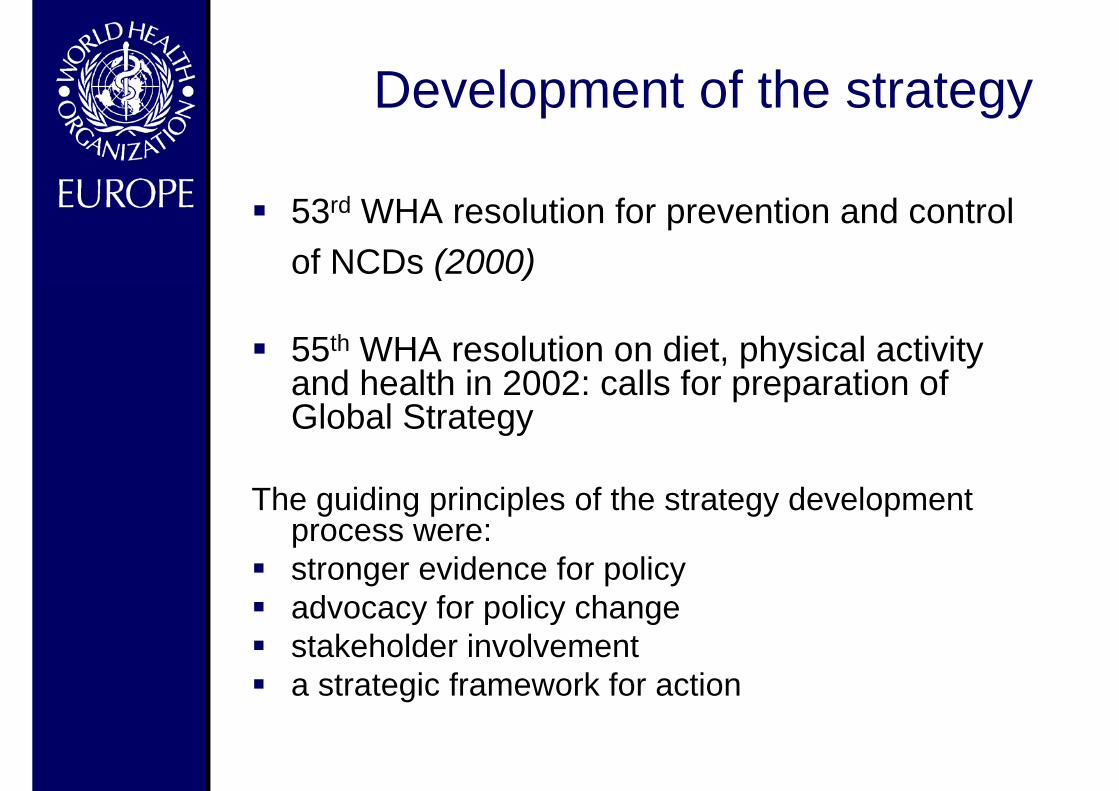
Development of the strategy
53rd WHA resolution for prevention and controlof NCDs (2000)
55th WHA resolution on diet, physical activityand health in 2002: calls for preparation ofGlobal Strategy
The guiding principles of the strategy developmentprocess were:stronger evidence for policyadvocacy for policy changestakeholder involvementa strategic framework for action
-
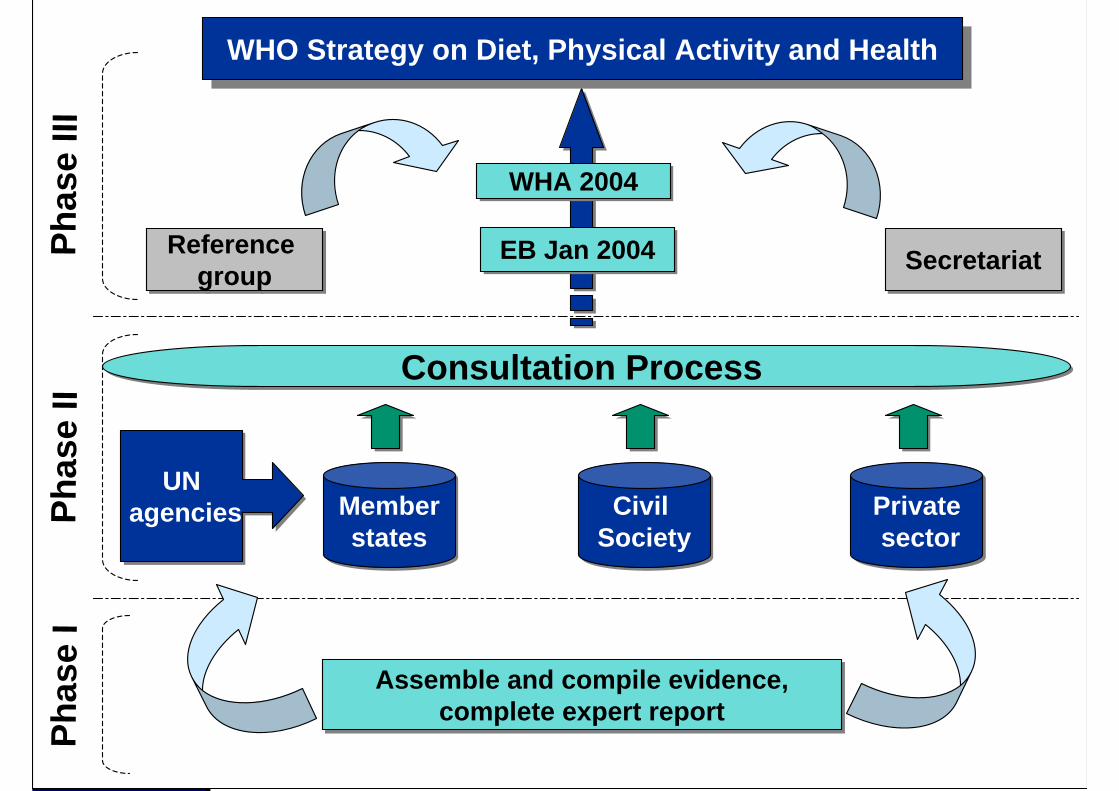
Consultation Process Consultation Process
Memberstates
Memberstates
Civil SocietyCivil
SocietyPrivate sectorPrivate sector
UN agencies
UN agenciesPh
ase
IIWHO Strategy on Diet, Physical Activity and HealthWHO Strategy on Diet, Physical Activity and Health
WHA 2004WHA 2004
EB Jan 2004EB Jan 2004 SecretariatSecretariatReference group
Reference group
Phas
e III
Assemble and compile evidence,complete expert report
Assemble and compile evidence,complete expert report
Phas
e I

-
WHO/FAO Expert Report on Diet,Nutrition and the Prevention of
Chronic Diseases
Report of the joint WHO/FAO expertconsultation in Geneva, Switzerland
28 January - 1 February 2002

-
WHO/FAO Expert ConsultationTRS 916, 2003

-
Process with StakeholdersPrivate Sector Consultation
Dialogues with representatives of food, non-alcoholicbeverage, sport and insurance companies, individually andthrough coordination of International Business LeadersForum
Civil Society ConsultationDialogues with representatives of international civil societyand nongovernmental organisations whose focus includeschronic diseases, nutrition, physical activity; individually andthrough networksConsultation with UN and IntergovernmentalAgenciesDialogues with representatives of UN and other agencies, with representatives from FAO, IFPRI, UNESCO, UNDP,World Bank, WFP among others
Regional Consultations
-
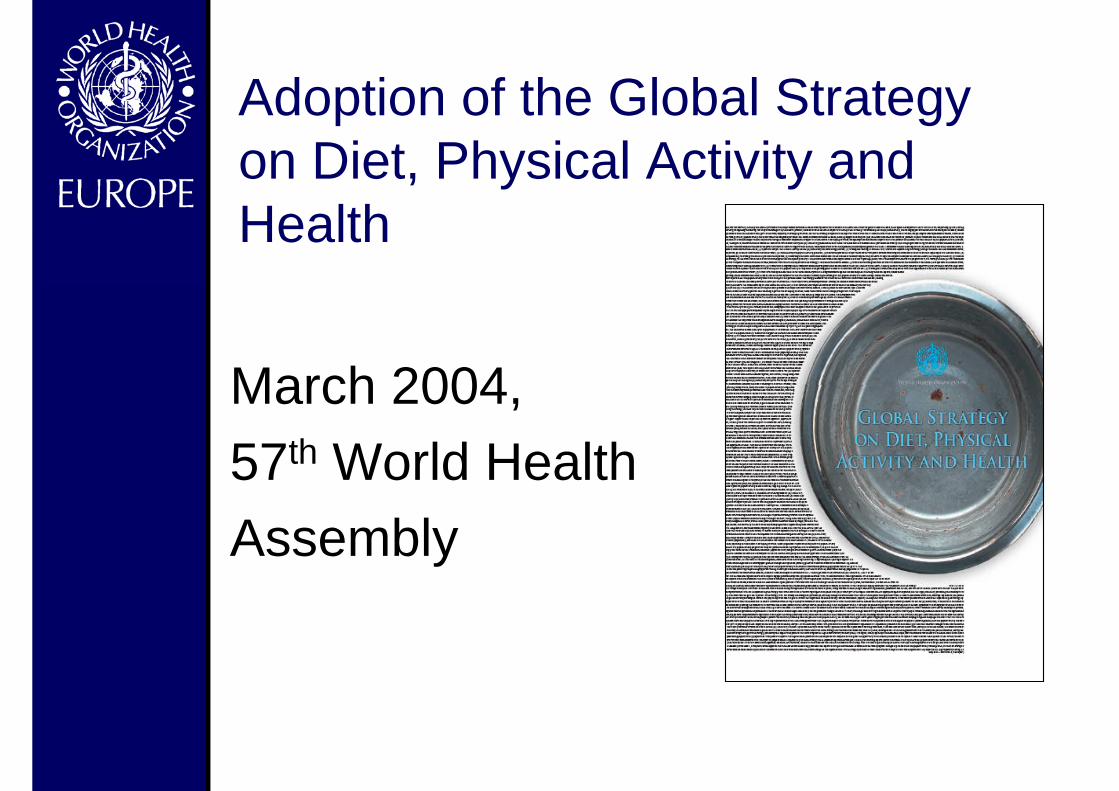
Adoption of the Global Strategyon Diet, Physical Activity andHealth
March 2004,57th World HealthAssembly

-
Main objectives of the DPAS
to reduce the risk factors for NCDsto increase the overall awareness andunderstanding of the influence of diet andphysical activity on healthto encourage the development, strengtheningand implementation of global, regional, nationaland community policies and action plansto monitor scientific data and key influences ondiet and physical activity; to support research ina broad spectrum of relevant areas

-
Recommendations of the DPAS
Achieve energy balance and healthy weightLimit energy intake from total fats and shift fatconsumption away from saturated tounsaturated fats and towards the elimination oftransfatty acidsIncrease consumption of fruits and vegetables,legumes, whole grains and nutsLimit the intake of free sugarsLimit salt (sodium) consumption from all sourcesand ensure that salt is iodizedPhysical activity: at least 30 minutes of regular,moderate-intensity physical activity

-
Principles for action
comprehensivelife-course perspectiveHelps poor populationsand is gender sensitivesupports Member Statesaddresses globalresponses

-
Key topics the strategy addresses -1
National strategies on diet and physicalactivityNational dietary guidelinesNational physical activity guidelinesInformation environment: – Marketing– Labelling– health claims
-
Key topics the strategy addresses -2
National food and agriculture policies:pricing, food programmesBuilding prevention into health servicesSurveillance, research and evaluationInstitutional capacitySpecific reference to internationalstandards like CODEX

-
Framework to monitorand evaluate the
implementation of theGlobal Strategy on Diet,
Physical Activity andHealth
Sep 2006

-
Framework for DPAS implementation
National strategic
leadership on diet and
physical activity
SUPPORTIVEENVIRONMENTS
SupportivePolicies
SupportiveProgrammes
Behaviourchange
Social
HEALTH
Economic
Monitoring, evaluation and surveillance
Process Output Outcome

-
Framework for DPAS implementationThe WHA Resolution WHA57.17, endorsing DPAS,urges Member States "to strengthen existing, orestablish new, structures for implementing thestrategy through the health and other concernedsectors, for monitoring and evaluating itseffectiveness and for guiding resource investmentand management to reduce the prevalence ofnoncommunicable diseases and the risks related tounhealthy diet and physical inactivity"; […] and "todefine for this purpose, consistent with nationalcircumstances: […] (d) measurable process andoutput indicators that will permit accurate monitoringand evaluation of action taken and a rapid responseto identified needs" […]. “
Furthermore, WHO is asked in the DPAS to "set up amonitoring system and to design indicators fordietary habits and patterns of physical activity."
-
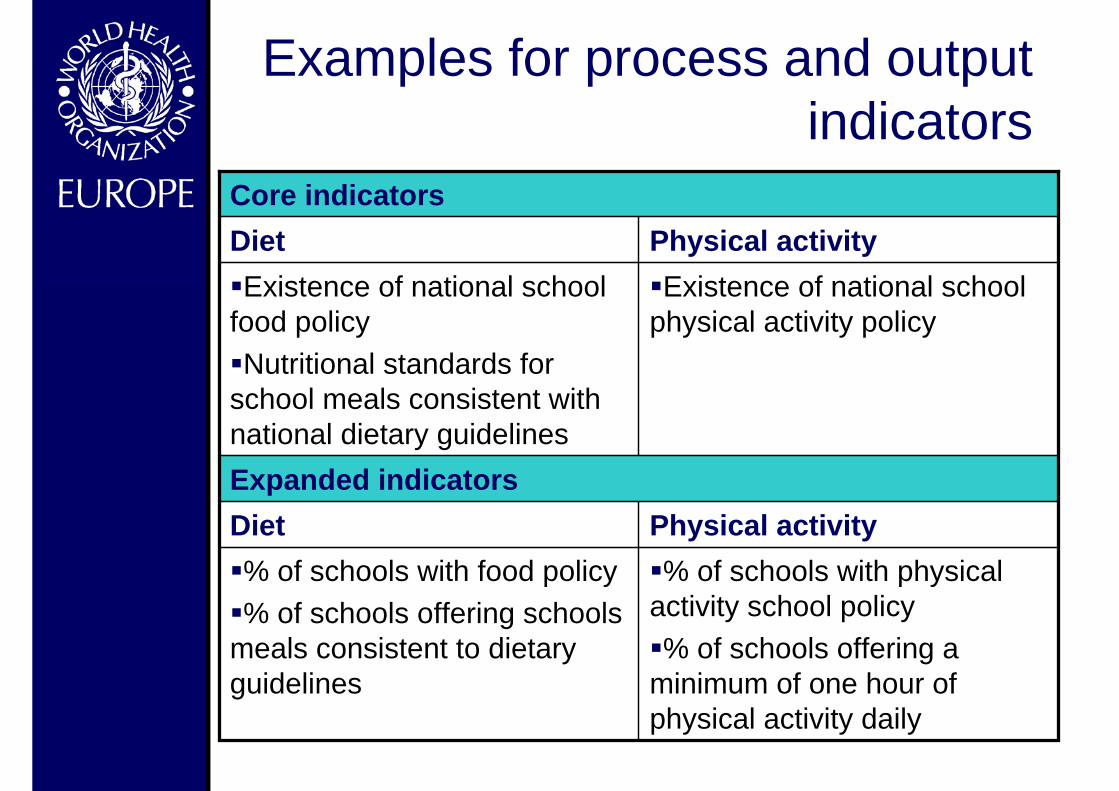
Examples for process and outputindicators
Expanded indicatorsPhysical activityDiet% of schools with physical
activity school policy% of schools offering a
minimum of one hour ofphysical activity daily
% of schools with food policy% of schools offering schools
meals consistent to dietaryguidelines
Existence of national schoolphysical activity policy
Existence of national schoolfood policyNutritional standards for
school meals consistent withnational dietary guidelines
Physical activityDietCore indicators

-
Examples for outcome indicators
Reduction in the percentage of overweight and obesityin a targeted population% of adults with raised blood pressure (e.g. SBP >140
and/or DBP >90mmHg% of adults with raised total cholesterol (e.g.
>5.2mmol/l)
Core indicators – intermediate term
% of the population aware of the health benefits of theadequate consumption of fruit and vegetables% of population aware of the health benefits of physical
activity
Core indicators – short term

-
Fruit and Vegetable promotion Initiative1st Expert Meeting, Geneva 2003
Ways to involve industry at global and nationallevels, guidance to countries wishing to initiatefruit and vegetables promotion programmes.
WHO/FAO workshop, Kobe/Japan, 2004:Framework to promote fruit and vegetables atnational level
Workshops to support implementation:Portuguese speaking countries, Lisbon, 2005Spanish speaking countries Argentina, 2006Francophone countries, Cameroon, Jan 2007
-
Actions in the WHO EuropeanRegion
European Strategy for the Preventionand Control of NoncommunicableDiseases, 2006European Ministerial Conference onCounteracting Obesity: European Charteron Counteracting Obesity (Draft), 2006Promoting Physical Activity for Health – aFramework for Action in the WHOEuropean RegionSecond Action Plan for Food andNutrition Policy, 2007

-
European Strategy for the Preventionand Control of Noncommunicable
DiseasesGOAL
To avoid premature death and significantlyreduce disease burden from NCDs throughintegrated action, improving quality of life andmaking healthy life expectancy more equitablewithin and between Member States
OBJECTIVESTo take integrated action on risk factors andtheir underlying determinants across sectorsTo strengthen health systems for improvedprevention and control of noncommunicablediseases

-
• Istanbul on 15-17 November 2006,hosted by the Ministry of Health ofTurkey
• Participants: Health Ministers andrepresentatives from the agriculture,trade, transport, environment, educationsectors
• International partners: EuropeanCommission, Council of Europe, FAO,OECD, The World Bank, UNICEF

-
The Conference agenda
• Statement of the public health challengeposed by obesity
• Socio-economic determinants• Evidence for effective policies – what
works and what else is emerging fromrecent experiences?
• The role of partnerships: governmentsectors, civil society, the private sector,international organizations
• Adopting the European Charter on obesity• The way forward in countries and Region-
wide

-

-
Promoting Physical Activity for Health –a Framework for Action in the WHO
European Region1. Background
– Our sedentary lifestyle and why?2. Guidelines for action
– The healthy choice must be the easychoice
3. From principles to action– National, local and intersectoral action
4. Setting goals and measuring success– Continued work and surveillance

-
Framework for action
Raise overall awareness to physicalactivity as a health determinantDeveloped with leading internationalexpertsContribute to give more focus on thephysical activity component relatedto the Ministerial Conference onCounteracting Obesity in Nov. 2006Serve as a guide for Member Statesin implementing physical activity

-
Rational for the second European ActionPlan for Food and Nutrition Policy
Policies on food and nutrition appear to havedeveloped successfully in the European Regionand now almost all Member States havegovernment-approved documents dealing withnutrition and food safetyHowever, in the majority of the countries in theEuropean region, nutrition related andfoodborne disease still represent a considerablepublic health burdenThe First European Action Plan needs to bestrategically adapted and renewed in order toprovide a coherent set of actions spanningsectors and ensuring commitment at theinternational level

Monitoring and evaluation
POLICY SECTORsHEALTH CHALLENGES
– Obesity and nutrition related non communicable diseases– Micronutrient deficiencies– Food insecurity– Food borne diseases
Existing international commitments:First European Action Plan for Food and Nutrition Policy 2000-2005
Global Strategy on Food Safety, 2002Global Strategy on Diet, Physical activity and health, 2004
European Strategy for Child and Adolescent health and development, 2005European Strategy for the Prevention and Control of Noncommunicable Diseases, 2006
European Charter on Counteracting Obesity (Draft), 2006
Second European Action Plan on Food and Nutrition Policy
Implementation mechanisms
Core sectors:-Health-Agriculture-Food industry anddistribution-Consumer policy,information andcommunication
Supporting sectors:-Education-Transport, urbanplanning and housing-Environment-Labour-Social policy-Research