Global set of climate change statistics and indicators...Framework for Climate Change Statistics and...
31
United Nations Statistics Division Global set of climate change statistics and indicators Expert Forum for producers and users of climate change-related statistics (Geneva, 2-4 October 2018) Reena Shah, Chief, Environment Statistics Section, United Nations Statistics Division
Transcript of Global set of climate change statistics and indicators...Framework for Climate Change Statistics and...

United Nations Statistics Division
Global set of climate change statistics and indicators
Expert Forum for producers and users of climate change-related statistics(Geneva, 2-4 October 2018)
Reena Shah, Chief, Environment Statistics Section, United Nations Statistics Division

United Nations Statistics Division
UNSD past activities• At the Statistical Commission in 2009 a programme review on
climate change and official statistics carried out by the Australian Bureau of Statistics was presented.• Specify how official statistics may be used for climate change measurement
and analysis
• Identify recommendations and actions to mainstream the climate change aspect in official statistics
• UNSD Conferences on climate change and official statistics• Oslo, 14-16 April 2008
(http://unstats.un.org/unsd/climate_change/default.htm)
• Seoul, 11-12 December 2008 (http://unstats.un.org/unsd/climate_change/Korea/default.htm)
• No follow-up to the programme review was asked by the Statistical Commission in 2009.

United Nations Statistics Division
IPCC Framework
IPCC, 2007, Fourth Assessment Report

United Nations Statistics Division
FDES & climate change statistics
2. Environmental Resources and
their Use
3. Residuals
4. Extreme Events and Disasters
6. Environment Protection,
Management and Engagement
5. Human
Settlements and Environmental
Health
1.Environmental Conditions and
Quality
• FDES cross-cutting application
(Chapter 5) links climate change and
environment statistics based on IPCC
Framework (4th report in 2007)
• Integrating official statistics for
climate change monitoring

United Nations Statistics Division
IPCC sequence of climate change
The IPCC Framework (4th report in 2007) was the basis upon which the stages of the sequence of climate change were constructed to substantiate the application of the FDES to climate change statistics.
The FDES application to climate change statistics identifies the components, topics and individual statistics that are needed to inform about each of the stages of the sequence of climate change:
Climate Process Drivers
Include GHG emissions and use of ozone depleting substances (ODSs);
Climate Change Evidence
Include slow and rapid onset events on the atmosphere, climate and weather as well as occurrence of extreme weather events
Climate Change Impacts and Vulnerability
Include impact of extreme events and disasters (resulting from extreme event and vulnerability) on humans, its settlements and the environment
Mitigation and Adaptation~ human response to
climate change
Include changes in energy renewability/carbon intensity, C&P patterns, levels of environmental protection expenditure, existence of regulation and instruments and level of disaster preparedness
Climate change

United Nations Statistics Division
State of statistics and guidance• Climate process drivers - statistics relatively more available.
➢Greenhouse gas (GHG) emissions transform into global concentrations.
• Climate change evidence - statistics relatively more available. ➢ Temperature and precipitation are available over long periods of
time. • Climate change impacts and vulnerability - some statistics are
produced on impacts but more are needed. For vulnerability, need to develop methodologies and capacity.➢ Emerging data needs: Extreme climate-related meteorological
events and natural disasters increase in frequency and intensity.• Mitigation and adaptation statistics are less often produced and
more difficult to capture statistically.➢ Insufficient resources for measurement and lack of guidance.➢Adaptation statistics, while may be produced for particular
sectors, need to be linked to climate change statistics.

United Nations Statistics Division
Report of the Secretary-General on Climate Change Statistics to the 47th session of the Statistical Commission
UNSD, in collaboration with UN-ECE, prepared the Report of the Secretary-General on Climate Change Statistics to the 47th session of the Statistical Commission (E/CN.3/2016/15) (New York, 8-10 March 2016).http://unstats.un.org/unsd/environment/climatechange_docs_conf.html
Decision 47/112: http://unstats.un.org/unsd/statcom/47th-session/documents/Report-on-the-47th-session-of-the-statistical-commission-E.pdf
Main decisions:For countries: Use the FDES 2013 to guide the development of climate change statistics and indicators given the close interrelationship between environment statistics and climate change statistics.For UNSD: Review and consider the set of climate change-related statistics and indicators of the Economic Commission for Europe as a basis for developing a global set of climate change statistics and indicators, applicable to countries at various stages of development.

United Nations Statistics Division
UNSD: Globalizing climate change statistics and indicators
The UN-ECE set of indicators was endorsed by the Conference of EuropeanStatisticians plenary session in June 2017 as an initial list.
UNSD:
• has pilot tested the UN-ECE set of indicators with countries and analyzedthe responses to assess its applicability for developing countries, inparticular to consider areas of concern such as adaptation/vulnerability.
• has discussed the set of indicators in various fora, including the ExpertGroup on Environment Statistics (EGES), and regional and nationalcapacity building workshops.
EGES website: https://unstats.un.org/unsd/envstats/fdes/fdes_eges.cshtml
2016 2018
2017/2018 2019/2020
Mandate by Statistical
Commission
UNSD Pilot Testing
Submission of SG Report on
Climate Change Statistics
to Statistical Commission
Launch of a Global Consultation
Submission of a list
of indicators to the
Commission

United Nations Statistics Division
UNSD Pilot Survey on Climate Change-related Statistics and Indicators - summary
• The UN-ECE set includes 39 indicators, grouped into five areas:
Drivers – Emissions – Impacts – Mitigation – Adaptation
• 12 countries (11 developing and 1 developed), most of which are part of Expert Group on Environment Statistics (EGES), responded to Pilot Survey.
• The Pilot Survey contained 13 questions for the 39 indicators that were identical to those used by UN-ECE.
• UNSD has summarized responses to:
Question 1: Is this indicator available in your country? [Yes/No]
Question 9: [If not] Which are the main problems in developing this indicator?
Question 4.1: Is this indicator compiled by the NSO? [Yes/No]

United Nations Statistics Division
Observations from the Pilot Survey and the EGES
• Methodological issues/Need clear definitions.• Lack of technical capacity; constraint of human/financial resources. • No policy framework.• Specialized surveys needed/Lack of resources to conduct specialized
surveys/Low survey response rates/Data quality issues.• Lack of dedicated inter-institutional working group at national level
focusing on climate change statistics.• Some NSOs are highly involved in indicator compilation; others not.• Several indicators not applicable/relevant (e.g., proportion of pop.
living in dwellings with air conditioners or air conditioning), not available, not top priority, not significantly important, or too complex.
• Need to adjust indicators to reflect attribution and to include new sub-areas (such as oceans) or indicators which may be pertinent to developing countries, and to expand on areas such as adaptation which are of particular relevance to developing countries.
• Reporting methodologies, procedures and guidelines under negotiation at the UNFCCC.

United Nations Statistics Division
Pilot Survey – key points
Demonstrated the need to develop:
• New or additional indicators to reflect situation in developing countries.
• Process on how to identify/modify the indicators based on:
- existing global processes (e.g., incorporating indicators identified in adaptation and mitigation plans being submitted to UNFCCC).
-regional and national policies, priorities and processes.
• Systematic process for a full consultation at national level to involve all stakeholders.

United Nations Statistics Division
Report of the Secretary-General on Climate Change Statistics to the 49th session of the Statistical Commission
UNSD, in collaboration with UN-ECE and UNFCCC, prepared the Report of the Secretary-General on Climate Change Statistics to the 49th session of the Statistical Commission (E/CN.3/2018/14) (New York, 6-9 March 2018).https://unstats.un.org/unsd/statcom/49th-session/documents/2018-14-ClimateChange-E.pdf
Decision: 49/113https://unstats.un.org/unsd/statcom/49th-session/documents/Report-on-the-49th-session-E.pdf
Main decisionsFor countries: (i) Participate in the Pilot Survey on Climate Change-related Statistics and Indicators currently being undertaken by UNSD, as well as in the planned Global Consultation on Climate Change Statistics and Indicators; (ii) Enhance collaboration between national statistical offices (NSOs) and national authorities responsible for reporting climate change related information to UNFCCC Secretariat; For UNSD and UNFCCC: Strengthen the link between statistics and policy, for example, by: (i)undertaking joint initiatives in the development of climate change statistics and indicators; (ii) encouraging joint capacity building efforts and trainings with other partners, and exploring ways to encourage NSOs to be more involved in the preparation of data submissions to the UNFCCC secretariat, for supporting the implementation of the Paris Agreement.

United Nations Statistics Division
UNSD: Globalizing climate change statistics and indicators (current activities/plans)
UNSD:
• presented the SG’s Report on Climate Change Statistics to the 49th
session of the Statistical Commission (6-9 March 2018).
• has reviewed the UN-ECE and the IPCC/FDES frameworks and identified links to the Paris Agreement.
• is reviewing the UN-ECE list of indicators and consulting other lists (international organizations (UNFCCC, WMO, FAO), regional institutions (UNECE, ESCWA, ECLAC, OECD), research (IPCC) national agencies (US EPA, New Zealand EPA), national reports (National Adaptation Plans, National Communications) and NGOs (Climate Reality, World Resources Institute)
with a view to developing a suitable list prior to the Global Consultation.
• is developing a work plan based on the list of planned activities contained in the SG’s Report to the 49th session of the Stat. Commission.
• is planning to develop an inventory of related work on climate change statistics by partner organizations.
• is planning to conduct the Global Consultation in 2019/2020.

United Nations Statistics Division
UNSD: Globalizing climate change statistics and indicators (current activities/plans)
To strengthen the link between statistics and policy, UNSD is engaging closely with UNFCCC to develop the global set of climate change statistics and indicators. Some examples are:• Joint report to the 49th session of the Stat. Commission (with UN-ECE)
• Joint Side Event at the 49th session of the Stat. Comm. (with UN-ECE/FAO)
• UNFCCC participates in the Expert Group on Environment Statistics
• UNSD participated in the Workshop on national adaptation goals/indicators and their relationship with the SDGs and the Sendai Framework for Disaster Risk Reduction in Tokyo in July 2018. Main discussions as they relate to statistics:
(i) NSOs should be more engaged in the development of the national indicator reporting system on climate change given their experience in data compilation and dissemination, as well as their expertise in assessing data quality and availability which were stressed as fundamental to this work;
(ii) while integration of the three frameworks was seen as important it was also emphasized that this could be quite challenging as both the SDG and the Sendai indicator frameworks are intended for global monitoring while climate adaptation indicators are more applicable at sub-national levels due to the nature of adaptation in the local context resulting in different type of indicators; and
(iii) while it was stressed that global adaptation indicators should be established parallel to local indicators, the lack of data for effective monitoring was seen as a serious obstacle.

United Nations Statistics Division
5th EGES meeting – key points on climate change
Framework for Climate Change Statistics and Indicators:
Expert Group agreed to use the areas of the IPCC framework (drivers, impacts, vulnerability, mitigation, adaptation,) to structure the global set of statistics and indicators as it would create a direct link to international policy and reporting to UNFCCC through the Paris Agreement.
Global Set of Climate Change Statistics and Indicators:
Expert Group agreed that indicators should be based on IPCC framework and linked to UNFCCC through the Paris Agreement to strengthen relationship between statistics and policy. The set of indicators should be limited in number to provide clear guidance for policy makers and encourage an inclusive and universal set applicable to all countries. It was agreed that a limited core set with additional indicators developed in a tiering system to cater to countries with different concerns, priorities and capabilities would be useful.

United Nations Statistics Division
5th EGES meeting – key points on climate change
Role of National Statistical Offices (NSOs):Expert Group discussed that existing structures in a country may provide an entry point and the NSO could become the national aggregator of the climate change information by mining National Communications reported to UNFCCC and putting them into context. The role of the NSO was seen as providing transparency and in raising awareness of climate change as an issue among a broad range of stakeholders. Expert Group discussed that NSOs could play a more active role in the national climate change committees. Global Consultation on Climate Change Statistics and Indicators:Expert Group discussed that the Global Consultation should take place in 2019-2020 and the results be ready prior to the Global Stocktake of the Paris Agreement (first one in 2023) to be available to collectively assess progress and implementation to address the information needs of the Global Stocktake. Guidance to implement the Transparency Framework of the Paris Agreement will most probably be finalized at the COP24 in Dec 2018. The implementation guidance is expected to shed more light on the data reporting requirements of the Paris Agreement, so exact dates of when to conduct the Consultation will be determined in due course.

United Nations Statistics Division
Towards the global set of climate change indicators(consulted sources to date)
International and Regional Sources
• IPCC Reports
• WMO
• FAO
• FDES
• SDG Indicators
• SEEA
• ECE
• EEA
• Other Academic/NGO institutions or frameworks
National Sources (80 to date)
• State of environment reports
• UNFCCC National Communications
• National Adaptation Plans (NAPs)
• National environmental protection agencies
• National Statistics Offices (NSOs)
• Ministry websites
• Ministries of Environment
• Ministries of Natural Resources
• Ministries of Sustainable Development
• Ministries of Energy
• Bureaus of Meteorology

United Nations Statistics Division
Towards the global set of climate change indicators(consulted 80 national sources to date)
Australia
Kenya
Canada
Sri Lanka
Indonesia
Colombia
RussiaDenmark
UKIreland
China
Kazakhstan
Bangladesh
Japan
India
Pakistan
Maldives
Palestine
UAE
BurkinaFaso
NetherlandsSwitzerland
Egypt
Nigeria
Cameroon
Sudan
Togo
SouthAfrica
Argentina
Brazil
USA
Mexico
Angola
Austria
Barbados
Belarus
Belize
Bolivia
Chile
Ethiopia
Finland
France Germany
Georgia
Greece
Honduras
IranIraqIsrael
Italy Kyrgyzstan
Madagascar
Mongolia
Mozambique
Myanmar
Namibia
Philippines
Poland
Romania
Saudi Arabia
Spain
Botswana
Suriname
Tajikistan
Tanzania
Thailand
TurkeyTurkmenistan
Ukraine
Uruguay
Uzbekistan
Yemen Vietnam
Zambia
Zimbabwe
Afghanistan
Uganda

United Nations Statistics Division
Towards the global set of climate change indicators• In the growing list of climate change indicators, there are approximately 6000 indicators
related to Drivers, Impacts, Mitigation, Adaptation, and Vulnerability. Many of which are repeated across different countries and organizations.
• Indicators come from documents which published by national bodies, such as the M. of Environment or National Statistical Offices, which contain country-relevant information, at least one national source has been taken from 80 countries. Besides, international and regional sources such as SDG indicators, FDES, IPCC reports and ECE have been taken into account to identify other key indicators.
• Currently, most country-specific indicators come from State of Environment reports or UNFCCC National Communications. Data from ministries of energy, meteorology and natural resources has also been considered.
• The lack of availability of indicators in the list does not mean countries do not report them, rather they were not explicitly reported in the national source which was accessed.
• Presented are the 17 common indicators for Drivers, 34 indicators for Impacts, 16 indicators for Mitigation, 24 for Adaptation and 20 for Vulnerability. The common indicators occur often and cover the majority (about 6000) of reported indicators which have been extracted so far.

United Nations Statistics Division
Identifying the common indicators - Drivers
Common Indicators
Overall GHG emissions………………………………………………………... 133 72(includes emissions from CO2, CH4, N2O, PFCs, HFCs, SF6 and from production activities)
Waste generation (including wastewater)………………………….…. 120 38
Total energy consumption………………………………………………………… 105 54(indicates overall energy used by transport sector, household/capita, commercial and residential)
Area under land cover categories (land use/cover change)……………… 72 66
Use of pesticides/fertilizers………………………………………………………… 48 13
Livestock/cattle stock ………………………………………………………………… 39 29
Emission of NMVOC……………………………………………………………………. 28 28
Number of vehicles…………………………………………………………………….. 18 16
Numberof occurrences
(both national/int’l)
Countrieswhich have reported(out of 80 consulted)

United Nations Statistics Division
Identifying the common indicators - Drivers
Common Indicators
Energy intensity of the economy……………………………………………………. 18 12
Deforestation………………………………………………………………………………… 17 14
Total energy efficiency of the economy………………………………………… 11 8
SO2 emissions…………………………………………………………………..………….. 7 5
Emissions of ozone depleting substances (ODS)…………………………… 7 4
GHG emissions from land use/LULUCF………………………………………… 5 1
GHG emissions from households…………………………………………………. 4 2
Carbon intensity of energy for the economy………………………………… 4 1
CO2 emissions from fuel combustion…………………………………………… 3 2
Numberof occurrences
(both national/int’l)
Countrieswhich have reported(out of 80 consulted)

United Nations Statistics Division
Identifying the common indicators - Impact
Common Indicators
Occurrence of natural extreme events and disasters………… 176 50
Impact of natural extreme events and disasters……………….. 125 30
Agricultural production…………………………………………………….. 114 51
Air temperature………………………………………………………………… 107 63
Precipitation……………………………………………………………………… 90 59
Freshwater availability………………………………………………………. 83 47
Land degradation…………………………………………………………….... 70 32
Numberof occurrences
(both national/int’l)
Countrieswhich have reported(out of 80 consulted)

United Nations Statistics Division
Common Indicators
Water-related diseases and conditions…………………………… 50 36
Vector-borne diseases……………………………………………………. 47 34
Airborne diseases and conditions…………………………………… 46 29
Concentration of particulate matter or dust (PM10, PM2.5)……… 41 23
Sea level rise…………………………………………………………………….. 34 30
Insolation/ Cloudiness.……………………………………………………… 30 19
Surface winds……………………………………………………………………. 26 24
Identifying the common indicators - Impact
Numberof occurrences
(both national/int’l)
Countrieswhich have reported(out of 80 consulted)

United Nations Statistics Division
Identifying the common indicators - Mitigation
Common Indicators
Increase in forest area ………………………………………………………………………. 70 31
List of protected reserves to mitigate (forest/land/species/water etc.)……… 59 49
Renewable energy use in overall consumption…………………………………… 45 14
Share of climate change mitigation expenditure…...…………………………… 44 22
Share of energy and transport related taxes …………………………..…..……. 32 18
Sustainable practices and other preventive measures to mitigate........ 31 19
Environmental monitoring (early warning systems, regulations)………… 20 9
Progress towards reducing GHG emissions…………………………………………. 18 13
Numberof occurrences
(both national/int’l)
Countrieswhich have reported(out of 80 consulted)

United Nations Statistics Division
Common Indicators
Research and development (R&D) on mitigation efforts …………… 18 9Various developments related to mitigation……………………………… 15 10Total CC related subsidies and similar transfers/GDP………………… 15 6Policies in place to enhance climate change mitigation……………… 12 10Carbon sequestration and trading…………………………………………… 4 1Use of hybrid and electric vehicles…….……………………………………. 3 1Pro-environment activities and NGOs…………………………………..… 3 1Resilience…………………………………………………………………………………. 2 2
Identifying the common indicators - Mitigation
Numberof occurrences
(both national/int’l)
Countrieswhich have reported(out of 80 consulted)

United Nations Statistics Division
Identifying the common indicators - Adaptation
Common Indicators
Distribution and status of known species …………………………….. 112 48
Energy production or supply …………………..……………………………. 94 44
Use of water …………………………………………………………………………. 85 42
Expenditure for adaptation.……………………………………………………. 84 33
Area which is protected …………………………..…………………………… 64 47
Early warning systems, mitigation strategies, published…………. 62 19
forecasts accessible to the public
Number of climate-change-relevant plans/policies developed… 54 30
Population accessibility to water………………………………….............. 50 31
Numberof occurrences
(both national/int’l)
Countrieswhich have reported(out of 80 consulted)

United Nations Statistics Division
Identifying the common indicators - Adaptation
Common Indicators
Population living in hazard-prone areas…………………….…… 33 18
List & description of green/environmental taxes……………. 32 17
Utilization of adaptive agricultural methods or crops…….. 23 11
Energy intensity of economy or sectors…………………….…… 21 11
Use of renewable water resources…………………………………… 14 12
Progress in GHG emission reduction.………………………………… 14 11
Population accessibility to food………………………………………… 14 9
Production of food ……………………………………………………… 14 9
Carbon stock in soil…………………………………………………………… 7 5
Numberof occurrences
(both national/int’l)
Countrieswhich have reported(out of 80 consulted)

United Nations Statistics Division
Identifying the common indicators - Vulnerability
Common Indicators
Population living in coastal areas…………………………………………… 48 29
Threats to crops and vegetation……………………………………………. 42 26
Affects on fish production………................................................. 36 20
Vulnerability to the ecosystems…………………………………………….. 25 16
Vulnerability to water management …………………………………….. 22 9
Electricity price……………………………………………………………………… 21 17
Population living below the poverty line……………………………….. 18 17
Occurrences of extreme events/disasters……………………………… 18 10
Numberof occurrences
(both national/int’l)
Countrieswhich have reported(out of 80 consulted)

United Nations Statistics Division
Identifying the common indicators - Vulnerability
Common Indicators
Endangered/vulnerable species……………………………………………….. 15 10
Affects on Mortality rate (both infant and maternal)………………. 14 14
Various forms of risks (to species, water bodies and soil quality)……………….. 13 7
Vulnerability due to Exposure to various elements …………………. 12 7(consists of exposure to UV/electromagnetic radiations, noise, degraded air, PM and Ozone)
Threats to Vegetation Cover……………………………………………………….. 9 6
Vulnerability to Food Security……………………………………………………… 9 5
Incidence of vector borne diseases…………………………………………….. 6 6
Population living in slums……………………………………………………………. 6 4
Numberof occurrences
(both national/int’l)
Countrieswhich have reported(out of 80 consulted)
United Nations Statistics Division
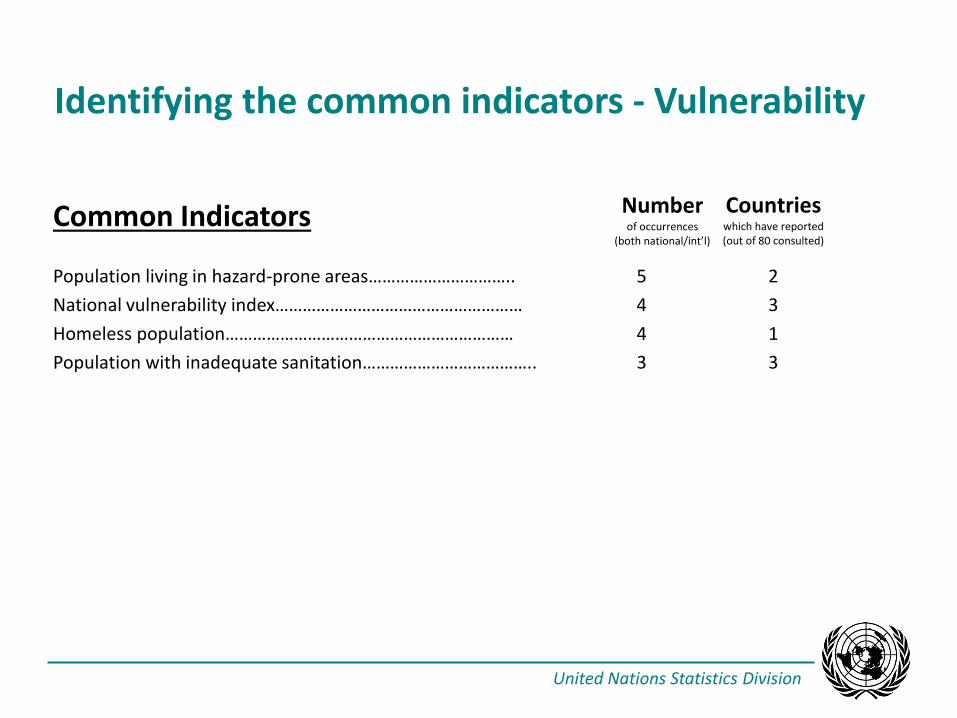
Identifying the common indicators - Vulnerability
Common Indicators
Population living in hazard-prone areas………………………….. 5 2
National vulnerability index……………………………………………… 4 3
Homeless population……………………………………………………… 4 1
Population with inadequate sanitation……………………………….. 3 3
Numberof occurrences
(both national/int’l)
Countrieswhich have reported(out of 80 consulted)

United Nations Statistics Division
Further work on the global set of climate change indicators
• Continue compilation of indicators from more sources and identification of common indicators.
• Review/compile metadata for the common indicators (maybe just Tier 1) to promote international applicability and harmonization.
• Continue to engage with UNFCCC and other partners to strengthen the link between statistics and policy, e.g., by: (i) undertaking joint initiatives in the development of climate change statistics and indicators; and (ii) encouraging joint capacity building efforts and training (e.g. UNFCCC will participate in a workshop on env. stats. for the Arab region organized by UNSD in collaboration with UN-ESCWA, UNEP and EEA – Beirut, Nov 2018).
• Ensure linkage of the work on the global set of indicators to:• the Adaptation Programme of UNFCCC (Article 7 - Paris Agreement);
• the Global Stocktake of the Paris Agreement (Article 14); and
• the Transparency Framework of the Paris Agreement (Article 13), given that the implementation guidance is expected to shed more light on the data reporting requirements of the Paris Agreement.