Global Self Storage IR Deck · NASDAQ: SELFNASDAQ:SELF Important Cautions Regarding Non-GAAP...
39
NASDAQ: SELF NASDAQ: SELF Corporate Presentation June 2018 Owner/Operator of Self Storage Properties in the Northeast, Mid-Atlantic and Midwest
-
Upload
hoangnguyet -
Category
Documents
-
view
214 -
download
0
Transcript of Global Self Storage IR Deck · NASDAQ: SELFNASDAQ:SELF Important Cautions Regarding Non-GAAP...
NASDAQ:SELFNASDAQ: SELF
NASDAQ: SELF
Corporate Presentation June 2018
Owner/Operator of Self Storage Properties in the Northeast, Mid-Atlantic and Midwest

NASDAQ:SELFNASDAQ: SELF
Legal Disclaimer
2
Cautionary Note Regarding Forward Looking StatementsCertain information presented in this presentation may contain “forward-looking statements” within the meaning of the federal securities laws, including the Private Securities Litigation Reform Act of 1995. Forward looking statements include statements concerning Global Self Storage, Inc's (the "Company") plans, objectives, goals, strategies, future events, future revenues or performance, capital expenditures, financing needs, plans or intentions relating to acquisitions or otherwise, and other information that is not historical information. In some cases, forward looking statements can be identified by terminology such as “believes,” “expects,” “estimates,” “may,” “will,” “should,” “anticipates” or “intends,” or the negative of such terms or other comparable terminology, or by discussions of strategy. All forward-looking statements by the Company involve known and unknown risks, uncertainties and other factors, many of which are beyond the control of the Company, which may cause the Company’s actual results to be materially different from those expressed or implied by such statements.
The Company may also make additional forward looking statements from time to time. All such subsequent forward-looking statements, whether written or oral, by the Company or on its behalf, are also expressly qualified by these cautionary statements. Investors should carefully consider the risks, uncertainties, and other factors, together with all of the other information included in the Company’s filings with the Securities and Exchange Commission (the “SEC”) and similar information. All forward-looking statements, including without limitation, the Company’s examination of historical operating trends and estimates of future earnings, are based upon the Company’s current expectations and various assumptions. The Company’s expectations, beliefs and projections are expressed in good faith, but there can be no assurance that the Company’s expectations, beliefs and projections will result or be achieved. All forward looking statements apply only as of the date made.
The Company undertakes no obligation to publicly update or revise forward looking statements which may be made to reflect events or circumstances after the date made or to reflect the occurrence of unanticipated events. There are a number of risks and uncertainties that could cause our actual results to differ materially from the forward-looking statements contained in or contemplated by this presentation. Any forward-looking statements should be considered in light of the risks referenced in the Company’s filings with the SEC.
Certain information contained in this presentation has been supplied by third parties. While the Company believes such sources are reliable, the Company cannot guarantee the accuracy of any such information and does not represent that such information is accurate or complete.
All Company financial results contained herein are qualified in their entirety by reference to the Company’s quarterly and annual reports, filings with the SEC and other related public disclosures.
This presentation shall not constitute an offer to sell or the solicitation of an offer to buy nor shall there be any sale of the securities in any state in which such offer, solicitation or sale would be unlawful under the securities laws of any such state.
Copyright © 2018 Global Self Storage, Inc. All Rights Reserved.

NASDAQ:SELFNASDAQ: SELF
Important Cautions Regarding Non-GAAP Measures and Same-Store Self Storage Operations DefinitionNon-GAAP MeasuresThis presentation contains certain non-GAAP financial measures. Funds from Operations (“FFO”) and FFO per share are non-GAAP measures defined by the National Association of Real Estate Investment Trusts (“NAREIT”) and are considered helpful measures of REIT performance by REITs and many REIT analysts. NAREIT defines FFO as a REIT’s net income, excluding gains or losses from sales of property, and adding back real estate depreciation and amortization. FFO and FFO per share are not a substitute for net income or earnings per share. FFO is not a substitute for GAAP net cash flow in evaluating our liquidity or ability to pay dividends, because it excludes financing activities presented on our statements of cash flows. In addition, other REITs may compute these measures differently, so comparisons among REITs may not be helpful. However, the Company believes that to further understand the performance of its stores, FFO should be considered along with the net income and cash flows reported in accordance with GAAP and as presented in the Company’s financial statements.
Adjusted FFO (“AFFO”) represents FFO excluding the effects of business development and acquisition related costs and non-recurring items, which we believe are not indicative of the Company’s operating results. We present AFFO because we believe it is a helpful measure in understanding our results of operations insofar as we believe that the items noted above that are included in FFO, but excluded from AFFO, are not indicative of our ongoing operating results. We also believe that the investment community considers our AFFO (or similar measures using different terminology) when evaluating us. Because other REITs or real estate companies may not compute AFFO in the same manner as we do, and may use different terminology, our computation of AFFO may not be comparable to AFFO reported by other REITs or real estate companies.
We believe net operating income or “NOI” is a meaningful measure of operating performance because we utilize NOI in making decisions with respect to, among other things, capital allocations, determining current store values, evaluating store performance, and in comparing period-to-period and market-to-market store operating results. In addition, we believe the investment community utilizes NOI in determining operating performance and real estate values, and does not consider depreciation expense because it is based upon historical cost. NOI is defined as net store earnings before general and administrative expenses, interest, taxes, depreciation, and amortization. A reconciliation of this measure to its most directly comparable GAAP measure is included in the Appendix to this presentation.
NOI is not a substitute for net income, net operating cash flow, or other related GAAP financial measures, in evaluating our operating results.
Same-Store Self Storage Operations DefinitionWe consider our same-store portfolio to consist of only those stores owned and operated on a stabilized basis at the beginning and at the end of the applicable periods presented. We consider a store to be stabilized once it has achieved an occupancy rate that we believe, based on our assessment of market-specific data, is representative of similar self-storage assets in the applicable market for a full year measured as of the most recent January 1 and has not been significantly damaged by natural disaster or undergone significant renovation or expansion. We believe that same-store results are useful to investors in evaluating our performance because they provide information relating to changes in store-level operating performance without taking into account the effects of acquisitions, dispositions or new ground-up developments. At March 31, 2018, we owned ten same-store properties and 1 non-same-store property.
The Company believes that by providing same-store results from a stabilized pool of stores, with accompanying operating metrics including, but not limited to variances in occupancy, rental revenue, operating expenses, NOI, etc., stockholders and potential investors are able to evaluate operating performance without the effects of non-stabilized occupancy levels, rent levels, expense levels, acquisitions or completed developments. Same-store results should not be used as a basis for future same-store performance or for the performance of the Company's stores as a whole.
3
NASDAQ:SELFNASDAQ: SELF
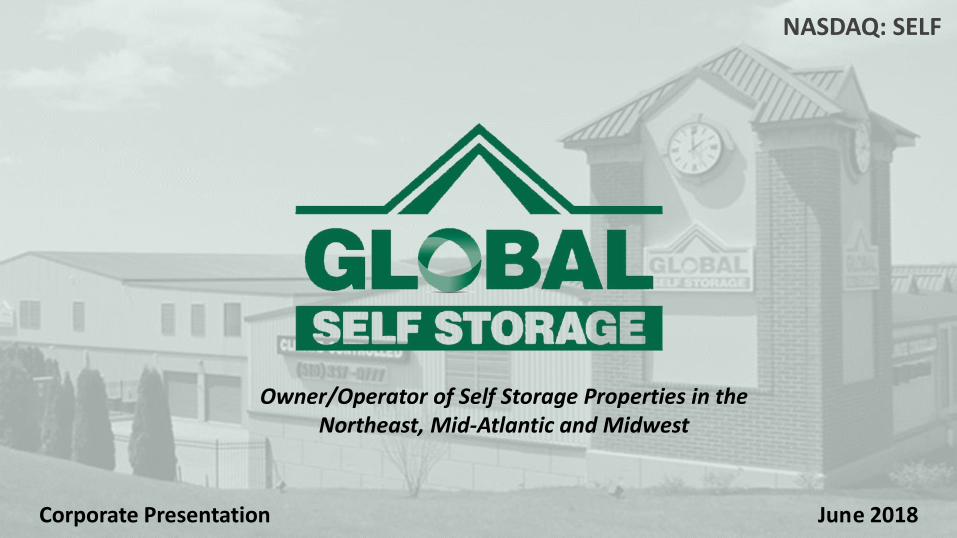
Share Price (6/4/18) $4.27
52 Week Low/High $3.92 / $4.64
Common Shares Out. (4/23/18)
7.7M
Free Float 7.3M
Avg. Daily Volume 3 mo. 11,065
Key Stats: SELF (NasdaqCM)
Market Cap$32.9M
Enterprise Value $50.2M
Dividends Per Share(Trailing 12 Months)
$0.26
Dividend Yield 6.1%
Fiscal Year End December 31
Insider Holdings(4/30/18)
6.6%
Source: Capital IQ, Yahoo! Finance, Global Self Storage, Inc. 4

NASDAQ:SELFNASDAQ: SELF
Who We Are
• Global Self Storage is a self-administered and self-managed real estate investment trust (“REIT”) that owns, operates, manages, acquires, develops and redevelops self storage properties
• We seek to acquire properties where our professional management and best practices can improve operations
• With our recent acquisitions, we now own and operate 11 self storage properties in the Northeast, Mid-Atlantic, and Midwest
• Our properties total 762,592 square feet of leasable space*
5* As of 3/31/18; Includes outside parking (RV, boat, auto), retail, office and commercial space.

NASDAQ:SELFNASDAQ: SELF
$33.8B
$40.2B
$50 .0K
$52 .0K
$54 .0K
$56 .0K
$58 .0K
$60 .0K
$62 .0K
$64 .0K
$66 .0K
$68 .0K
$70 .0K
$15 .0B
$17 .0B
$19 .0B
$21 .0B
$23 .0B
$25 .0B
$27 .0B
$29 .0B
$31 .0B
$33 .0B
$35 .0B
$37 .0B
$39 .0B
$41 .0B
$43 .0B
2017 2018 2019 2020 2021 2022
Projected U.S. Self Storage Market
Growth3
Revenue
Growing Self Storage Industry
• Households with a self storage unit have increased from 1 in 17 in 19961 to 1 in 11 today2
• U.S. self storage industry expected to reach $40.2B in 2022, up 19% from 20173
• Total self storage facilities nationwideexpected to surpass 60,000 by 20204
• Self storage acquisitions in 2016 totaled nearly $5.0 billion versus nearly $3.0 billion in 20155
1) https://www.storedge.com/the-growth-of-self-storage-market-for-improved-visibility2) http://www.selfstorage.org/LinkClick.aspx?fileticket=c_EHD-q5Pmc%3d&portalid=03) http://usdailyreview.com/self-storage-expected-to-grow-17-5-by-2022/4) https://www.sparefoot.com/self-storage/news/1443-storage-revenue-to-pass-30-billion-in-2018/5) http://mjpartners.com/research/market-reports/mjpartners-market-report-2015-4q.pdf 6

NASDAQ:SELFNASDAQ: SELF
Main Growth Driver: High Occupancy Rates
• Demand for storage units at all-time high, with average occupancy rates topping 92.8% in 2017
• Demand supports opportunity for greater price expansion
• Sophisticated operators have the ability to increase rents while maintaining occupancy
• The general decreasing trend for move-in rate discounting also supports higher average rents
7Source: 2018 Self Storage Almanac
75.7%79.7%
85.0%87.8% 89.1% 90.2% 91.2% 92.8%
$0. 3B
2010 2011 2012 2013 2014 2015 2016 2017
U.S. Self Storage Occupancy

NASDAQ:SELFNASDAQ: SELF
Focus on Secondary and Tertiary Markets Has Led to Outperformance of Peers
Global Self Storage has outperformed public peers that have experienced declining NOI growth due to increasing supply in top MSA markets
8Note: Based on information obtained in 2015 - 2017 reports on From 10-K filed with the SEC by self storage REIT peers (PSA, EXR, LSI, NSA, and CUBE).
9.4%
6.0%
0.0%
2.0%
4.0%
6.0%
8.0%
10.0%
SELF Public REITs
3 Year Avg. Same-Store Revenue Growth
12.2%
7.7%
0.0%
2.0%
4.0%
6.0%
8.0%
10.0%
12.0%
14.0%
SELF Public REITs
3 Year Avg. Same-Store NOI Growth

NASDAQ:SELFNASDAQ: SELF
Industry Opportunities
• Continued ownership consolidation with large and midsize operators purchasing facilities owned and managed by smaller operators
• Growing difference in operational management expertise between the larger, more sophisticated operators and the rest of the field
• Internet and technology making it easier for consumers to rent units
• Self-service kiosks, Internet marketing, 24/7 call centers
9

NASDAQ:SELFNASDAQ: SELF
Highly Fragmented Self Storage Market
5.8%
3.3%
2.1%
1.6%
3.4%
1.4%
• Top six publicly traded self storage companies (REITs & U-Haul) control only 18% of the market (7,780 properties)
• ~82% of the U.S. market share by square foot is not owned by a REIT
• ~33,000 of 44,000 self storage facilities in the U.S. are single owner-operators
• 74% of all self storage operators only manage one or two single properties
82%of U.S. market
non-REIT properties
10Source: 2018 Self Storage Almanac

NASDAQ:SELFNASDAQ: SELF
Our Portfolio of Self Storage Facilities
Facilities located in secondary or tertiary cities in the Northeast, Mid-Atlantic and Midwest
• Properties located near metropolitan areas
• Excellent road or highway exposure
• Prominent road-side signage
• Easily accessible
• Clean, well-maintained properties with minimal deferred maintenance
• Strong market fundamentals (demographics)
• High barriers to entry (zoning)
Facilities 11
Units 5,595
Leasable Sq. Ft. 762,592
Occupancy 92.4%
11
Dolton, IL
Merrillville,IN
Bolingbrook, IL
Sadsburyville, PA
Summerville I & II, SC
Rochester, NY
Lima, OH
Fishers, IN
Clinton, CT
Millbrook, NY
As of 3/31/18; Includes outside parking (RV, boat, auto), retail, office and commercial space.Occupancy includes the impact of increased vacancy due to completed expansion and redevelopment projects at our facilities

NASDAQ:SELFNASDAQ: SELF
8%Outdoor StorageBoats/Cars/RVs
Our Total 762,592 Leasable Square Feet
58%Traditional Indoor
Storage*
34%Climate Controlled
Storage
12*Includes non-storage space; Percentage figures as of 3/31/18

NASDAQ:SELFNASDAQ: SELF
Attracting and Retaining High Quality Tenants
13
• Focus on “tenant quality over tenant quantity” in our marketing and operational efforts
• Utilize referral marketing to generate new tenant inquiries
• Referrals generally produce our highest quality new tenants
• Strong internet and social media presence generate new tenant inquiries
• Select facilities offer referral discounts and complementary truck rental

NASDAQ:SELFNASDAQ: SELF
Why Customers Choose Us: High Quality Service & Facilities
• Property managers are encouraged to maintain the highest security and cleanliness standards
• Employees are motivated to deliver courteous, attentive customer service
• All facilities include on-site 24/7 rental and payment kiosks as well as 24/7 customer service call centers
• Our goal is to make our customers’ experience as pleasant and hassle-free as possible
Easy Gate Access24/7 Security Monitoring
24/7 Rental & Payment Kiosks14

NASDAQ:SELFNASDAQ: SELF
GAAP Earnings
3 Months Ended
March 31,2018
3 Months
Ended
March 31,
2017
Change % Change
Total Revenues $1,961,885 $1,749,626 $212,259 12.1%
Total Expenses $1,663,989 $1,555,105 $108,884 7.0%
Operating Income $297,896 $194,521 $103,375 53.1%
Net Income (Loss) $59,126 $(14,266) $73,392 NM
Net Income (Loss) Per Share $0.01 $(0.00) $0.01 NM
For further details, please refer to the Company’s First Quarter 2018 10-Q. 15
NASDAQ:SELFNASDAQ: SELF
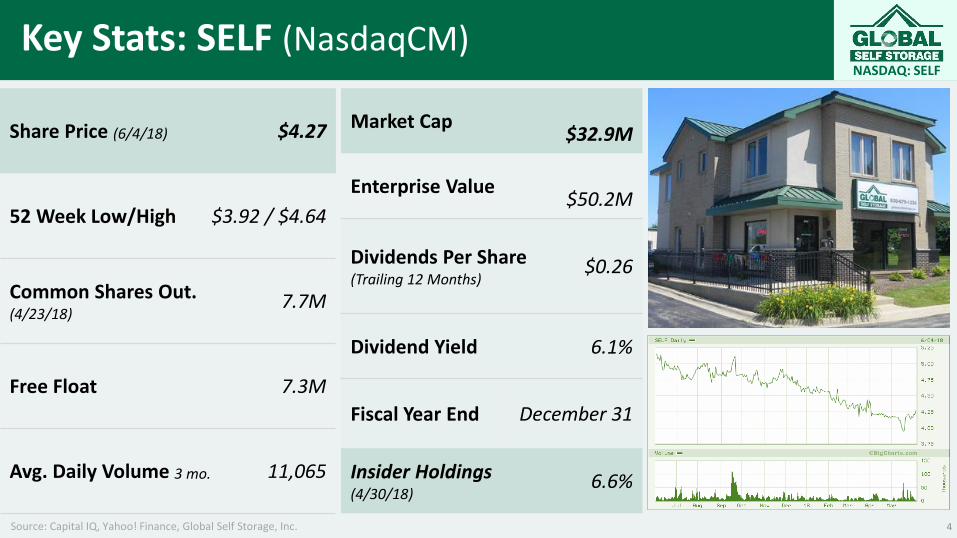
Same-Store Properties –Q1 2018 vs Q1 2017 Comparison
3 Months Ended
March 31,2018
March 31,2017
Change % Change
Revenues $1,775,254 $1,579,759 $195,495 12.4%
Costs of Operations $767,985 $633,710 $134,275 21.2%
Net Operating Income $1,007,269 $946,049 $61,220 6.5%
Sq. Ft. Occupancy 92.8% 89.1% 3.7% 4.2%
Annual Revenue/Leased Sq. Ft. $11.21 $10.36 $0.85 8.2%
For further details, please refer to the Company’s First Quarter 2018 10-Q. Same-store occupancy does not include the impact from the Merrillville, IN expansion project completed in January 2018. 16
NASDAQ:SELFNASDAQ: SELF
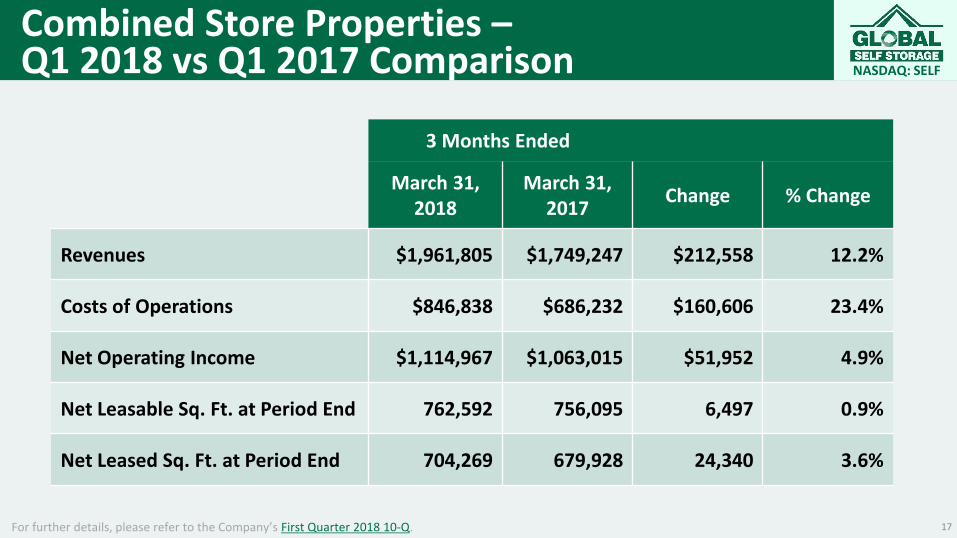
Combined Store Properties –Q1 2018 vs Q1 2017 Comparison
3 Months Ended
March 31,2018
March 31,2017
Change % Change
Revenues $1,961,805 $1,749,247 $212,558 12.2%
Costs of Operations $846,838 $686,232 $160,606 23.4%
Net Operating Income $1,114,967 $1,063,015 $51,952 4.9%
Net Leasable Sq. Ft. at Period End 762,592 756,095 6,497 0.9%
Net Leased Sq. Ft. at Period End 704,269 679,928 24,340 3.6%
For further details, please refer to the Company’s First Quarter 2018 10-Q. 17
NASDAQ:SELFNASDAQ: SELF
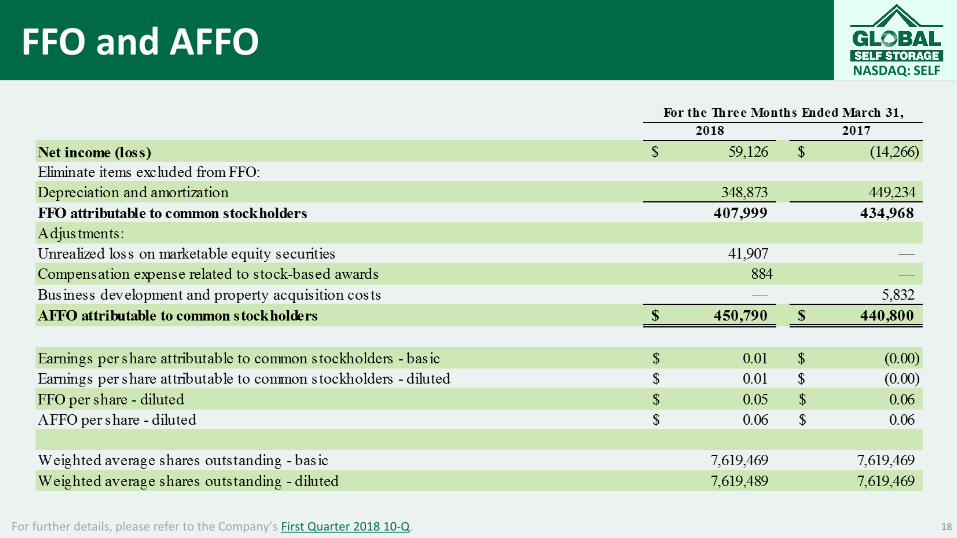
FFO and AFFO
18For further details, please refer to the Company’s First Quarter 2018 10-Q.

NASDAQ:SELFNASDAQ: SELF
Operational Progress by Facility
Year Opened
UnitCount
Leasable Sq. Ft.
Occupancy by Sq. Ft.1
Mar. 31, 2018 Mar. 31, 2017
Bolingbrook, IL 1997 778 111,500 93.2% 73.3%
Clinton, CT 1996 182 30,338 84.3% 83.5%
Dolton, IL 2007 652 86,590 93.1% 95.1%
Fishers, IN 2007 412 81,741 95.3% 90.3%
Lima, OH 1996 732 97,610 95.9% 95.0%
Millbrook, NY 2008 140 12,480 98.5% 90.0%
Rochester, NY 2010 637 68,061 97.0% 94.0%
Sadsburyville, PA 2006 691 78,842 90.4% 90.0%
Summerville I, SC 1990 557 72,700 90.7% 93.4%
Summerville II, SC 1997 249 42,910 84.5% 89.0%
*Merrillville, IN 2005 565 79,820 88.7% 97.6%
TOTAL 5,595 762,592 92.4% 89.9%
1) “Occupancy by square feet” includes the impact from expansion and redevelopment projects at our stores. 19
*Non-same stores
NASDAQ:SELFNASDAQ: SELF
20
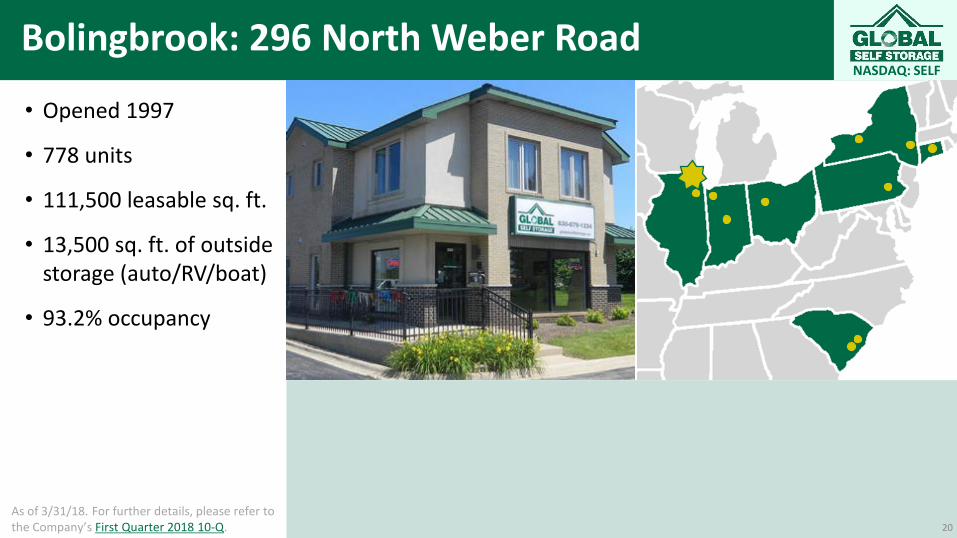
Bolingbrook: 296 North Weber Road
• Opened 1997
• 778 units
• 111,500 leasable sq. ft.
• 13,500 sq. ft. of outside storage (auto/RV/boat)
• 93.2% occupancy
20
As of 3/31/18. For further details, please refer to the Company’s First Quarter 2018 10-Q.

NASDAQ:SELFNASDAQ: SELF
21
Clinton: 6 Heritage Park Road
• 182 units
• 30,338 leasable sq. ft.
• 84.3% occupancy
• Operating under Company management since December 31, 2016
21
As of 3/31/18. For further details, please refer to the Company’s First Quarter 2018 10-Q.

NASDAQ:SELFNASDAQ: SELF
22
Dolton: 14900 Woodlawn Avenue
• Opened 2007
• 652 units
• 86,590 leasable sq. ft.
• 9,000 sq. ft. of outside storage (auto/RV/boat)
• 93.1% occupancy
22
As of 3/31/18. For further details, please refer to the Company’s First Quarter 2018 10-Q.
NASDAQ:SELFNASDAQ: SELF
23
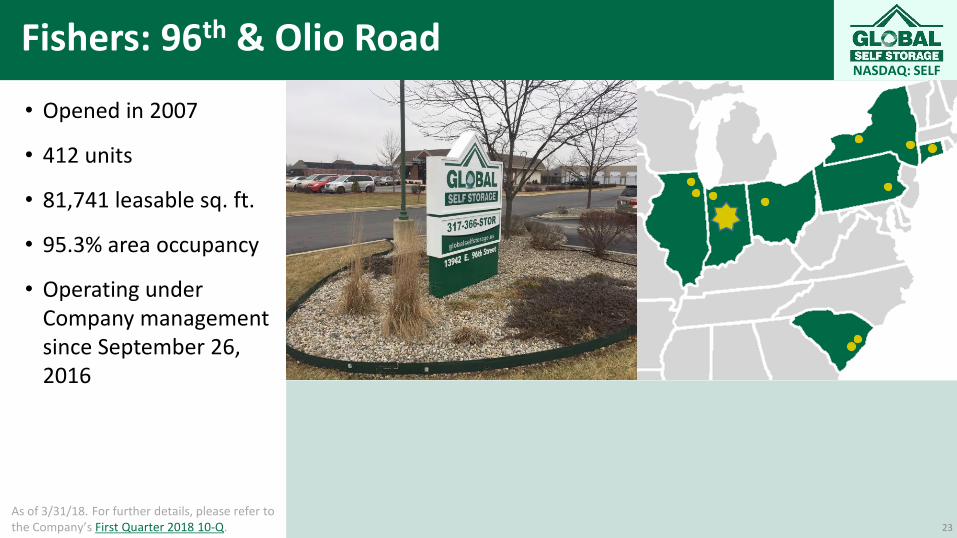
Fishers: 96th & Olio Road
• Opened in 2007
• 412 units
• 81,741 leasable sq. ft.
• 95.3% area occupancy
• Operating under Company management since September 26, 2016
23
As of 3/31/18. For further details, please refer to the Company’s First Quarter 2018 10-Q.

NASDAQ:SELFNASDAQ: SELF
24
Lima: 1910 W Robb Ave.
• 732 units
• 97,610 leasable sq. ft.
• 95.9% occupancy
• Operating under Company management since August 30, 2016
24
As of 3/31/18. For further details, please refer to the Company’s First Quarter 2018 10-Q.

NASDAQ:SELFNASDAQ: SELF
25
Millbrook: 3814 Route 44
• 140 units
• 12,480 leasable sq. ft.
• 98.5% occupancy
• Operating under Company management since December 31, 2016
Expecting to break ground in 2018 on the Millbrook store expansion, which, when completed, will add approximately 16,500 of gross square feet of all- climate- controlled units. The planning for the expansion is under development.
25
As of 3/31/18. For further details, please refer to the Company’s First Quarter 2018 10-Q.

NASDAQ:SELFNASDAQ: SELF
26
Rochester: 2255 Buffalo Road
• Opened 2010
• 637 units
• 68,061 leasable sq. ft.
• 97.0% occupancy
• Indoor, drive-thru, 100% climate controlled facility
26
As of 3/31/18. For further details, please refer to the Company’s First Quarter 2018 10-Q.
NASDAQ:SELFNASDAQ: SELF
27
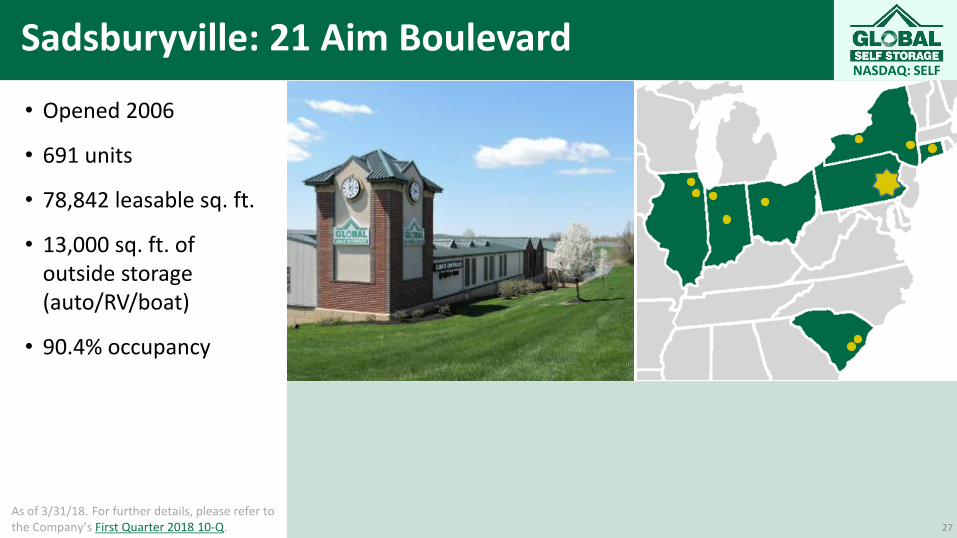
Sadsburyville: 21 Aim Boulevard
• Opened 2006
• 691 units
• 78,842 leasable sq. ft.
• 13,000 sq. ft. of outside storage (auto/RV/boat)
• 90.4% occupancy
27
As of 3/31/18. For further details, please refer to the Company’s First Quarter 2018 10-Q.
NASDAQ:SELFNASDAQ: SELF
28
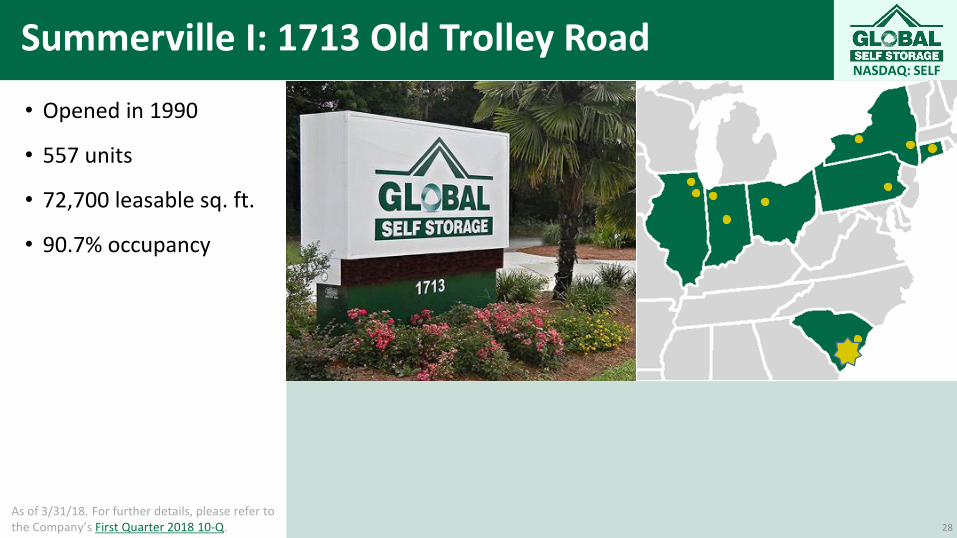
Summerville I: 1713 Old Trolley Road
• Opened in 1990
• 557 units
• 72,700 leasable sq. ft.
• 90.7% occupancy
28
As of 3/31/18. For further details, please refer to the Company’s First Quarter 2018 10-Q.

NASDAQ:SELFNASDAQ: SELF
29
Summerville II: 900 North Gum Street
• Opened 1997
• 249 units
• 42,910 leasable sq. ft.
• 7,200 sq. ft. of outside storage (auto/RV/boat)
• 84.5% occupancy
29
As of 3/31/18. For further details, please refer to the Company’s First Quarter 2018 10-Q.

NASDAQ:SELFNASDAQ: SELF
30
Merrillville: 6590 Broadway
• Opened in 2005
• 565 units
• 79,820 leasable sq. ft.
• 1,000 sq. ft. of outside storage (auto/RV/boat)
• 88.7% occupancy
The Merrillville store expansion was completed in January 2018 and added 13,300 leasable square feet of traditional drive-up storage units. As of March 31, 2018, 65.2% of the three-building expansion leasable square feet had been leased. Merrillville was a component of Non-Same Store results in Q1 2017.
30
As of 3/31/18. For further details, please refer to the Company’s First Quarter 2018 10-Q.

NASDAQ:SELFNASDAQ: SELF
Acquisition and Expansion Opportunities
• We seek to acquire facilities where our professional management can:
• Improve revenue rate management
• Increase occupancy rates
• Expand leasable square footage on existing property
• Convert lower-rent outdoor or traditional units into higher-rent climate controlled units
• Add additional revenue streams such as tenants stored items insurance premiums
31
74% of all self storage operators in the U.S. only
manage one or two properties
Lima, OH
Fishers, IN
Clinton, CT
Millbrook, NY

NASDAQ:SELFNASDAQ: SELF
Key Takeaways
• Total revenues increased 12.1% in the first quarter of 2018 compared to the same period a year ago. Operating income was up 53.1% in Q1 2018 compared to the same period a year ago.
• Same-store revenues were up 12.4% in Q1 2018 compared to Q1 2017. Same-store NOI was up 6.5% in Q1 2018 compared to Q1 2017.
• Combined store revenues were up 12.2% in the first quarter of 2018 compared to the first quarter of 2017. Combined store NOI was up 4.9% in Q1 2018 compared to Q1 2017.
• FFO per share totaled $0.05 per share and AFFO per share totaled $0.06 per share for Q1 2018.
• Pricing power leading to rental rate growth – maintaining occupancy while increasing rents.
• Company distributed $0.065 of dividends over the past 3 months.1
• Planned expansion of the Millbrook, NY store in 2018.
321) As of March 31, 2018
NASDAQ:SELFNASDAQ: SELF
NASDAQ: SELF
Global Self Storage Website:https://www.globalselfstorage.us/
Global Self Storage, Inc.Mark C. WinmillPresident and CEO New York, NY (212) 785-0900 [email protected]
Liolios Group, Inc.Scott Liolios or Najim Mostamand, CFA(949) [email protected]

NASDAQ:SELFNASDAQ: SELF
NASDAQ: SELF
Appendix
34

NASDAQ:SELFNASDAQ: SELF
Mark C. WinmillCEO & President
• Mark Winmill has served as CEO of the company since its inception in 2012 and has over 36 years of real estate investing experience
• Mr. Winmill has led the acquisition, development and management of over 50 projects valued at over $300 million since 1982, including over $55 million of self storage properties since 2012
• Prior to Global Self Storage, he was founder and CEO of Bull & Bear Securities, Inc. a nationwide discount broker, from 1987 until its sale to the Royal Bank of Canada in 1999
• He is a Trustee of two charitable foundations, numerous family trusts and a Director of two other companies
Thomas O’MalleyCFO, Treasurer & Vice President
• Thomas O’Malley has served as Chief Financial Officer, Chief Accounting Officer, Treasurer and Vice President since 2005
• Mr. O’Malley has over 30 years of financial and operating experience in the real estate, financial services, and investment management sectors
• Prior to joining the company, Mr. O’Malley was the assistant controller of the investment adviser Reich & Tang having previously been an audit manager at RSM (nee McGladrey)
• He is a certified public accountant
Donald Klimoski IIGeneral Counsel, Secretary, CCO & Vice President
• Donald Klimoski II has served as our General Counsel, Secretary, Chief Compliance Officer and Vice President since 2017
• Previously, Mr. Klimoski served as the Associate General Counsel of Commvault Systems, Inc., a publicly traded company listed on NASDAQ, from 2014 to 2017
• Prior to leaving private practice, Mr. Klimoski was an associate at Sullivan and Cromwell LLP, where his practice focused on mergers and acquisitions, securities law, corporate governance, intellectual property and related matters, from 2008 to 2014
• He is admitted as a member of the New York and New Jersey State Bars and the United States Patent and Trademark Office
Coe G. EldredgeReal Estate Acquisition Consultant
• Coe Eldredge has served as an acquisitions review and development consultant for the Company since 2012 and has over 27 years of real estate investing and development experience
• Mr. Eldredge has participated in the acquisition and development of over $55 million of self storage properties
• Prior to his experience with Global Self Storage, and as the president of University Group, Purcellville, VA, during his long experience he has been involved in over 100 real estate projects valued at over $100 million. The University Group designs, builds and renovates homes, office buildings and light commercial spaces as well as provides consulting services for various commercial projects, specializing in self storage
Robert J. MathersProperty Operations, Vice President
• Robert Mathers has served as Vice President, Property Operations of the company since its inception in 2012
• Mr. Mathers has over 30 years of real estate property operations management experience
Ryan DayhoffCustomer Operations, Vice President
• Ryan Dayhoff has served as Vice President, Customer Operations of the company since 2017
• Mr. Dayhoff has over 13 years of experience leading the implementation of self storage processes and procedures, including customer operations, talent acquisition and assimilating new properties
• Previously, Mr. Dayhoff served as a District Manager at Extra Space Storage, from 2007 to 2017
Russell KamermanAsst. General Counsel, Asst. Secretary, Asst. CCO & Vice President
• Russell Kamerman has served as our Assistant General Counsel, Assistant Secretary, Assistant Chief Compliance Officer and Vice President since 2014
• Previously, Mr. Kamerman was an associate at Fried, Frank, Harris, Shriver & Jacobson LLP and Kleinberg, Kaplan, Wolff & Cohen, P.C., where his practice focused on asset management, securities law, compliance, and other corporate matters, from 2008 to 2014
• He is admitted as a member of the New York State Bar 35
Management Team

NASDAQ:SELFNASDAQ: SELF
Balance Sheet (unaudited)
36For further details, please refer to the Company’s 2018 10-Q for the period ended March 31, 2018.

NASDAQ:SELFNASDAQ: SELF
Income Statement (unaudited)
37For further details, please refer to the Company’s 2018 10-Q for the period ended March 31, 2018.

NASDAQ:SELFNASDAQ: SELF
Reconciliation of GAAP Net Income to Same-Store Net Operating Income
38For further details, please refer to the Company’s 2018 10-Q for the period ended March 31, 2018.

NASDAQ:SELFNASDAQ: SELF
Reconciliation of GAAP Net Income to Combined Store Net Operating Income
39For further details, please refer to the Company’s 2018 10-Q for the period ended March 31, 2018.