Global Polio Partners Group Monitoring Framework for the...
16
Monitoring Framework for the GPEI Polio Eradication & Endgame Strategic Plan High Level Meeting of the Global Polio Partners Group (PPG) 16 June 2014 Global Polio Partners Group
Transcript of Global Polio Partners Group Monitoring Framework for the...

Monitoring Framework for the GPEI Polio Eradication & Endgame Strategic Plan
High Level Meeting of the
Global Polio Partners Group (PPG) 16 June 2014
Global Polio Partners Group

Objectives
• Explain the context & development of the framework
• Obtain feedback on the updated monitoring framework
• Share draft examples of future reporting
• Answer questions & receive input

Monitoring Framework: Context
At the Nov 2013 PPG meeting, donors requested an updated monitoring framework of the Polio Eradication & Endgame Strategic Plan 2013-2018. The Polio Steering Committee (PSC) committed to address the issue. The updated monitoring framework: • enables tracking of progress across all 4 objectives on a 6-monthly basis
• uses data that supports operations management
• reflects the results orientation underpinning the GPEI strategy
• is more relevant for donors and other stakeholders

Existing data / data collection processes
Framework, scorecard, dashboards
Results monitoring framework
O u t c o m e s O u t p u t s A c t i v i t i e s I n p u t s
- Typically, at Working Group level - Focus mostly on inputs, activities - Many monthly indicators, some quarterly
- management focus (outputs, performance indicators)
- Quarterly indicators & trends
informs …
informs
Donors report - Every 6 months - Synthetic view of what “good”, or “on track” looks like (mostly outputs and outcomes) - Built from the POB scorecard, risk register and Working Group trackers/ dashboards
POB scorecard
operational trackers / dashboards

Impact
Outcomes
Outputs
Inputs / Activities
WPV = 0 VDPV = 0
High population immunity
Supplemental Immunization Activities (SIAs) •High access •High quality/coverage •Adequate frequency/ right Vaccine mix
• Financial
Repo
rted
for E
ndem
ic, r
e-in
fect
ed a
nd a
t-ris
k co
untr
ies
Repo
rted
G
loba
lly?
High virus detection capacity
Surveillance •High coverage/reach •High quality/sensitivity •Timeliness
Re-introduction risk reduction •RI strengthening •Travellers vaccination •Containment •IPV introduction •tOPV/bOPV switch
• IPV Campaigns
Outbreak response
• TBD • TBD
Innovations
• Human • Vaccines • Policy development
Support all outputs
Low risk of re-introduction
Results monitoring framework

Impact
Outcomes
Outputs
Inputs / Activities
WPV = 0 VDPV = 0
High population immunity
Supplemental Immunization Activities (SIAs) • % children inaccessible • LQAS or monitoring data (or 0-dose) • per SIA calendar
• Financial
Results monitoring framework: Indicators
Repo
rted
for E
ndem
ic, r
e-in
fect
ed a
nd a
t-ris
k co
untr
ies
Repo
rted
G
loba
lly?
High virus detection capacity
Surveillance • % provinces with npAFP > 2 • stool adequacy • lab receipt to case confirmed TAT
Re-introduction risk reduction • % decrease in unimmunized children • Containment TBD (in process) • IPV introduced in all OPV-using countries by end 2015.
• IPV Campaigns
Outbreak response
• TBD • TBD
Innovations
• Human • Vaccines • Policy development
Support all outputs
Low risk of re-introduction
per performance standards of speed of response, reach, effectiveness ( transmission interruption in 4 months)
Cases maps
% 0-dose npAFP rate
Current-year cash + multi-year funding (FRR)
% time below supply buffer Vacancies %
Ad-hoc until innovations mainstreamed
In red: milestones?
Donor Report Examples
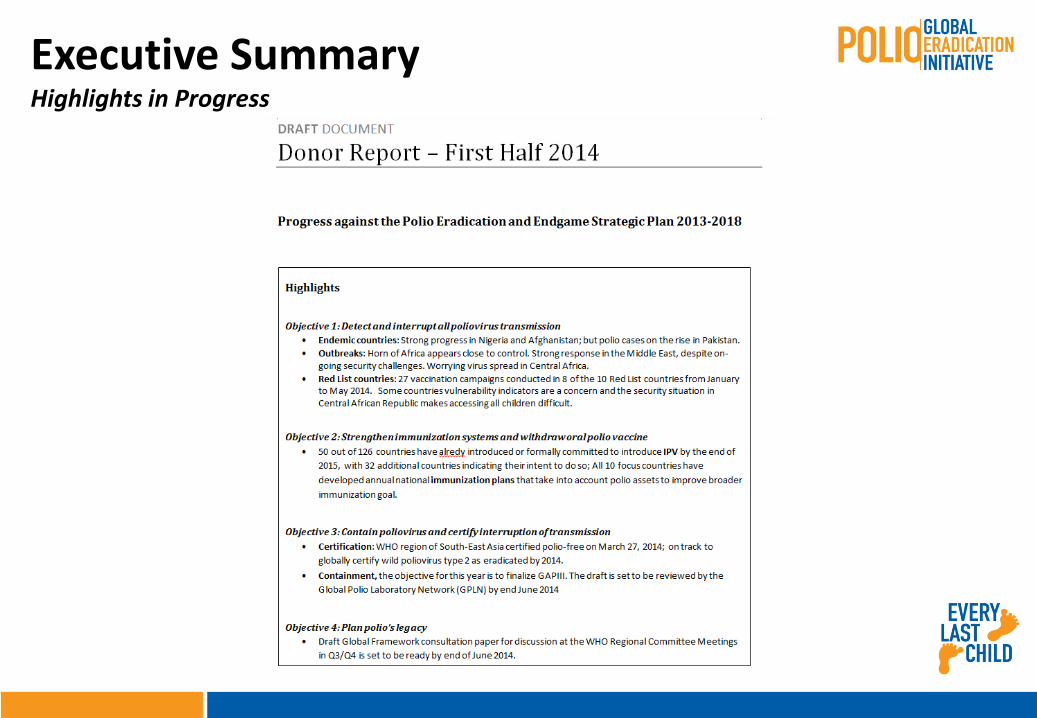
Executive Summary Highlights in Progress

Tracking of progress across all 4 objectives

Monitoring progress Annex 2 – Endemic Country Monitoring (In the actual report, this annex will include three tables, one for Nigeria, one for Afghanistan and one for Pakistan; and values will be provided for all indicators)
Endemic Countries State/Area outcome indicator Target H1 H2 H1 H2
Interrupt transmission number of cases -> 0 case 10
% 0-dose <10% 1.9
LQAS >= 90% Dec 75%
% inaccessible <5%% children missed due to child not being seen
<2.5%
% children missed - refusal <1%
% of refusal children among WPV cases <30%
Freqency and type of activities per plan
non polio AFP rate > 2 per 100,000 4.7
stool adequacy > 80% 89.8
lab receipt to case confirm < 7 days
Low risk of reintroductionRI improvement: annual reduction in number of unimmunized children >10%
Interrupt transmission number of cases 0 case
% 0-dose <10% 0.7
LQAS >= 90%
% inaccessible <5%
Freqency and type of activities per plan
non polio AFP rate > 2 per 100,000 5.1
stool adequacy > 80% 97%
lab receipt to case confirm < 7 days
RI improvement: annual reduction in number of unimmunized children
>10%
IPV introduction intro by 2015
Containment TBD
Certification TBD
objective 1 objective 3
objective 2 objective 4
Nigeria
high population immunity
high virus detectionRest
of country
Low risk of reintroduction**
2014
high virus detection
high population immunity
2015
North Central (Kano, Katsina,
Jigawa, Kaduna)

Monitoring progress
Outbreak Countries * outcome indicator Target H1 H2
Initial responsiveness Emergency declared + plan drafted within 72 hours
Timing of 1st response =< 4 weeks 2 campaigns
SIAs plan execution >= 3 campaigns within first 3 months
interim assessment Conducted at 3 monthsfinal assessment Conducted at 6 months
Interrupt transmission within 4 months
number of cases 0 case after 4 months 4
% 0-dose <10% 18.2
LQAS >= 90% Jul SIA: 9%
% inaccessible <5%
Freqency and type of activities per plan
AFP rate > 2 per 100,000 3
stool adequacy > 80% 77.2
lab receipt to case confirm < 7 daysRI improvement: annual reduction in number of unimmunized children
>10%
IPV introduction intro by 2015Containment TBD
* List all countries affected by outbreak / included in outbreak response objective 1 objective 3objective 2 objective 4
year of outbreak
Follow-on Response
Initial Response
Central/Western Africa
All
Cameroon
high population immunity
high virus detection
Low risk of reintroduction
Annex 3 – Outbreak monitoring – Central Africa example (In the actual report, this annex will include three tables, one for each active outbreak: Central Africa, Horn of Africa, Middle East. values will be provided for all indicators)

Tracking of progress across all 4 objectives
13
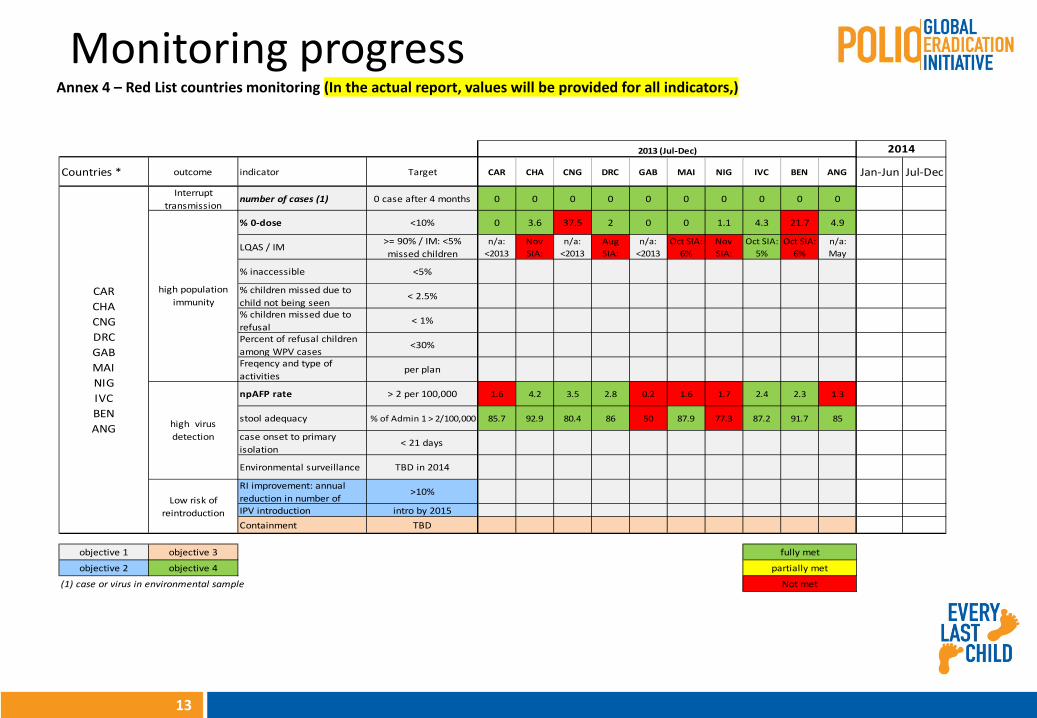
Countries * outcome indicator Target CAR CHA CNG DRC GAB MAI NIG IVC BEN ANG Jan-Jun Jul-Dec
Interrupt transmission
number of cases (1) 0 case after 4 months 0 0 0 0 0 0 0 0 0 0
% 0-dose <10% 0 3.6 37.5 2 0 0 1.1 4.3 21.7 4.9
LQAS / IM >= 90% / IM: <5% missed children
n/a:<2013
Nov SIA:
n/a:<2013
Aug SIA:
n/a:<2013
Oct SIA:6%
Nov SIA:
Oct SIA:5%
Oct SIA:6%
n/a:May
% inaccessible <5%
% children missed due to child not being seen
< 2.5%
% children missed due to refusal
< 1%
Percent of refusal children among WPV cases
<30%
Freqency and type of activities
per plan
npAFP rate > 2 per 100,000 1.6 4.2 3.5 2.8 0.2 1.6 1.7 2.4 2.3 1.3
stool adequacy % of Admin 1 > 2/100,000 85.7 92.9 80.4 86 50 87.9 77.3 87.2 91.7 85
case onset to primary isolation
< 21 days
Environmental surveillance TBD in 2014
RI improvement: annual reduction in number of
>10%
IPV introduction intro by 2015Containment TBD
objective 1 objective 3
objective 2 objective 4
(1) case or virus in environmental sample
fully met
partially met
Not met
2014
CARCHACNGDRCGABMAINIGIVCBENANG
high population immunity
high virus detection
Low risk of reintroduction
2013 (Jul-Dec)
Monitoring progress Annex 4 – Red List countries monitoring (In the actual report, values will be provided for all indicators,)

outcome indicator Target H1 H2 H1 H2 H1 H2 H1 H2 H1
Financing: 12-month cash gap 0
Financing: Strategy funding gap
Staffing: Percent ofapproved posts vacant <10%
high population immunityVaccine supply: % of weeks forecast goes below buffer in next 6 months
<10%
number of OPV using countries introducing IPV in Routine.
Per IMG
Increase in coverage of RI in 10 focus countries
Per IMG
Certification &Containment: TBD
2014 Type 22014 GAP III
Legacy Planning Consultations: inputs into plan by end 2014
objective 1 objective 3
objective 2 objective 4
2017 20
Low risk of reintroduction
All
2014 2015 2016
Monitoring progress Annex 5 – Global Level Monitoring

Feedback to date • Donors welcomed efforts to improve monitoring framework
• Agreed with structure/logic. Suggestions to make it more intuitive
• Importance of information on progress on a six monthly basis
• Include financial and community demand information
• Need for high level/global level information for senior leaders and politicians - information to digest quickly. More detail can be tiered
• Indicators which show progress on routine immunization
• Importance of activity information (e.g. number of campaigns) that demonstrate scale of programme
• Limit GPEI transaction costs of producing reports
• Include information on how quality of data is measured.

Next Steps
• Incorporate any final input
• Produce August report covering 1st half 2014