Global & North America Log & Lumber Dynamics Fit for Quebec flottantes... · 5/13/2015 · 5 What...
41
Global & North America Log & Lumber Dynamics – Fit for Quebec QFIC Annual Meeting May 13, 2015 Quebec City, PQ By: Russell Taylor, President
Transcript of Global & North America Log & Lumber Dynamics Fit for Quebec flottantes... · 5/13/2015 · 5 What...

Global & North
America Log &
Lumber Dynamics –
Fit for Quebec
QFIC Annual Meeting
May 13, 2015 Quebec City, PQ
By: Russell Taylor, President
2a
Introduction to:
International WOOD MARKETS Group
• We are wood products industry consultants and we
assist companies around the world to develop
operational, marketing & business strategies.
• We are known as global market & industry
experts/analysts on timber, lumber, panels & many
millwork products sold in the U.S. & global markets.
• We have had an office in China since 2005.
• We produce 8 Multi-Client Reports: Global Timber &
Lumber Benchmarking; Clearwood Pine Lumber/
Mouldings; Russia 5-Yr. Outlook; China 5-Yr. Outlook;
WOOD Markets – North America 5-Yr. Outlook;
WOOD Markets Monthly Report, China Bulletin
3
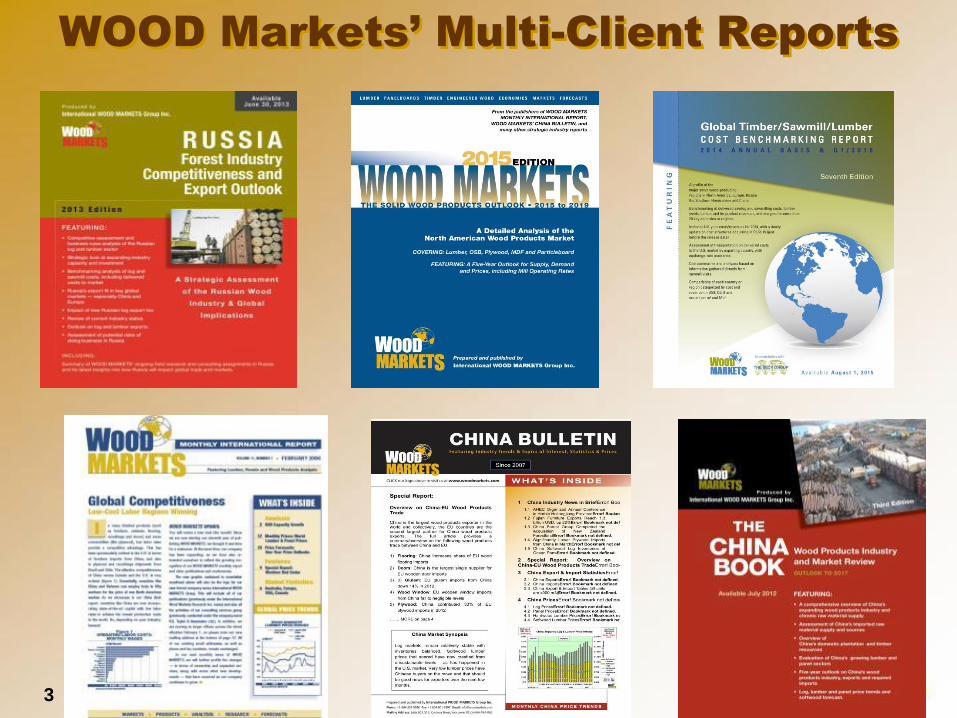
WOOD Markets’ Multi-Client Reports
4
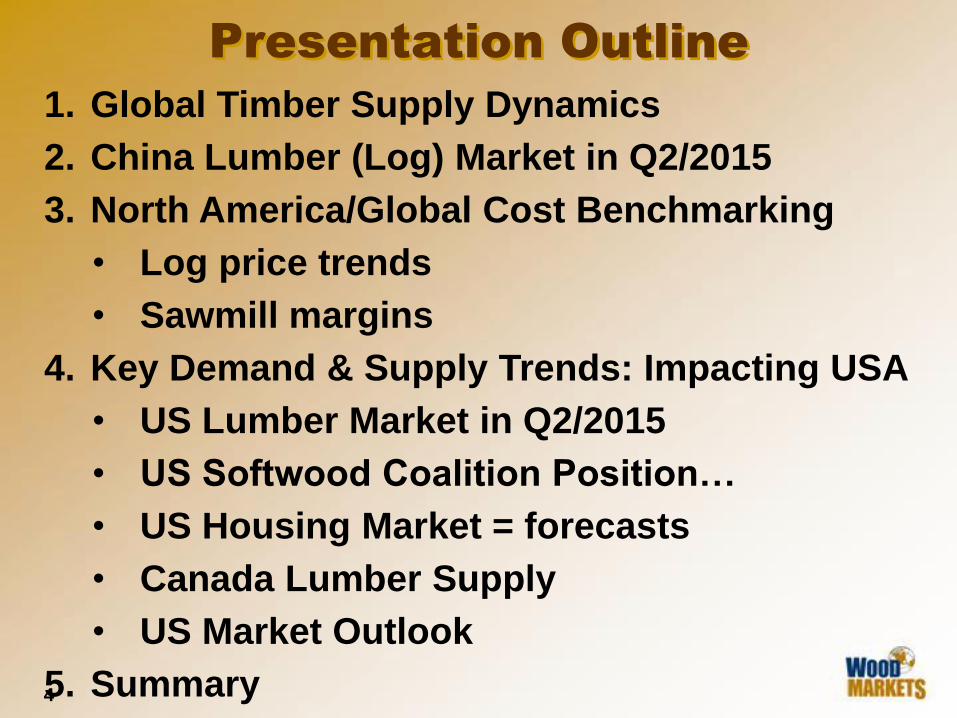
Presentation Outline
1. Global Timber Supply Dynamics
2. China Lumber (Log) Market in Q2/2015
3. North America/Global Cost Benchmarking
• Log price trends
• Sawmill margins
4. Key Demand & Supply Trends: Impacting USA
• US Lumber Market in Q2/2015
• US Softwood Coalition Position…
• US Housing Market = forecasts
• Canada Lumber Supply
• US Market Outlook
5. Summary
5
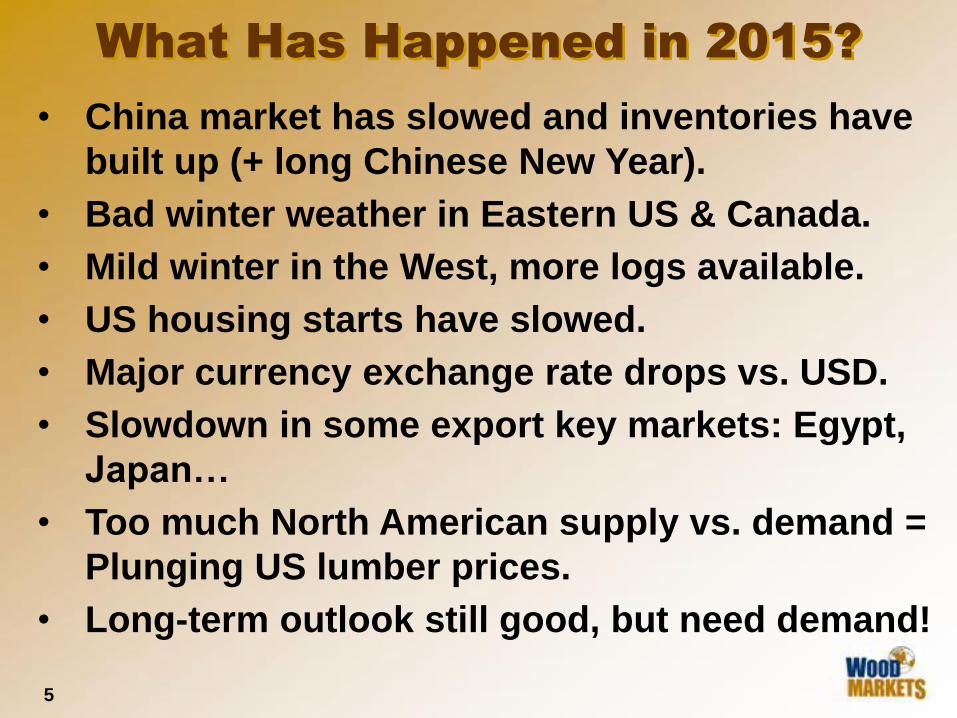
What Has Happened in 2015?
• China market has slowed and inventories have
built up (+ long Chinese New Year).
• Bad winter weather in Eastern US & Canada.
• Mild winter in the West, more logs available.
• US housing starts have slowed.
• Major currency exchange rate drops vs. USD.
• Slowdown in some export key markets: Egypt,
Japan…
• Too much North American supply vs. demand =
Plunging US lumber prices.
• Long-term outlook still good, but need demand!
6
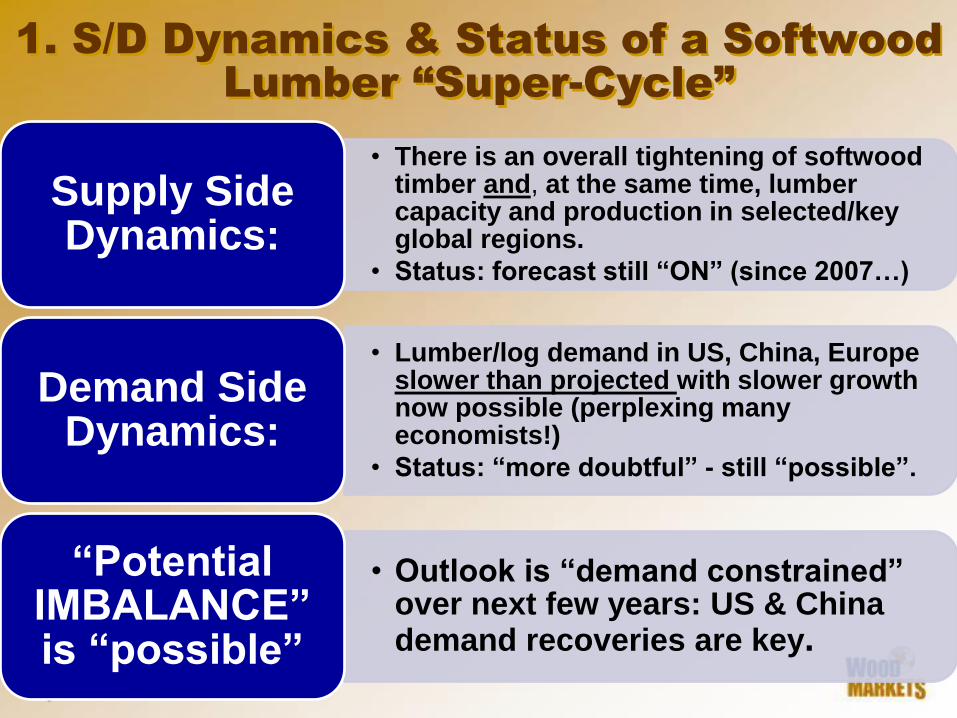
1. S/D Dynamics & Status of a Softwood
Lumber “Super-Cycle”
• There is an overall tightening of softwood timber and, at the same time, lumber capacity and production in selected/key global regions.
• Status: forecast still “ON” (since 2007…)
Supply Side Dynamics:
• Lumber/log demand in US, China, Europe slower than projected with slower growth now possible (perplexing many economists!)
• Status: “more doubtful” - still “possible”.
Demand Side Dynamics:
• Outlook is “demand constrained” over next few years: US & China demand recoveries are key.
“Potential IMBALANCE” is “possible”
7
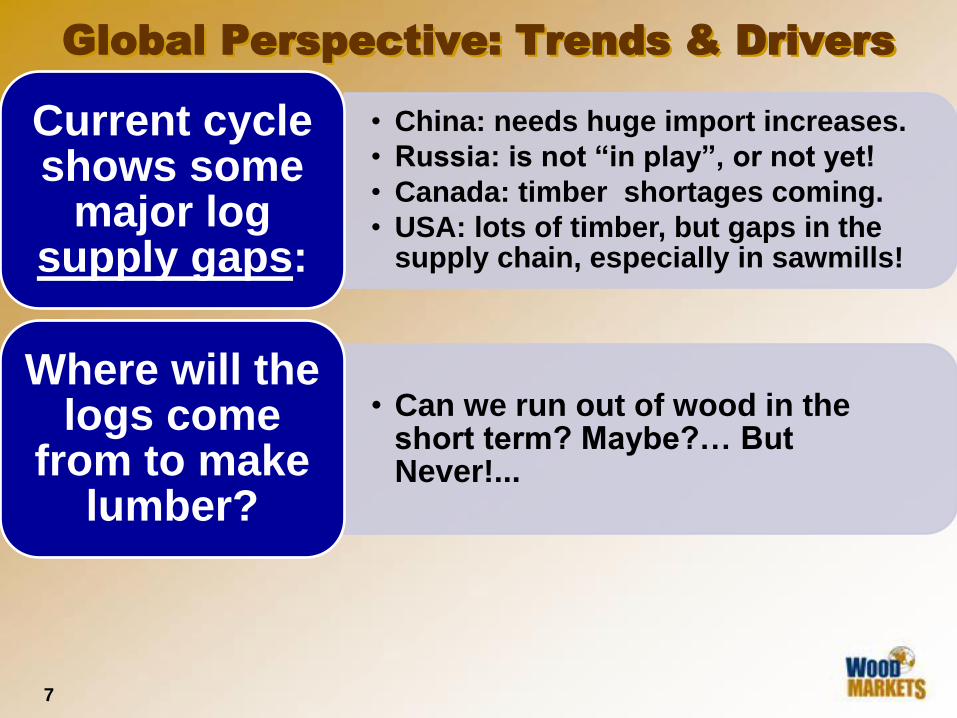
• China: needs huge import increases.
• Russia: is not “in play”, or not yet!
• Canada: timber shortages coming.
• USA: lots of timber, but gaps in the supply chain, especially in sawmills!
Current cycle shows some
major log supply gaps:
• Can we run out of wood in the short term? Maybe?… But Never!...
Where will the logs come
from to make lumber?
Global Perspective: Trends & Drivers
8
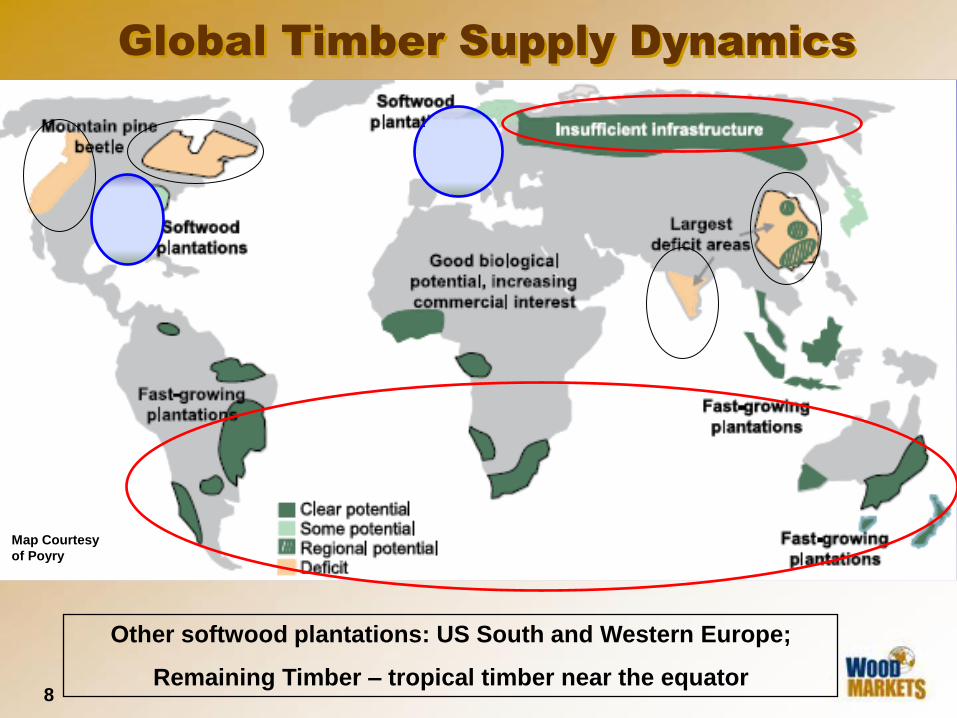
Global Timber Supply Dynamics
Other softwood plantations: US South and Western Europe;
Remaining Timber – tropical timber near the equator
Map Courtesy
of Poyry
9
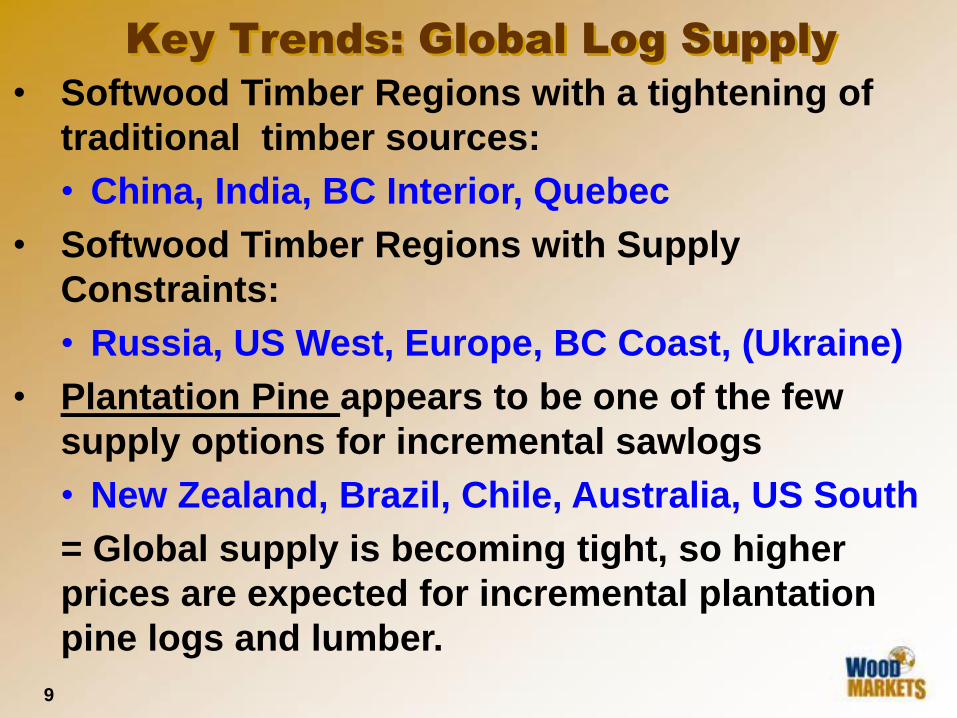
Key Trends: Global Log Supply
• Softwood Timber Regions with a tightening of
traditional timber sources:
• China, India, BC Interior, Quebec
• Softwood Timber Regions with Supply
Constraints:
• Russia, US West, Europe, BC Coast, (Ukraine)
• Plantation Pine appears to be one of the few
supply options for incremental sawlogs
• New Zealand, Brazil, Chile, Australia, US South
= Global supply is becoming tight, so higher
prices are expected for incremental plantation
pine logs and lumber.
10
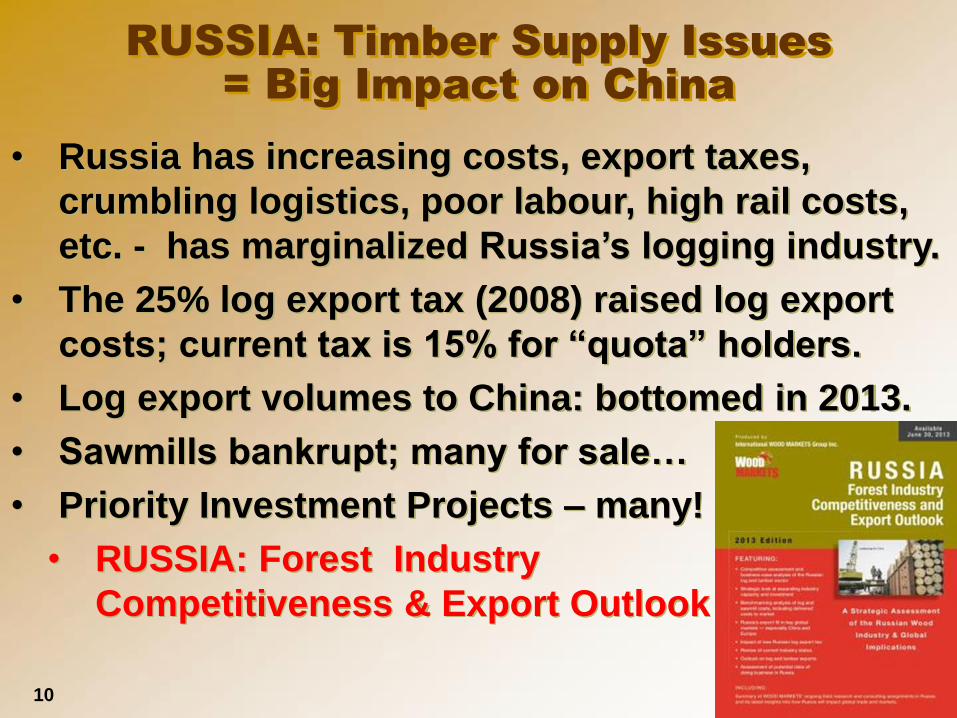
• Russia has increasing costs, export taxes,
crumbling logistics, poor labour, high rail costs,
etc. - has marginalized Russia’s logging industry.
• The 25% log export tax (2008) raised log export
costs; current tax is 15% for “quota” holders.
• Log export volumes to China: bottomed in 2013.
• Sawmills bankrupt; many for sale…
• Priority Investment Projects – many!
• RUSSIA: Forest Industry
Competitiveness & Export Outlook to 2018
RUSSIA: Timber Supply Issues
= Big Impact on China
11
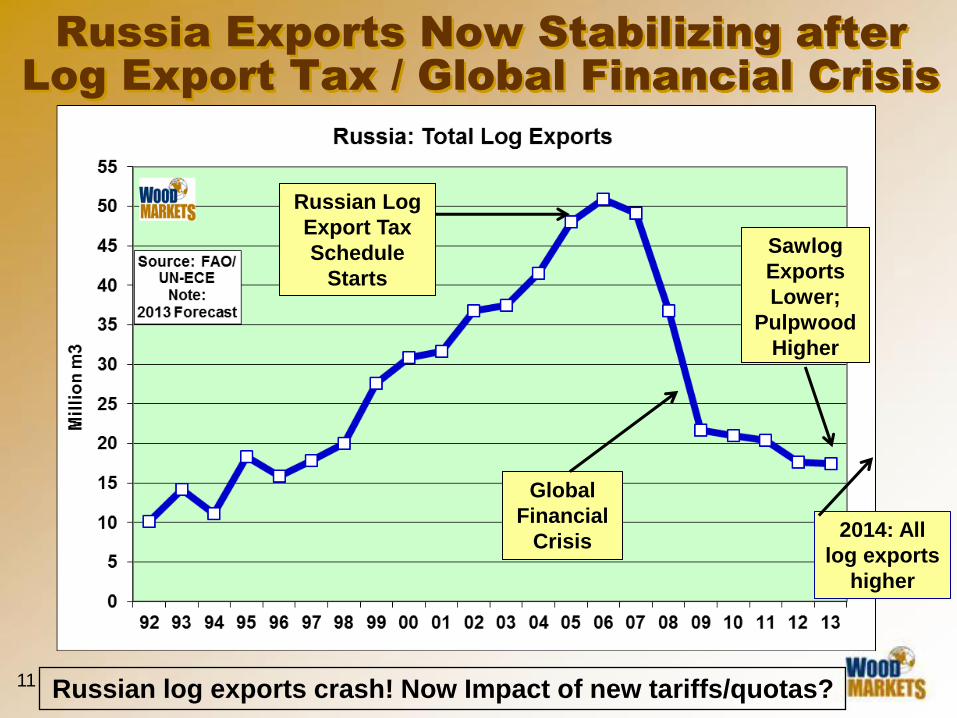
Russia Exports Now Stabilizing after
Log Export Tax / Global Financial Crisis
Russian log exports crash! Now Impact of new tariffs/quotas?
Russian Log
Export Tax
Schedule
Starts
Global
Financial
Crisis
Sawlog
Exports
Lower;
Pulpwood
Higher
2014: All
log exports
higher
12
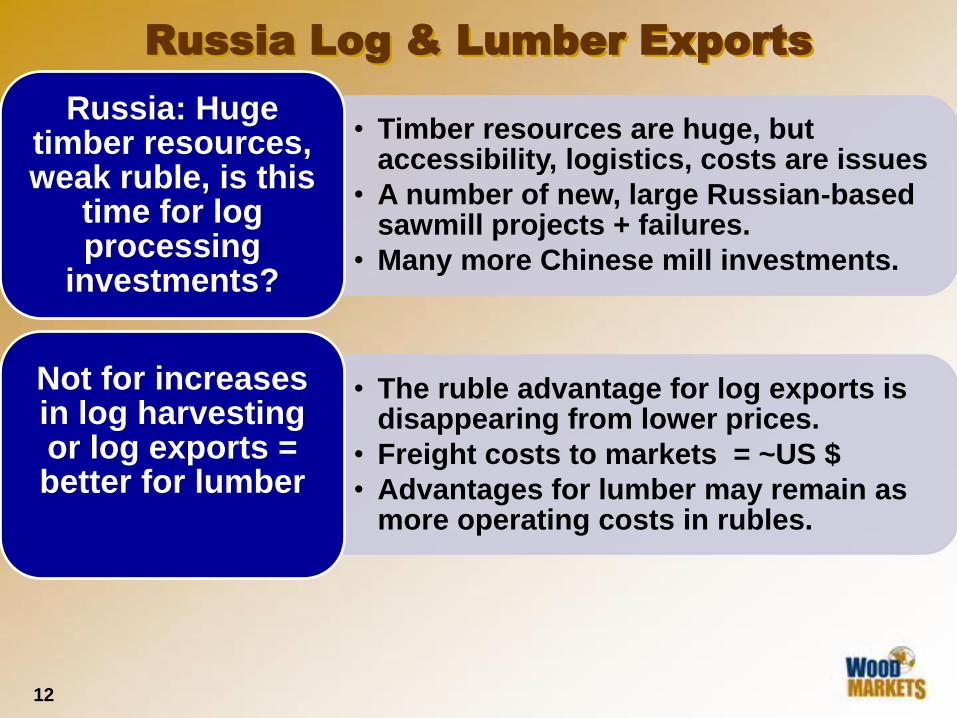
• Timber resources are huge, but accessibility, logistics, costs are issues
• A number of new, large Russian-based sawmill projects + failures.
• Many more Chinese mill investments.
Russia: Huge timber resources, weak ruble, is this
time for log processing
investments?
• The ruble advantage for log exports is disappearing from lower prices.
• Freight costs to markets = ~US $
• Advantages for lumber may remain as more operating costs in rubles.
Not for increases in log harvesting or log exports = better for lumber
Russia Log & Lumber Exports
13
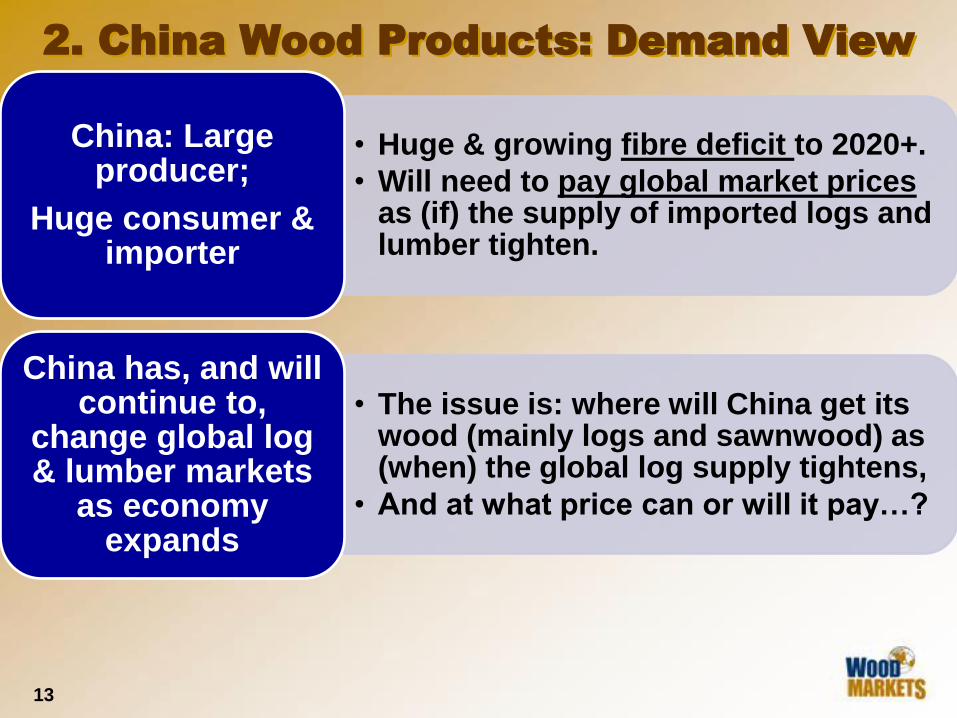
• Huge & growing fibre deficit to 2020+.
• Will need to pay global market prices as (if) the supply of imported logs and lumber tighten.
China: Large producer;
Huge consumer & importer
• The issue is: where will China get its wood (mainly logs and sawnwood) as (when) the global log supply tightens,
• And at what price can or will it pay…?
China has, and will continue to,
change global log & lumber markets
as economy expands
2. China Wood Products: Demand View
14
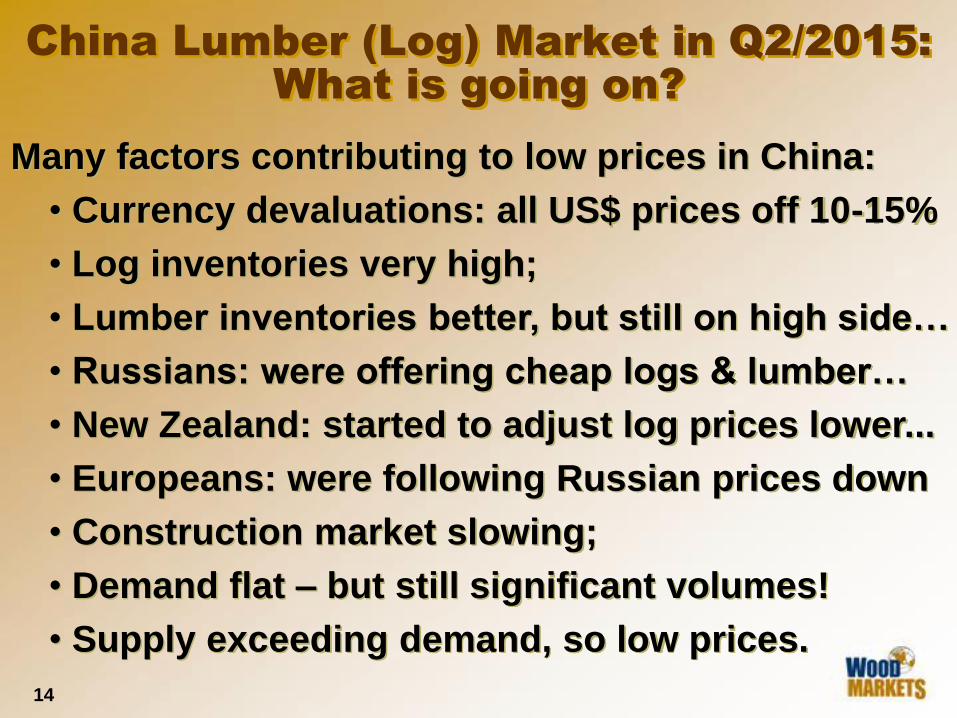
China Lumber (Log) Market in Q2/2015:
What is going on?
Many factors contributing to low prices in China:
• Currency devaluations: all US$ prices off 10-15%
• Log inventories very high;
• Lumber inventories better, but still on high side…
• Russians: were offering cheap logs & lumber…
• New Zealand: started to adjust log prices lower...
• Europeans: were following Russian prices down
• Construction market slowing;
• Demand flat – but still significant volumes!
• Supply exceeding demand, so low prices.
15
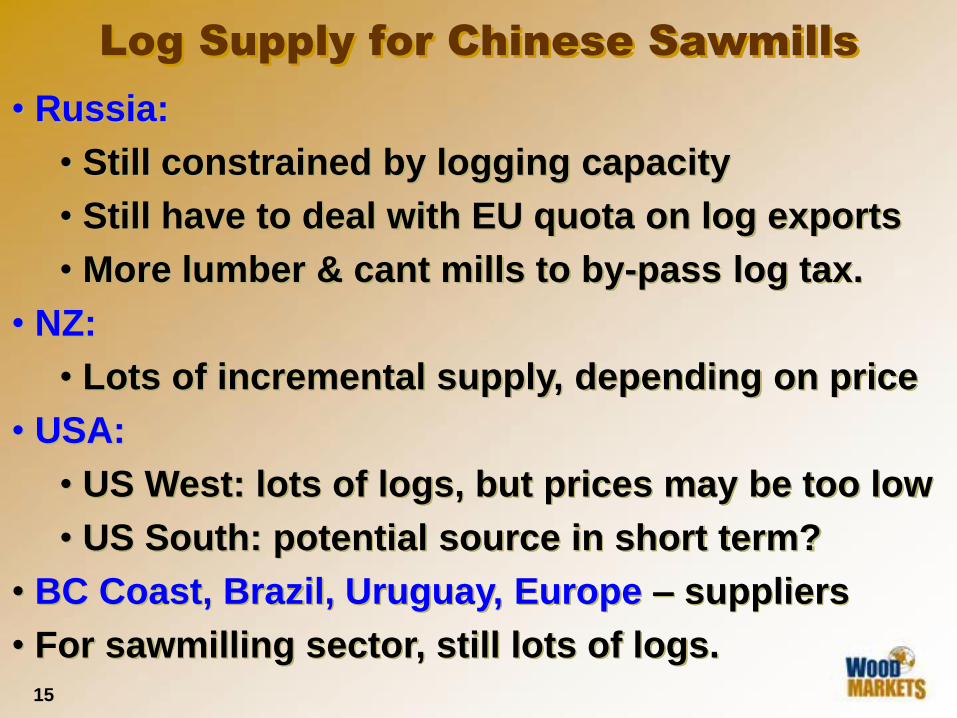
Log Supply for Chinese Sawmills
• Russia:
• Still constrained by logging capacity
• Still have to deal with EU quota on log exports
• More lumber & cant mills to by-pass log tax.
• NZ:
• Lots of incremental supply, depending on price
• USA:
• US West: lots of logs, but prices may be too low
• US South: potential source in short term?
• BC Coast, Brazil, Uruguay, Europe – suppliers
• For sawmilling sector, still lots of logs.
16
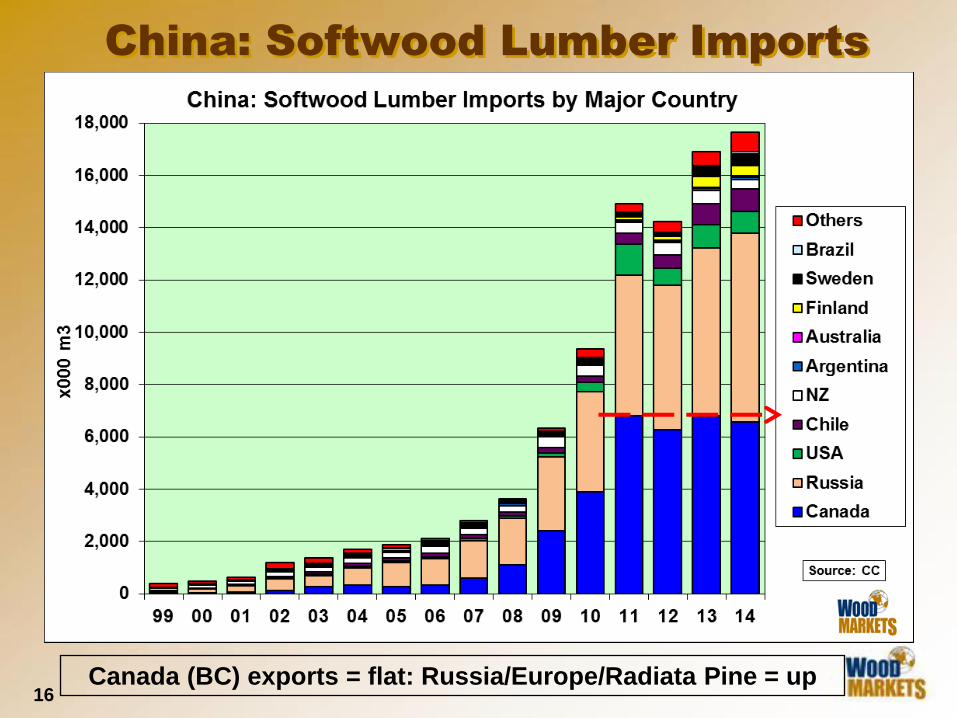
China: Softwood Lumber Imports
Canada (BC) exports = flat: Russia/Europe/Radiata Pine = up
17
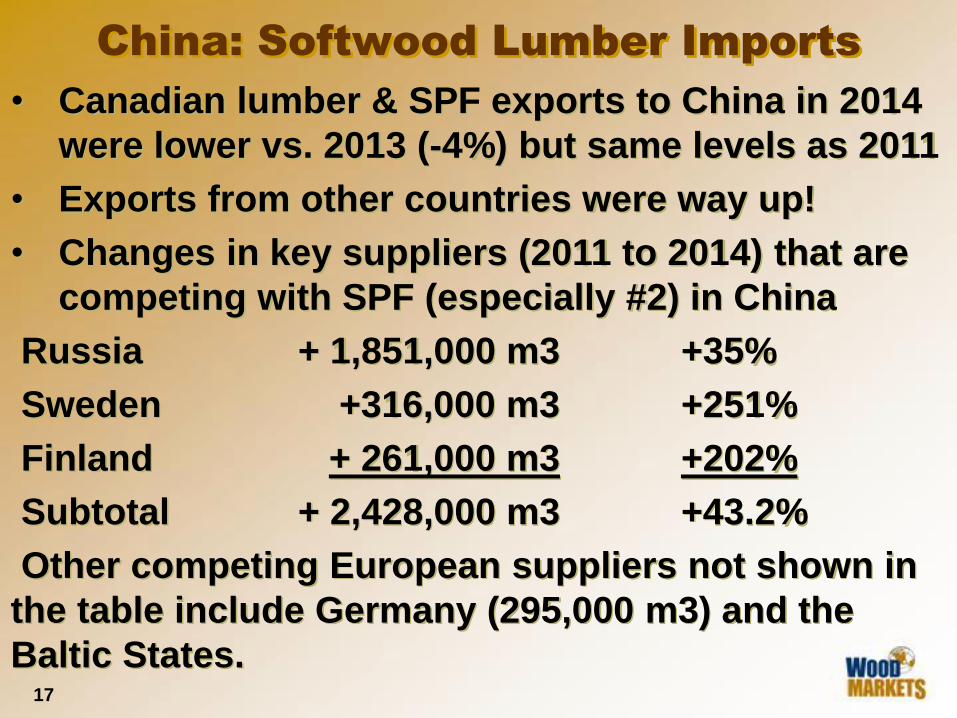
China: Softwood Lumber Imports
• Canadian lumber & SPF exports to China in 2014
were lower vs. 2013 (-4%) but same levels as 2011
• Exports from other countries were way up!
• Changes in key suppliers (2011 to 2014) that are
competing with SPF (especially #2) in China
Russia + 1,851,000 m3 +35%
Sweden +316,000 m3 +251%
Finland + 261,000 m3 +202%
Subtotal + 2,428,000 m3 +43.2%
Other competing European suppliers not shown in
the table include Germany (295,000 m3) and the
Baltic States.
18
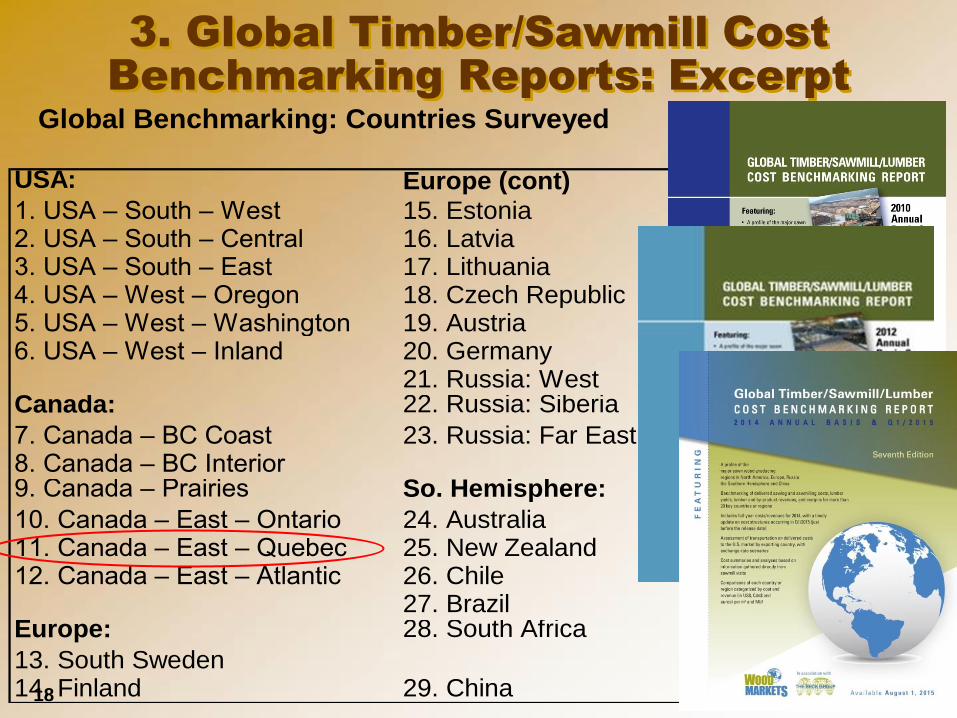
3. Global Timber/Sawmill Cost
Benchmarking Reports: Excerpt
Global Benchmarking: Countries Surveyed
USA: Europe (cont)
1. USA – South – West 15. Estonia2. USA – South – Central 16. Latvia3. USA – South – East 17. Lithuania4. USA – West – Oregon 18. Czech Republic5. USA – West – Washington 19. Austria6. USA – West – Inland 20. Germany
21. Russia: WestCanada: 22. Russia: Siberia
7. Canada – BC Coast 23. Russia: Far East8. Canada – BC Interior9. Canada – Prairies So. Hemisphere:
10. Canada – East – Ontario 24. Australia11. Canada – East – Quebec 25. New Zealand12. Canada – East – Atlantic 26. Chile
27. BrazilEurope: 28. South Africa
13. South Sweden14. Finland 29. China
19
Overview Comments
• It is important to recognize the limitations of the cost data.
• Cost data is collected in different ways, from detailed financial data to estimates from mill visits.
• Study designed to focus on “financial comparisons”, not necessarily operational ones and therefore, does not have a lot of hard data in areas such as downtime levels, maintenance, etc.
• WOOD MARKETS provides global lumber and log revenues and forecasts to major export markets = provides more accurate returns in forecasting log revenues/stumpage for timberland valuations and lumber margins for sawmill owners.
20
• With its data-base of sawlog & sawmills costs as
well as prices for sawlogs, lumber & by-products
starting in 2002, WOOD MARKETS’ Global
Benchmarking Report shows subscribers where
stumpage returns and/or sawmill margins are
excessive or or under-priced over market cycles.
• 29 different countries & regions are compared to
determine “who is making the money” on sawlogs
– the timberland owner or the sawmill operator.
• Stumpage & sawmill margin trends over time =
strategic information for timberland valuations!
• Our 7th bi-annual edition will be ready in August;
• Benchmarking Report excerpts follow:
Global Log/Sawmill Costs & Margins
21
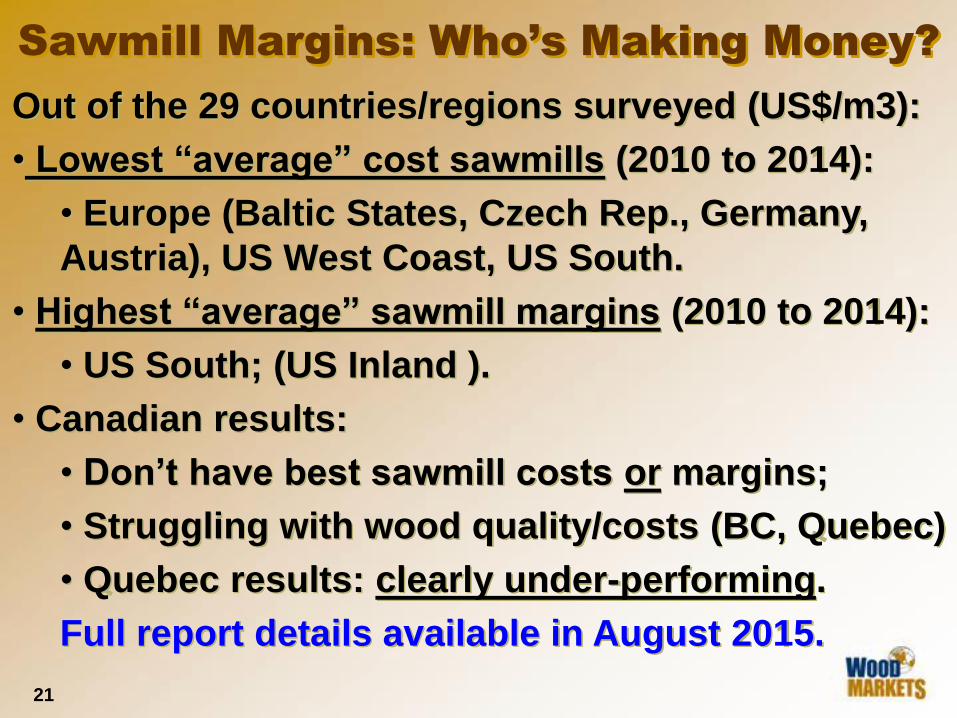
Sawmill Margins: Who’s Making Money?
Out of the 29 countries/regions surveyed (US$/m3):
• Lowest “average” cost sawmills (2010 to 2014):
• Europe (Baltic States, Czech Rep., Germany,
Austria), US West Coast, US South.
• Highest “average” sawmill margins (2010 to 2014):
• US South; (US Inland ).
• Canadian results:
• Don’t have best sawmill costs or margins;
• Struggling with wood quality/costs (BC, Quebec)
• Quebec results: clearly under-performing.
Full report details available in August 2015.
22
North America Log Price & Harvest
Trends
23
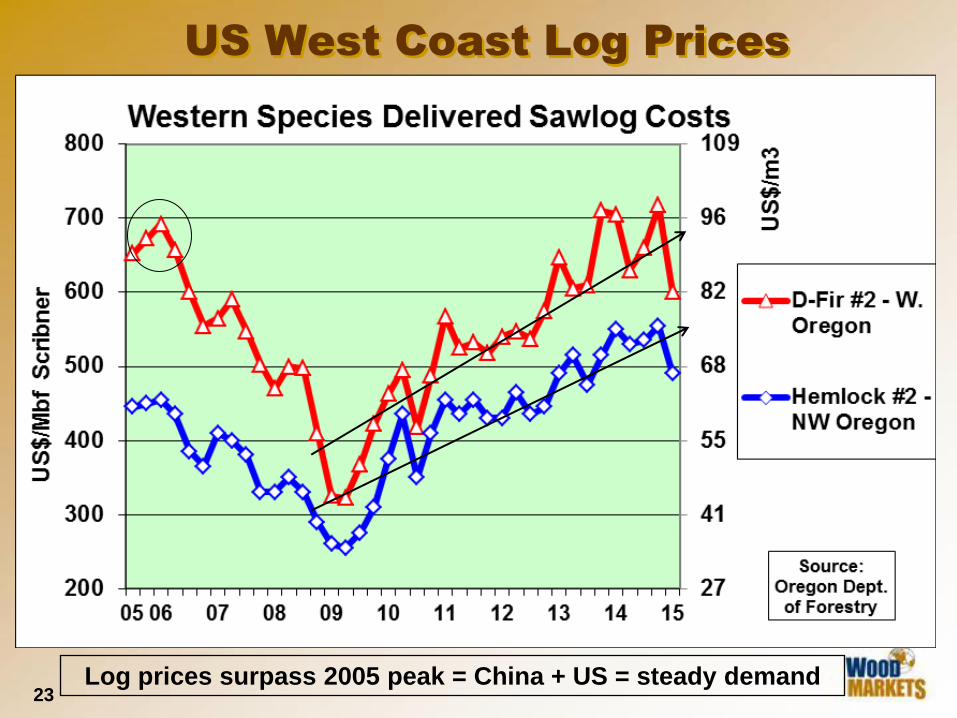
US West Coast Log Prices
Log prices surpass 2005 peak = China + US = steady demand
24
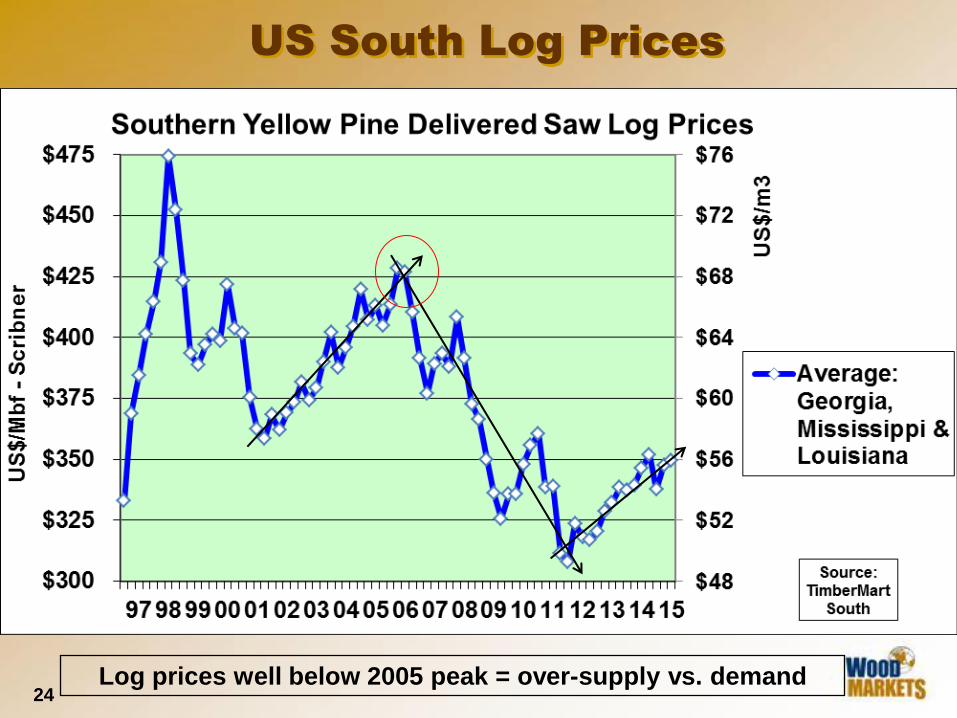
US South Log Prices
Log prices well below 2005 peak = over-supply vs. demand
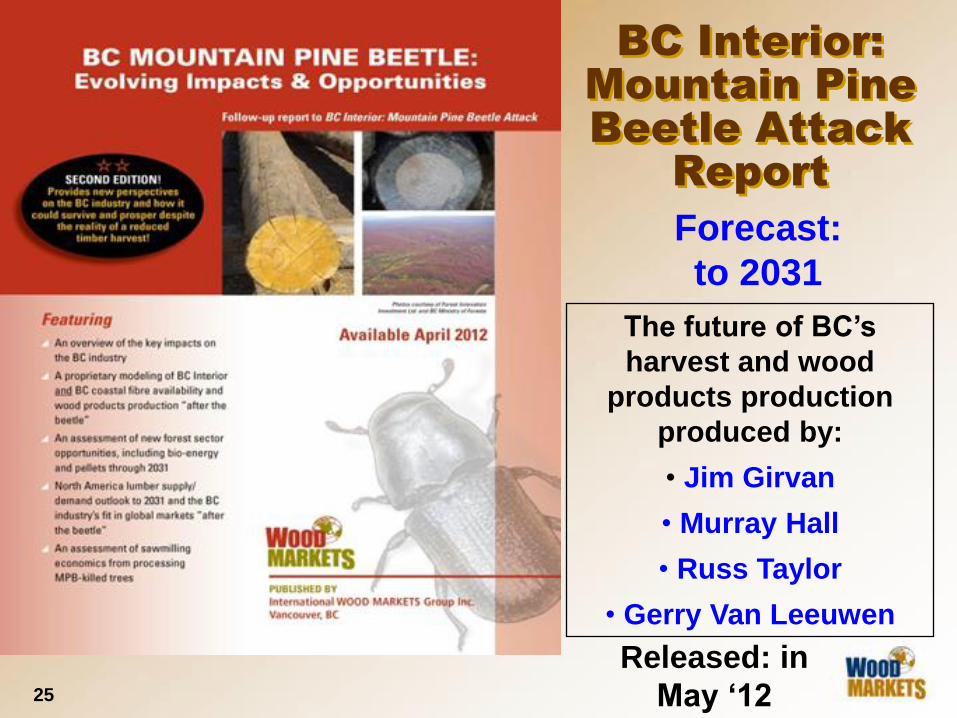
25
BC Interior:
Mountain Pine
Beetle Attack
Report
The future of BC’s
harvest and wood
products production
produced by:
• Jim Girvan
• Murray Hall
• Russ Taylor
• Gerry Van Leeuwen
Forecast:
to 2031
Released: in
May ‘12
26
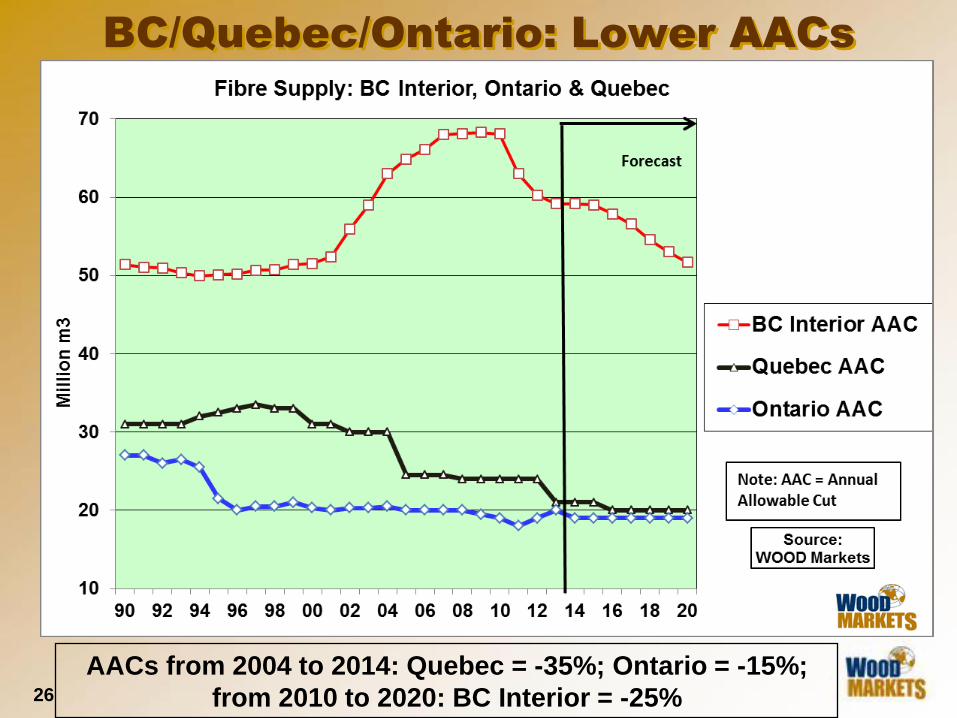
BC/Quebec/Ontario: Lower AACs
AACs from 2004 to 2014: Quebec = -35%; Ontario = -15%;
from 2010 to 2020: BC Interior = -25%
27
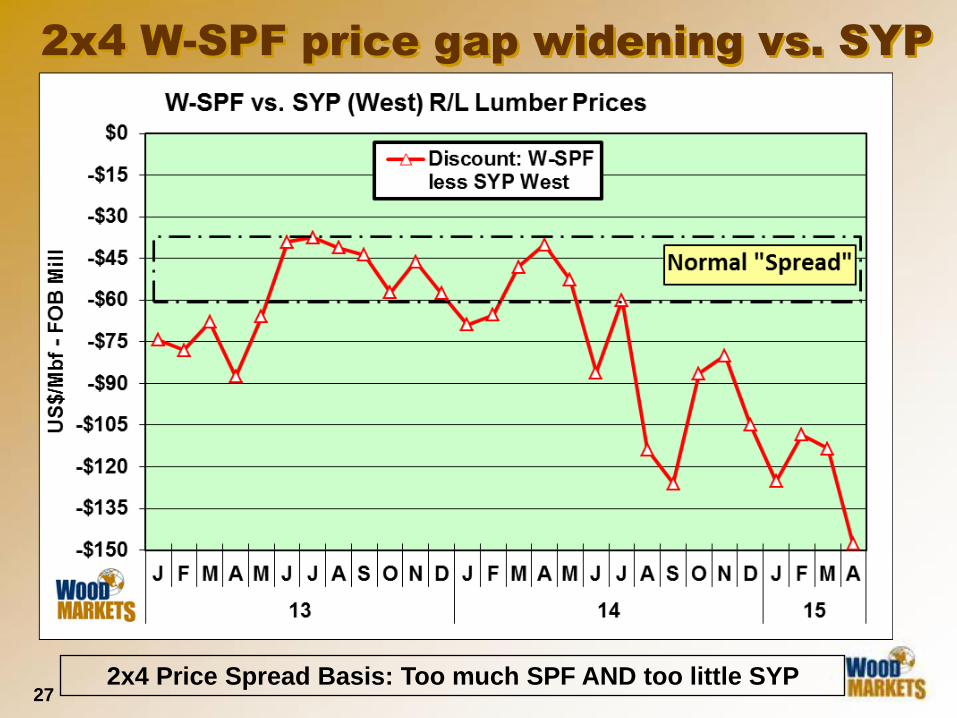
2x4 W-SPF price gap widening vs. SYP
2x4 Price Spread Basis: Too much SPF AND too little SYP
28
4. Key Demand & Supply Trends:
Impacting USA
29
4A. US Lumber Market in Q2/2015: What
is going on?
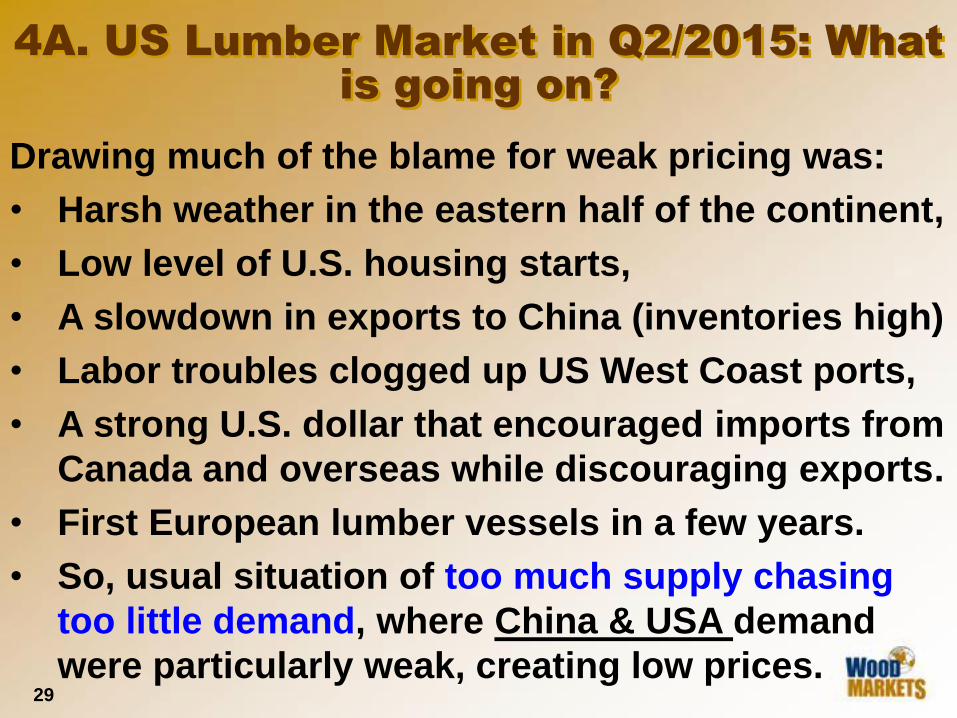
Drawing much of the blame for weak pricing was:
• Harsh weather in the eastern half of the continent,
• Low level of U.S. housing starts,
• A slowdown in exports to China (inventories high)
• Labor troubles clogged up US West Coast ports,
• A strong U.S. dollar that encouraged imports from
Canada and overseas while discouraging exports.
• First European lumber vessels in a few years.
• So, usual situation of too much supply chasing
too little demand, where China & USA demand
were particularly weak, creating low prices.
30
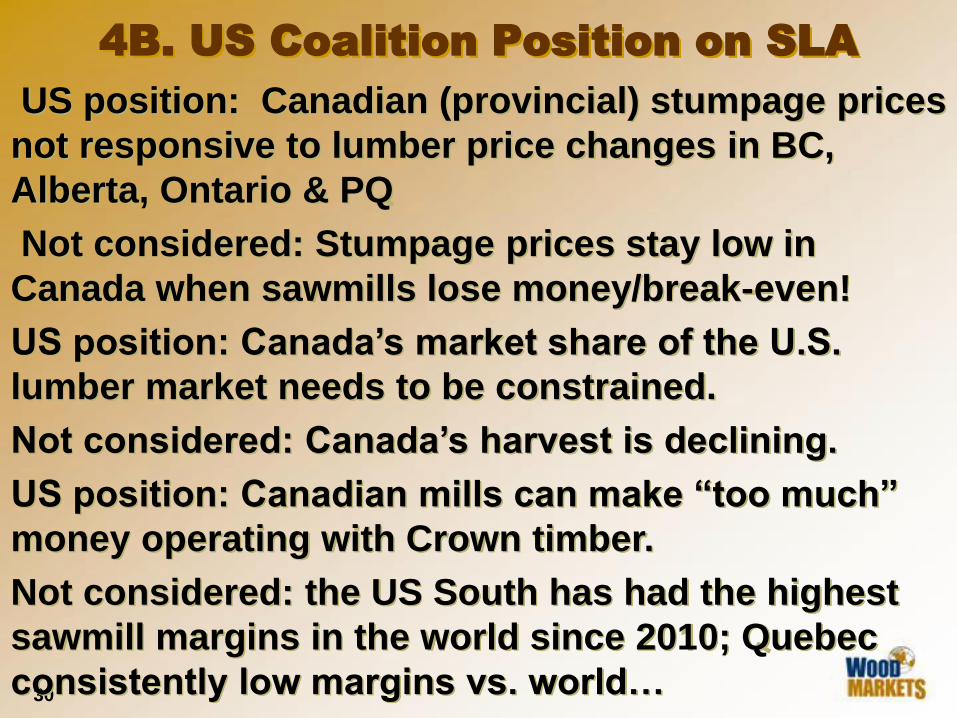
US position: Canadian (provincial) stumpage prices
not responsive to lumber price changes in BC,
Alberta, Ontario & PQ
Not considered: Stumpage prices stay low in
Canada when sawmills lose money/break-even!
US position: Canada’s market share of the U.S.
lumber market needs to be constrained.
Not considered: Canada’s harvest is declining.
US position: Canadian mills can make “too much”
money operating with Crown timber.
Not considered: the US South has had the highest
sawmill margins in the world since 2010; Quebec
consistently low margins vs. world…
4B. US Coalition Position on SLA
31
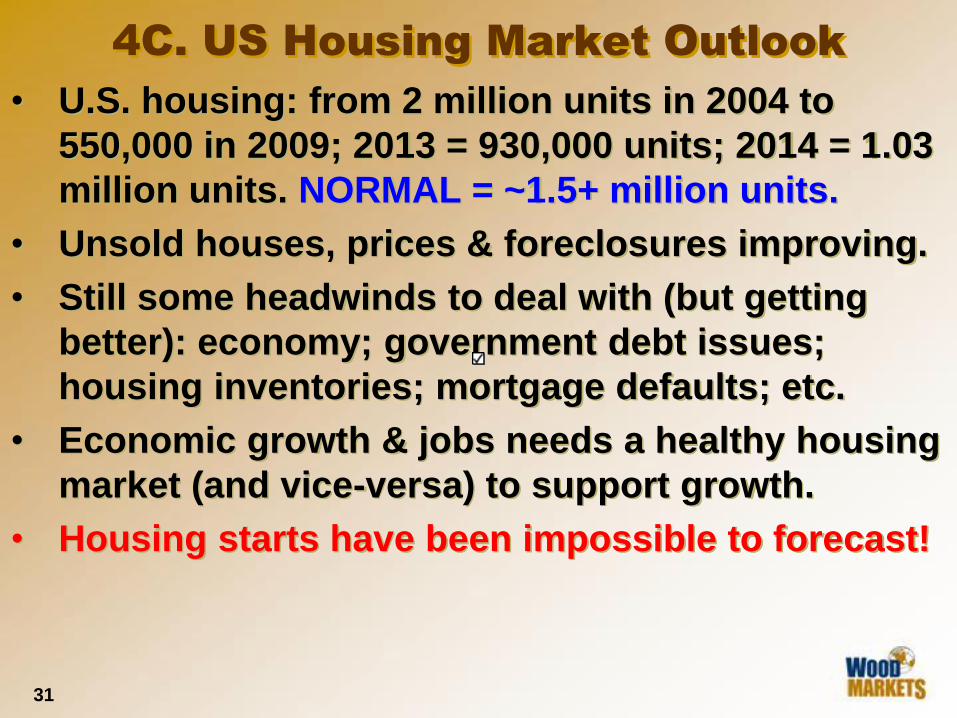
• U.S. housing: from 2 million units in 2004 to
550,000 in 2009; 2013 = 930,000 units; 2014 = 1.03
million units. NORMAL = ~1.5+ million units.
• Unsold houses, prices & foreclosures improving.
• Still some headwinds to deal with (but getting
better): economy; government debt issues;
housing inventories; mortgage defaults; etc.
• Economic growth & jobs needs a healthy housing
market (and vice-versa) to support growth.
• Housing starts have been impossible to forecast!
4C. US Housing Market Outlook
32
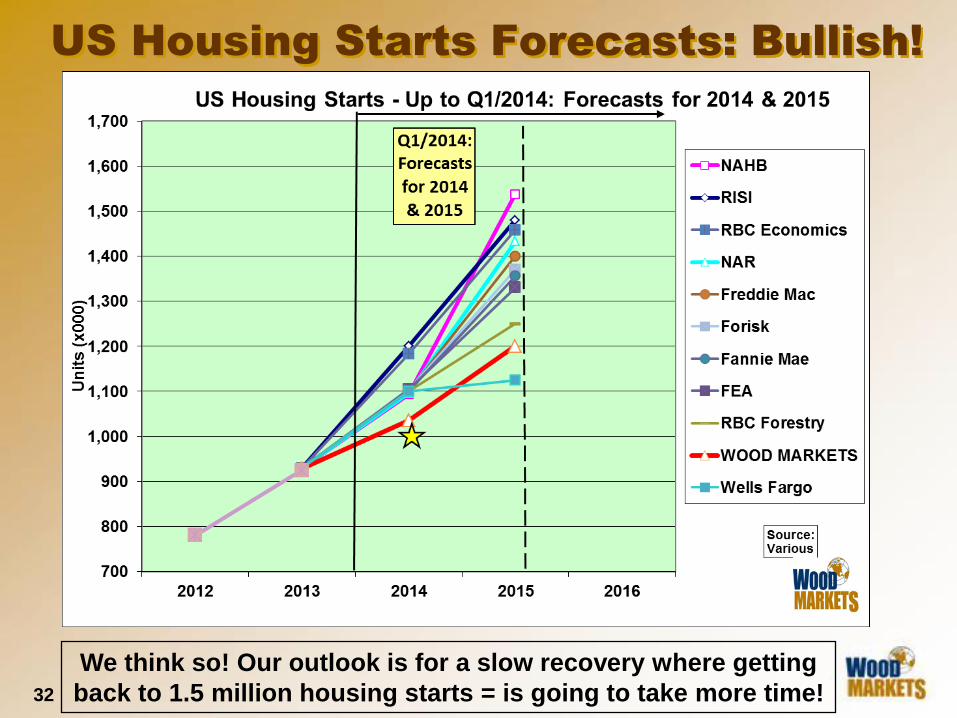
US Housing Starts Forecasts: Bullish!
We think so! Our outlook is for a slow recovery where getting
back to 1.5 million housing starts = is going to take more time!
33
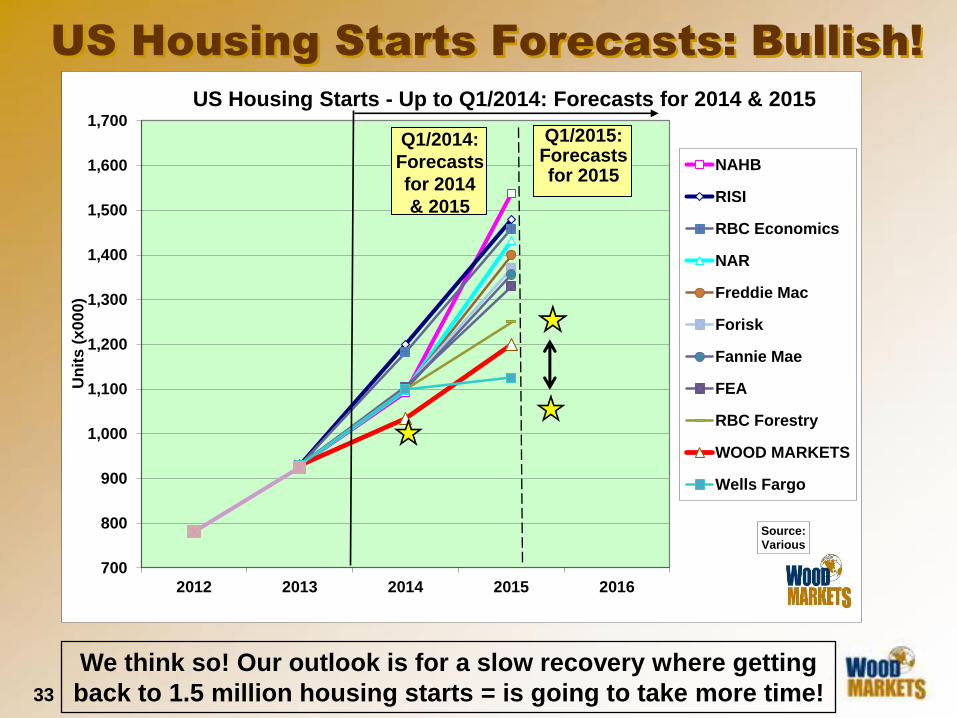
US Housing Starts Forecasts: Bullish!
We think so! Our outlook is for a slow recovery where getting
back to 1.5 million housing starts = is going to take more time!
700
800
900
1,000
1,100
1,200
1,300
1,400
1,500
1,600
1,700
2012 2013 2014 2015 2016
Un
its
(x
00
0)
Source: Various
US Housing Starts - Up to Q1/2014: Forecasts for 2014 & 2015
NAHB
RISI
RBC Economics
NAR
Freddie Mac
Forisk
Fannie Mae
FEA
RBC Forestry
WOOD MARKETS
Wells Fargo
Q1/2015: Forecasts for 2015
Q1/2014:
Forecasts
for 2014
& 2015
34
4C. Highlights of WOOD MARKETS
2015 Report: Outlook to 2019
Highlights of
Canadian lumber
trends & US
outlook
35
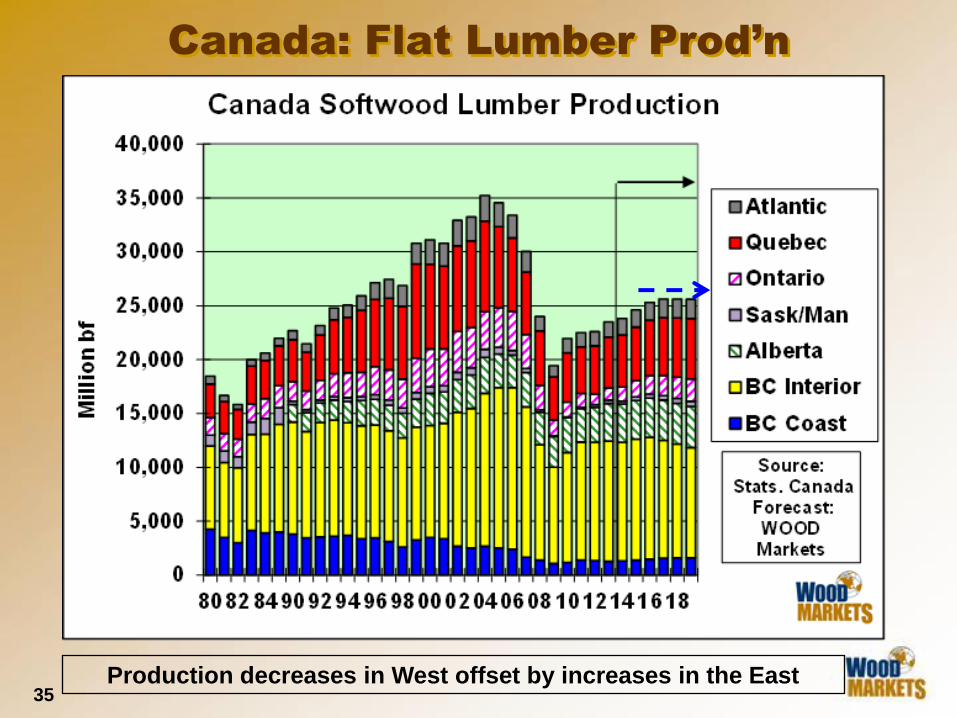
Canada: Flat Lumber Prod’n
Production decreases in West offset by increases in the East
36
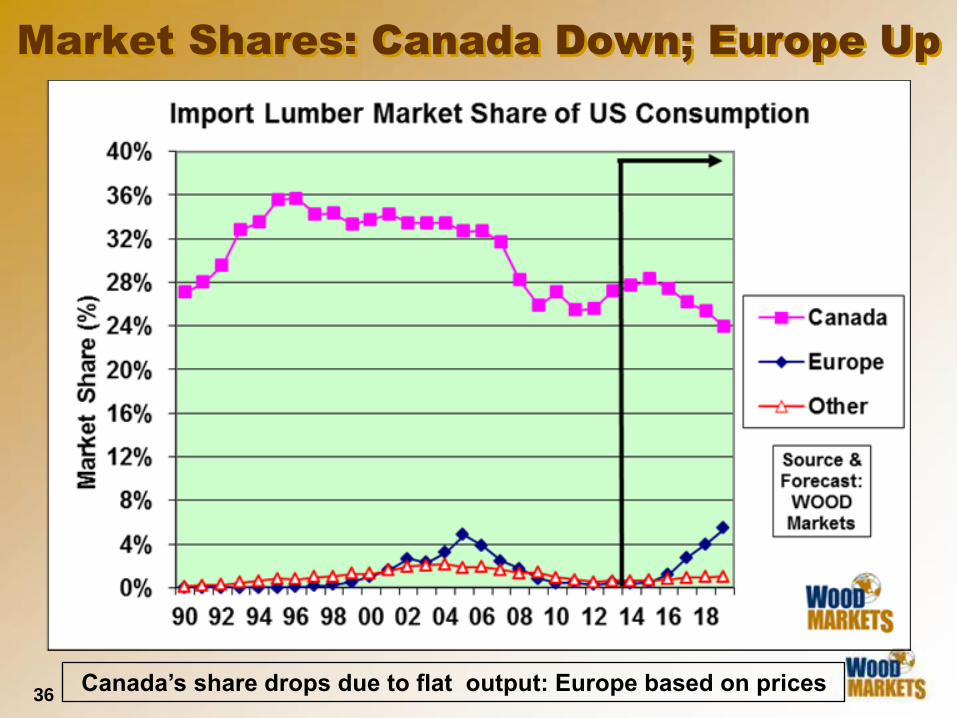
Market Shares: Canada Down; Europe Up
Canada’s share drops due to flat output: Europe based on prices
37
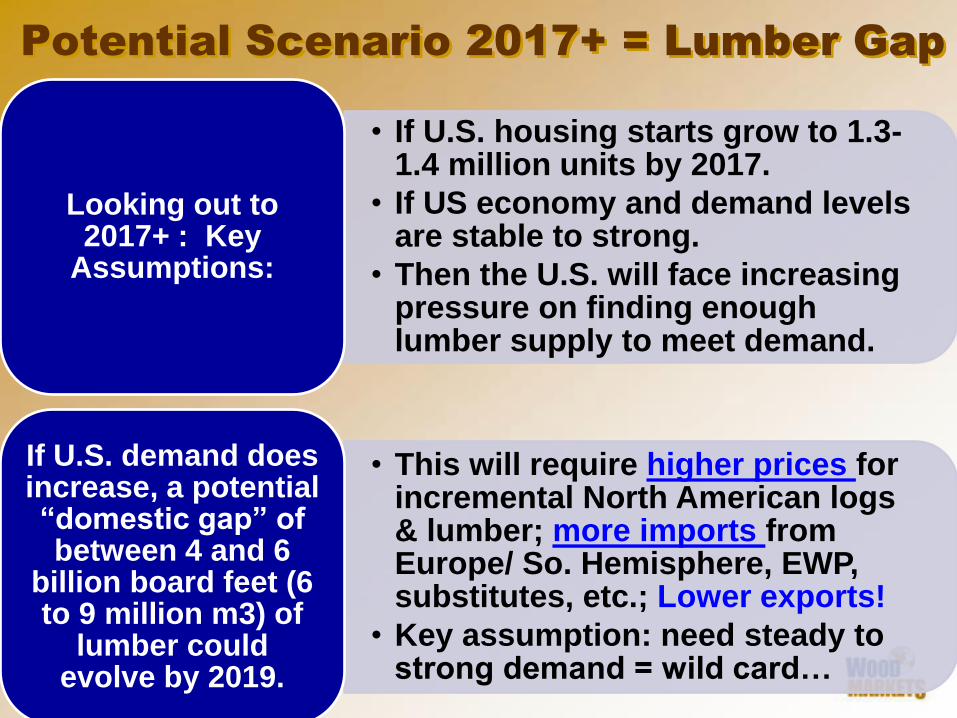
Potential Scenario 2017+ = Lumber Gap
• If U.S. housing starts grow to 1.3-1.4 million units by 2017.
• If US economy and demand levels are stable to strong.
• Then the U.S. will face increasing pressure on finding enough lumber supply to meet demand.
Looking out to 2017+ : Key
Assumptions:
• This will require higher prices for incremental North American logs & lumber; more imports from Europe/ So. Hemisphere, EWP, substitutes, etc.; Lower exports!
• Key assumption: need steady to strong demand = wild card…
If U.S. demand does increase, a potential “domestic gap” of between 4 and 6
billion board feet (6 to 9 million m3) of
lumber could evolve by 2019.
38
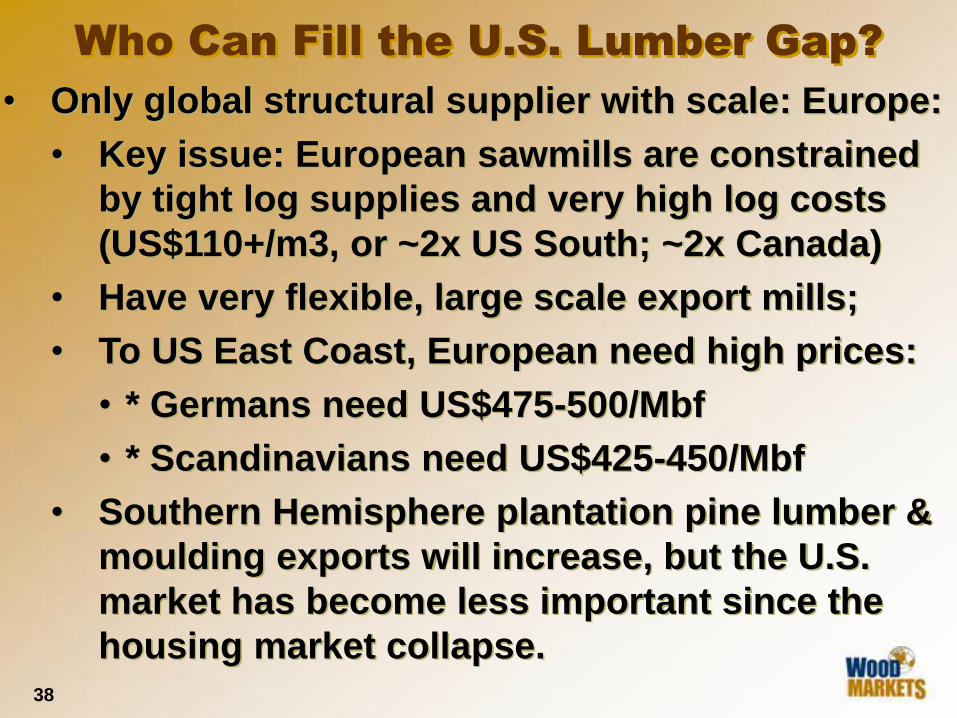
• Only global structural supplier with scale: Europe:
• Key issue: European sawmills are constrained
by tight log supplies and very high log costs
(US$110+/m3, or ~2x US South; ~2x Canada)
• Have very flexible, large scale export mills;
• To US East Coast, European need high prices:
• * Germans need US$475-500/Mbf
• * Scandinavians need US$425-450/Mbf
• Southern Hemisphere plantation pine lumber &
moulding exports will increase, but the U.S.
market has become less important since the
housing market collapse.
Who Can Fill the U.S. Lumber Gap?
39
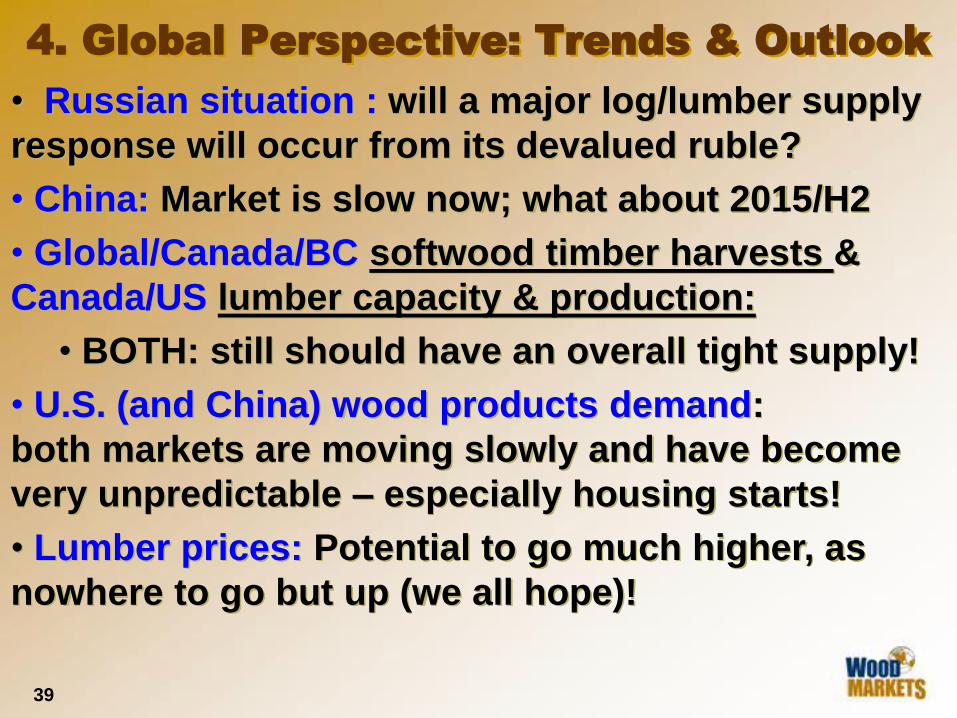
• Russian situation : will a major log/lumber supply
response will occur from its devalued ruble?
• China: Market is slow now; what about 2015/H2
• Global/Canada/BC softwood timber harvests &
Canada/US lumber capacity & production:
• BOTH: still should have an overall tight supply!
• U.S. (and China) wood products demand:
both markets are moving slowly and have become
very unpredictable – especially housing starts!
• Lumber prices: Potential to go much higher, as
nowhere to go but up (we all hope)!
4. Global Perspective: Trends & Outlook
40
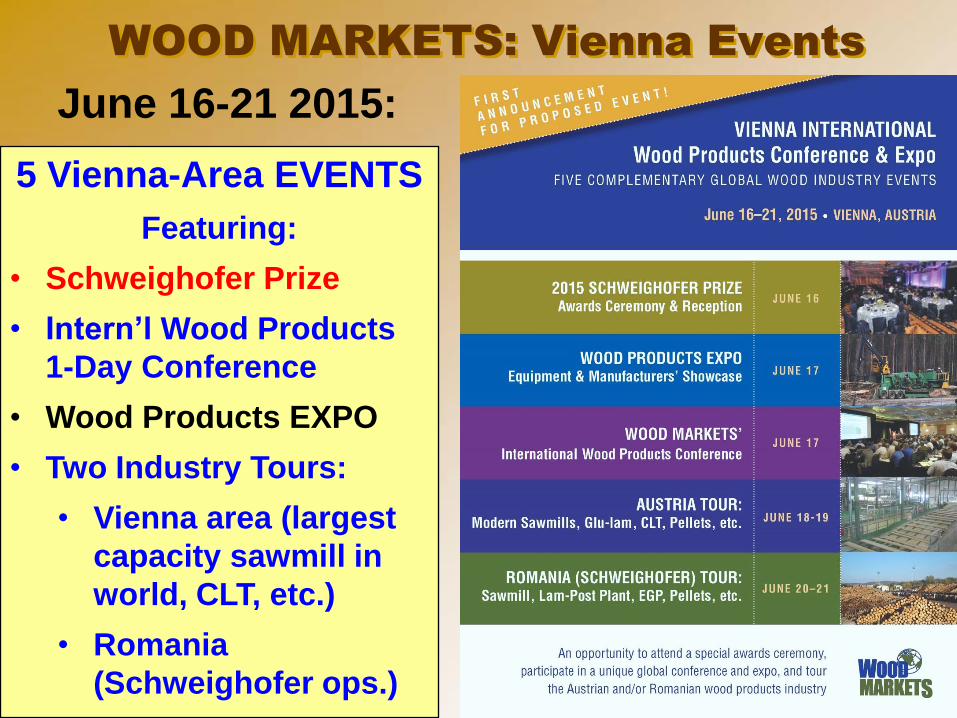
WOOD MARKETS: Vienna Events
5 Vienna-Area EVENTS
Featuring:
• Schweighofer Prize
• Intern’l Wood Products
1-Day Conference
• Wood Products EXPO
• Two Industry Tours:
• Vienna area (largest
capacity sawmill in
world, CLT, etc.)
• Romania
(Schweighofer ops.)
June 16-21 2015:
International WOOD MARKETS Group Inc. Vancouver, B.C., Canada
Russell Taylor
Suite 603 – 55 E. Cordova Street Vancouver, BC V6A 0A5
Tel: (604) 801-5996 / Fax: (604) 801-5997 Email: [email protected]
www.woodmarkets.com
Thank You!