Global Megatrends - Canback · Global Megatrends Mexico Highlights Demographic shifts Many...
35
November 2014 Global Megatrends Mexico Focus Five global megatrends continue to advance Highlights By 2025, World will have added another billion people to reach about 8 billion, with the over-65s the fastest-growing group. China will replace the US as the world’s largest economy by 2015¹ By 2025, there could be nearly 40 cities each with a population of over 10 million people Only 50 years of supply left in proven oil reserves In 10 years, smartphones are reaching half of US households ¹ This is by Purchasing Power Parity (PPP) rates; by market exchange rates, PwC project China will replace the US by around 2030. The world is changing. Major economic, cultural, social and scientific changes are having a significant impact in the world. These changes are known as megatrends. PwC Network Leadership identified five megatrends that will impact the future of both PwC and its clients over the next decade and reshape the global marketplace. These changes are occurring now and causing reactions in companies as well as individuals, with most attempting to respond in their own best interests. How will these trends evolve in the future? In this paper, we explore how these five megatrends are affecting the Mexican market in different ways Demographic shifts Shift in global economic power Accelerating urbanization Resource scarcity and climate change Technological breakthroughs
Transcript of Global Megatrends - Canback · Global Megatrends Mexico Highlights Demographic shifts Many...

November 2014
Global Megatrends Mexico Focus
Five global megatrends continue to advance
Highlights
By 2025, World will have added another billion people to reach about 8 billion, with the over-65s the fastest-growing group.
China will replace the US as the world’s largest economy by 2015¹
By 2025, there could be nearly 40 cities each with a population of over 10 million people
Only 50 years of supply left in proven oil reserves
In 10 years, smartphones are reaching half of US households
¹ This is by Purchasing Power Parity (PPP) rates; by market exchange rates, PwC project China will replace the US by around 2030.
The world is changing. Major economic, cultural, social and scientific changes are having a significant impact in the world. These changes are known as megatrends. PwC Network Leadership identified five megatrends that will impact the future of both PwC and its clients over the next decade and reshape the global marketplace.
These changes are occurring now and causing reactions in companies as well as individuals, with most attempting to respond in their own best interests. How will these trends evolve in the future? In this paper, we explore how these five megatrends are affecting the Mexican market in different ways
Demographic shifts
Shift in global economic power
Accelerating urbanization
Resource scarcity and climate change
Technological breakthroughs

PwC
Global Megatrends Mexico Highlights
Demographic
shifts
Many countries, including Mexico, are experiencing a massive demographic shift with a falling fertility rate and increasing life expectancy.
The number of the Mexican population and urban agglomerations are growing year after year. The proportion of urban population in Mexico increased from 52% in 1962 to 78% in 2012, and keeps on growing, reaching 123.95 million by 2050.
Technology advances are reshaping the economies and societies of many countries, including Mexico, around the world. IT systems are affecting the healthcare industry in Mexico, overcoming geographic or income barriers and reaching a large audience.
The world's economic balance of power is shifting rapidly. Mexico is expected to be among the top ten economies, ranked by Purchasing Power Parity (PPP) in 2030.
Between 2013 and 2030, average temperatures are expected to increase between 0.5°C and 1.5°C. By 2030, the world’s population is expected to reach 8.3 billion people. Both human interventions and climate change will affect global resources globally and in Mexico.
2
1 Shift in global
economic power 2 Accelerating
urbanization 3
Resource scarcity and climate change
4 Technological breakthroughs
5
1. Demographic shift
When countries start to develop, population patterns shift from a high birth rate and early mortality to a low birth rate and longer life expectancy.¹ Many countries, including Mexico, experience this process where the population at first grows rapidly and then more slowly. One of the main indicators of the slowdown is a fall in fertility. Women in Mexico had on average seven children in the 60’s, while a 2014 estimate is 2.29 children per woman.² The number is expected to be below 2 before 2020.¹ At the same time, life expectancy has grown - most of the Mexican population did not live beyond their 50’s in 1960, when in 2011 life expectancy was 76.8.³ These demographic changes represent an important threat to both the economy and national budget.
Overview
1 The Economist 2 CIA, The World Factbook 3 World Bank
1. Demographic shift
Population structure
In 2012, the Mexican population was around 122 million, putting the country in the 11th place in the list of the most populous countries in the world.⁴
4 United Nations
The population will reach around 138 million people by 2025 (see Graph 1) and after some growth, it will start to steadily decline, mainly due to a drop in the fertility rate (see Graph 2).
28,296
122,332 138,195
156,102
1950 2013F 2025F 2050F
F-forecast
73
74
75
76
77
78
79
80
1.95
2.00
2.05
2.10
2.15
2.20
2.25
2.30
20
10
E
20
12
E
20
14
F
20
16
F
20
18
F
20
20
F
20
22
F
20
24
F
20
26
F
20
28
F
20
30
F
20
32
F
20
34
F
20
36
F
20
38
F
20
40
F
20
42
F
20
44
F
20
46
F
20
48
F
20
50
F
Ye
ars
Nu
mb
er
of
Ch
ild
ren
Fertility rate Life expectancy
Demographics in Mexico are very favorable in the medium term, thanks to the low current and future birth rates combined with a high fertility in the past, which will improve the dependency ratio.⁵
5 DNB
Source: United Nations
Source: Conapo, 2010
Graph 1. Total Mexican population in thousands, 1950, 2013F, 2025F and 2050F
Graph 2. Fertility rate (number of children) and life expectancy (years) in Mexico, 2010 and forecast
E-estimation F-forecast
1. Demographic shift
Population structure
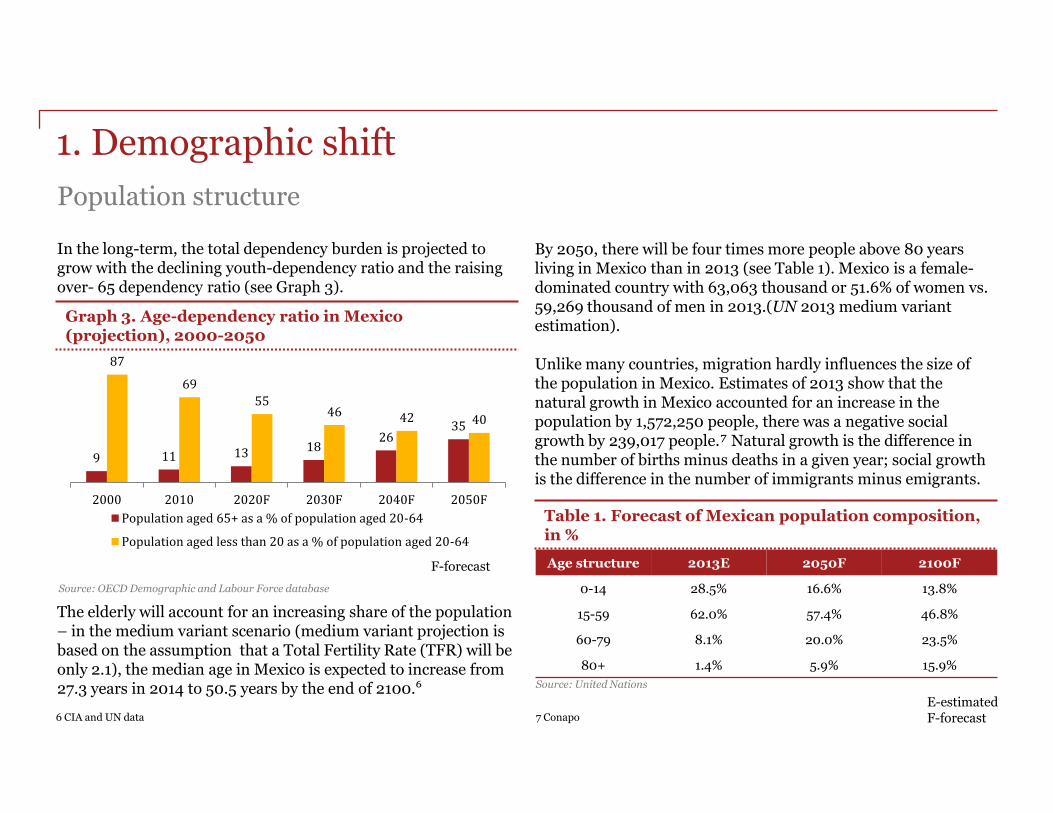
In the long-term, the total dependency burden is projected to grow with the declining youth-dependency ratio and the raising over- 65 dependency ratio (see Graph 3).
9 11 13 18 26
35
87
69
55 46 42 40
2000 2010 2020F 2030F 2040F 2050F
Population aged 65+ as a % of population aged 20-64
Population aged less than 20 as a % of population aged 20-64
The elderly will account for an increasing share of the population – in the medium variant scenario (medium variant projection is based on the assumption that a Total Fertility Rate (TFR) will be only 2.1), the median age in Mexico is expected to increase from 27.3 years in 2014 to 50.5 years by the end of 2100.⁶
6 CIA and UN data
By 2050, there will be four times more people above 80 years living in Mexico than in 2013 (see Table 1). Mexico is a female-dominated country with 63,063 thousand or 51.6% of women vs. 59,269 thousand of men in 2013.(UN 2013 medium variant estimation). Unlike many countries, migration hardly influences the size of the population in Mexico. Estimates of 2013 show that the natural growth in Mexico accounted for an increase in the population by 1,572,250 people, there was a negative social growth by 239,017 people.⁷ Natural growth is the difference in the number of births minus deaths in a given year; social growth is the difference in the number of immigrants minus emigrants.
Age structure 2013E 2050F 2100F
0-14 28.5% 16.6% 13.8%
15-59 62.0% 57.4% 46.8%
60-79 8.1% 20.0% 23.5%
80+ 1.4% 5.9% 15.9%
Source: OECD Demographic and Labour Force database
Source: United Nations
7 Conapo
Graph 3. Age-dependency ratio in Mexico (projection), 2000-2050
Table 1. Forecast of Mexican population composition, in %
F-forecast
E-estimated F-forecast

1. Demographic shift
Socio-economic characteristics of population
On a global scale, Mexico is considered to be an upper-middle income country, and the population is moving in socioeconomic levels. 17% of the Mexican population has become a part of the middle class between 2000 and 2010.⁸ In 2013, the top 6.4% of the wealthiest people in Mexico earned 33.7% of total income. The combined income of upper and upper middle class (33.7% and 16.6% correspondingly) was over 7 times higher than of marginalized class (6.3%) (see Table 2). However, this is by no means an extreme income distribution. Inequality had gone down about 4.7 points on Gini index in the same period, from 51.87 (2000) to 47.16 (2010). Gini index measures income distribution of a nation’s residents.9
Income per capita is expected to grow by 29% for the next decade (2013-2023) and will reach the value of 84,353 MXN.
8 World Bank, November 2012 9 Investopedia
Socioeconomic group
Population share Income share
Upper 6.4% 33.7%
Upper middle 8.4% 16.6%
Middle 11.3% 14.5%
Lower middle 22.8% 18.3%
Lower 22.7% 10.6%
Marginalized 28.5% 6.3%
Source: Canback analysis
Table 2. Income distribution by socioeconomic group in Mexico, %, 2013

1. Implications of demographic shift
Workforce
As a direct result of the demographic change, the workforce composition will change. For example, there will be a higher rate of participation in the labor market by the elderly (see Graph 4). Even though a female share of the Mexican population slightly exceeds the male, gender disparities in employment rates are very high. Male employment rates were substantially higher than female employment: in 2012, labor force participation rate for male was 80% vs. 45% for female.10
The share of women in the labor market has increased, from 34.3% in 1990 to 44.6% in 2012 and is projected to rise even further and reach 47% by 2020 (see Graph 5).11
10World Bank 11 ILO
0 10 20 30 40 50 60 70 80
15-19 20-24 25-29 30-34 35-39 40-44 45-49 50-54 55-59 60-64 65+ P
erc
en
tag
e
2013 2020
83.9 83.2 82.7 81.1 80.5 80.5 80.2
34.3 37.6 38.8 41.0 43.9 45.7 47.0
1990 1995 2000 2005 2010 2015F 2020F
Male Female
Source: International Labour Organization (ILO)
Source: International Labour Organization (ILO)
Graph 4. Economically active population estimates and projections in Mexico in 2013 and 2020F, by age group, %
Graph 5. Labor force participation in Mexico in %, projection and estimate
F-forecast
F-forecast
1. Implications of demographic shift
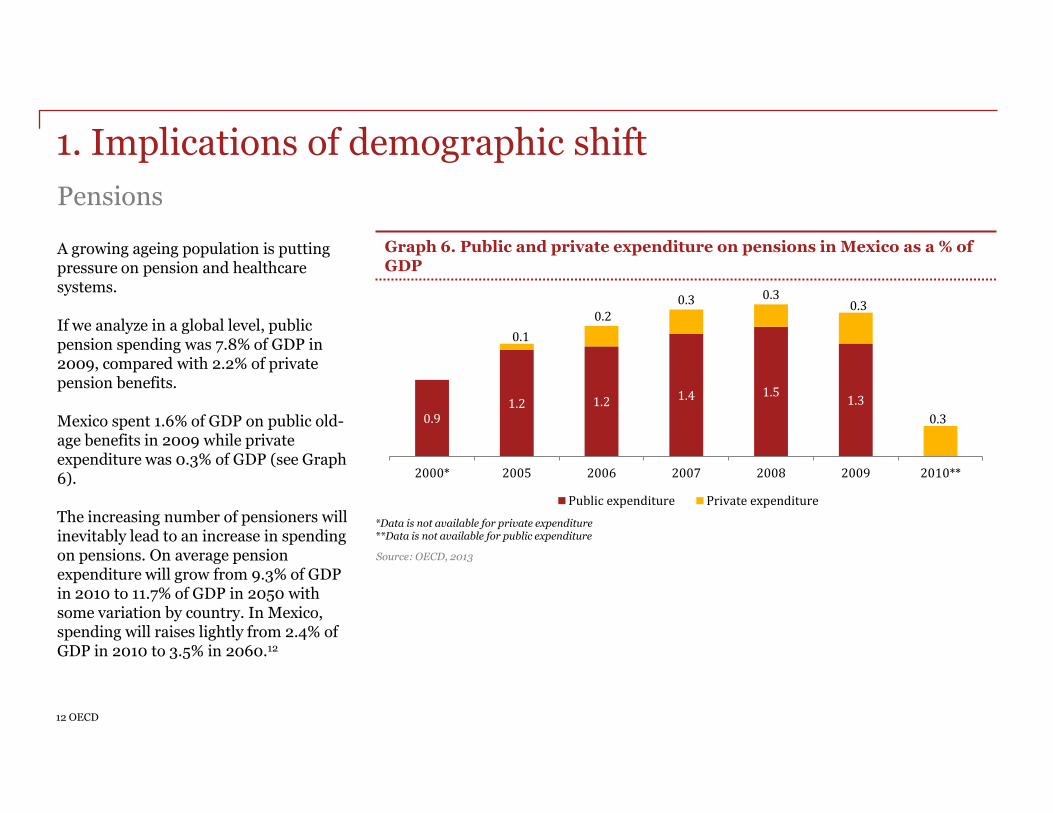
Pensions
A growing ageing population is putting pressure on pension and healthcare systems. If we analyze in a global level, public pension spending was 7.8% of GDP in 2009, compared with 2.2% of private pension benefits. Mexico spent 1.6% of GDP on public old-age benefits in 2009 while private expenditure was 0.3% of GDP (see Graph 6). The increasing number of pensioners will inevitably lead to an increase in spending on pensions. On average pension expenditure will grow from 9.3% of GDP in 2010 to 11.7% of GDP in 2050 with some variation by country. In Mexico, spending will raises lightly from 2.4% of GDP in 2010 to 3.5% in 2060.12
12 OECD
0.9 1.2 1.2 1.4 1.5
1.3
0.1
0.2 0.3 0.3
0.3
0.3
2000* 2005 2006 2007 2008 2009 2010**
Public expenditure Private expenditure
*Data is not available for private expenditure **Data is not available for public expenditure
Source: OECD, 2013
Graph 6. Public and private expenditure on pensions in Mexico as a % of GDP

1. Implications of demographic shift
Healthcare spending
The healthcare spending is forecast to rise from 782 USD in 2013 to 1,057 USD per person in 2017 in Mexico (see Graph 7).13 The aging population raises concerns about the affordability of pension and healthcare programs. More than one in five Mexicans ages “65 and more” live in poverty. There are a number of federal and regional social programs created to support the interest of elderly individuals in Mexico, for example, “70 y mas”, “Oportunidades”, “Catastrophic Expense Protection Fund”, etc.14
13 Economist Intelligence Unit 14 OECD
Source: Economist Intelligence Unit, 2013
782
866
920
979
1,057
500
600
700
800
900
1,000
1,100
2013 2014 2015F 2016F 2017F
US
D
Graph 7. Forecast Healthcare spending in Mexico, in USD per capita, 2013-2017
F-forecast
2. Shift in global economic power
In the past few years, the global balance of economic power has been shifting from developed to developing countries. The world economic order is unprecedented in its speed and scale. It will trigger an equally dramatic realignment of global business activities and spending power, affecting not just Gross Domestic Products (GDP) but also other measures such as population, water supplies and trade.15
In its analysis of what has been driving economic growth in OECD member countries over the recent decades, OECD found that human capital, research & development activity, macroeconomic and structural policy settings, trade policy, and financial market conditions play the most important role in the economy growth.16 In this section, we will briefly outline every factor of growth in regards to Mexico to show steps that Mexico needs to undertake in order to become one of the world’s biggest economies.
Overview
15 PwC 16 OECD

2. Shift in global economic power
The world economy is projected to grow at around 3% annually between 2011 and 2050, doubling in size by 2032 and nearly doubling again by 2050, reflecting a catch-up in high-income economies.17 Mature economies will grow from 1.3% in 2013 to 2.2% in 2014 with some countries doing better: amongst high-income countries, the US is expected to increase its growth from 1.9% in 2013 to 3% in 2016.18 It is forecasted that a GDP growth in developing countries will be improved just slightly to 5.3% in 2014 and 5.7% in 2016. The slower growth will be driven primarily by China that will continue to slow down.19
17 PwC 18 Conference Global Economic Board 19 WorldBank
Regional highlights As a result of slower growth in Indonesia, Malaysia and Thailand caused by weak commodity revenues and policy constrains, growth in East Asia & the Pacific slowed to 7.2% in 2013. Growth in Europe & Central Asia strengthened to an estimated 3.4% in 2013 as countries from this region increased exports to high-income Europe. The growth will stay stable at 3.5% in 2014 and lift to 3.8% in 2016. Growth of the Middle East & North Africa region is expected to remain weak; the 2014 growth outlook has improved significantly to 2.8%, compared to 0.1 % growth in 2013. Latin America & Caribbean witnessed a weak growth performance in 2013, caused by weak trade, tighter financial conditions and dynamic commodity markets. Mexico is expected to reach the value of 1,761 billion USD for GDP in Purchasing Power Parity (PPP) terms in 2011 and 7,409 billion USD in 2050 (see Graph 8).²⁰
Graph 8. Actual and projected Mexico GDP in PPP terms, billions USD, 2011-2015
1,761
3,662
7,409
2011 2030F 2050F
Source: PwC F-forecast
Global highlights
2. Shift in global economic power
20 OECD 21 UN
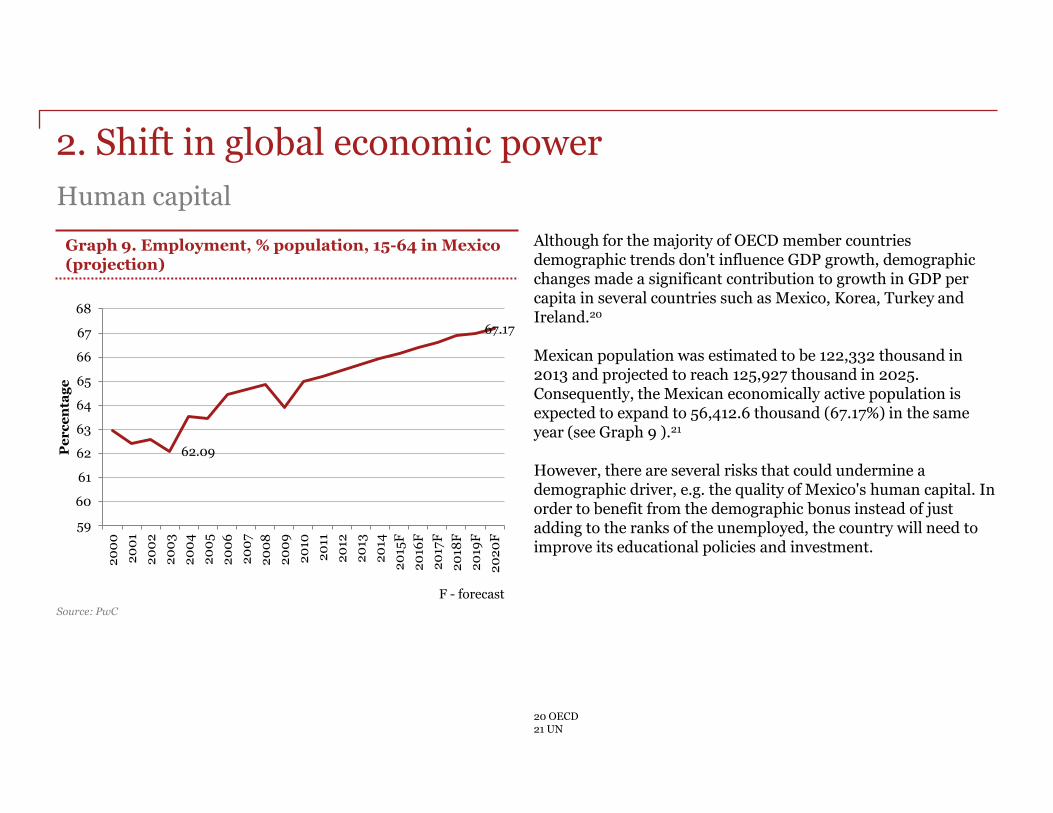
Human capital
Although for the majority of OECD member countries demographic trends don't influence GDP growth, demographic changes made a significant contribution to growth in GDP per capita in several countries such as Mexico, Korea, Turkey and Ireland.20 Mexican population was estimated to be 122,332 thousand in 2013 and projected to reach 125,927 thousand in 2025. Consequently, the Mexican economically active population is expected to expand to 56,412.6 thousand (67.17%) in the same year (see Graph 9 ).21 However, there are several risks that could undermine a demographic driver, e.g. the quality of Mexico's human capital. In order to benefit from the demographic bonus instead of just adding to the ranks of the unemployed, the country will need to improve its educational policies and investment.
Graph 9. Employment, % population, 15-64 in Mexico (projection)
Source: PwC
F - forecast
62.09
67.17
59
60
61
62
63
64
65
66
67
68
20
00
20
01
20
02
20
03
20
04
20
05
20
06
20
07
20
08
20
09
20
10
20
11
20
12
20
13
20
14
20
15F
20
16F
20
17F
20
18F
20
19F
20
20
F
Pe
rc
en
tag
e

22 Secretaría de Economia 23 DNB Country Report 24 Secretaría de Economia
Since taking the office in December 2012, President Enrique Peña Nieto passed a number of economic reforms which will enable foreign investors to invest in sectors, such as the telecommunications and energy, thus, increasing their competitiveness. 2013’s FDI increased by 178% from the 12.7 billion USD seen in 2012.22
Mexico is also a member of multinational and regional organizations, forums and other bodies such as World Trade Organization (WTO), the Asia-Pacific Economic Cooperation (APEC) and OECD. Mexico is the US’s largest trading partner - more than 78.8% of Mexican exports went to the United States in 2013 and it could overtake Canada as the United State’s principal trading partner. 24
Mexico is currently under negotiation for a new trade agreement that will boost the countries economy. The agreement is called Trans-Pacific Partnership, a negotiation between 11 countries. The participating countries are Mexico, the US, Canada, Chile, Peru, Australia, Malaysia, New Zealand, Singapore, Vietnam and Brunei. The agreement will enable Mexico reach 658 million people and a combined GDP of over 20 trillion USD. 25
Trade policy
Government policies
“A liberal trade regime and growing incomes will make the Mexican market increasingly attractive to exporters and investors”.23 Mexico has a large amount of agreements with many parties to facilitate better international trade. These include: 10FTAs (Free Trade Agreements) which help Mexico reach 45 countries; 30 Reciprocal Investment Promotion and Protection Agreements (RIPPAs); and 9 trade agreements (Economic Complementation and Partial Scope Agreements) within the framework of the Latin American Integration Association (ALADI).24
25 Euclid news
2. Shift in global economic power
2. Shift in global economic power
26 PwC
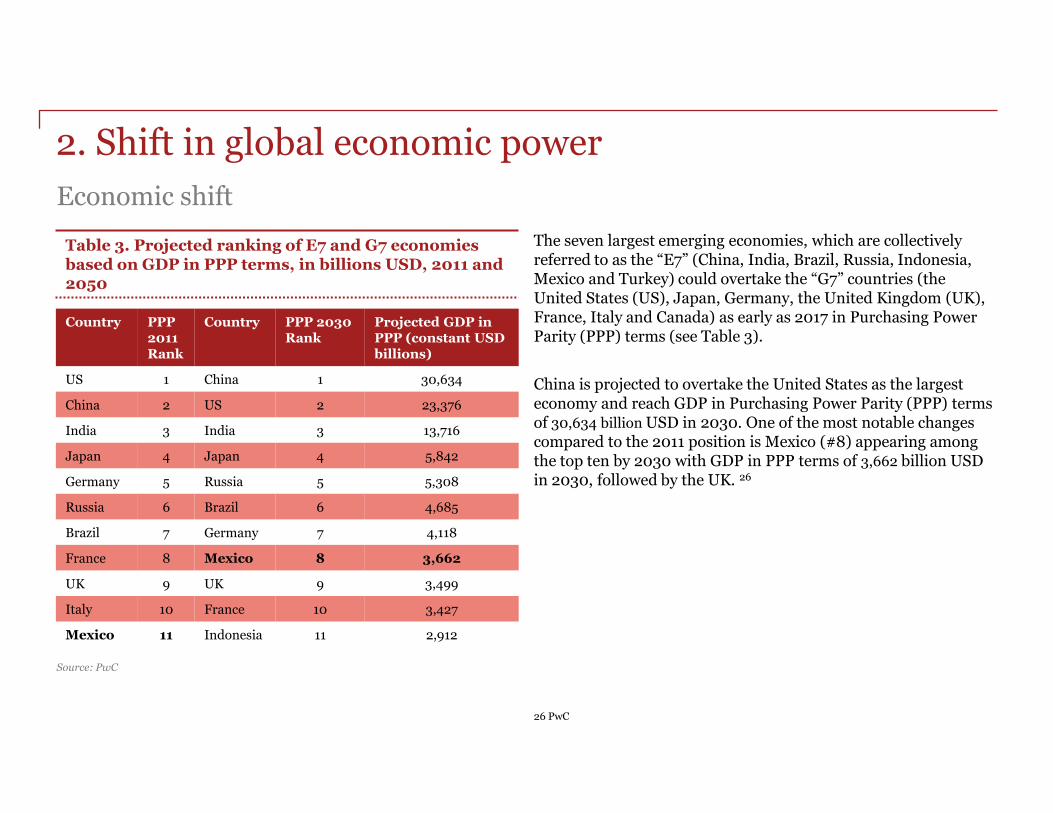
Economic shift
The seven largest emerging economies, which are collectively referred to as the “E7” (China, India, Brazil, Russia, Indonesia, Mexico and Turkey) could overtake the “G7” countries (the United States (US), Japan, Germany, the United Kingdom (UK), France, Italy and Canada) as early as 2017 in Purchasing Power Parity (PPP) terms (see Table 3).
China is projected to overtake the United States as the largest economy and reach GDP in Purchasing Power Parity (PPP) terms of 30,634 billion USD in 2030. One of the most notable changes compared to the 2011 position is Mexico (#8) appearing among the top ten by 2030 with GDP in PPP terms of 3,662 billion USD in 2030, followed by the UK. 26
Table 3. Projected ranking of E7 and G7 economies based on GDP in PPP terms, in billions USD, 2011 and 2050
Source: PwC
Country PPP 2011 Rank
Country PPP 2030 Rank
Projected GDP in PPP (constant USD billions)
US 1 China 1 30,634
China 2 US 2 23,376
India 3 India 3 13,716
Japan 4 Japan 4 5,842
Germany 5 Russia 5 5,308
Russia 6 Brazil 6 4,685
Brazil 7 Germany 7 4,118
France 8 Mexico 8 3,662
UK 9 UK 9 3,499
Italy 10 France 10 3,427
Mexico 11 Indonesia 11 2,912

27 PROSOFT 28 PROSOFT 2.0
In 2012, there were 4,050 economic units in the Mexico’s IT sector. Out of them, 56% were located in 4 states: the Federal District (DF), Nuevo León, Jalisco and Estado de México. The evolution of the IT sector is also impressive, the market value of the Mexico’s IT market went up from 3.95 billion USD in 2002 to 12.86 billion USD in 2011. The exports of services also increased from 1,750 billion USD in 2002 to 4,940 billion USD in 2011. The number of jobs in the sector also increased substantially, from 226,000 in 2002 to 600,000 in 2011.27
When it comes to profitability, BPO (Business Process Outsourcing) companies are the most profitable in the Mexico’s IT sector, followed by the companies in the software development and independent call centers in third place in 2011 (see Graph 10).28
Graph 10. Real income in Mexico’s IT sector, by company type, in 2008 and 2016 estimate, in millions MXN
Source: PROSOFT
In 2013, the government called for 700 billion MXN to be invested in the telecommunications sector. The investment will include the plans for two new satellites, two digital TV networks and expansion of the broadband to around 80,000 public sites and spaces.29
Mexico’s “First initiative” aims to certify 60,000 specialized workers in both technical and soft skills by 2013. The second “Mexico’s IT initiative” promotes the country as a nearshore outsourcing location for US companies. ProSoft initiative, the third one, offers subsidies and tax incentives for companies investing in the IT sector.30
29 PwC 30 A.T Kearney
32,669
14,196
1,318 177
53,089
23,880
2,317 480
BP
O
Soft
war
e d
evel
op
men
t
Ind
epen
den
t ca
ll c
ente
rs
Inte
ract
ive
med
ia
2008 2016F
Information Technology
F-forecast
2. Implications of shift in global economic power
3.Accelerating urbanization
The concept of city and urbanization starts to gain importance during the Industrial Revolution with the development of technology and consequent implementation in infrastructures like road, networks, sanitation, electricity distribution and others. The number of world population and urban agglomerations are still growing year after year. In 2013, the world population was around 7 billion, expecting to grow up to 9.5 billion by 2050. The number of agglomerations with more than 10 million inhabitants is expected to rise from 2 in 1960 to 36 in 2025 as a result of worldwide urbanization increase and the growth of regions like Latin America, the Middle East, North and Central Africa and South and East Asia.42 Latin America is expected to grow around 6.5% each year until 2025, an outcome from a growth of various factors like 461 million people entering the middle-class income, 567 million more people living in urban areas and an infrastructure expenditure of 1.5 trillion USD.43
Overview
42 UN 43 Frost &Sullivan
3. Accelerating urbanization
44 CONAPO 45 OECD 46 UN 47 UN 48 UNAM
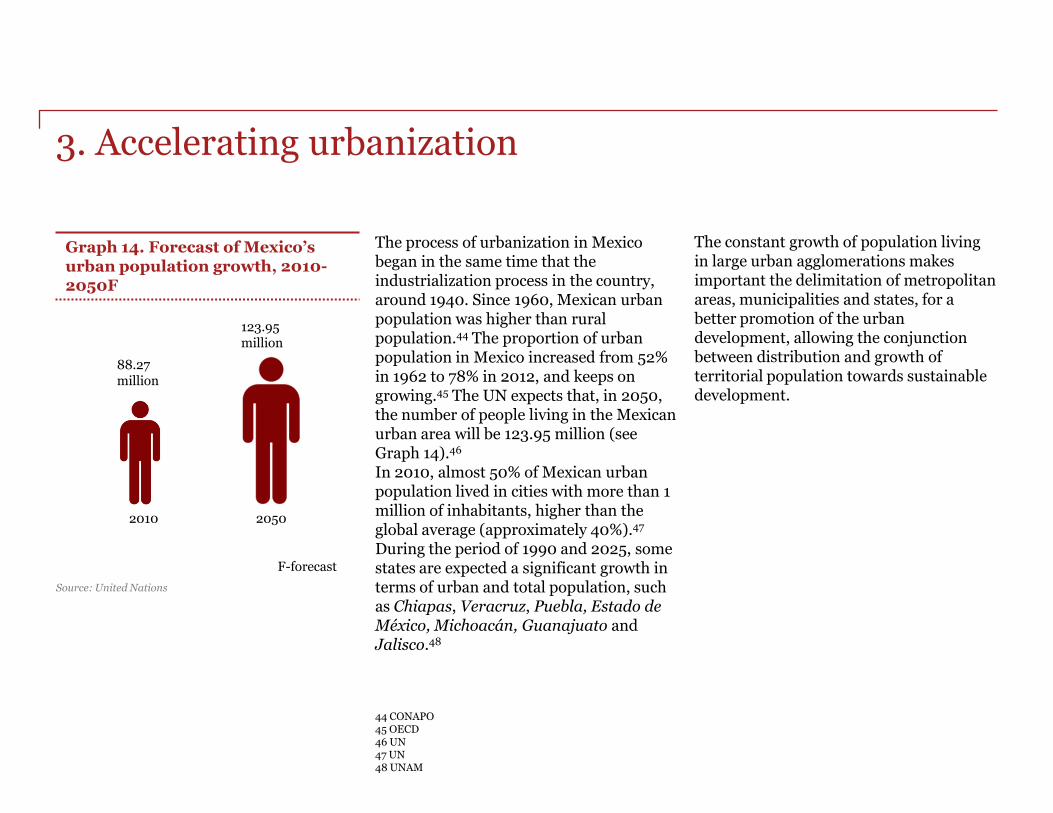
The process of urbanization in Mexico began in the same time that the industrialization process in the country, around 1940. Since 1960, Mexican urban population was higher than rural population.44 The proportion of urban population in Mexico increased from 52% in 1962 to 78% in 2012, and keeps on growing.45 The UN expects that, in 2050, the number of people living in the Mexican urban area will be 123.95 million (see Graph 14).46 In 2010, almost 50% of Mexican urban population lived in cities with more than 1 million of inhabitants, higher than the global average (approximately 40%).47 During the period of 1990 and 2025, some states are expected a significant growth in terms of urban and total population, such as Chiapas, Veracruz, Puebla, Estado de México, Michoacán, Guanajuato and Jalisco.48
Graph 14. Forecast of Mexico’s urban population growth, 2010-2050F
Source: United Nations
The constant growth of population living in large urban agglomerations makes important the delimitation of metropolitan areas, municipalities and states, for a better promotion of the urban development, allowing the conjunction between distribution and growth of territorial population towards sustainable development.
88.27 million
123.95 million
2010 2050
F-forecast

In Mexico, like in other countries, the concept of metropolitan areas is still a subject to a lot of discussion and complexity. In 2010 (according to national census), 53.8% of the total national population resided in 59 metropolitan areas in Mexico.49
It’s important to mention that the metropolitan zone of Valle de México is by far the largest metropolitan area in Mexico: in 2010, it combined the population of 16 municipalities from Distrito Federal, the 59 neighbor municipalities from Estado de México and the suburban municipality of Tizayuca (see Table 5). The newspaper Nuestro estimates that, by 2023, there will be at least 15,000 new colonies in metropolitan areas.49 The percentage of population living in the metropolitan areas is set to increase continuously until the end of the forecast period. The metropolitan areas will accommodate 57.2% of total country’s population in 2025. The remaining metropolitan areas will see a slight decline in the population, however, the total number of metropolitan areas is going to rise (see Graph 15).50
49 Nuestro 50 CONAPO
Table 5. The biggest metropolitan areas, in number of inhabitants in 2010
Source: CONAPO
Metropolitan Area Population in 2010
1. Valle de México 20,137,152
2. Guadalajara 4,434,252
3. Monterrey 4,080,329
4. Puebla 2,336,694
5. Toluca 1,846,602
Graph 15. Population percentage of the metropolitan areas, in millions
42.1 43.6 47.1 49.1
52.4 55.7 57.2
22.8 22.2 21.1 20.6 20.6 18.7 18.3
2010 2011 2014 2016 2021 2024 2025
More than one million The remaining metropolitan areas
Source: CONAPO and INEGI
3. Accelerating urbanization
F F F F F E
E-estimated F-forecast
E

51 SEMARNAT
Lower carbon economy
Source: SEDESOL, La Expan´sión de las Ciudades 1980-2010, 2012
Cities are the place where the production, cultural and artistic exchange happen and it generates knowledge and innovation in science and technology. Mexican cities grow with a model of territorial occupation in 3D – Distant, Disperse and Disconnect – meaning that expansion of the urban areas are disproportionate, fragmented and unplanned. This model of territorial occupation is highly unproductive, deepening inequality and generating high levels of pollution and GHG emissions. In turn, this situation increases the urban risk of climate change, like the occupation of territories susceptible to extreme weather events.51 Mexico has been engaged with a lower carbon economy, which, among other things, means reducing emissions of greenhouse gases (GHG) by 30% by 2020, compared to the baseline emissions. It seems difficult to reach the indicator above mentioned when World Bank estimates that the number of vehicles in Mexico was 32 million units in 2010 and if the trend continues, it will reach 70 million units in 2030. For a productive life of 40 years, Mexicans spend 3 years stuck in traffic jams. Mexico City loses 3.3 million man hours with traffic congestion, which is equivalent to 33 billion MXN annually.51
In the past 30
years, Mexico urbanized area
multiplied 6 times
when urban population has doubled.
3. Implications of accelerating urbanization
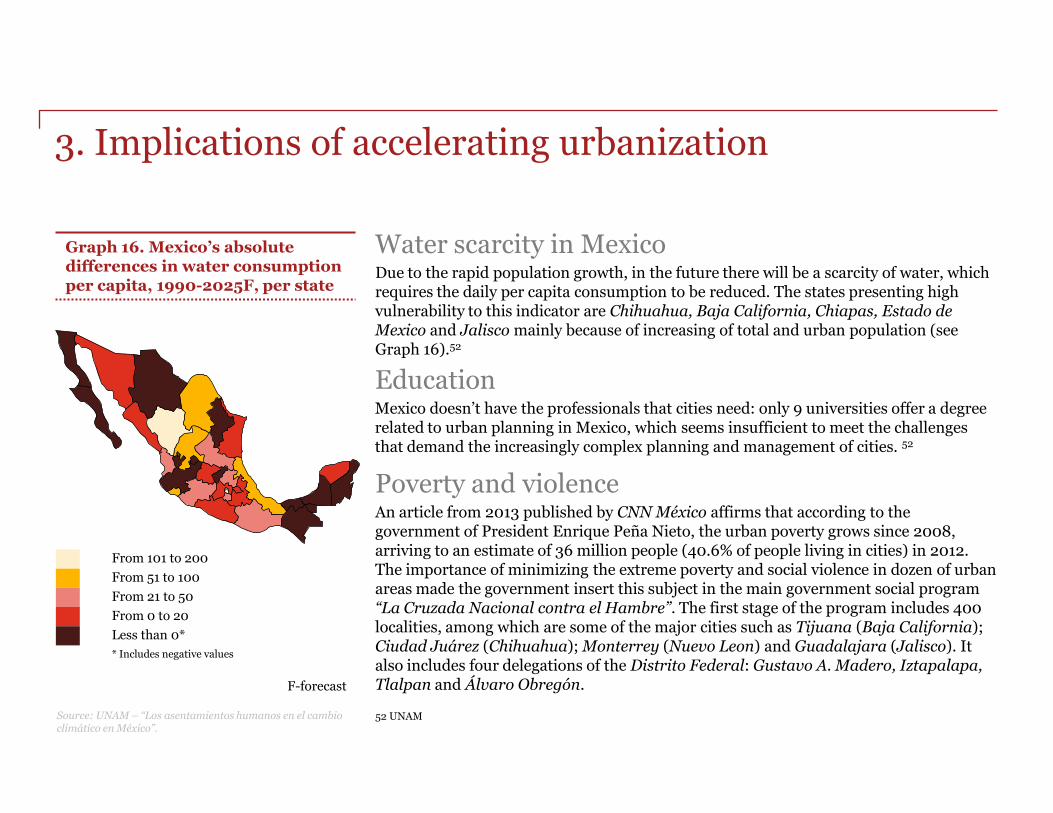
Due to the rapid population growth, in the future there will be a scarcity of water, which requires the daily per capita consumption to be reduced. The states presenting high vulnerability to this indicator are Chihuahua, Baja California, Chiapas, Estado de Mexico and Jalisco mainly because of increasing of total and urban population (see Graph 16).52
52 UNAM
Water scarcity in Mexico
Source: UNAM – “Los asentamientos humanos en el cambio climático en México”.
Education Mexico doesn’t have the professionals that cities need: only 9 universities offer a degree related to urban planning in Mexico, which seems insufficient to meet the challenges that demand the increasingly complex planning and management of cities. 52
Poverty and violence An article from 2013 published by CNN México affirms that according to the government of President Enrique Peña Nieto, the urban poverty grows since 2008, arriving to an estimate of 36 million people (40.6% of people living in cities) in 2012. The importance of minimizing the extreme poverty and social violence in dozen of urban areas made the government insert this subject in the main government social program “La Cruzada Nacional contra el Hambre”. The first stage of the program includes 400 localities, among which are some of the major cities such as Tijuana (Baja California); Ciudad Juárez (Chihuahua); Monterrey (Nuevo Leon) and Guadalajara (Jalisco). It also includes four delegations of the Distrito Federal: Gustavo A. Madero, Iztapalapa, Tlalpan and Álvaro Obregón.
Graph 16. Mexico’s absolute differences in water consumption per capita, 1990-2025F, per state
From 101 to 200
From 51 to 100
From 21 to 50
From 0 to 20
Less than 0*
* Includes negative values
3. Implications of accelerating urbanization
F-forecast
53 SEMARNAT
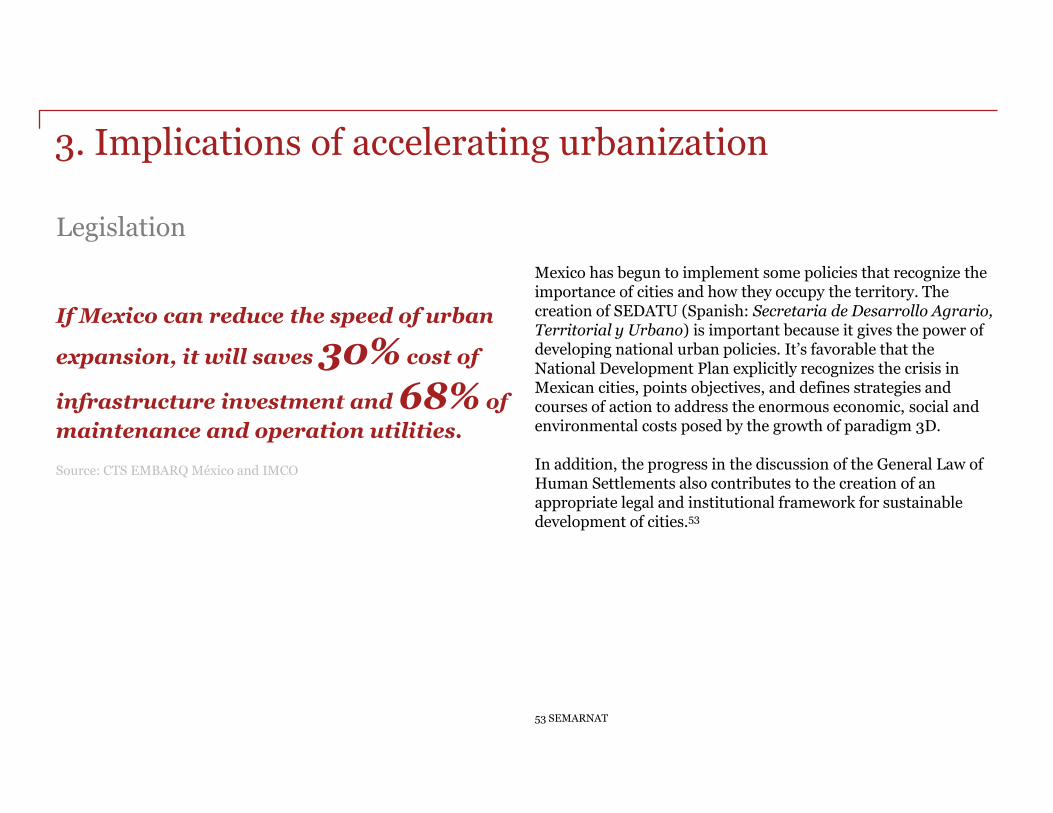
Legislation
Mexico has begun to implement some policies that recognize the importance of cities and how they occupy the territory. The creation of SEDATU (Spanish: Secretaria de Desarrollo Agrario, Territorial y Urbano) is important because it gives the power of developing national urban policies. It’s favorable that the National Development Plan explicitly recognizes the crisis in Mexican cities, points objectives, and defines strategies and courses of action to address the enormous economic, social and environmental costs posed by the growth of paradigm 3D. In addition, the progress in the discussion of the General Law of Human Settlements also contributes to the creation of an appropriate legal and institutional framework for sustainable development of cities.53
If Mexico can reduce the speed of urban
expansion, it will saves 30% cost of
infrastructure investment and 68% of
maintenance and operation utilities.
3. Implications of accelerating urbanization
Source: CTS EMBARQ México and IMCO
A researcher, Lorena Isla, affirmed that “Urbanization creates significant opportunities for investment in smart infrastructure and new market opportunities for innovative products aimed at urban households".54 On July 15th, 2013, Mexico’s president Enrique Peña Nieto, unveiled the “Transport and Communications Infrastructure Investment Program 2013-2018” that plans to invest 4 trillion MXN (315 billion USD) in the nation’s infrastructure over the six-year period.55 For the same period of time, IMEF defined a portfolio of 1,138 strategic projects in infrastructure, where 6 of them will be for urban social development (see Table 6). Also 69 projects were identified to increase logistical competitiveness, with transport infrastructure having 24 projects followed by oil and gas infrastructure with 20 projects, electricity infrastructure wit 12 projects. The last two water and sanitation and telecommunications infrastructure had less that 10 projects planned.56
54 Pulsosocial 55 Presidencia de la Republica, Mexico 56 IMEF
Table 6. Strategic projects in infrastructure for urban social development, 2013-2018, in million USD
Investment in infrastructure
Project Investment
1 Urban transportation 15,433
2 Urban water and sanitation 14,735
3 Urban economic development 11,292
4 Urban connectivity network 6,671
5 Education and training 2,945
6 Telecommunications for safety 2,778
Total 53,854
Source: IMEF
3. Implications of accelerating urbanization

4. Resource scarcity and climate change
PwC makes several predictions about the global climate. Between 2013 and 2030, average temperatures are expected to increase between 0.5°C and 1.5°C (a considerable increase considering they have risen by 0.5°C over the past 20 years). This is due in part to an increased dependency on fossil fuels, which will lead to a rise of 16% in carbon emissions for the same period. By 2030, the worldwide population is expected to reach 8.3 billion people, which will raise the global demand for resources such as energy, water, and food (see Graph 11).31
Overview
31 PwC
40% more water
50% more energy
35% more food
Graph 11. With a population of 8.3 billion people by 2030, we will need:
Source: PwC
4. Resource scarcity and climate change
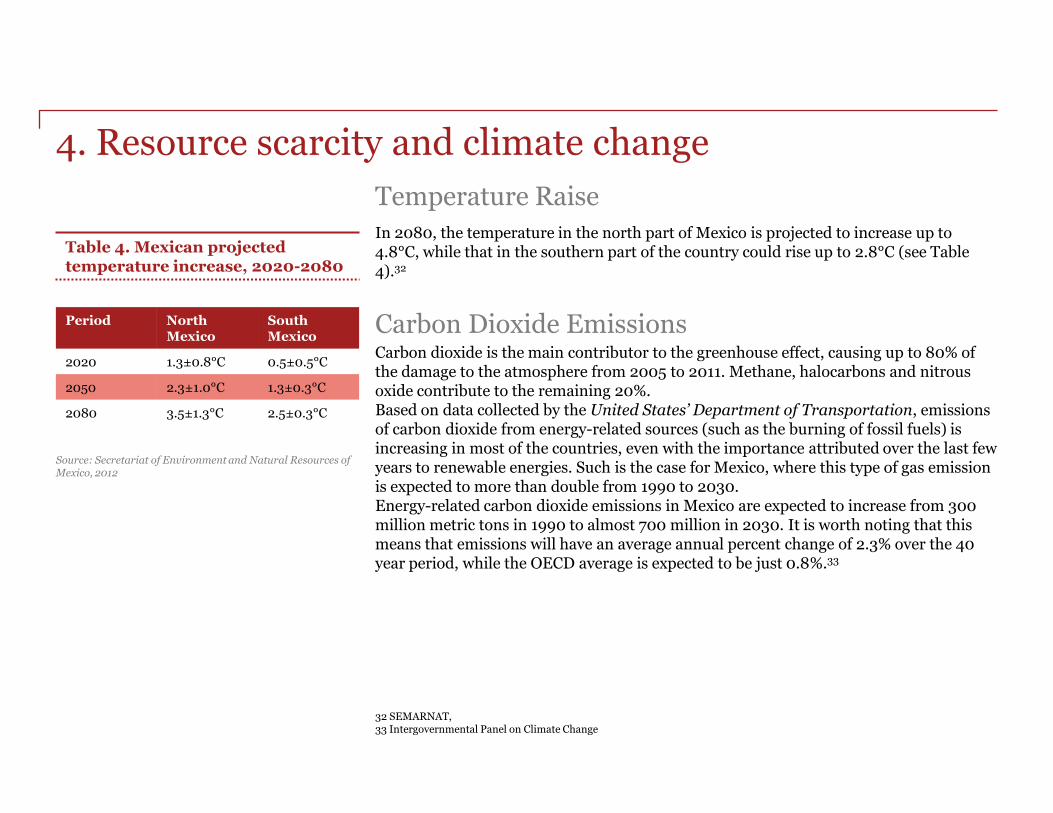
In 2080, the temperature in the north part of Mexico is projected to increase up to 4.8°C, while that in the southern part of the country could rise up to 2.8°C (see Table 4).32
32 SEMARNAT, 33 Intergovernmental Panel on Climate Change
Carbon dioxide is the main contributor to the greenhouse effect, causing up to 80% of the damage to the atmosphere from 2005 to 2011. Methane, halocarbons and nitrous oxide contribute to the remaining 20%. Based on data collected by the United States’ Department of Transportation, emissions of carbon dioxide from energy-related sources (such as the burning of fossil fuels) is increasing in most of the countries, even with the importance attributed over the last few years to renewable energies. Such is the case for Mexico, where this type of gas emission is expected to more than double from 1990 to 2030. Energy-related carbon dioxide emissions in Mexico are expected to increase from 300 million metric tons in 1990 to almost 700 million in 2030. It is worth noting that this means that emissions will have an average annual percent change of 2.3% over the 40 year period, while the OECD average is expected to be just 0.8%.33
Carbon Dioxide Emissions
Table 4. Mexican projected temperature increase, 2020-2080
Period North Mexico
South Mexico
2020 1.3±0.8°C 0.5±0.5°C
2050 2.3±1.0°C 1.3±0.3°C
2080 3.5±1.3°C 2.5±0.3°C
Source: Secretariat of Environment and Natural Resources of Mexico, 2012
Temperature Raise

According to a study led by Mexico’s Federal Commission Against Sanitary Risks (COFEPRIS), in 2012, climate change can have negative effects on Mexico’s population. Increases in temperature can lead to the proliferation of diseases such as dengue fever, as well as a larger amount of cases of heat strokes in people, both of which can be deadly, particularly in infants and the elderly. Statistical data shows that in the case of countries in the European Union, an increase of 1°C in temperature can lead to an increase in the mortality rate of between 1% and 4%.35
34 OECD 35 COFEPRIS 36 SAGARPA
Adverse health effects
Graph 12. Projected loses of agricultural income of Mexican states (in % of agricultural income), 2008-2050F
Source: SAGARPA
Mexico’s Secretaría de Agricultura, Ganadería, Desarrollo Rural, Pesca y Alimentación (SAGARPA) released a report which tried to highlight the impact of climate change in the sector in the medium- to long-term. The study found that if the trend of increasing temperature and reducing rainfall continued, by 2050 many Mexican states would be faced with catastrophic losses. The map on the left tells us that from 2008 to 2050 only 6 of all the Mexico’s states will see an increase in their agricultural income, while the rest of them will suffer in this regard. States like Guerrero will see total losses, which means their agriculture sector will be completely decimated by adverse weather conditions (see Graph 12). If the analysis is extended to the year 2099, the outlook is even worse. By then, more than half of Mexico’s states will have lost over 50% of their agricultural incomes, due to the inability to properly grow crops such as corn, wheat, orange and beans, and more difficulties in taking care of livestock.36
Adverse agriculture effects
Total loss
Loss greater than 50%
Loss between 0% and 50%
Income Increase
4. Implications of resource scarcity and climate change Mexico is vulnerable to the impacts of climate change on many fronts with 68% of the Mexican population and 71% of GDP strongly exposed to climate change risk. Potential threats of climate change for Mexico include higher temperatures; lower rainfall in the north and storms and heavy seasonal rainfall in the south; stronger hurricane activity and intensity; and a sea level rise of 20 cm by 2050.34
F-forecast

37 ProMéxico Negocios 38 ProMéxico
Mexico has good conditions for the development of renewable energy.37 To give an example, Mexico’s sun exposure during a period lasting six hours generates the same amount of energy that is consumed during the whole year. In terms of wind power, the estimation of Mexico’s technically usable wind power potential is 14% of the current total installed capacity for electricity generation. The untapped potential for wind power in exact numbers in Mexico totals 40,000 MW, while it stands at 53,000 MW for hydro power and 40,000 MW for geothermal in 2012. In 2012, FDI (Foreign Direct Investment) announcements by companies for renewable energy in Mexico totaled 1,442 million USD. The capacity for electricity generation in renewable energy in Mexico is expected to increase substantially, with hydro power taking the lead, followed by wind and solar power (see Graph 12).38
Renewable energy
990
283
100 83 3 12
1602
1035
406
244
91 59
Hydro Wind Solar Biomass Solar (CSP) Other
2012 2035
Graph 13. Installed capacity for electricity generation in Mexico, in GW, 2012-2035F
Source: Secretaría de Economia
4. Implications of resource scarcity and climate change
F-forecast
39 El Economista 40 Universopyme
In commemoration of the World Environment Day in 2013 Juan José Guerra Abud stated that Mexico had a responsibility to demand other countries to reduce their greenhouse gases (GHG) emissions, seeing how Mexico only generates around 1.4% of these gases on a global scale. Juan José Guerra Abud also stated that the country has a long way to go in terms of handling deforestation, solid waste management issues and mentioned the low participation of green businesses in terms of Gross Domestic Product (GDP), which is barely 0.6% for Mexico and 10% in Denmark, a leader in this topic.
Green economy in Mexico
Circular economy
During the World Economic Forum’s Annual Meeting 2014, Ellen MacArthur Foundation announced “Project Mainstream”. The project will help businesses to shift towards a circular economy and, as a result, it will save 500 million USD in materials and prevent 100 million tons of waste globally. The term “Circular Economy” refers to an industrial economy that relies on renewable energy, minimizes, tracks, and eradicates waste through careful design. The first “Project Mainstream” report estimates that the transition to a circular economy could contribute 1 trillion USD a year by 2025 to the global economy and create 100,000 new jobs within the next five years, if companies would commit to change.41
41 Ellen MacArthur Foundation
The president of the Mexican Association of Environmental Impact, Ricardo Juarez Palacio is asking for urgent update on the country’s legal framework. That is because the General Law of Ecological Equilibrium was cutting edge at the time it was passed which was 25 years ago with a second law passed 14 years ago, but they have a need for update to reflect current situation better. 39 The green economy is slowly growing in Mexico with the sectors such as mass transit, clean industry, construction, agriculture, renewable energy and waste management providing most direct green jobs. The green sectors that provide most indirect jobs are manufacturing electricity manufacturing and supply, waste management and temporary accommodation.40
4. Implications of resource scarcity and climate change

5. Technological breakthroughs
With an unimpressive growth across much of the globe, promoting new sources of growth has become a global policy priority. Science, technology, innovation and entrepreneurship have a positive impact on competitiveness, productivity and job creation, and are important mechanisms for sustainable growth.57 A representative of CONACYT (Spanish: Consejo Nacional de Ciencia y Tecnología), Enrique Cobrero says that Mexico still lags behind many countries in terms of number of researchers per one thousand inhabitants, where Mexico has only 1 researcher, when South Korea has 12; the United States, 9; Canada, 8; and Spain, 6. Other indicators that Mexico needs to catch up are articles published and patents registered.58
Overview
57 OECD 58 El Financiero

59 World Intellectual Property Organization 60 IMPI
CONACYT estimates a coefficient of inventiveness to determine the countries’ degree of inventiveness. It measures the number of national applications for patents per 10,000 inhabitants and the proportion of the population devoted to technological activities. A higher coefficient indicates more technological activities currently being undertaken in the country. In Mexico, the coefficient has increased significantly since 2008, going from 0.064 in 2008 to 0.107 in 2012 (see Graph 17).
Mexico is the 17th country with the most registered patents in the world, with over 77 thousand registered patents.59 According to Instituto Mexicano de la Propiedad Industrial (IMPI), Mexico has had around 15 thousand patent requests per year since 2008 and has granted over 10 thousand of these per year as well.60
Patents
While patents requests and patents granted have remained relatively stable since 2008, they have not seen any growth, which indicates Mexico needs to provide further incentives and support for both intellectual property and production of technological breakthroughs in the country. This is further illustrated by the fact that over half of patent requests and granted patents came from the United States. In 2013, a measly 302 patents were granted to Mexicans, out of a total of 10,343, according to data from IMPI (see Graph 18).60
Graph 17. Mexico’s coefficient of inventiveness, 2008-2012
0.064 0.076 0.08
0.093 0.107
2008 2009 2010 2011 2012
Source: CONACYT
14,576 14,055 15,314 15,444
3,935
9,399 11,485 12,330
10,343
2,204
2010 2011 2012 2013 2014*
Applications Granted
Graph 18. Number of patents requests and patents granted to Mexico, 2008-2014*
Source: IMPI
*data until March
5. Technological breakthroughs

61 World Economic Forum
The World Economic Forum (WEF) releases a yearly report known as the Global Competitiveness Report, which ranks countries based on their overall global competitiveness, which is based on 12 different pillars. One of these pillars is innovation, which measures how capable countries are of producing technological breakthroughs.
Mexico has seen vast improvements in its ranking in terms of innovation, going from 90th place worldwide in 2008 to 55th place in 2013 (see Table 7). The biggest areas in which Mexico needs to improve in order to further increase its ranking are: its capacity for innovation, government procurement of advanced technological products and its availability of highly qualified scientists and engineers.61
Competitiveness
Table 7. Mexico’s ranking in the WEF’s Global Competitiveness Report Innovation Pillar
Source: WEF
Year of WEF Report World Ranking in
Innovation
2013-2014 55th
2012-2013 56th
2011-2012 63rd
2010-2011 78th
2009-2010 78th
2008-2009 90th
5. Technological breakthroughs

62 CONACYT
According to estimates made by CONACYT, the number of people working in the Science and Technology sector in Mexico was 10.6 million in 2012, an increase of around 200 thousand workers compared to 2011 (see Graph 19). In terms of gender composition, in 2012, 50.7% were males and 49.3% were females. According to the same report, out of the 10.6 million people working for the Mexico’s Science and Technology sector in 2012, only around 3,3 million had a science degree. The majority of them had a bachelor’s degree (87.1%), followed by those having a master’s degree (11.9%). Students with a PhD represented only 1%.62
Employment
Graph 19. Base of science and technology human resources in Mexico in millions, 2008-2012
Source: CONACYT
9.5
9.8
10.1
10.4
10.6
2008 2009 2010 2011 2012E
E-estimation
5. Technological breakthroughs

63 El Economista 64 CONACYT 65 OECD
The President Peña Nieto formalized the creation of the General Council on Scientific Investigation, Technological Development and Innovation in September 2013, therefore, announcing about renewed support for technology and innovation in the country.623Historically, Mexico’s public investment in science, technology and innovation has hovered at around 0.4% of the country’s GDP. The budget of CONACYT which provides scholarship, investigation funds, and more, has also been steadily increasing in the past decade (see Graph 20). 64
The President also confirmed the goal of the current government, which is to bring the investment to around 1% of GDP, placing it around the average of other developing countries. However, this should only be considered the first step for Mexico, taking into account that the OECD average investment in 2011 stood at 2.3%, and countries like Finland, Japan and Korea invested over 3.5% of their GDP in the sector. 65
Investment
Graph 20. Mexican public investment on science, technology and innovation (as % of GDP), 2006-2013
Source: Scientific and Technologic Consulting Forum (FCCyT)
0.36
0.39
0.42 0.41
0.40
2008 2009 2010 2011 2012
5. Technological breakthroughs

66 BMI
The future brings positive outlook for the information technology industry in Mexico. It is forecasted that the market will grow by 6.9% in 2014 to reach a total value of 293.3 billion MXN. This growth is expected to be bigger than the one achieved in 2013 because of the slight shift in consumption from notebooks and low-cost tablets. 66
The compound annual growth rate for the period 2014-2018 is forecasted to be around 7%, with the market expected to reach a value of 385.4 billion MXN in 2018, which will represent 1.7% of GDP (see Graph 21).66
Some of the factors expected to influence the IT market’s development are a low PC penetration and an increased move to online services, which will drive the demand for IT services and software. It is important to mention that the government spending will represent a key driver across all the industry segments.
Forecast
Graph 21. Forecast of the value of Mexico’s IT industry and contribution to GDP (billion MXN and %), 2014-2018
Source: BMI
0
0.2
0.4
0.6
0.8
1
1.2
1.4
1.6
1.8
0
50,000
100,000
150,000
200,000
250,000
300,000
350,000
400,000
450,000
2014 2015F 2016F 2017F 2018F %
of G
DP
Mil
lio
n M
XN
Market value % of GDP
5. Technological breakthroughs
F-forecast
5. Implications of technological breakthroughs
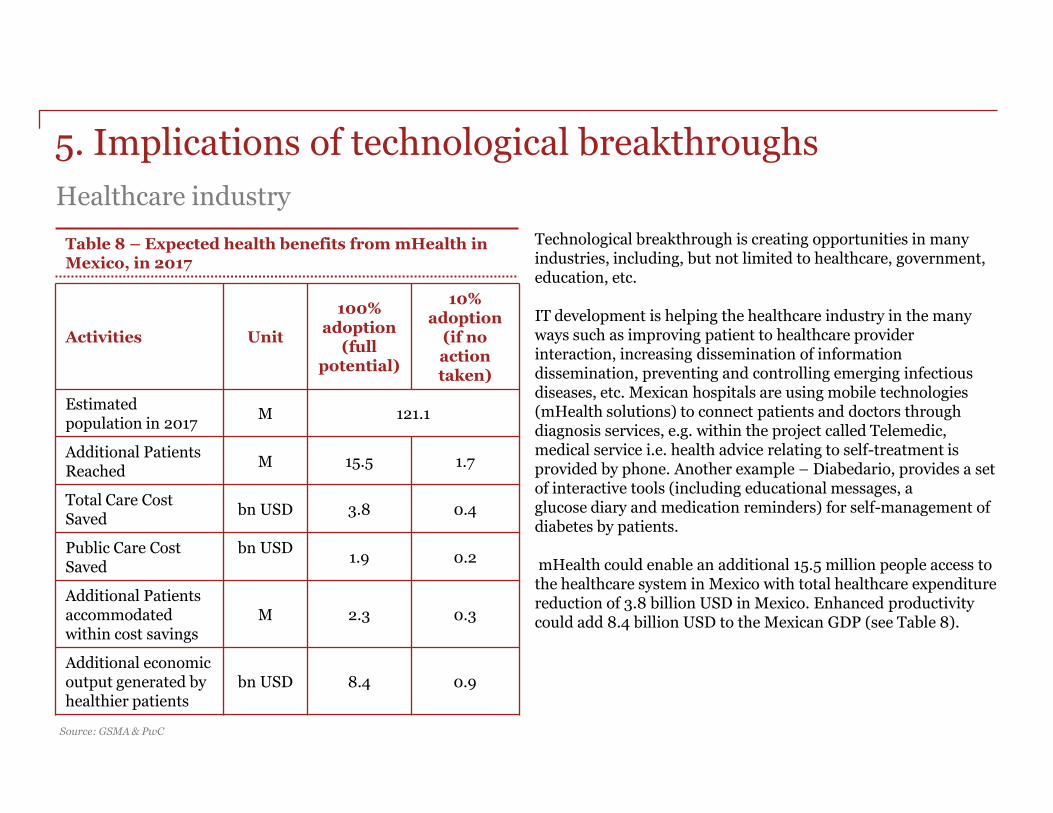
Technological breakthrough is creating opportunities in many industries, including, but not limited to healthcare, government, education, etc. IT development is helping the healthcare industry in the many ways such as improving patient to healthcare provider interaction, increasing dissemination of information dissemination, preventing and controlling emerging infectious diseases, etc. Mexican hospitals are using mobile technologies (mHealth solutions) to connect patients and doctors through diagnosis services, e.g. within the project called Telemedic, medical service i.e. health advice relating to self-treatment is provided by phone. Another example – Diabedario, provides a set of interactive tools (including educational messages, a glucose diary and medication reminders) for self-management of diabetes by patients. mHealth could enable an additional 15.5 million people access to the healthcare system in Mexico with total healthcare expenditure reduction of 3.8 billion USD in Mexico. Enhanced productivity could add 8.4 billion USD to the Mexican GDP (see Table 8).
Healthcare industry
Table 8 – Expected health benefits from mHealth in Mexico, in 2017
Source: GSMA & PwC
Activities Unit
100% adoption
(full potential)
10% adoption
(if no action taken)
Estimated population in 2017
M 121.1
Additional Patients Reached
M 15.5 1.7
Total Care Cost Saved
bn USD 3.8 0.4
Public Care Cost Saved
bn USD
1.9 0.2
Additional Patients accommodated within cost savings
M 2.3 0.3
Additional economic output generated by healthier patients
bn USD 8.4 0.9

Contact us:
© 2014 PwC Mexico. All rights reserved. PwC (www.pwc.com) provides industry-focussed assurance, tax and advisory services to build public trust and enhance value for our clients and their stakeholders. More than 163,000 people in 151 countries across our network share their thinking, experience and solutions to develop fresh perspectives and practical advice.
“PwC” refers to PwC Mexico which is a member firm of PricewaterhouseCoopers International Limited (PwCIL), each member firm of which is a separate legal entity and does not act as agent of PwCIL or any other member firm. No member firm is responsible or liable for the acts or omissions of any other member firm nor can it control the exercise of another member firm’s professional judgement or bind another member firm or PwCIL in any way.
If you have more questions about the topic or wish to learn more about other Mexican industries, please contact:
José Antonio Quesada Partner Clients & Markets [email protected] (55) 5263 6070
Manuel Flores De Orta Sr. Specialist Manager Knowledge Management and Knowledge Center Clients & Markets [email protected] (55) 5263 8543
Alexandra Mendes Consultant [email protected] (55) 5263 7536
Ekaterina Ponkratova Consultant
[email protected] (55) 5263 7586