GLOBAL MARKETS · 2019-05-02 · GLOBAL MARKETS STRUCTURED PRODUCTS HANDBOOK EQUITY DERIVATIVES...
74
GLOBAL MARKETS STRUCTURED PRODUCTS HANDBOOK EQUITY DERIVATIVES Intended for Institutional and Accredited Investors (in Singapore) only. This document has been prepared for discussion purposes only and does not constitute an offer or a solicitation to engage in any trading strategy or the purchase or sale of any financial instrument. This document is provided to you on a confidential basis. It must not be circulated, distributed reproduced or disclosed to any other person without the prior written consent of BNP Paribas.
Transcript of GLOBAL MARKETS · 2019-05-02 · GLOBAL MARKETS STRUCTURED PRODUCTS HANDBOOK EQUITY DERIVATIVES...

GLOBAL MARKETSSTRUCTURED PRODUCTS
HANDBOOK EQUITY DERIVATIVES
Intended for Institutional and Accredited Investors (in Singapore) only.
This document has been prepared for discussion purposes only and does not constitute an offer or a solicitation to engage inany trading strategy or the purchase or sale of any financial instrument.
This document is provided to you on a confidential basis. It must not be circulated, distributed reproduced or disclosed to anyother person without the prior written consent of BNP Paribas.

G L O B A L M A R K E T S
Contents 1
Contents
G E N E R A L F O R E W O R D
Appendix
Introduction to Options 48
Vanilla Options 49
Long / Short Position 50
Introduction to Forwards / Futures 52
Collar 53
Call Spread 54
Put Spread 55
Straddle 56
Strangle 57
Barrier 58
Asian 59
Binary 60
Lookback 61
Option Pricing 62
Black-Scholes Model 64
Grid Methods Binomial Tree 66
Simulations - the Monte Carlo Methods 67
Efficient Frontier 68
Efficient Frontier with Lookback 69
Volatility Modelling –
Local or Stochastic Vol?70
Fund-linked Structured Products 71
PayoffsCapital Guaranteed Products
CPPI 14
Himalaya 16
Coupon Comet 18
Captibasket 20
ODB 22
Starlight 24
Stellar 26
Coupon Driver 28
Lookback 30
Profiler 32
Talisman 34
Non-capital Guaranteed Products
Reverse Convertible 36
Certificate Plus 38
Tempo 40
Athena 42
Knock Out Forward 44
Introduction
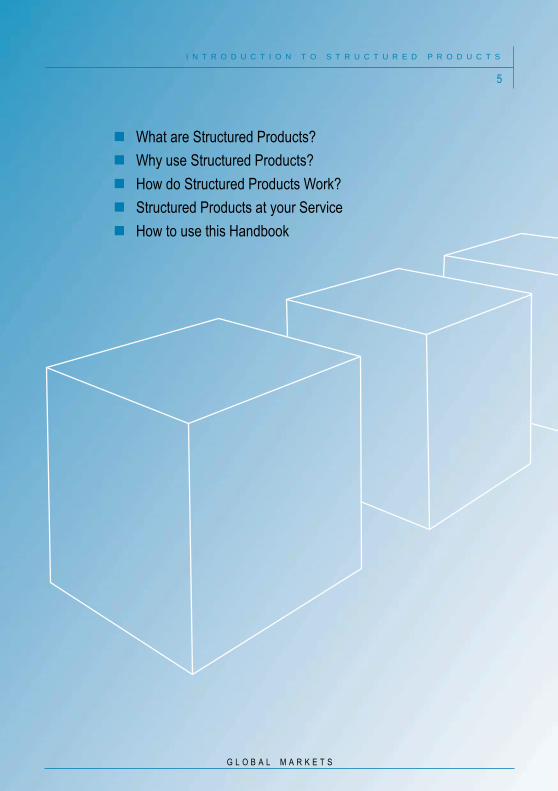
What are Structured Products? 6
Why use Structured Products? 7
How do Structured Products Work? 8
Structured Products at your Service 10
How to use this Handbook 11

B N P P A R I B A S
A Global Leader...
I N T R O D U C T I O N T O B N P P A R I B A S
With strong roots anchored in Europe’s
economic history, BNP Paribas supports its
customers in today’s changing world and has
positioned itself as a leading bank in the
Eurozone and a prominent international
banking institution.
BNP Paribas Global Markets offers a full
range of products which can be customised
to address the various needs of financial
institutions and asset managers as well as
corporate and retail clients.
Global Markets is part of a strong Corporate and
Institutional Bank within a diverse and stable
group, BNP Paribas, which has positioned itself as
a leader in Equity Derivatives.
Our renowned quantitative skills in advanced
product design allow us to work in partnership with
clients, delivering solutions to support your
interests, your projects and your business, in all
markets.
Risk Awards 2019
Derivatives House of the
Year
The Banker Investment
Banking Awards 2018
Most Innovative Investment
Bank for Structured
Investment Products
Most Innovative Investment
Bank for Equity Derivatives
IFR Awards 2017
Derivatives House of the
Year
Equity Derivatives House of
the Year
Global Capital Derivatives
Awards 2017
Derivatives Bank of the Year
2018 Asian Private Banker
Structured Products Awards
for Excellence
Structured Products House
of the Year
Best Provider of Non-Flow
Equity-Linked Structured
Products
Best Single Dealer Platform
Global Capital Americas
Derivatives Awards 2018
Volatility Derivatives Bank of
the Year
2 A Global Leader

G L O B A L M A R K E T S
A Global Leader 3
I N T R O D U C T I O N T O B N P P A R I B A S
A Forerunner in
Structured Products...BNP Paribas has a team of experienced
structurers offering an impressive spectrum of
product expertise. With the design of future
Structured Products in mind, BNP Paribas is
constantly developing and introducing new
products that complement investors’ traditional
portfolios, which often consist of a mix of equity
and fixed income securities.
Structured Products can be constructed to provide
investors with new means of enhancing their
existing portfolios. They enable clients to access
new markets and diverse asset classes, while
providing features such as capital guarantee,
leverage or yield enhancement.
BNP Paribas is an established leader in
Structured Products, providing solutions to retail
distributors, banks and institutional investors
worldwide. BNP Paribas offers a rich range of
Structured Products, both in terms of underlying
assets and payoff structures.
Structured Products designed by BNP Paribas
Global Markets are generally linked to equities,
through shares or indices (basket or single) but
may also be linked to commodities, funds,
foreign exchange, interest rates, inflation and
“Hidden Assets.”1This expansion beyond
traditional underlying assets allows investors to
gain access to a wider range of diversification
opportunities.
1 “Hidden Assets” are non-directly observable market parameters which come into account when pricing equity
derivatives (e.g. volatility, correlation, etc.) They form a new generation of assets and display portfolio hedging /
diversification properties.
The BNP Paribas Structured Products Handbook is designed to introduce the reader to Structured
Products and how they enable investors to meet their distinct investment objectives. The handbook
introduces the range of underlyings available, explains the basic mechanism of Structured Products: the
combination of a fixed income security and an option-like instrument, and then provides examples of
product structures and the most commonly used wrappers. The appendix gives an overview of options,
the building blocks of Structured Product design.
Capital guarantee is subjected to creditworthiness of
the issuer.

B N P P A R I B A S
Introduction to
Structured Products
I N T R O D U C T I O N T O S T R U C T U R E D P R O D U C T S
4
5
I N T R O D U C T I O N T O S T R U C T U R E D P R O D U C T S
G L O B A L M A R K E T S
What are Structured Products?
Why use Structured Products?
How do Structured Products Work?
Structured Products at your Service
How to use this Handbook

B N P P A R I B A S
What are
Structured Products?
I N T R O D U C T I O N T O S T R U C T U R E D P R O D U C T S
6 What are Structured Products?
Structured Products can be extensively
customised to meet a specific investor’s risk /
return profile and investment objectives.
As fully customised investment tools, Structured
Products are shaped by numerous factors. The
current Market Outlook influences both the
Objectives in terms of the Investor and Distributor
Goals as well as the Structured Product Design.
Simultaneously, the Investor and Distributor Goals
influence the Structured Product Design which
involves selecting the appropriate Underlying
Assets, Payoff Structures and Legal Wrappers.
This interlinked process enables Structured
Products to be tailor-made, corresponding to the
investor and market needs.
Structured Products are investments that are fully
customised to meet specific objectives such as
capital guarantee, diversification, yield
enhancement, leverage, regular income, tax /
regulation optimisation and access to non-
traditional asset classes, amongst others.
The strength of a Structured Product lies in its
flexibility and tailored investment approach. In
their simplest form, Structured Products offer
investors full or partial capital guarantee coupled
with an equity-linked performance and a variable
degree of leverage. They are commonly used as
a portfolio enhancement tool to increase returns
while limiting the risk of loss of capital.
ObjectivesInvestor Goals
■ Principal Guarantee
■ Hedging
■ Enhanced Return
■ Market Access
■ Tax Efficiency
■ Diversification
Distributor Goals
■ Target Fees
■ Suitability
■ Previous experience
■ Product preference
■ Internal constraints
■ Bullish ■ Bearish
Market Outlook
■ Volatile ■ Correlated
Structured Product Design
Underlying Assets
■ Equities or Indices
■ Commodities
■ Funds
■ Foreign Exchange
Payoff Structures
Legal Wrappers
■ OTC
■ Note
■ Certificates
■ Warrants
■ Fund
■ Life insurance policy
■ Structured deposits
■ Rates
■ Credit
■ Hybrids
■ Hidden Assets
■ Stable ■ Uncertain
Capital guarantee is subjected to creditworthiness of the issuer.

G L O B A L M A R K E T S
Why use Structured Products? 7
I N T R O D U C T I O N T O S T R U C T U R E D P R O D U C T S
Why use
Structured Products?The key benefits of using Structured Products are
Protection Principal Guarantee: Capital guarantee at
your preferred level
Hedging: Protect the portfolio by hedging the
risks of existing investments
Efficiency Enhanced Return: Increase the
portfolio’s return while controlling risk
Market Access: Exposure to new or
hard to access asset classes (property,
emerging markets, etc.) and hidden
asset classes (volatility, correlation, etc.)
Tax Efficiency: Benefit from customised,
tax efficient portfolio investment solutions
Diversification Diversification: Diversify with the adjustable
risk / return profiles and market cycle
optimisation capabilities of Structured Products
Capital guarantee is subjected to creditworthiness of the issuer.

B N P P A R I B A S
How do Structured
Products Work?
I N T R O D U C T I O N T O S T R U C T U R E D P R O D U C T S
8 How do Structured Products Work?
In its most basic form, an equity derivative
Structured Product consists of a zero coupon
bond, purchased at a discount, and an option.
At maturity, the zero coupon bond will be
redeemed at par, thereby providing investors
capital guarantee.
The option, which offers investors participation in
the equity market, pays out the performance of the
underlying at maturity, if it is above the strike price
(call option).
A typical capital guaranteed Structured Product is
comprised of two components:
1 A fixed income security, typically a zero
coupon bond, which guarantees part or all of
the invested principal at maturity.
2 An option-like instrument which
provides a payoff in addition to the fixed
income payments. This additional payoff
is linked to the performance of an
underlying asset and takes the form of
either regular coupons or a one-off gain at
maturity.
Strike
Price
MaturityFOR ILLUSTRATIVE PURPOSES ONLY
Value
Option
Underlying
+
Value
100
<100
Zero Coupon Bond
Zero Coupon Bond Call Option Value at Expiration
Capital guarantee is subjected to creditworthiness of
the issuer.

G L O B A L M A R K E T S
How do Structured Products Work? 9
I N T R O D U C T I O N T O S T R U C T U R E D P R O D U C T S
Maturity
32
100
88.4
88.4
S&P 500
Structured Product
Assuming a five-year S&P 500 call option costs
12, and adding 2 for administration and
management fee costs, the investor will benefit
from an 80% [i.e. (11.6 – 2) / 12] participation in
the S&P 500 upside, while having 100% of his
capital guaranteed at maturity.
Example
An investor wants to invest USD 100 over five
years, with full capital guarantee and exposure to
the S&P 500 index upside.
With a five-year US Treasury rate of 2.5% p.a., a
five-year zero coupon bond is worth 88.4, i.e. 100
in five years is worth 88.4 now. This leaves the
structure provider with 11.6 (i.e. 100 – 88.4) to
purchase an option on the S&P 500 and pay for
administration costs and commission.
Pessimistic Scenario
If the S&P 500 is down by 30% after five years, the
investor will receive 100% of his capital at
maturity.
Optimistic Scenario
If the S&P 500 goes up by 40% over the five
years, the investor will achieve a return of 32%
(80% x 40%) on top of his initial capital.
Maturity
10011.6
S&P 500
Structured Product
FOR ILLUSTRATIVE PURPOSES ONLY
Underlying ValueUnderlying Value
Optimistic Illustration Pessimistic Illustration
Capital guarantee is subjected to creditworthiness of the issuer.
B N P P A R I B A S
Structured Products
at your Service
I N T R O D U C T I O N T O S T R U C T U R E D P R O D U C T S
10 Structured Products at your Service
Whatever the investment objective, BNP Paribas’
Structured Products offer investors a valuable
alternative to traditional investment vehicles. In this
handbook, we present the Structured Products that
we believe serve your needs as an investor.
Equity Derivatives have continuously evolved
since 1992 both in terms of structure (complex
combinations, multi-underlying assets and exotic
features) and form (adapting to new regulations).
Recently, volatile equity markets and lower
interest rates have forced Structured Products
providers to be even more innovative.
As one of the world’s top players in Equity
Derivatives, BNP Paribas continues to be a
leader in Structured Products innovation. Even in
rapidly evolving markets, BNP Paribas
professionals maintain in-depth knowledge of
regulatory matters reinforcing their historical
ability to provide investors with optimal solutions
to meet their investment goals.

G L O B A L M A R K E T S
How to use this Handbook? 11
I N T R O D U C T I O N T O S T R U C T U R E D P R O D U C T S
How to use
this Handbook
The Market Outlook Indicators illustrate the type
of market conditions that the product is best
suited for.
The Risk Indicator illustrates which risk appetite
the product is appropriate for.
Market Outlook Indicator Risk Indicator
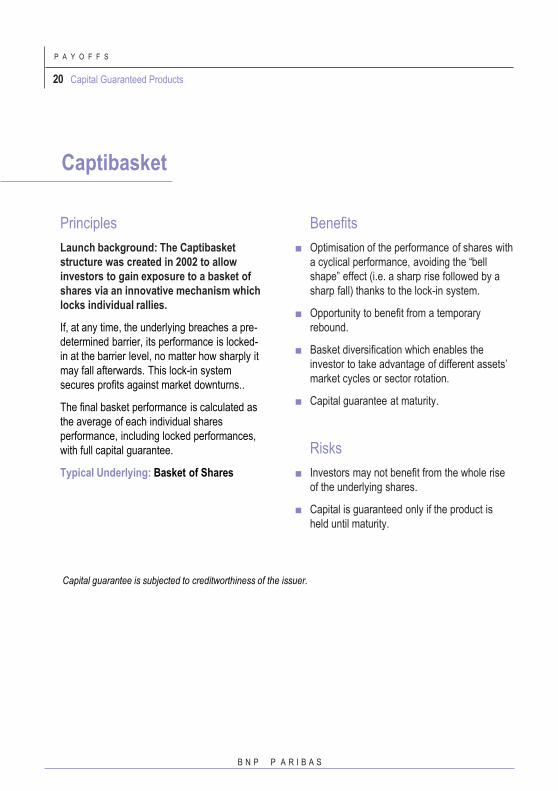
Bullish
Stable
Uncertain
Volatile
Low Risk
Intermediate
High Risk
On each of the Payoff pages you will find a Market Outlook Indicator and a Risk Indicator to use as
an investment guideline.

B N P P A R I B A S
P A Y O F F S
12
G L O B A L M A R K E T S
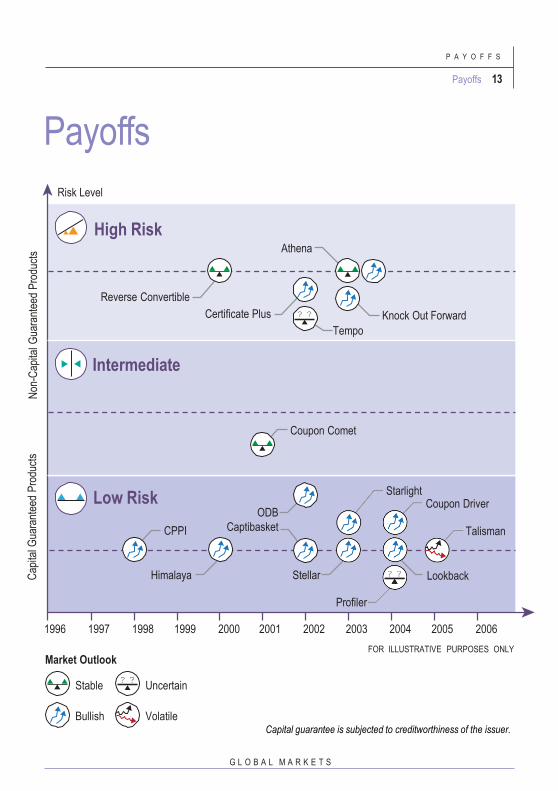
Payoffs 13
P A Y O F F S
Payoffs
LookbackStellarHimalaya
Certificate Plus
Coupon Comet
Reverse Convertible
Risk Level
High RiskAthena
Knock Out Forward
Market Outlook
Stable
Bullish
Uncertain
Volatile
2000 2001 2002 2003
Tempo
Intermediate
Low Risk
1997 19981996 1999 2004 2005 2006
Cap
ital G
uara
ntee
d P
rodu
cts
Non
-Cap
ital G
uara
ntee
d P
rodu
cts
CPPI
ODB
Captibasket
StarlightCoupon Driver
Talisman
Profiler
FOR ILLUSTRATIVE PURPOSES ONLY
Capital guarantee is subjected to creditworthiness of the issuer.

Capital
Guaranteed
Products
P A Y O F F S
14 Capital Guaranteed Products
B N P P A R I B A S
Principles
Launch Background: CPPI was launched
by BNP Paribas in 1998 to provide
leveraged access to funds’ performances,
while remaining protected through a
systematic insurance in the eventuality of
a market downturn.
Constant Proportion Portfolio Insurance
(CPPI) structures are ideal for investors
looking to supplement their investments
without putting capital at risk. They offer
100% capital redemption at maturity in
addition to 100% of a basket’s positive
performance. The basket is composed of an
active asset (usually a fund) and a defensive
asset (bonds, cash, inflation, etc.)
CPPIs actively allocate assets over time to
achieve maximum performance and capital
safety. This dynamic investment strategy
facilitates greater exposure to active assets
when markets rise and increases the
allocation to defensive assets when markets
fall.
Typical Underlying: Fund of Funds, Mutual
Funds or Equity Indices
How does the allocation
strategy work?
During the investment lifespan, the
participation in the active asset increases or
decreases according to the distance between
the basket value and the zero coupon bond
curve.
How is the participation in the
active asset determined?
■ Target participation is typically calculated
monthly for Hedge Fund underlyings and
daily for Mutual Funds, as a function of the
distance and a pre-defined leverage
factor.
■ If the difference between the current and
target participations is lower / higher than
a pre-defined range, the allocation will be
re-adjusted to the target participation.
■ The target participation is capped at a
maximum level (usually 200%), and can
be 0% if the basket value reaches the zero
coupon bond curve (in this case, the
investment will be 100% in the defensive
asset until maturity).
CPPI

G L O B A L M A R K E T S
CPPI 15
P A Y O F F S
BullishLow Risk
Example
■ An investor purchases a 5-year CPPI on a
fund with the exposure to the active asset
floored at 0% and capped at 200%.
■ When exposure is greater than 100% the
basket “borrows” money to invest in the active
asset on a Libor reference.
Benefits
■ Capital guarantee at maturity.
■ The active asset may benefit from a
high leverage opportunity allowing for
yield enhancement.
■ Transparent valuation supports
secondary markets.
■ Optimised allocation between the two
assets - exposure increases with good
performance and / or rise in interest
rates.
Risks
■ If the active asset falls significantly
during the life of the investment, there
is a risk of de-leveraging (no more
exposure to the alternative asset).
■ Sensitivity to interest rates.(through the
zero-coupon bond floor)
■ Path-dependency.
■ Capital is guaranteed only if the product
is held until maturity.
100
Value
Max Exposure
Initial
MinExposure 0%
Basket Value
Maturity
Maturity
Distance
Zero Coupon Bond Curve
Exposure IncreasedExposure Decreased
FOR ILLUSTRATIVE PURPOSES ONLY
Illustration of CPPI Example
Capital guarantee is subjected to creditworthiness of the issuer.
P A Y O F F S
16 Capital Guaranteed Products
B N P P A R I B A S
Principles
Launch Background: Himalaya was
developed in 2000 as a mechanism to
benefit from the buoyant market scenario
by applying a “skimming” mechanism to a
diversified basket of shares.
Himalaya can also provide exposure to
several different types of underlyings, thereby
offering geographical and asset class
diversification.
At each observation date, the performance of
the best performing underlying is locked-in.
This underlying is then permanently removed
from the basket. At maturity, the investor
receives the average of the locked-in
performances, floored at zero.
Typical Underlying: Basket of Shares
Benefits
■ Capital guarantee at maturity.
■ Automatic selection of each period’s best
underlying performance since inception
delivers optimised performance.
■ Benefit from sector rotation, market cycles
and efficient asset class diversification.
Himalaya
Risks
■ Once a performance is locked, any additional
appreciation of the underlying will not
contribute to the product’s performance.
■ Capital is guaranteed only if the product is
held until maturity.
■ Negative performance of the underlyings left
free can damage the overall performance.
Example
■ An investor purchases a 5 year Himalaya
100% indexed to a basket of 10 shares.
■ Every 6 months, the performance of the most
performing share in the basket is locked and
the share is then removed from the basket.
■ At maturity, the investor receives the weighted
average of the locked performances.
■ Capital is guaranteed at maturity.
Capital guarantee is subjected to creditworthiness of the issuer.

G L O B A L M A R K E T S
Himalaya 17
P A Y O F F S
BullishLow Risk
FOR ILLUSTRATIVE PURPOSES ONLY
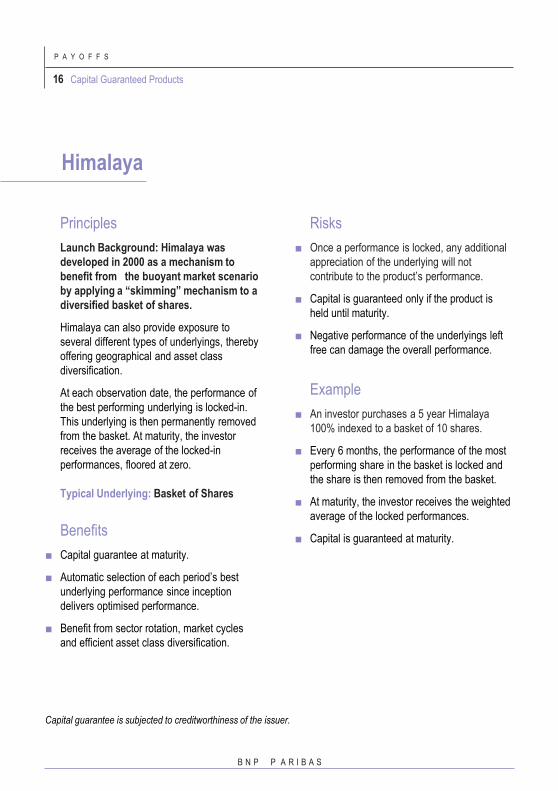
Months Share 1 Share 2 Share 3 Share 4 Share 5 Share 6 Share 7 Share 8 Share 9 Share 10 Locked-in Performance
6 18% 15% 10% 8% -4% 2% 0% -1% 5% -5% 18.00%
12 30% 20% 20% 2% 13% 15% 7% 15% 5% 30.00%
18 37% 36% 16% 20% 18% 14% 25% 10% 37.00%
24 45% 30% 22% 24% 18% 23% 12% 45.00%
30 44% 39% 32% 28% 28% 8% 44.00%
36 50% 48% 34% 32% 15% 50.00%
42 54% 41% 44% 24% 54.00%
48 55% 52% 28% 55.00%
54 67% 20% 67.00%
60 45% 45.00%
FINAL PERFORMANCE Average of the equally weighted locked-in performances 44.50%
Months Share 1 Share 2 Share 3 Share 4 Share 5 Share 6 Share 7 Share 8 Share 9 Share 10 Locked-in Performance
6 20% 5% -5% -3% -8% -10% -15% -2% -10% -10% 20.00%
12 11% -10% -10% -15% -20% -4% -23% -15% -15% 11.00%
18 -5% -8% -16% -14% -10% -14% -18% -16% -5.00%
24 -5% -12% -9% -6% -8% -20% -20% -5.00%
30 -10% -11% -13% -12% -14% -19% -10.00%
36 -10% -10% -11% -14% -15% -10.00%
42 -5% -6% -13% -17% -5.00%
48 -5% -15% -20% -5.00%
54 -5% -10% -5.00%
60 -15% -15.00%
FINAL PERFORMANCEAverage of the equally weighted locked-in performance -2.90%
Floored performance: 0% 0.00%
Optimistic Scenario
Pessimistic Scenario

P A Y O F F S
18 Capital Guaranteed Products
B N P P A R I B A S
Principles
Launch Background: Coupon Comet was
created in 2001 to capitalise on the
potential market rebound and high
volatility that followed the international
financial crisis through high annual
coupons.
The Coupon Comet structure allows the
investor to earn annual coupons in bullish or
stable market environments, with a minimum
100% capital redemption at maturity.
The investor receives an annual fixed coupon
if none of the shares in the basket have fallen
below a predetermined level at the
observation date.
Typical Underlying: Basket of Shares
Coupon Comet
Benefits
■ Opportunity to earn coupons higher than
standard bond yields as long as the underlying
does not breach the predetermined barrier.
■ Allows investors to benefit from high implied
volatilities in certain shares.
■ Capital guarantee at maturity.
Risks
■ Coupons may be missed due to the fall in the
price of a single share, even if the overall
basket performance is positive.
■ Capital is guaranteed only if the product is
held until maturity.
Capital guarantee is subjected to creditworthiness of the issuer.

G L O B A L M A R K E T S
Comet Coupon 19
P A Y O F F S
On year 3, the lowest performing share goes
below 80% of its initial level on the
observation date. As a result, no coupon is
paid that year.
60
80
100
3 4 5
Observation dates
12020%
140
80% barrier
Barrier is
breached0%
10%
5%
15%
30%
25%
StableIntermediate
Example
■ An investor purchases a 5-year Comet
Coupon on 3 shares, which pays a 10%
annual coupon if none of the shares go
below 80% of their initial level on the yearly
observation dates.
FOR ILLUSTRATIVE PURPOSES ONLY
Coupon
Performance over 5 years Regular Coupon Payoff
1 2 3 4 51 2
P A Y O F F S
20 Capital Guaranteed Products
B N P P A R I B A S
Principles
Launch background: The Captibasket
structure was created in 2002 to allow
investors to gain exposure to a basket of
shares via an innovative mechanism which
locks individual rallies.
If, at any time, the underlying breaches a pre-
determined barrier, its performance is locked-
in at the barrier level, no matter how sharply it
may fall afterwards. This lock-in system
secures profits against market downturns..
The final basket performance is calculated as
the average of each individual shares
performance, including locked performances,
with full capital guarantee.
Typical Underlying: Basket of Shares
Captibasket
Benefits
■ Optimisation of the performance of shares with
a cyclical performance, avoiding the “bell
shape” effect (i.e. a sharp rise followed by a
sharp fall) thanks to the lock-in system.
■ Opportunity to benefit from a temporary
rebound.
■ Basket diversification which enables the
investor to take advantage of different assets’
market cycles or sector rotation.
■ Capital guarantee at maturity.
Risks
■ Investors may not benefit from the whole rise
of the underlying shares.
■ Capital is guaranteed only if the product is
held until maturity.
Capital guarantee is subjected to creditworthiness of the issuer.

G L O B A L M A R K E T S
Captibasket 21
P A Y O F F S
Example
■ An investor purchases a 5-year Captibasket
on a basket of 3 shares, offering 100%
participation at maturity with a +45%
performance lock-in level.
■ Each share that reaches the +45% barrier is
locked-in at that level until maturity, no matter
how it may fall or rise afterwards.
BullishLow Risk
■ The investor receives the average of all share
performances at the end of the five years, on
top of principal, with full capital guarantee.
180
160
140
120
100
80
60
40Share 1
Performance lock-in at +45%
Share 2 Share 3
Performance
= 45%
Performance
= 45%
Performance
= 7%
Lock-in Barrier
2 3
Observation Dates (Years)
4 51
Level of underlying
FOR ILLUSTRATIVE PURPOSES ONLY
Performance at Maturity = Average of Share Performances = = 32.33%(45% + 45% + 7%)
Captibasket Performance
3
Capital guarantee is subjected to creditworthiness of the
issuer.

P A Y O F F S
22 Capital Guaranteed Products
B N P P A R I B A S
ODB
Principles
Launch background: Option on a Dynamic
Basket (ODB) was developed to benefit from
the bullish market scenario via a leveraged
participation in funds while enjoying
protection by systematic insurance in case
of a market downturn. It was first used by
BNP Paribas Structured Products in 2003.
An Option on a Dynamic Basket (ODB) is a Call
option on a dynamic basket which actively
allocates between an active asset (usually a
fund) and a defensive asset (bond, cash,
inflation, etc.). With this dynamic investment
strategy, the exposure to active assets is
leveraged when markets are rising, and de-
leveraged when markets are falling. The
structure also ensures full capital guarantee at
maturity.
The ODB aims to maximise the exposure to the
alternative asset when it is performing well while
protecting returns otherwise.
ODBs can be tailored to suit investor needs by:
■ Providing coupons, either paid or
accumulated until maturity
■ Including a Lookback feature. The Lookback
feature settles the option based on the
maximum value of the dynamic basket
during the entire product life cycle.
Typical Underlying: Fund of Funds, Mutual
Funds or Equity Indices
How does the allocation strategy
work?
During the investment lifespan, the exposure
to the alternative asset increases or decreases
according to the distance between the basket
value and a reference line in order to remove
exposure to interest rates.
Difference between ODB
and CPPI
The ODB and CPPI structures are very similar
however they have some fundamental
differences. Firstly, the ODB is an option
whereas the CPPI is a systematic asset
management process. The ODB guarantees a
minimum investment in the active asset
(minimum exposure) whereas the entire basket
of CPPI may end up being exposed solely to
money market instruments in adverse market
conditions. The ODB bears no risk of completely
de-leveraging. For ODB, capital guarantee is
provided outside the ODB, in contrast to CPPI
where the protection is embedded within the
cushion management. ODB offers more
flexibility as the allocation parameters can be
adapted to the investors’ risk appetite: leverage
factor, minimum allocation, reference for the
distance (fixed line or zero coupon bond), etc.
Finally, in CPPI structures, exposure to the
active asset is more sensitive to interest rates.
In ODB structures, however, this sensitivity is
removed to shield the exposure from interest
rate fluctuations. Note valuations are the
element in the CPPI structure that are sensitive
to interest rates.Capital guarantee is subjected to creditworthiness of
the issuer.

G L O B A L M A R K E T S
ODB 23
P A Y O F F S
How is the participation in the
alternative asset determined?
■ A target participation is typically calculated
monthly for Hedge Fund underlyings and
daily for Mutual Funds as a function of the
distance and a pre-defined leverage factor.
■ If the difference between the current target
participations is lower / higher than a pre-
defined range, the allocation will be re-
adjusted to the target participation.
■ The target participation is floored at a
minimum participation level (usually 30%)
and capped at a maximum participation level
(usually 200%).
BullishLow Risk
Risks
■ Product volatility may increase due to the
possible leveraging of the structure.
■ Capital is guaranteed only if the product is
held until maturity.
■ Path-dependency.
■ Secondary market depends on market
parameters such as interest rates, time to
maturity as well as the alternative asset’s
return and volatility.
Example
■ An investor purchases a 5-year ODB on an
Index, with an exposure to the alternative
asset floored at 30% and capped at 200%.
Max Exposure
Initial
Min
100
Basket Value
Maturity (Year 5)
Maturity (Year 5)
Distance
Reference line fixed
at inception
Exposure IncreasedExposure Decreased
200%
30%
FOR ILLUSTRATIVE PURPOSES ONLY
Performance
Illustration of ODB example
Benefits
■ Capital guarantee at maturity.
■ The alternative asset may benefit
from a high leverage opportunity,
allowing for yield enhancement.
■ No possibility of completely de-
leveraging into the defensive asset
(no “knock-out risk”).
■ No sensitivity to interest rates in
the exposure calculation (the
reference line is fixed at inception).
■ Flexible structure.
■ Optimised allocation between
the two assets.
Capital guarantee is subjected to creditworthiness of the issuer.

P A Y O F F S
24 Capital Guaranteed Products
B N P P A R I B A S
Principles
Launch background: The Starlight
structure was designed in 2003 to offer
investors an early redemption at an
attractive annual yield if the underlying
breaches a pre-determined barrier at any
observation date during the investment
period.
It also allows investors to gain full exposure to
the underlying’s upside, up to the barrier, with
full capital guarantee at maturity.
Typical Underlying: Single Index
Starlight
Benefits
■ Possible early redemption to avoid capital lock
up over the whole period.
■ Higher participation on the upside than a plain
vanilla call in case of moderate growth.
■ Strong annual returns in case of market
rebound.
■ Capital guarantee at maturity.
Risks
■ Investors might not benefit from the whole rise
of the underlying in case of very bullish
scenarios.
■ Capital is guaranteed only if the product is
held until maturity.
Capital guarantee is subjected to creditworthiness of the issuer.
G L O B A L M A R K E T S
Starlight 25
P A Y O F F S
BullishLow Risk
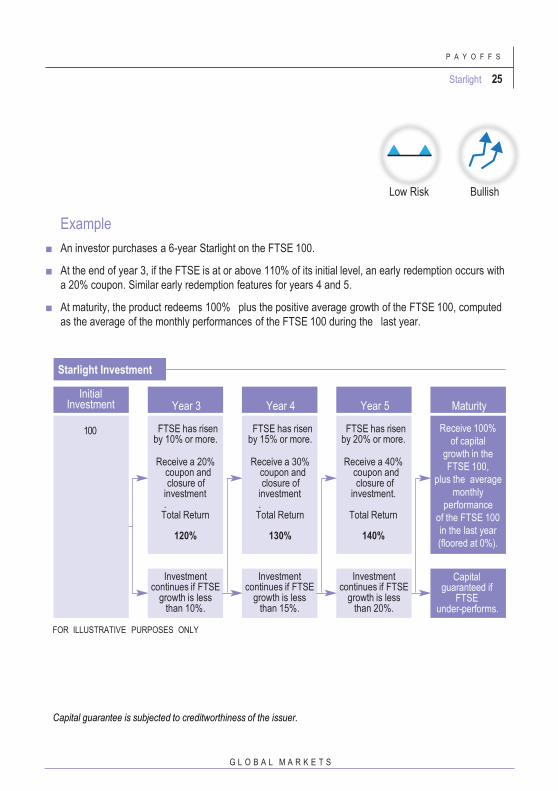
Example
■ An investor purchases a 6-year Starlight on the FTSE 100.
■ At the end of year 3, if the FTSE is at or above 110% of its initial level, an early redemption occurs with
a 20% coupon. Similar early redemption features for years 4 and 5.
■ At maturity, the product redeems 100% plus the positive average growth of the FTSE 100, computed
as the average of the monthly performances of the FTSE 100 during the last year.
Initial Investment
100
Year 3
FTSE has risen by 10% or more.
Receive a 20% coupon andclosure of
investment.
Total Return
120%
Year 4 Year 5 Maturity
FTSE has risen by 15% or more.
Receive a 30% coupon andclosure of
investment.
Total Return
130%
FTSE has risen by 20% or more.
Receive a 40% coupon andclosure of
investment.
Total Return
140%
Receive 100%
of capital
growth in the
FTSE 100,
plus the average
monthly
performance
of the FTSE 100
in the last year
(floored at 0%).
Investment continues if FTSE
growth is less than 10%.
Investment continues if FTSE
growth is less than 15%.
Investment continues if FTSE
growth is less than 20%.
Capital guaranteed if
FTSEunder-performs.
FOR ILLUSTRATIVE PURPOSES ONLY
Starlight Investment
Capital guarantee is subjected to creditworthiness of the issuer.
P A Y O F F S
26 Capital Guaranteed Products
B N P P A R I B A S
Principles
Launch Background: Stellar was created
in 2003 as an investment solution to allow
investors to benefit optimally from
moderate growth anticipated in the period
following the growth and subsequent burst
of the Dot-Com bubble. The payoff offers
equity- linked annual coupons.
The Stellar is constructed to perform in
markets which move forward together, even if
the extent of this advance is moderate.
The Stellar structure is designed to boost
long-term portfolio returns. It offers enhanced
equity-linked annual coupons throughout the
investment period. This structure may be
used to ensure a minimum return via fixed
annual coupons or floored variable coupons
over a fixed period.
The variable equity-linked annual coupons
are determined by the positive performance of
a basket of underlyings. The annual coupons
are calculated by applying a pre-determined
cap to each underlying’s individual
performance, these performances are then
averaged and where necessary a pre-
determined floor is also applied.
Typical Underlying: Basket of Shares
Stellar
Benefits
■ At each annual observation date, each
underlying’s performance is measured against
its initial level, without restriking.
■ Assured minimum return via floored variable
coupons.
■ Potentially high variable coupons even in
markets experiencing moderate growth.
■ Capital guarantee at maturity.
Risks
■ A drop in one or a few of the underlyings can
dampen the overall performance.
■ Any increase in the price of the underlying
beyond the cap will not increase the annual
return.
■ Capital is guaranteed only if the product is
held until maturity.
Capital guarantee is subjected to creditworthiness of
the issuer.

G L O B A L M A R K E T S
Stellar 27
P A Y O F F S
BullishLow Risk
Example
■ An investor buys a 5 year Stellar on a basket
of 3 Blue chips (underlyings). The structure
offers variable coupons equal to the basket
average, where each share performance is
individually capped at 7%. The coupon is
floored at 2.5%.
FOR ILLUSTRATIVE PURPOSES ONLY
Throughout the investment period, the
investor receives annual coupons. At maturity,
the investor receives the final 7% coupon in
addition to their initial capital.
Coupon Value Share 1 Share 2 Share 3 Cap is applied
120
110
100
Floor at
2.5%
Cap at 7.0%
90
80 0%
2%
4%
6%
8%
10%
12%
14%
16%
Performance of Underlyings Coupon
5.03%
2.50%
5.27% 4.87%
7.00%
1 2 3
Observation Dates (Years)
4 5
Year 1 2 3 4 5
Share 1 5.80% -5.80% 9.30%→+7.00% +14.30%→7.00% 16.80%→7.00%
Share 2 +11.30%→7.00% -3.80% 3.80% 6.30% 14.00%→7.00%
Share 3 2.30% 3.00% 5.00% 1.30% 8.80%→7.00%
Average 5.03% -2.20% 5.27% 4.87% 7.00%
Coupon +5.03% +2.5% +5.27% +4.87% +7.00%
Stellar Performance
P A Y O F F S
28 Capital Guaranteed Products
B N P P A R I B A S
Principles
Launch Background: The Coupon Driver
was developed by BNP Paribas in 2004 to
capitalise on high levels of volatility. It
offers pre-defined returns on the majority
of the underlyings.
The Coupon Driver structure pays a yearly
coupon, linked to the performance of a basket
of underlying assets, with full capital
guarantee at maturity.
Yearly coupons are calculated as follows:
At each yearly anniversary date, the level of
each share is compared to its initial level.
The X-best performing shares in the basket
are set at a fixed performance, and the
remaining ones are taken at their level of
performance, with or without a cap, X being a
number fixed in advance.
The annual coupon is the positive
performance of the basket which may be
floored at a pre-determined level
Typical Underlying: Basket of Shares
Coupon Driver
Benefits
■ Coupons are floored at 0%.
■ High returns, over-performing the basket
performance, can be achieved in flat or
moderately bearish markets.
■ Capital guarantee at maturity.
Risks
■ Investors might not benefit from the whole rise
of the underlyings, due to the fixed
performance for the best performing assets.
■ Capital is guaranteed only if the product is
held until maturity.
Capital guarantee is subjected to creditworthiness of the issuer.

G L O B A L M A R K E T S
Coupon Driver 29
P A Y O F F S
BullishLow Risk
Example
■ An investor purchases a 5-year Coupon
Driver, linked to a basket of 20 shares. The
17 best performing shares in the basket are
set at +7.5% performance. The 3 remaining
shares are taken at their level of performance
and capped at +7.5%.
FOR ILLUSTRATIVE PURPOSES ONLY
■ The average of the share performance is
floored at +1%.
■ The investor receives the average of the
recorded performance at the end of each year.
Perf
orm
ance
of17
bestperf
orm
ing
share
ssetat+
7.5
%
Actual Performance in Year 1 Coupon Driver Recorded Performance
Share 1 16.0% 7.5%
Share 2 13.0% 7.5%
Share 3 12.0% 7.5%
Share 4 11.0% 7.5%
Share 5 9.0% 7.5%
Share 6 9.0% 7.5%
Share 7 7.0% 7.5%
Share 8 7.0% 7.5%
Share 9 6.0% 7.5%
Share 10 6.0% 7.5%
Share 11 6.0% 7.5%
Share 12 4.0% 7.5%
Share 13 4.0% 7.5%
Share 14 3.0% 7.5%
Share 15 3.0% 7.5%
Share 16 1.0% 7.5%
Share 17 -1.0% 7.5%
Share 18 -1.0% -1.0%
Share 19 -10.0% -10.0%
Share 20 -8.0% -8.0%
Average 4.85% 5.43%
Coupon Driver Performance

P A Y O F F S
30 Capital Guaranteed Products
B N P P A R I B A S
Principles
Launch Background: Lookback was
designed in 2004 as a path dependent
option that allows investors to benefit from
the best entry point and / or the best exit
point. It aims to protect investors from the
risk of poor exit timing by recording the
highest performance throughout the whole
investment period.
The Lookback mechanism records the
highest performance of an underlying over a
part of or over the entire investment period.
In general, the redemption at maturity is the
highest recorded performance multiplied by a
participation. Capital is fully guaranteed at
maturity.
Typical Underlying: Single Index
Lookback
Benefits
■ Capital guarantee at maturity.
■ Removes timing issues on the entry (lookback
in) and on the exit of the investment (lookback
out).
■ Simple mechanism.
Risks
■ Capital is guaranteed only if the product is
held until maturity.
■ Opportunity cost in a steady Bullish Market
(max = final performance while lookback
option is much more expensive than a simple
call)
Capital guarantee is subjected to creditworthiness of the issuer.

G L O B A L M A R K E T S
Lookback 31
P A Y O F F S
BullishLow Risk
Example
■ An investor purchases a 6-year Lookback on
an index, with monthly observations. At
maturity, the investor receives 90% of the
highest performance of the index over the
investment period, with full capital guarantee.
250
Highest Recorded Value = 208%
200
150
100
50
0
Optimistic Scenario
1 2
Pessimistic Scenario
3 4 5 6
FOR ILLUSTRATIVE PURPOSES ONLY
Optimistic Scenario: The investor receives 100% + 90% x
108% = 197.20% of initial capital.
Pessimistic Scenario: The index does not perform above the initial
level. At maturity, the investor receives 100% of the invested capital.
Performance Lookback Scenarios
Capital guarantee is subjected to creditworthiness of the issuer.

P A Y O F F S
32 Capital Guaranteed Products
B N P P A R I B A S
Principles
Launch Background: Profiler was created
in 2004, in response to an investment
scenario characterised by uncertain equity
markets and low returns from bond
markets. The payoff provides investors
with the most performing of several
diversified portfolios throughout the
period.
With the Profiler structure, three alternately
risk-profiled portfolios are composed from a
set of diverse asset classes. At maturity, the
investor gets full participation in the best
performing portfolio, with full capital
guarantee.
The 3 portfolio profiles are:
Aggressive: Largely composed of equities
commodities with smaller allocations to low
risk assets, such as bonds, rates, real estate,
etc.
Balanced: Equal exposure to different kinds
of assets.
Defensive: Emphasis on the low risk assets.
Typical Underlying: Basket of Indices
Asianing is generally applied.
Profiler
Benefits
■ Investors automatically benefit from the best
performing strategy at maturity irrespective of
market fluctuations.
■ Capital guarantee at maturity.
Risks
■ Investors may not benefit from the whole rise
of the best performing asset, due to the
averaging of performances.
■ Capital is guaranteed only if the product is
held until maturity.
Example
■ An investor buys a 4-year Profiler indexed to
the following 3 portfolios:
Asianing is applied with semi-annual observation
dates. The investor gets full participation in the best
performing portfolio at maturity.
FOR ILLUSTRATIVE PURPOSES ONLY
Asset Aggressive Balanced Defensive
Equities 50% 25% 15%
Commodities 25% 15% 10%
Real Estate 15% 25% 25%
Bonds 10% 35% 50%
Capital guarantee is subjected to creditworthiness of
the issuer.

G L O B A L M A R K E T S
Profiler 33
P A Y O F F S
Balanced Defensive
1.5 2.0 2.5 3.0 3.5 4.0
FOR ILLUSTRATIVE PURPOSES ONLY
0.0 0.5 1.0
Observation Dates (Years)
-50%
25%
0%
-25%
50%
75%
Aggressive
Performance
Best performingportfolio
UncertainLow Risk
0.0 0.5 1.0
Observation Dates (Years)
Balanced Defensive
1.5 2.0 2.5 3.0 3.5 4.0
FOR ILLUSTRATIVE PURPOSES ONLY
-50%
25%
0%
-25%
50%
75%
Aggressive
Performance
Best performing
portfolio
-50%
0.0 0.5 1.0
Observation Dates (Years)
1.5 2.0 2.5 3.0 3.5 4.0
FOR ILLUSTRATIVE PURPOSES ONLY
0%
-25%
25%
75%Aggressive Balanced Defensive
Performance
Best performing
portfolio
At maturity, the investor receives his initial capital plus
the highest performing portfolio: Aggressive = 59.25%
At maturity, the investor receives his initial capital plus
the highest performing portfolio: Balanced = 28.88%
At maturity, the investor receives his initial capital plus
the highest performing portfolio: Defensive = 11.13%
Observation
Periods
Aggressive Balanced Defensive
0.5 19% 12% 8%
1 36% 23% 18%
1.5 61% 39% 29%
2 60% 40% 31%
2.5 72% 47% 35%
3 85% 54% 40%
3.5 82% 53% 40%
4 59% 44% 37%
Average 59.25% 39.00% 29.75%
Scenario 1
Scenario 2
Scenario 3
Observation
Periods
Aggressive Balanced Defensive
0.5 20% 12% 9%
1 36% 25% 19%
1.5 40% 29% 23%
2 49% 42% 36%
2.5 35% 39% 37%
3 18% 33% 35%
3.5 5% 25% 30%
4 1% 26% 32%
Average 25.50% 28.88% 27.63%
Observation
Periods
Aggressive Balanced Defensive
0.5 -3% 2% 4%
1 -13% -1% 4%
1.5 -21% 0% 7%
2 -15% 5% 11%
2.5 -18% 8% 15%
3 -14% 14% 22%
3.5 -17% 10% 18%
4 -27% -1% 8%
Average -16.00% 4.63% 11.13%
50%

P A Y O F F S
34 Capital Guaranteed Products
B N P P A R I B A S
Principles
Launch Background: Talisman was
created in 2005 in an environment
characterised by very low implicit
dispersion according to historical
standards. It was designed to take
advantage of a future rise in market
volatility and the bank’s appetite to
provide aggressive pricing on dispersion
due to its risk-reducing virtues.
The Talisman structure is designed to benefit
from the dispersion of a basket of shares.
Dispersion measures the tendency of the
returns of shares comprising a basket to
diverge from the average basket return.
Talisman offers 100% capital guarantee at
maturity, as well as annual variable coupons
depending on the level of dispersion. This
structure may also offer a minimum return via
floored coupons.
Typical Underlying: Basket of Shares
Talisman
Benefits
■ Dispersion can be positive irrespective of the
direction of market movements. Hence, the
performance of a dispersion strategy is highly
decorrelated with equity market trends.
■ This product is based on sophisticated
techniques used only by hedge funds so far,
and allows investors to benefit from them
using a secured structure.
■ Capital guarantee at maturity.
Risks
■ In sluggish or bullish markets, the volatility
tends to be lower.
■ High level of volatility.
■ Capital is guaranteed only if the product is
held until maturity.
Capital guarantee is subjected to creditworthiness of the issuer.

G L O B A L M A R K E T S
Talisman 35
P A Y O F F S
Example
■ An investor purchases a 5-year Talisman on
an Index with a strike level fixed at 8%.
■ For each share, the absolute difference with
the basket average is pro-rated and the
excess difference over 8% is retained to
calculate the average basket dispersion.
■ From year 2 onwards, a variable floor on the
coupon guarantees 50% of the previous
coupon.
VolatileLow Risk
Strike = 8.00%
Basket Average
= 3.75%
Absolute Difference
for Share 2=
18.25%
Share 1
22.00%25%
20%
15%
10%
5%
0%
-5%
-10%
-15%
-20%Year 1 Time
Retained Performancefor Share 1 = 10.25%
Strike
Strike
Basket
Average
Retained Performancefor Share 2 = 10.25%
Share 1
Performance
Share 2
Performance
Absolute Difference for Share 2
Absolute Difference for Share 1
FOR ILLUSTRATIVE PURPOSES ONLY
After the first year of the investment, the investor
receives a coupon worth the average of the two
retained performances: 10.25%
Absolute Difference
Number of YearsStrike = Retained Performance
18.25%
18.00% = 10.25%
Retained Performance for Share 1
18.25%
18.00% = 10.25%
Retained Performance for Share 2
Absolute
Difference for
Share 1 =
18.25%
Share 2-14.50%
Performance of Shares Illustration of the Performance Calculation

Non-Capital
Guaranteed
Products
P A Y O F F S
36 Non-Capital Guaranteed Products
B N P P A R I B A S
Principles
Launch Background: Reverse Convertible
was relaunched by BNP Paribas in 2000,
designed to take advantage of periods of
high implied volatility through a high pre-
defined coupon.
A Reverse Convertible is a short-term
investment combining a high coupon with
exposure to equity. It offers a guaranteed
coupon and conditionally returns the
principal, depending on the performance of
the underlying. Generally the principal is
100% guaranteed down to a pre-determined
barrier.
Typical Underlying: Single Stock or Single
Index
Benefits
■ Short term investment in which maturities
range from three months to two years.
■ The pay-off offers a high coupon, payable
monthly, quarterly, semi-annually or
annually.
■ Capital guarantee subject to a
predetermined barrier.
■ Allows investors to benefit from the high
implied volatility of a particular share or
index.
Risks
■ If the price of the underlying decreases
below the predetermined barrier over the
investment period, the return may be less
than the original amount invested.
■ Any increase in the price of the underlying
will not increase the return of the Reverse
Convertible.
■ No dividends or ownership rights.
Example
An investor purchases a 9-month Reverse
Convertible on a single share, with a 12%
fixed coupon and a continuous down barrier at
70% of initial performance.
Reverse Convertible
Capital guarantee is subjected to creditworthiness of the issuer.

G L O B A L M A R K E T S
Reverse Convertible 37
P A Y O F F S
Example
An investor purchases a 9-month Reverse
Convertible on a single share, with a 12% fixed
coupon and a continuous down barrier at 70% of
initial performance.
Optimistic Scenario – The share does not
breach the 70% barrier during the investment
period, and is up by 6% at maturity. Investors
receive a 12% coupon in addition to 100% of the
principal invested.
Pessimistic Scenario – The share breaches the
barrier during the investment period and is down
by 40% at maturity. Investors receive a 12%
coupon and 60% of the principal invested.
StableHigh Risk
Optimistic scenario Pessimistic scenario
6M 9M
140
120
100
8070% Barrier
60
403M
Performance
Reverse Convertible Scenario Performance
FOR ILLUSTRATIVE PURPOSES ONLY

P A Y O F F S
38 Non-Capital Guaranteed Products
B N P P A R I B A S
Principles
Launch Background: Certificate Plus was
created in 2002, and was designed to
capture the potential market rebound and
high volatility in the period that followed
the burst of the Dot-Com bubble.
The Certificate Plus structure offers 100%
participation in the underlying performance
with an ensured minimum return, provided
the underlying never breaches the knock-out
barrier during the investment period.
Otherwise, Certificate Plus pays the
underlying performance at maturity.
Typical Underlying: Single Index
Certificate Plus
Benefits
■ Better performance than the index in all cases:
Certificate Plus is designed to always at least
track the underlying’s performance with a
potential to outperform it due to the ensured
minimum return.
■ High potential redemption, even if the market
does not perform.
Risks
■ If the price of the underlying dips below the
barrier at any time during the investment
period, and finishes below its initial value at
maturity, the redemption will be less than the
original amount invested.
■ The investor does not benefit from dividends
or ownership rights.
G L O B A L M A R K E T S
Certificate Plus 39
P A Y O F F S
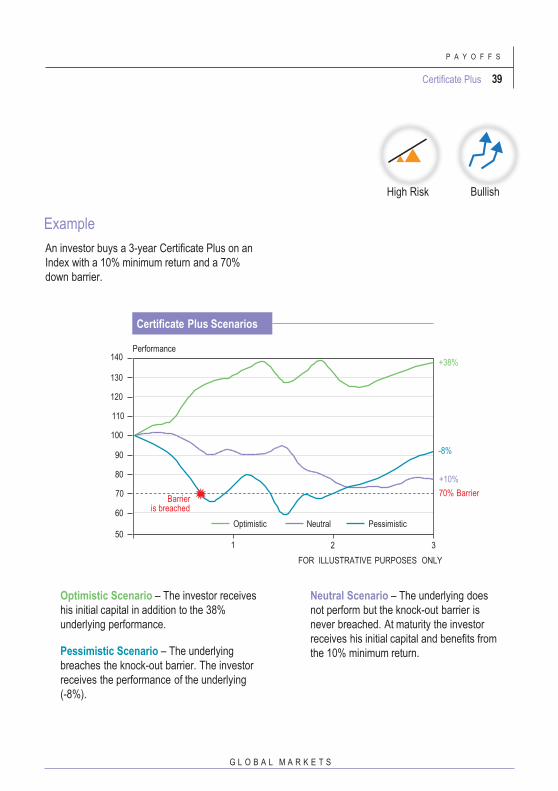
Example
An investor buys a 3-year Certificate Plus on an
Index with a 10% minimum return and a 70%
down barrier.
Optimistic Scenario – The investor receives
his initial capital in addition to the 38%
underlying performance.
Pessimistic Scenario – The underlying
breaches the knock-out barrier. The investor
receives the performance of the underlying
(-8%).
Neutral Scenario – The underlying does
not perform but the knock-out barrier is
never breached. At maturity the investor
receives his initial capital and benefits from
the 10% minimum return.
2 3
FOR ILLUSTRATIVE PURPOSES ONLY
50
60
80
70
90
130
120
110
100
140Performance
Optimistic Neutral Pessimistic
+38%
-8%
+10%
70% Barrier
1
Barrier is breached
Certificate Plus Scenarios
BullishHigh Risk

P A Y O F F S
40 Non-Capital Guaranteed Products
B N P P A R I B A S
Principles
Launch Background: Tempo was
developed as a response to the market
correction witnessed in mid-2002. It was
designed as an investment solution for
investors fearing a further decline in the
short term and looking to optimise their
market entry point.
The Tempo structure is designed for investors
that are bullish over the medium to long-term
on the underlyings’ markets, and provides
them with the full upside of the performance. It
allows investors to optimise their entry point in
the market i.e. when the market is at its lowest
level during the investment period.
Tempo periodically records the performance
of the underlying compared to its initial level.
At maturity, the recorded performance of the
underlying is equal to the difference between
its performance at maturity and the lowest
performance recorded during the investment
period.
Tempo
If, however, the underlying closes below the
barrier at any point, the investor receives the
performance of the underlying from inception.
The Initial Capital is no longer guaranteed and
the entry level is no longer optimised.
Typical Underlying: Single Index
Benefits
■ Optimised market entry point.
■ Unlimited upside of the underlying’s
performance.
Risks
■ Capital is not guaranteed if the underlying ever
breaches the barrier.

G L O B A L M A R K E T S
Tempo 41
P A Y O F F S
Example
■ An investor buys a 3-year Tempo on a single
index with a 50% barrier.
UncertainHigh Risk
Barrier 50%
100
50
1 2 3
Underlying
80%
70%
120%
Lowest performance level
Optimistic Pessimistic
Optimistic Scenario: The investor receives a gain of 120%-80%= 40%
along with the initial capital at maturity.
Pessimistic Scenario: The 50% barrier is breached. The
investor receives 70% of the initial capital at maturity.
Illustration of a Tempo example
FOR ILLUSTRATIVE PURPOSES ONLY

P A Y O F F S
42 Non-Capital Guaranteed Products
B N P P A R I B A S
Principles
Launch Background: Athena was created in
2003 as an investment solution designed for
stable market conditions; anticipated in the
period following the growth and subsequent
burst of the dot-com bubble. The structure
offers investors an early redemption at an
attractive annual yield if the underlying
breaches a pre-determined barrier at any
observation date during the investment
period.
The Athena structure offers a high coupon
linked to the performance of the underlying. The
performance of the underlying is compared to
the strike price at each observation date. If the
underlying overperforms a strike level at any
observation point, the product terminates early,
returning 100% of the capital and additionally
paying a high coupon.
At maturity, as long as the value of the
underlying is above a pre-determined barrier,
capital is 100% guaranteed. Otherwise, the
investor receives the performance of the
underlying at maturity.
Typical Underlying: Index, share, basket of
stocks
■ Opportunity to earn a high coupon with a
small increase in the price of the underlying.
■ Possibility of collecting a coupon and
receiving the initial capital after only 3
months.
Athena
Risks
■ Capital is not guaranteed.
■ If the price of the underlying decreases below
the pre-determined barrier at maturity, the
redemption may be less than the original
amount invested.
■ Any increase in price of the underlying beyond
the strike level will not increase the return.
Example
An investor buys a 1-year Athena on a basket
of shares with quarterly observation points, a
3% quarterly coupon and a 70% barrier at
maturity. The strike level is equal to the initial
level (100%).
Example 1 – Early Exit
The basket average rises strongly in the first
quarter. At the first observation point, the
basket average is above the strike level. The
product redeems early and the investor
receives 100% of his initial capital plus a 3%
(1 x 3%) coupon.
40
60
80
Performance 120
Q3 Q4Q2Q1
70% Barrier
100% Strike Level
Early Exit
Capital guarantee is subjected to creditworthiness of
the issuer.

G L O B A L M A R K E T S
Athena 43
P A Y O F F S
Q1 Q2 Q3
Strike level breached, early redemption occurs
Q4
40
60
80
100
Performance
Q3 Q4Q2Q1
70% Barrier
100% Strike Level
40
60
80
100
Performance
Q4
70% Barrier
100% Strike Level
Example 4 – Market Downturn
Markets drop significantly throughout the
investment period. At maturity, the basket
average finishes below the barrier. The
investor receives the final performance of the
basket i.e. in this case, 64% (64÷100) of the
initial investment.
FOR ILLUSTRATIVE PURPOSES ONLY
Example 3 – Capital guarantee
The basket performance drops in the first two
quarters and stays below the initial level for
the entire investment period. No early
redemption occurs and no coupons are paid
out as the basket average does not reach the
strike level on any of the observation dates. At
maturity, the basket average is below the
strike level but above the lower barrier, the
investor receives 100% of his initial capital.
High Risk Stable Bullish
Example 2 – High Coupon
The basket performance drops initially in the
first three quarters however it recovers
towards the end of the fourth quarter. No
early redemption occurs. The basket average
finishes above the strike level at maturity. The
investor receives 100% of his initial capital
plus a high 12% (4 x 3%) coupon.40
60
80
100
120
Q3Q2Q1
Performance
70% Barrier
100% Strike Level
High Coupon
Capital guarantee
Market downturn
120
120
Capital guarantee is subjected to creditworthiness of
the issuer.
Barrier Underlying Strike level

P A Y O F F S
44 Non-Capital Guaranteed Products
B N P P A R I B A S
Principles
Launch Background: Knock Out Forward
was launched by BNP Paribas in Hong
Kong in 2003, designed to benefit from a
potential market rebound in the period that
followed the Dot-Com bubble burst
offering investors the opportunity to
purchase shares at a discount.
A Knock Out Forward structure is typically a 1
year product on a single equity underlying.
With this structure, the investor accumulates a
fixed number of shares of the underlying
every day during the investment period at a
substantial discount on the strike price. The
accumulated shares are delivered on a
monthly basis. The investor can also benefit
from possible early redemption when the
share reaches the pre-defined trigger (daily
observation).
Typical Underlying: Single Share
Benefits
■ Opportunity to purchase shares of an
underlying at a substantial discount.
■ Opportunity to redeem early on a daily
basis to benefit from a market rebound
(after trigger activation).
Risks
■ Capital is not guaranteed.
■ If the price of the underlying dips below
the discounted price at any time during the
investment period, the redemption at
maturity may be less than the original
amount invested
Knock Out Forward
Example
An investor buys a 1-year Knock Out Forward on a
share with the following parameters:
Maturity: 1 Year
Notional Amount Invested: 10 million EUR
Underlying Spot at Time of Purchase:
50 EUR / Share
Buy Discount Level 20% →
Discounted Price: 40 EUR / Share
Early Redemption Trigger 110%: 55 EUR / Share
Number Of Shares Accumulated per Day: 794
Example 1 – Optimistic Scenario
The share gains 10% in 3 months (60 business days).
The investor accumulates 60 x 794 = 47,640 shares at
the pre-defined discounted price of 40 EUR / share. At
the end of the 3rd month, the product redeems early
since the share reaches the 110% trigger.
The investor can receive a profit of:
No. of Shares x (Spot Price – Initial Discounted Price)
= 47,640 x (55 - 40) = 714,600 EUR
30
40
50
60
9M 1Y6M3M
Share Price (EUR)
110% Trigger
Strike
Optimistic Scenario
Discounted Price
Price of underlying share
G L O B A L M A R K E T S
Knock Out Forward 45
P A Y O F F S
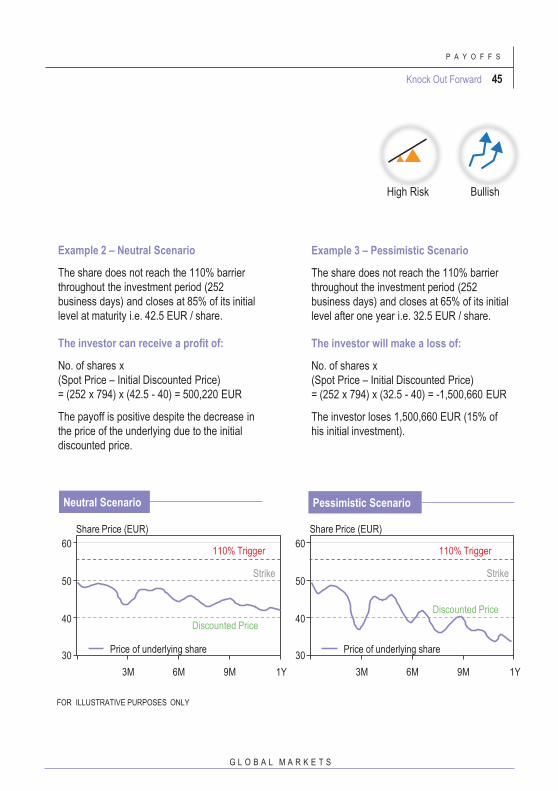
Example 2 – Neutral Scenario
The share does not reach the 110% barrier
throughout the investment period (252
business days) and closes at 85% of its initial
level at maturity i.e. 42.5 EUR / share.
The investor can receive a profit of:
No. of shares x
(Spot Price – Initial Discounted Price)
= (252 x 794) x (42.5 - 40) = 500,220 EUR
The payoff is positive despite the decrease in
the price of the underlying due to the initial
discounted price.
Example 3 – Pessimistic Scenario
The share does not reach the 110% barrier
throughout the investment period (252
business days) and closes at 65% of its initial
level after one year i.e. 32.5 EUR / share.
The investor will make a loss of:
No. of shares x
(Spot Price – Initial Discounted Price)
= (252 x 794) x (32.5 - 40) = -1,500,660 EUR
The investor loses 1,500,660 EUR (15% of
his initial investment).
30
40
50
60
Price of underlying share
3M 6M 9M 1Y
110% Trigger
Strike
Discounted Price
Share Price (EUR)
BullishHigh Risk
Neutral Scenario Pessimistic Scenario
30
40
50
60
Price of underlying share
3M 6M 9M 1Y
110% Trigger
Strike
Discounted Price
Share Price (EUR)
FOR ILLUSTRATIVE PURPOSES ONLY

B N P P A R I B A S
Appendix
A P P E N D I X
46

47
A P P E N D I X
G L O B A L M A R K E T S
Introduction to Options
Vanilla Options
Long / Short Position
Introduction to Forwards / Futures
Collar
Call Spread
Put Spread
Straddle
Strangle
Barrier
Asian
Binary
Lookback
Option Pricing
Black-Scholes Model
Grid Methods - Binomial Tree
Simulations - the Monte Carlo Methods
Efficient Frontier
Efficient Frontier with Lookback
Volatility Modelling - Local or Stochastic Volatility?
Fund-Linked Structured Products

A P P E N D I X
48 Introduction to Options
B N P P A R I B A S
An option is a contract that gives its holder the
right, but not the obligation, to buy or sell an
asset, at a fixed price (strike), on (for
European options) or before (for American
options) a given date.
Options allow investors to benefit from a
leveraged participation in an asset without
having to buy the asset itself.
There are various types of options, from the
simplest, referred to as “plain vanilla” options,
to the most complex “exotic” options.
A European Option is an option which the
buyer can exercise only on a given date, i.e.
the maturity date of the option.
An American Option is an option which the
buyer can exercise at any time between the
date of entering into the contract and the
expiration date.
Introduction
to Options
Benefits
■ Leveraged exposure and higher returns with
respect to the money invested.
■ Limited risk (for capital guarantee), as risk is
limited to the premium paid for the option (if
long the option).
■ Possibility to make money whether the market
goes up or down.
■ Possibility of combining options to create
bespoke investment solutions.
Drawbacks
■ Investments might result in loss of premium in
a relatively short period of time.
■ Option can expire worthless.
■ Option holder must be right about both the
direction and timing of the underlying’s
anticipated price change.
■ Selling an option can expose the seller to
large losses.

Vanilla Options 49
A P P E N D I X
G L O B A L M A R K E T S
A vanilla option is the most basic derivative. It has
a specific expiry and strike price.
Call / Put
A Call Option is the right to buy a fixed number
given date.
A Put Option is the right to sell a fixed number of
underlyings (securities), at a fixed price, on a
given date.
Option Terminology
Premium Option value
Intrinsic Value For a call, it is the difference
between the spot price and the strike price of the
underlying (if positive)
Time Value Premium – intrinsic value
At-the-money The underlying value currently
equals the strike price
In-the-money Option has positive intrinsic value
Out-of-the-money Option has no intrinsic value
When an investor purchases an option, the net
return is the difference between the intrinsic value
realised from exercising the option less the option
premium paid.
Vanilla Options
At the money
In the moneyOut of the money
Underlying valueStrike
Option Value
Intrinsic
value
At the money
Out of the moneyIn the money
Underlying valueStrike
Option Value
Intrinsic
value
Value of Call Option at Expiration (Long Call)
Value of Put Option at Expiration (Long Put)
FOR ILLUSTRATIVE PURPOSES ONLY

A P P E N D I X
50 Long / Short Position
B N P P A R I B A S
Long PositionTaking a long position in an asset means
buying the asset. Any investor can take a long
position on any underlying, option, etc. available
on the market.
Short Position
Taking a short position in an asset means
selling it. To take a short position, in securities
an investor has to own / issue what he is selling
(e.g. shares, etc.). There is one exception, which
is short-selling.
Short-selling means borrowing a security and
then selling it, hoping for the price to fall. The
short-seller must eventually give back the
borrowed security, by buying it back from the
open market. The short-seller aims to buy the
security at a cheaper price than that at which he /
she sold it earlier to keep the difference as a
profit.
In derivatives (future options), taking a short
position does not include borrowing as
derivatives are not securities, but contracts.
However, when one buys or sells an option for a
market-maker the market-maker might have to
short sell the underlying security depending on
the nature of the options.
Illustrated are the classical graphs of long / short
positions in a call and a put, with K representing
the strike price of the option.
Long / Short Position
Underlying Value Maturity
Cash-flow at maturity
0KOption Price
Payoff Line
Profit Line
Long Call (purchasing the right to buy an asset)
■ Bullish view that share price will increase.
■ Purchase the right (no obligation) to buy the
share at a fixed price until or at maturity.
■ If the share price rises above the strike price
by more than the premium the investor will
profit.
■ If the share price is lower than the exercise
price, the investor will let the call contract expire
worthless, losing only the premium paid.
Long Call

Long / Short Position 51
G L O B A L M A R K E T S
Underlying Value Maturity
K
Option Price
FOR ILLUSTRATIVE PURPOSES ONLY
Underlying Value Maturity
Cash-flow at maturity
K
Underlying Value
Cash-flow at maturity
K Option Price
K
Maturity
Long Put (purchasing the right to sell an asset)
■ Bearish view that share price will decrease.
■ Purchase the right (no obligation) to sell
the share at a fixed price until or at
maturity.
■ If the share price is below the strike price by
more than the premium paid, the investor will
profit.
■ If the share price is above the strike
price, the investor can let the put
contract expire worthless, losing only
the premium paid.
Short Call (selling the right to buy an asset)
■ Bearish view that share price will decrease.
■ Sell, or “write” a call with the obligation to sell
the share at a fixed price at the buyer’s option
maturity.
■ If the share price decreases, the short call
position will make a profit in the amount of the
premium.
■ If the share price increases over the strike price
by more than the amount of the premium, the
short call will lose money, with the potential loss
unlimited.
Short Put (selling the right to sell an asset)
■ Bullish view that share price will increase.
■ Sell, or “write” a put with the obligation to buy
the share at a fixed price at the buyer’s option
maturity.
■ If the share price increases, the short put
position will make a profit in the amount of
the premium.
■ If the share price decreases below the strike
price by more than the amount of the premium,
the short put will lose money, with the potential
loss being up to the full value of the share.
Short CallLong Put
Option Price
Short Put
Cash-flow at maturity
A P P E N D I X

A P P E N D I X
52 Introduction to Forwards / Futures
B N P P A R I B A S
A forward contact is an agreement to buy or
sell an asset at a certain point in the future for a
given price. It is traded in the over-the-counter
market, usually between two financial institutions
or between a financial institution and one of its
clients.
Like a forward contract, a futures contract is an
agreement to buy or sell an asset at a certain
time in the future for a given price.
Unlike forward contracts, future contracts are
normally traded on an exchange.
Forwards and futures are often substitutes.
However, the relative costs, liquidity, and
convenience of using one market versus the
other differs at times.
Benefits■ Consistent tool to manage market and price
risk.
■ Cost efficiency due to low commission
structure, and tight bid-offer.
■ Easy to price.
Drawbacks■ No protection on the downside.
Introduction to Forwards / Futures
S(T)
Profit
F(0,T)
S(T)
S(T): Spot price at delivery
F(0,T): Original forward price
Profit
F(0,T)
Profit of long forward = S(T) - F(0,T)
Profit of short forward = F(0,T) - S(T)
FOR ILLUSTRATIVE PURPOSES ONLY
FOR ILLUSTRATIVE PURPOSES ONLY
Short Forward
Long Forward

Collar 53
A P P E N D I X
G L O B A L M A R K E T S
Collar
Principles
A collar (or tunnel) combines either a long call
and a short put, or a short call and a long put, of
the same maturity and different strikes.
For a zero-cost-collar, strikes can be customised
so that the call premium exactly offsets the put
premium. Strike prices are calculated so as to
equate the value of both options and, hence,
build a zero-cost strategy. At maturity, the
investor is compensated for the drop of an
underlying below the lower strike price, or
abandons the rise of underlying above the higher
strike price. If the underlying finishes between
lower and higher strikes, the payoff is nil.
(Payoff-Premium) at maturity
25 35 45 55 65 75
Benefits of a Long Collar
(long put short call)
■ Clients buy protection on the downside and
take on upside risk.
■ Portfolio protection – the lower the underlying
price, the greater the return.
■ No up front cost – the put purchase is
financed by the sale of the call.
■ Cheaper hedging solution.
Drawbacks of a Long Collar
■ Upside is limited.
Collar Strategy
FOR ILLUSTRATIVE PURPOSES ONLY
Option Pessimistic CaseOption Optimistic Case
Overall Collar Return Underlying Return
Underlying Spot
20
15
10
5
0
-5
-10
-15
-20
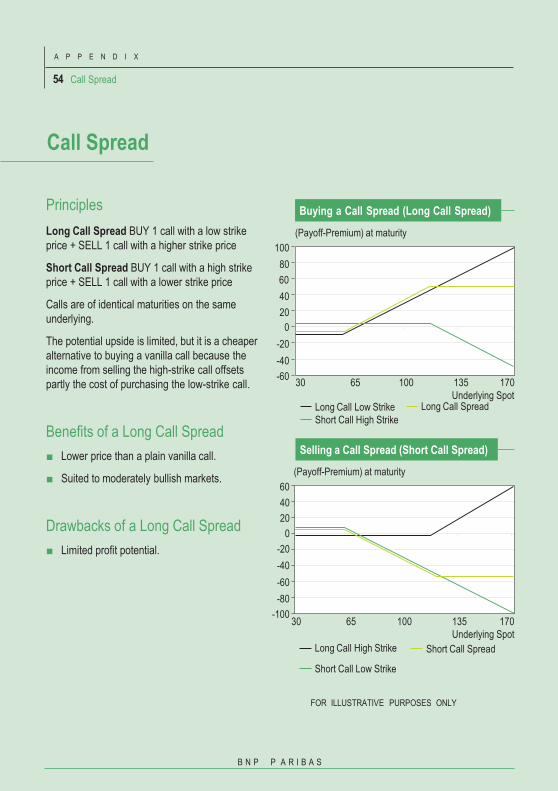
A P P E N D I X
54 Call Spread
B N P P A R I B A S
Call Spread
Principles
Long Call Spread BUY 1 call with a low strike
price + SELL 1 call with a higher strike price
Short Call Spread BUY 1 call with a high strike
price + SELL 1 call with a lower strike price
Calls are of identical maturities on the same
underlying.
The potential upside is limited, but it is a cheaper
alternative to buying a vanilla call because the
income from selling the high-strike call offsets
partly the cost of purchasing the low-strike call.
Benefits of a Long Call Spread
■ Lower price than a plain vanilla call.
■ Suited to moderately bullish markets.
Drawbacks of a Long Call Spread
■ Limited profit potential.
(Payoff-Premium) at maturity
100
30 65 100 135 170
Underlying Spot
80
40
20
0
-20
-40
-60
Long Call Low Strike
Short Call High Strike
Long Call Spread
(Payoff-Premium) at maturity
60
40
20
0
-20
-40
-60
-80
-10030 65 100 135
Short Call Spread
170
Underlying Spot
Long Call High Strike
Short Call Low Strike
FOR ILLUSTRATIVE PURPOSES ONLY
Buying a Call Spread (Long Call Spread)
Selling a Call Spread (Short Call Spread)
60
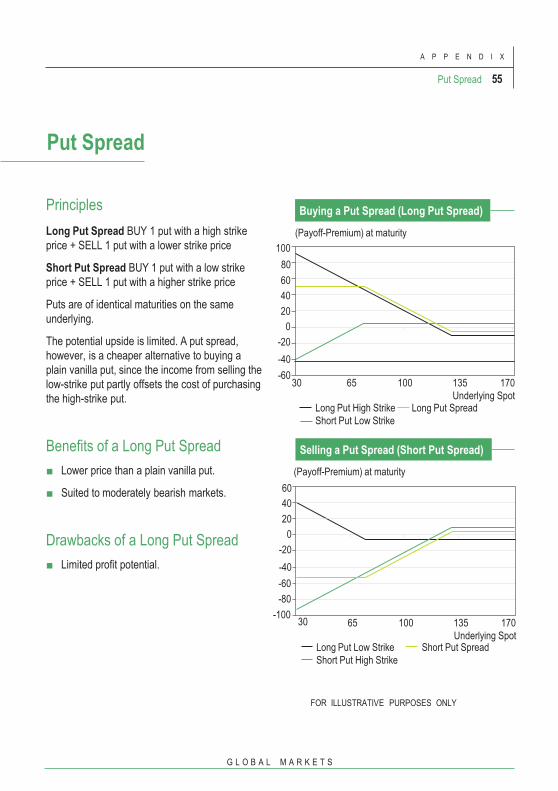
Put Spread 55
A P P E N D I X
G L O B A L M A R K E T S
Put Spread
Principles
Long Put Spread BUY 1 put with a high strike
price + SELL 1 put with a lower strike price
Short Put Spread BUY 1 put with a low strike
price + SELL 1 put with a higher strike price
Puts are of identical maturities on the same
underlying.
The potential upside is limited. A put spread,
however, is a cheaper alternative to buying a
plain vanilla put, since the income from selling the
low-strike put partly offsets the cost of purchasing
the high-strike put.
Benefits of a Long Put Spread
■ Lower price than a plain vanilla put.
■ Suited to moderately bearish markets.
Drawbacks of a Long Put Spread
■ Limited profit potential.
(Payoff-Premium) at maturity
(Payoff-Premium) at maturity
FOR ILLUSTRATIVE PURPOSES ONLY
Buying a Put Spread (Long Put Spread)
Selling a Put Spread (Short Put Spread)
100
30 65 100 135 170
Underlying Spot
80
60
40
20
0
-20
-40
-60
Long Put High Strike Long Put Spread
Short Put Low Strike
60
30 65 100 135 170
Underlying Spot
40
20
0
-20
-40
-60
-80
Long Put Low Strike
Short Put High Strike
-100
Short Put Spread

A P P E N D I X
56 Straddle
B N P P A R I B A S
Straddle
Principles
A straddle combines a put and a call of same
strike and maturity, usually at the money. The
straddle buyer will make money if the underlying
moves either significantly up or down. The price
of a straddle is therefore quite sensitive to the
price of implied volatility.
Benefits of a Long Straddle
■ Unlimited potential upside.
■ Returns in both bearish and bullish markets.
Drawbacks of a Long Straddle
■ Expensive when volatility is high.
(Payoff-Premium) at maturity
(Payoff-Premium) at maturity
Buying a Straddle (Long Straddle)
Selling a Straddle (Short Straddle)
70
60
50
40
30
20
10
0
-10
-20
-3065 100 135 170
Underlying SpotLong Call
Long Put
Long Straddle
30
20
10
0
-10
-20
-30
-40
-50
-60
- 7030 65 100 135 170
Underlying Spot
30
Short Call
Short Put
Short Straddle
FOR ILLUSTRATIVE PURPOSES ONLY

Strangle 57
A P P E N D I X
G L O B A L M A R K E T S
Strangle
Principles
A strangle is similar to a straddle (combining a
put and a call of same maturity). A strangle has
out-of-the-money options, as the put and call
have different strikes.
Consequently, buying a strangle is cheaper than
buying a straddle, but a strangle requires a
greater movement of the underlying to be
profitable.
Benefits of a Long Strangle
■ Unlimited potential upside.
■ Returns in both bearish and bullish markets.
■ Lower price than a straddle.
Drawbacks of a Long Strangle
■ Big move needed otherwise both the calls
and puts will rapidly deteriorate in value.
(Payoff-Premium) at maturity
(Payoff-Premium) at maturity
FOR ILLUSTRATIVE PURPOSES ONLY
Buying a Strangle (Long Strangle)
Selling a Strangle (Short Strangle)
60
50
40
30
20
10
0
10
-2030 65 100 135 170
Underlying SpotLong Call
Long Put
Long Straddle
20
10
0
-10
-20
-30
-40
-50
-6031 66 101 136
Underlying SpotShort Call
Short Put
Short Straddle

A P P E N D I X
58 Barrier
B N P P A R I B A S
Barrier
Principles
Barrier options are similar to vanilla options,
except there is an element known as a “barrier”.
The barrier can either knock-in the option,
knock-out the option or, in some cases, do both.
A knock-in option is activated when the
underlying’s price reaches a certain barrier.
A knock-out option is deactivated when the
underlying’s price reaches a certain barrier.
The payoff depends on whether the
underlying’s price reaches a certain level during
a given period.
Due to the contingent nature of these options,
barrier options’ premiums are lower than that of
a corresponding vanilla option.
Benefits of a Long Barrier
■ Premium cost of a barrier option is less than
that of a standard vanilla option.
Drawbacks of a Long Barrier
■ The payoff is path-dependent.
Example: Down-and-In Put
A Down-and-In Put is a contract that becomes a
standard put option if the price of the underlying
falls below a certain price level before maturity. The
put is “knocked in” (activated) when the barrier is
breached.
Barrier Example
FOR ILLUSTRATIVE PURPOSES ONLY
Time
Strike
Knock-In
Barrier
Put is not activated, Put is activated
final payoff is 0
Spot

Asian 59
A P P E N D I X
G L O B A L M A R K E T S
Asian
Principles
Asian options are options where the payoff
depends on the average value of the underlying
on a specific set of dates throughout the life of the
option.
Since the distribution of the underlying asset
value at maturity is wider than that of its average
value over the investment period, asian options
enjoy a lower volatility, provide higher
participation rate and are generally cheaper
compared to equivalent vanilla options. The
higher the number of observations, the cheaper
the asian option.
Average price option
The payoff is equal to the difference between the
average value of the underlying throughout the
life of the option and a fixed strike.
Asian options can be structured as puts or calls.
They are generally exercised as European
options.
FOR ILLUSTRATIVE PURPOSES ONLY
Benefits of a
Long Asian Option
■ Lower premium than the plain vanilla option
– the volatility of the average being lower
than the volatility of the underlying price.
■ Provide higher participation rate.
■ In volatile environments, an Asian call
smoothes exceptional events – it enhances
the underlying’s upside exposure, with no
risk of the investor being penalised by a “bell
shape” effect (market downturn at maturity).
■ Avoid market timing issues.
Drawbacks of a
Long Asian
■ May not benefit from the whole rise of the
underlying asset in the case of a strong
bullish market.
Average Strike Option
Underlying Value
Annual observation Dates
Time
Payoff x
Average of the values
recorded on annualobservation dates

A P P E N D I X
60 Binary
B N P P A R I B A S
Binary
Principles
Binary options are options with discontinuous
payoffs. A binary option pays a fixed amount if
the underlying asset price is above the barrier
level and pays nothing in the opposite case.
Cash-or-nothing options pay a fixed amount, or
nothing at all, depending on the underlying’s price
at maturity (i.e. when the option expires in-the-
money).
These options are widely used in income
products paying fixed coupons if the underlying
asset is above, or below, a certain price.
Benefits of a
Long Binary Option
■ Easy to understand
■ Only requires a sense of direction of the
price movement of the underlying asset
and target price, whereas vanilla options
require a sense of direction and the
magnitude of the price movement.
■ As long as the binary option settles in-the-
money by even one percentage point, the
option provides a full payout.
■ Low risk – known upside and downside
assessment.
Drawbacks of a
Long Binary Option
■ Unable to benefit from the full upside.
■ Need liquid market.
Example: Long Binary Call Option
The graph illustrates a binary call option that pays a
fixed coupon of 25% if the underlying is above
120% of its initial level.
Long Binary Call Example
FOR ILLUSTRATIVE PURPOSES ONLY
Payoff at maturity
120 Underlying Spot
0%
120% barrier
100

Lookback 61
A P P E N D I X
G L O B A L M A R K E T S
Lookback
Principles
Lookback options are options whose payoffs
depend on the maximum or minimum asset price
reached during the life of the option.
For a long call position, the payoff is the
difference between the maximum asset price and
the initial asset price (strike).
There are 2 types of Lookback options:
Performance Lookback – Strike is set at
inception. At maturity, the buyer can “lookback”
over the life of the option and choose the most
favourable exercise point to maximise profit.
Strike Lookback – Strike is set at maturity. The
buyer can choose the most favourable strike to
maximise profit.
Since the buyer can always choose the highest
profit, an important determinant of the option
price is the underlying’s volatility. The higher the
volatility, the higher the probability that the
underlying will move enough for a significant
profit, thus, the more expensive the lookback.
Drawbacks of a
Long Lookback
■ Expensive when volatility is high.
FOR ILLUSTRATIVE PURPOSES ONLY
Benefits of a
Long Lookback
■ Lookback call owner can buy at the lowest
observed price or sell at the highest
observed price.
■ Eliminates market entry and exit timing
problems.
Underlying Value
Time
Payoff
Strike
Underlying Value
Time
Payoff
Low
Performance Lookback Call
Strike Lookback Call

A P P E N D I X
62 Option Pricing
B N P P A R I B A S
Option Pricing
Background
Numerous models have been created to price
options, many based on the Black-Scholes (B&S)
option pricing model of 1973.
The insight behind the B&S model was that the
price of an option was the price of the dynamic
trading strategy required to hedge it (in the
absence of transaction costs). The work of Black
and Scholes showed that, through hedging, the
“real-world” assumption for the growth rate of the
underlyings can be replaced by the risk-free
interest rate in option pricing models. This is the
famous and fundamental risk neutrality
framework.
We will look at the three methods currently in use
to price options:
■ Closed-Form Formulae (the Black-
Scholes formula or its adaptations)
■ Grid Methods (the best known being the
binomial tree method)
■ Simulations (Monte-Carlo method)
All of these depend on the risk neutrality
framework.
The Black-Scholes model was formulated to price
European call and put options and takes into
account several parameters: current asset price,
option strike price, time to expiration, volatility of the
underlying, risk-free interest rate and the value of
dividends expected during the life of the option. As
we will see, the current option price, interest rates
and dividends are found in the B&S equation in a
combination called the forward price.
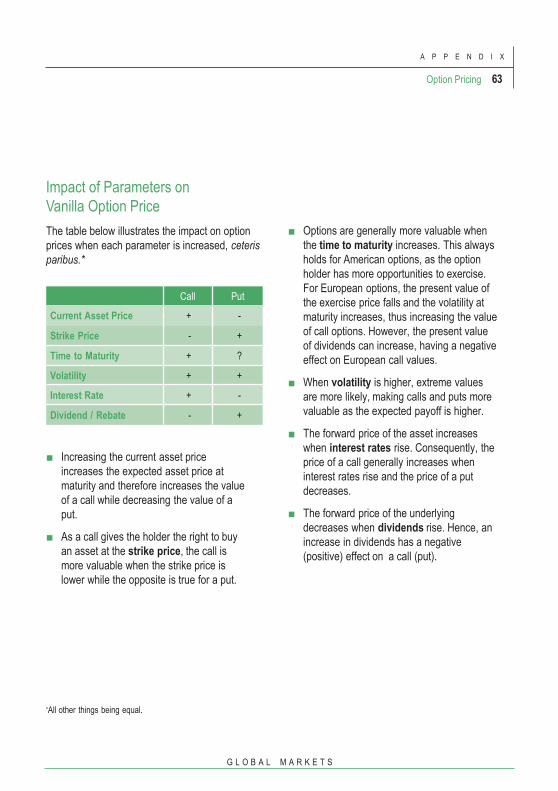
Option Pricing 63
A P P E N D I X
G L O B A L M A R K E T S
Impact of Parameters on
Vanilla Option Price
The table below illustrates the impact on option
prices when each parameter is increased, ceteris
paribus.*
■ Options are generally more valuable when
the time to maturity increases. This always
holds for American options, as the option
holder has more opportunities to exercise.
For European options, the present value of
the exercise price falls and the volatility at
maturity increases, thus increasing the value
of call options. However, the present value
of dividends can increase, having a negative
effect on European call values.
■ When volatility is higher, extreme values
are more likely, making calls and puts more
valuable as the expected payoff is higher.
■ The forward price of the asset increases
when interest rates rise. Consequently, the
price of a call generally increases when
interest rates rise and the price of a put
decreases.
■ The forward price of the underlying
decreases when dividends rise. Hence, an
increase in dividends has a negative
(positive) effect on a call (put).
Call Put
Current Asset Price + -
Strike Price - +
Time to Maturity + ?
Volatility + +
Interest Rate + -
Dividend / Rebate - +
■ Increasing the current asset price
increases the expected asset price at
maturity and therefore increases the value
of a call while decreasing the value of a
put.
■ As a call gives the holder the right to buy
an asset at the strike price, the call is
more valuable when the strike price is
lower while the opposite is true for a put.
*All other things being equal.

A P P E N D I X
64 Black-Scholes Model
B N P P A R I B A S
Black-Scholes Model
Background
Fischer Black and Myron Scholes proposed this
option pricing model in 1973. The Black-Scholes
(B&S) model, however, is not just about the
famous formula. More important than the formula
itself, the key contribution of Black and Scholes
was to give a general and flexible framework to
price many types of derivatives. Modified and
extended versions of this model are still popular
today.
Black-Scholes Option
Pricing Formula
Value of a European Call (C)
Log denotes the natural logarithm, and:
where:
and
F = the Forward price of the underlying share
K = the strike price
r = the continuous risk free interest rate
T = the time in years until the expiration of the
option
σ = the implied volatility for the underlying
share
N= the standard normal cumulative distribution
function

Black-Scholes Model 65
A P P E N D I X
G L O B A L M A R K E T S
Consequences, Extensions and Limitations of the Black-Scholes Formula
One remarkable consequence of the Black-Scholes formula is that the price of a European Option (i.e. one
that can be exercised only on maturity) is a function of only TWO parameters of the underlying asset – its
Forward Price and its Implied Volatility. Once you have correct estimates for these, you can price a vanilla
option. This has very general applications and allows various extensions to achieve at least an approximate
pricing of some more complex options:
However, the B&S formula has strong
limitations:
■ It cannot be used to price American Options.
■ It cannot be used to price more complex
payoff formulas such as barrier options,
exotic multi-underlying options (Worst-Of,
Best-Of options).
■ It only takes into account a single number for
the implied volatility which is independent of
the strike level. This is fine for vanilla options
but many types of simple exotics (for
instance any kind of binary option) will be
priced differently in the presence of volatility
smile (i.e. different implied volatilities for
different strikes).
■ Options on a dividend paying share can
be priced by calculating the correct
Forward Price of the share taking into
account its dividends.
■ Quanto options (i.e. options based on the
performance of a foreign asset) can be
priced with the same formula but adjusting
the Forward Price by the so called quanto
adjustment.
■ Options on a share basket can be
approximated by calculating the basket
Forward Price from individual forward
prices as well as the basket volatility from
individual volatilities and correlations
between shares.
■ Etc.
A P P E N D I X
66 Grid Methods – Binomial Tree
B N P P A R I B A S
Grid Methods –
Binomial Tree
Background
The Cox-Ross-Rubinstein (1979) binomial option
pricing model is a variation of the Black-Scholes
model that can account for early exercise
(American options pricing) and certain exotic
payoffs (such as barrier options).
■ The model uses a discrete time framework
to trace the evolution of the underlying’s
price via a simple, stationary binomial
process. At each time interval (node), the
price can either go up or down by a given
percentage.
■ Option valuation is calculated by applying
the risk neutrality assumption over the life
of the option. Option prices at each step of
the tree are calculated working backwards
from expiration to the present.
■ The payoff specifics (payoff at maturity as
well as early exercise conditions or
barriers) are defined by appropriate
boundary conditions.
With a careful implementation, grid methods are
extremely powerful and versatile, allowing a large
number of options on single underlyings to be
priced. They also take into account a volatility which
is not constant with strike or time (more on this
later).
The main limitation of grid methods is that they are
unable to price options on a large number of
underlyings (in practice any number beyond two)
such as complex options on baskets of indices or
shares.
Applications and Limitations
of Grid Methods

Simulations – the Monte Carlo Methods 67
A P P E N D I X
G L O B A L M A R K E T S
Simulations – the
Monte Carlo Methods
Background
The use of repeated random simulations (called
Monte Carlo methods) to solve problems in
Theoretical Physics dates back to the 1930s.
They were further used in the 1950s in military
applications and, with the increase and wider
availability of computational power, became
increasingly common in the subsequent years.
Over the last few decades use of Monte Carlo
simulations in technical applications and in
Finance has become widespread.
■ The Monte Carlo engine draws a large
number (usually more than 10,000) of
random paths for the underlying asset in
the risk neutral probability framework. This
can also be done in a consistent manner
for several assets that are correlated.
■ For each path, the payoff is computed
based on the final value and possibly
some intermediary values (e.g. maximum
value over the fixing dates to price a
lookback option).
■ The actual price of the option is the
average of the simulated payoffs,
discounted back from the payoff date to
today.
Applications and Limitations
of Monte Carlo Methods
Monte Carlo methods are extremely popular for
pricing exotic equity options because:
■ They are intuitive and relatively easy to
implement.
■ They allow various types of exotic options,
including multi-underlying options (high
dimension Monte-Carlo) to be priced.
■ They allow different volatility models to be
used (more on that very soon).
It is important to note that Monte Carlo methods
work quite slowly, so they require high
computational power to compute the result in a
reasonable time frame. However, this is easily
achievable using parallel computing power.
The major limitation of Monte Carlo methods is
that they cannot normally be used to price
American Options.

A P P E N D I X
68 Efficient Frontier
B N P P A R I B A S
Efficient Frontier
Background
The objective of investing in a portfolio rather
than taking a position in a single underlying is to
diversify one’s investment and minimise risk.
Some portfolios, however, are better than
others, depending on the underlying assets and
the portfolio allocation.
In the past, investment portfolios were typically
selected according to an individual analysis of
their constituent assets. Instead of selecting an
overall portfolio, shares and bonds were
individually selected based on their attractive
risk-reward profiles.
In 1952, Harry Markowitz1 introduced the idea
that a portfolio should be judged at the portfolio
level, treating the assets as random variables.
This approach enabled the calculation of
expected values, standard deviations and
correlations between the constituent assets,
and provided the means to draw an efficient
frontier – a way of optimising a portfolio’s
overall risk and return.
What is an Efficient Frontier?
When analysing multiple portfolio combinations,
there may be many portfolios that have the same
volatility. Portfolio theory assumes that for a specified
volatility, a rational investor would choose the
portfolio with the highest return.
Similarly, there may be multiple portfolios that have
the same return, and portfolio theory assumes that,
for a specified level of return, a rational investor
would choose the portfolio with the lowest volatility.
An efficient portfolio is the unique portfolio that has
the highest expected return for a given volatility and,
likewise, the lowest volatility for a given return. Point
X for instance corresponds to the portfolio displaying
the highest rate of return for a volatility of 10%.
1 H.M Markowitz, Journal of Finance, 1952
2 The efficient frontier is the collection of all efficient
portfolios. Efficient frontier portfolio constituents:
Eurobond, Eurostoxx and Emerging Equities.
8.0%
7.0%
6.0%
5.0%
4.0%
3.0%
2.0%
1.0%
0.0%20.0% 30.0% 40.0% 50.0%
Return
Volatility
Eurobond
Eurostoxx
Emerging Equities
x
Example - Efficient Frontier2
FOR ILLUSTRATIVE PURPOSES ONLY
10.0%0.0%

Efficient Frontier with Lookback 69
A P P E N D I X
G L O B A L M A R K E T S
Efficient Frontier
with Lookback
Example: Adding a Structured
Product - Lookback
The Lookback offers return at maturity based on
the highest performance of an underlying asset
on any observation date, with no cap on the
upside and 100% capital guarantee.
The most obvious qualitative advantage of the
Lookback is to solve market-timing issues, thus
avoiding stop-loss selling if a market downturn
occurs. From a quantitative point of view, the
Lookback can improve the efficiency of a portfolio
by delivering returns close to those of equities,
while lowering risk (volatility).
The inclusion of a Lookback in a portfolio of
equities and bonds therefore alters the portfolio’s
risk / return profile. Incorporating the Lookback as
part of an efficient frontier analysis clearly
increases return for a set level of risk by
approximately 50bps. In other words, according to
our model, an investment in a portfolio containing
the Lookback may allow an investor to gain a
return 50bps higher than an equivalent Lookback-
free portfolio, for the same risk exposure.
BNP Paribas
Efficiency analysis provides a useful measure for
determining the optimum allocation to an
investor’s portfolio. The innovative employment of
a structured product component as part of our
efficient frontier calculations demonstrates the
versatility and practicality of structured products
as part of an optimised portfolio. BNP Paribas has
developed unique models to conduct advanced
portfolio analyses with structured products.
Return
7.0%
6.5%
5.5%
5.0%
4.5%
3.0%
4.0% 5.0% 6.0% 7.0% 8.0% 9.0% 10.0%
Volatility
With Lookback Without Lookback
Efficient Frontier with Lookback
6.0%
FOR ILLUSTRATIVE PURPOSES ONLY
Capital guarantee is subjected to creditworthiness of
the issuer.
3.5%
4.0%

A P P E N D I X
70 Volatility Modelling – Local or Stochastic Vol?
B N P P A R I B A S
Volatility Modelling –
Local or Stochastic Vol?
Background
As hinted at above, the price of some options will
be affected by the fact that the implied volatility is
different for different strike prices. This fact gave
rise to the development of volatility modelling,
with two main approaches being undertaken:
■ Local volatility formalised by Bruno Dupire
in 1994
■ Stochastic volatility by Heston and other
researchers
The local volatility replaces a single number
with a range of values that depend on time
and spot, namely a surface. Dupire showed
that a local volatility surface could be created
for any underlying that had a Black-Scholes
implied volatility surface depending on
maturity and strike, provided that this implied
volatility responded to some basic
consistency checks.
The local volatility model is very intuitive and can be
implemented either in a Grid method or in a Monte
Carlo method. It is very widely used, but fails to
price correctly some particular types of options such
as some cliquets.
The alternative is to consider that the volatility itself
is a random quantity, correlated with the spot. This
approach is the basis of a whole class of so called
stochastic volatility models. They are feasibly
implemented only in a Monte Carlo method. Quite
often, stochastic volatility is complemented with
“jumps” (i.e. large random moves of the underlying)
to further improve the way the asset’s “dynamic” is
simulated. Stochastic volatility models are
notoriously difficult to implement and “calibrate” (i.e.
it can be difficult to give prices consistent with those
observed in the market for simple derivative
products).

Fund-Linked Structured Products 71
A P P E N D I X
G L O B A L M A R K E T S
Fund-Linked
Structured Products
Sources of Return:
Alpha, Beta, Alternative Beta
Alpha (α) is considered to be a measure of the
added value that a manager contributes to a
fund’s performance. While a portion of the
performance can be explained by market
movements, actively managed funds aim to
improve on this through skillful investment.
Funds which target absolute returns may
consider their alpha to be the returns delivered
above the risk-free rate.
Beta (ß) measures the portion of performance
that is explained by market movements. For
instance, a diversified portfolio of shares may
perform similarly to broad market indices.
Alternative Beta (alt ß) measures the portion of
performance explained by the market exposure
benefits of Hedge Funds, which have access to
an increased range of asset classes and
strategies.
Active Asset Allocation & Manager Skill} Alpha (α)
} Beta (ß)
} Alternative Beta (Alt ß)
Traditional Market Performance
Alternative Market Exposures
Fun
d’s
Per
form
ance

IMPORTANT NOTICE: This document/communication may contain “Research” as defined under MiFID II
unbundling rules; any such Research is intended either (i) for those firms who are in scope of the MiFID II
unbundling rules and have signed up to a BNP Paribas Global Markets Research package, or (ii) for firms
that are out of scope of the MiFID II unbundling rules and therefore are not required to pay for Research
under MiFID II. Please note that it is your firm’s responsibility to ensure that you do not view or use any
Research in this document if your firm has not signed up to a BNP Paribas Global Markets Research
package, unless your firm is out of scope of the MiFID II unbundling rules. Please note that MiFID II also
imposes rules regarding receipt of monetary and minor non-monetary benefits under the broader
inducements regime. This document may also be regarded as a minor non-monetary benefit (MNMB) and it
is your firm’s responsibility to consider its own regulatory obligations in relation to inducements and
accepting MNMBs.
This document is CONFIDENTIAL AND FOR DISCUSSION PURPOSES ONLY; it constitutes a marketing
communication and has been prepared by a Sales and Marketing function within BNP Paribas and/or its
subsidiaries or affiliates (collectively “we” or “BNP Paribas”). As a confidential document it is submitted to
selected recipients only and it may not be made available (in whole or in part) to any other person without
BNP Paribas’ written consent.
This document is not a recommendation to engage in any action, does not constitute or form any part of
any offer to sell or issue and is not a solicitation of any offer to purchase any financial instrument, nor shall it
or any part of it nor the fact of its distribution form the basis of, or be relied on in connection with, any
contract or investment decision. To the extent that any transaction is subsequently entered into between
the recipient and BNP Paribas, such transaction will be entered into upon such terms as may be agreed by
the parties in the relevant documentation.
The information contained in this document has been obtained from sources believed to be reliable, but
there is no guarantee of the accuracy, completeness or suitability for any particular purpose of such
information or that such information has been independently verified by BNP Paribas or by any person.
None of BNP Paribas, its members, directors, officers, agents or employees accepts any responsibility or
liability whatsoever or makes any representation or warranty, express or implied, as to the accuracy or
completeness of the information, or any opinions based thereon, contained in this document and it should
not be used in place of professional advice. Additional information may be provided on request, at our
discretion. Any scenarios, assumptions, historical or simulated performances, indicative prices or
examples of potential transactions or returns are included for illustrative purposes only. Past performance is
not indicative of future results. Investors may get back less than they invested. BNP Paribas gives no
assurance that any favourable scenarios described are likely to happen, that it is possible to trade on the
terms described herein or that any potential returns illustrated can be achieved. This document is current as
at the date of its production and BNP Paribas is under no obligation to update or keep current the
information herein. In providing this document, BNP Paribas offers no investment, financial, legal, tax or any
other type of advice to, and has no fiduciary duty towards, recipients. Certain strategies and/or potential
transactions discussed in this document may involve the use of derivatives which may be complex in nature
and may give rise to substantial risks, including the risk of total or partial loss of any investment or losses
without limitation and which should only be undertaken by those with the requisite knowledge and
experience. BNP Paribas makes no representation and gives no warranty as to the results to be obtained
from any investment, strategy or transaction, or as to whether any strategy, security or transaction
described herein may be suitable for recipients’ financial needs, circumstances or requirements. Recipients
must make their own assessment of strategies, securities and/or potential transactions detailed herein,
using such professional advisors as they deem appropriate. BNP Paribas accepts no liability for any direct
or consequential losses arising from any action taken in connection with or reliance on the information
contained in this document even where advised of the possibility of such losses.

As an investment bank with a wide range of activities BNP Paribas may face conflicts of interest and you
should be aware that BNP Paribas and/or any of its affiliates may be long or short, for their own account or
as agent, in investments, transactions or strategies referred to in this document or related products before
the material is published to clients and that it may engage in transactions in a manner inconsistent with the
views expressed in this document, either for their own account or for the account of their clients.
Additionally, BNP Paribas may have acted as an investment banker or may have provided significant
advice or investment services to companies or in relation to investments mentioned in this document. The
information in this document is not intended for distribution to, or use by, any person or entity in any
jurisdiction where (a) the distribution or use of such information would be contrary to law or regulations, or
(b) BNP Paribas or a BNP Paribas affiliate would become subject to new or additional legal or regulatory
requirements. Persons in possession of this document should inform themselves about possible legal
restrictions and observe them accordingly.
Singapore - Branch: This document is distributed in Singapore by BNP Paribas, Singapore Branch, a
licensed bank regulated by the Monetary Authority of Singapore. This document is directed at Institutional
Investors and Accredited Investors within the meaning of the Securities and Futures Act, Chapter 289 of
Singapore. Some products or transactions described in this document may not be authorised in Singapore
and may not be available to Singapore investors. This document may constitute a product advertisement
within the meaning of the Financial Advisers Regulations or the Securities and Futures (Licensing and
Conduct of Business) Regulations of Singapore, in which case this advertisement has not been reviewed
by the Monetary Authority of Singapore.
© BNP Paribas 2019. All rights reserved.