Global management consulting firm | Bain & Company
36
LUXURY GOODS WORLDWIDE MARKET STUDY, FALL–WINTER 2018 The future of luxury: A look into tomorrow to understand today
Transcript of Global management consulting firm | Bain & Company
LUXURY GOODS WORLDWIDE MARKET STUDY, FALL–WINTER 2018
The future of luxury: A look into tomorrow to understand today
This report was authored by Claudia D’Arpizio, Federica Levato, Filippo
Prete, Elisa Del Fabbro and Joëlle de Montgolfi er.
Claudia D’Arpizio ([email protected]) is the global leader of
the Luxury and Fashion vertical at Bain & Company. Federica Levato
([email protected]) is a leading member of the Luxury and
Fashion vertical. Both are Bain partners based in Milan.
Filippo Prete (fi [email protected]) is a manager, and Elisa Del Fabbro
([email protected]) is a consultant, both in Bain’s Milan offi ce.
They also work with the fi rm’s Luxury and Fashion vertical.
Joëlle de Montgolfi er (joelle.demontgolfi [email protected]) is the practice
area senior director for Retail, Luxury and Consumer Products in
Europe, the Middle East and Africa. She is based in Bain’s Paris offi ce.
Copyright © 2019 Bain & Company, Inc. All rights reserved.
Luxury Goods Worldwide Market Study, Fall–Winter 2018
i
Contents
Executive summary . . . . . . . . . . . . . . . . . . . . . . . . . . . . . . . . . . . . . . . . pg. 1
1. Luxury spending trends in 2018 . . . . . . . . . . . . . . . . . . . . . . . . . . . . . . . pg. 5
2. Regional highlights . . . . . . . . . . . . . . . . . . . . . . . . . . . . . . . . . . . . . . . . pg. 9
3. Distribution trends . . . . . . . . . . . . . . . . . . . . . . . . . . . . . . . . . . . . . . . . pg. 13
4. Individual category performance and customer shifts . . . . . . . . . . . . . . . . pg. 19
5. Outlook for the future . . . . . . . . . . . . . . . . . . . . . . . . . . . . . . . . . . . . . pg. 23
Appendix . . . . . . . . . . . . . . . . . . . . . . . . . . . . . . . . . . . . . . . . . . . . . . pg. 27

Luxury Goods Worldwide Market Study, Fall–Winter 2018
ii
Executive summary
The luxury goods market continues to shine
The 17th edition of the Bain Luxury Study, published by Bain & Company for Fondazione Altagamma,
the trade association of Italian luxury goods manufacturers, analyzed recent developments in the
global luxury goods industry, as well as the future outlook.
The luxury industry as tracked by Bain encompasses both luxury goods and experiences. It comprises
nine segments, led by luxury cars, luxury hospitality and personal luxury goods, which together account
for more than 80% of the total market.
Overall, the luxury market grew 5% in 2018, to an estimated €1.2 trillion globally, with positive per-
formance across most segments.
Sales of luxury cars continued to dominate the market, growing 5% at constant exchange rates to
€495 billion. Luxury experiences remained very attractive to consumers, as illustrated by sales growth
of luxury hospitality (up 5% from last year), gourmet food and fi ne dining (up 6%) and luxury cruises
(up 7%).
Personal luxury goods segment posts healthy growth
The market for personal luxury goods—the “core of the core” and the focus of this analysis—reached
a record high of €260 billion, representing 6% growth (2% at current exchange rates). Worldwide,
the personal luxury goods market experienced growth across most regions, driven primarily by more
robust local consumption (up 4% globally at current exchange rates). In contrast, purchases among
tourists remained fl at on average.
Overall, shoes and jewelry were the top luxury growth categories, gaining 7% each, followed by hand-
bags and beauty. Watches remained fl at while apparel suffered, mainly due to lackluster sales in the
menswear segment.
Chinese consumers’ appetite for luxury remains unrivaled
Chinese consumers led the positive growth trend around the world. Their share of global luxury
spending continued to rise (now 33% of the total, up from 32% in 2017), while mainland China’s
share rose to 9% (up from 8% in 2017). In mainland China, luxury sales grew 20% to €23 billion,
driven by rising demand. Between 2015 and 2018, Chinese consumers’ local spending contributed
twice as much growth in absolute value as their spending abroad.
Europe lagged in 2018, as strong currencies limited tourists’ purchasing power. Local consumption
was positive overall, despite mixed performance across countries, helping to push retail sales up 3%
to €84 billion.
Luxury Goods Worldwide Market Study, Fall–Winter 2018
1
Luxury Goods Worldwide Market Study, Fall–Winter 2018
2
Luxury sales in the Americas reached €80 billion, representing a growth rate of 5%. A positive US
economy boosted disposable income and overall luxury spending by local consumers. However, the
strong dollar curbed spending by tourists from Asia and Latin America. Canada and Mexico were
strong markets in the region, while political uncertainties derailed Brazil’s performance.
In Japan, luxury sales eased slightly, rising 6% to €22 billion. Across the rest of Asia, sales grew 9%
to €39 billion. In other areas of the world, growth was fl at, with sales holding at €12 billion, mainly
due to stagnation in the Middle East.
Increasingly, luxury consumers are shopping online
The retail channel grew 4% in 2018, with three-quarters of that increase coming from same-store
sales growth. The wholesale channel grew only 1%, hampered by department store performance and
a slowdown among specialty stores facing tough competition from the online channel.
Online luxury shopping continued to accelerate in 2018, growing 22% to nearly €27 billion; it now
represents 10% of all luxury sales. The Americas market made up 44% of online sales, but Asia is
emerging as a new growth engine for luxury online, slightly ahead of Europe. Accessories remained
the top category sold online, ahead of apparel. The beauty and “hard luxury” (jewelry and watches)
categories were both on the rise. The biggest online channels for luxury sales were e-tailers, brands’
own websites and retailers’ websites.
Meanwhile, the secondhand market for luxury goods surged to €22 billion on strong growth in Europe
and among online platforms.
Luxury consumers are getting younger and more diverse
Luxury brands can no longer deny the infl uence of younger consumers. Generations Y and Z accounted
for 47% of luxury consumers in 2018 and for 33% of luxury purchases. However, they contributed
virtually all of the market’s growth, compared with 85% in 2017. To capitalize, luxury brands are
adapting to the preferences of younger consumers in terms of product offerings, communication and
engagement strategies, and distribution channels.
The luxury industry is also increasingly acknowledging cultural and size preferences. Modest fashion,
comprising garments that can be worn by Muslim consumers, accounted for approximately 40% of
luxury women’s ready-to-wear in 2018, while “inclusive” fashion, targeted to curvy or plus-size
consumers, represented about 20%.
Seven macro trends will shape the market through 2025
Looking ahead, we expect market fundamentals to remain favorable for the personal luxury goods
segment, resulting in growth of 3% to 5% per year through 2025, for a total value of €320 billion to
€365 billion. However, sociopolitical issues, commercial policies and potential soft recessions could
make for a bumpy road in the short term.
Luxury Goods Worldwide Market Study, Fall–Winter 2018
3
Based on our analysis, we identifi ed seven trends that will shape the future of luxury.
Chinese shoppers ramp up their purchasing, especially in China. By 2025, Chinese consumers will
account for 46% of the global market (up from 33% in 2018), and they will make half of their purchases
at home in China (up from 24% in 2017).
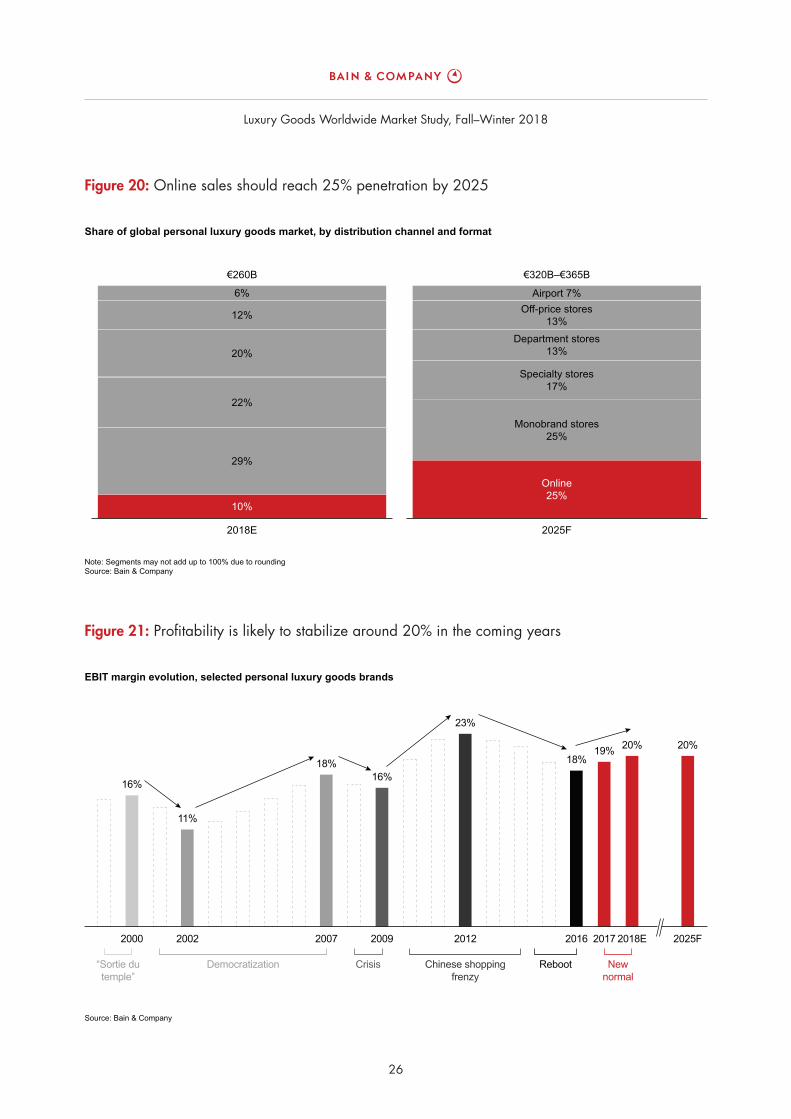
Digital permeates every purchase. By 2025, the online channel will represent 25% of the market’s
value, up from 10% today. Approximately half of all luxury purchases will be digitally enabled thanks
to new technologies along the value chain, and nearly all luxury purchases will be infl uenced by
online interactions.
Network consolidation redefi nes the store of the future. Reduced foot traffi c at physical stores will
lead to consolidation in retail networks, similar to what has already happened in sectors such as music,
books and consumer electronics. The role of the store will evolve from a simple point of sale to a true
touchpoint for consumer engagement.
The infl uence of younger consumers grows. New generations will be the primary engine of growth
for the luxury market in the coming years. Generations Y and Z will represent approximately 55% of
the 2025 market and will contribute 130% of market growth between now and then, offsetting the
decline in sales among older generations.
Cultures and subcultures drive consumption trends. Evolving cultures and subcultures (religious,
ethnic and others) will gain increasing infl uence. Luxury brands will need to acknowledge and address
these groups to remain relevant.
One market will serve “markets of one.” Brands in 2025 will see a blurring of typical competitive
boundaries. The standard model of growth—in which brands either become a specialist in a category
or diversify across a broader set of products and services—will be taken to the extreme as companies
strive to address individual consumers’ unique needs.
Nimble becomes the new black. EBIT margins rose from 19% in 2017 to 20% in 2018, confi rming
the recent trend of higher profi tability. However, digital disruption will continue to affect brands’
P&Ls, and profi tability should stabilize. Brands will need to become more agile in order to sustain
their profi tability levels.
To weather these disruptions, brands should focus on three priorities:
• Proactively develop dedicated strategies to address market trends.
• Design a distinctive winning formula based on consumer needs. (Generic, “plug-and-play” formulas
are no longer enough.)
• Win over younger consumers as a key engine for future market growth.
Underpinning all of these strategies are new technologies, which will play a crucial role as a funda-
mental enabler across the luxury value chain through 2025.
• The global luxury market tracked by Bain & Company comprises nine segments, including luxury cars, per-sonal luxury goods, luxury hospitality, fi ne wines and spirits, gourmet food and fi ne dining, fi ne art, high-end furniture and housewares, private jets and yachts, and luxury cruises. Overall, the luxury market gained 5% in 2018, rising to an estimated €1.2 trillion, with most segments growing in real terms.
• Luxury cars, luxury hospitality and personal luxury goods together accounted for more than 80% of the total market.
• Sales of luxury cars continued to dominate the market, growing 5% to €495 billion (a slight decline in the growth rate vs. 2017). Within the luxury car market, the aspirational segment outperformed.
• Luxury hospitality experienced positive growth in real terms, gaining 5%. Sales of luxury cruises increased 7%—the highest growth rate of all luxury segments. The “expedition” category in particular boomed in 2018.
• Sales of high-end food grew 6% from last year. Of particular importance was the “ethical nutrition” trend, refl ected by consumers’ desire for authenticity, quality, freshness and transparency regarding a product’s origins.
• Fine wines and spirits grew 4% on average, with polarized performance across wines (low single-digit growth) and spirits, which gained momentum due to increased demand from exclusive clubs and growing interest in craft spirits.
• Yacht sales posted lackluster performance, despite rising interest from Chinese buyers. The private jet market continued to contract, suffering from cannibal-ization from the secondhand market.
• Personal luxury goods outperformed the overall market in 2018, climbing 6% to reach a record high of €260 billion.
1.Luxury spending trends in 2018
Luxury Goods Worldwide Market Study, Fall–Winter 2018
6
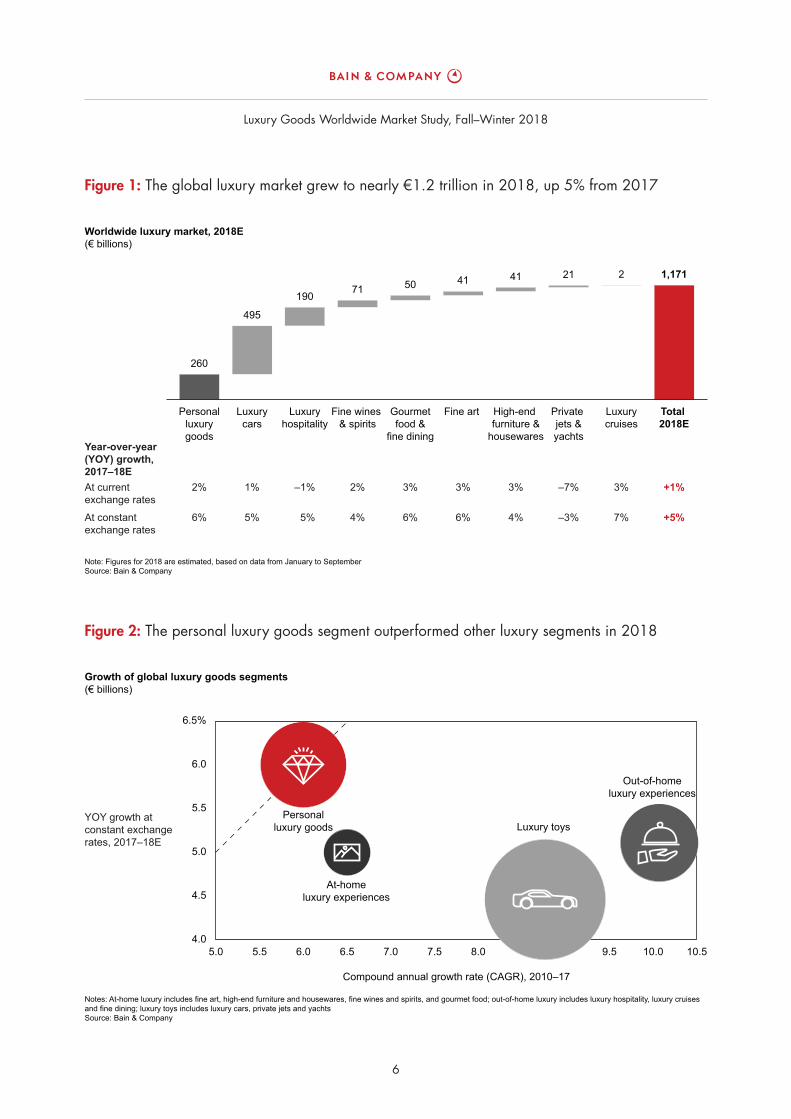
Figure 2: The personal luxury goods segment outperformed other luxury segments in 2018
Notes: At-home luxury includes fine art, high-end furniture and housewares, fine wines and spirits, and gourmet food; out-of-home luxury includes luxury hospitality, luxury cruisesand fine dining; luxury toys includes luxury cars, private jets and yachtsSource: Bain & Company
Growth of global luxury goods segments(€ billions)
Compound annual growth rate (CAGR), 2010–17
YOY growth atconstant exchangerates, 2017–18E
5.0 5.5 6.0 6.5 7.0 7.5 8.0 8.5 9.0 9.5 10.0 10.5
6.5%
6.0
5.5
5.0
4.5
4.0
Personalluxury goods
At-homeluxury experiences
Luxury toys
Out-of-homeluxury experiences
Figure 1: The global luxury market grew to nearly €1.2 trillion in 2018, up 5% from 2017
Total 2018E
Luxurycruises
Note: Figures for 2018 are estimated, based on data from January to SeptemberSource: Bain & Company
Worldwide luxury market, 2018E(€ billions)
1,17122141415071190
495
260
Personalluxurygoods
Luxurycars
Luxuryhospitality
Fine wines & spirits
Gourmetfood &
fine dining
High-end furniture &
housewares
Fine art Private jets &yachts
Year-over-year(YOY) growth,2017–18E
2%
6%
1%
5%
–1%
5%
2%
4%
3%
6%
3% 3%
6%
–7%
4% –3%
3%
7%
+1%
+5%
At currentexchange rates
At constantexchange rates
Luxury Goods Worldwide Market Study, Fall–Winter 2018
7
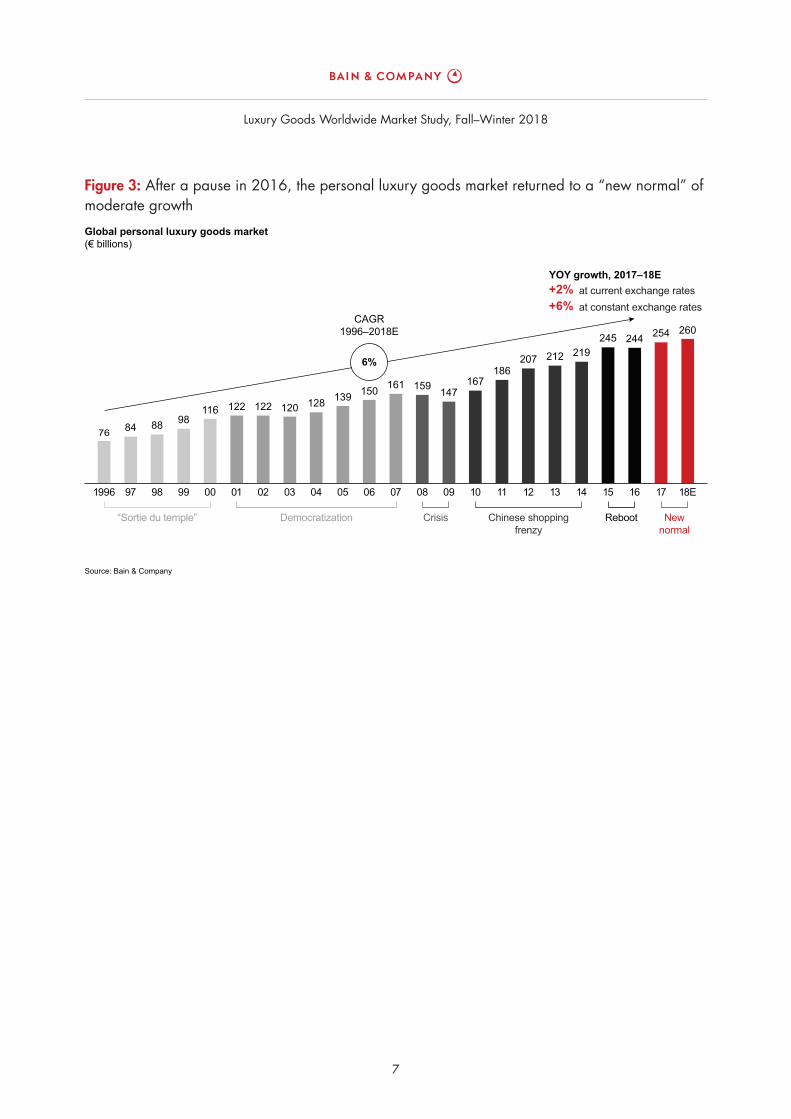
Figure 3: After a pause in 2016, the personal luxury goods market returned to a “new normal” of moderate growth
Source: Bain & Company
Global personal luxury goods market(€ billions)
1996
76
97
84
98
88
99
98
00
116
0201
122 122
03
120
04
128
05
139
06
150
07
161
08
159
09
147
10
167
11
186
12
207
13
212
14
219
15
245
16
244
17
254
18E
260
at current exchange rates
6%
CAGR1996–2018E
YOY growth, 2017–18E+2%
at constant exchange rates+6%
“Sortie du temple” Democratization Crisis Chinese shoppingfrenzy
Reboot Newnormal
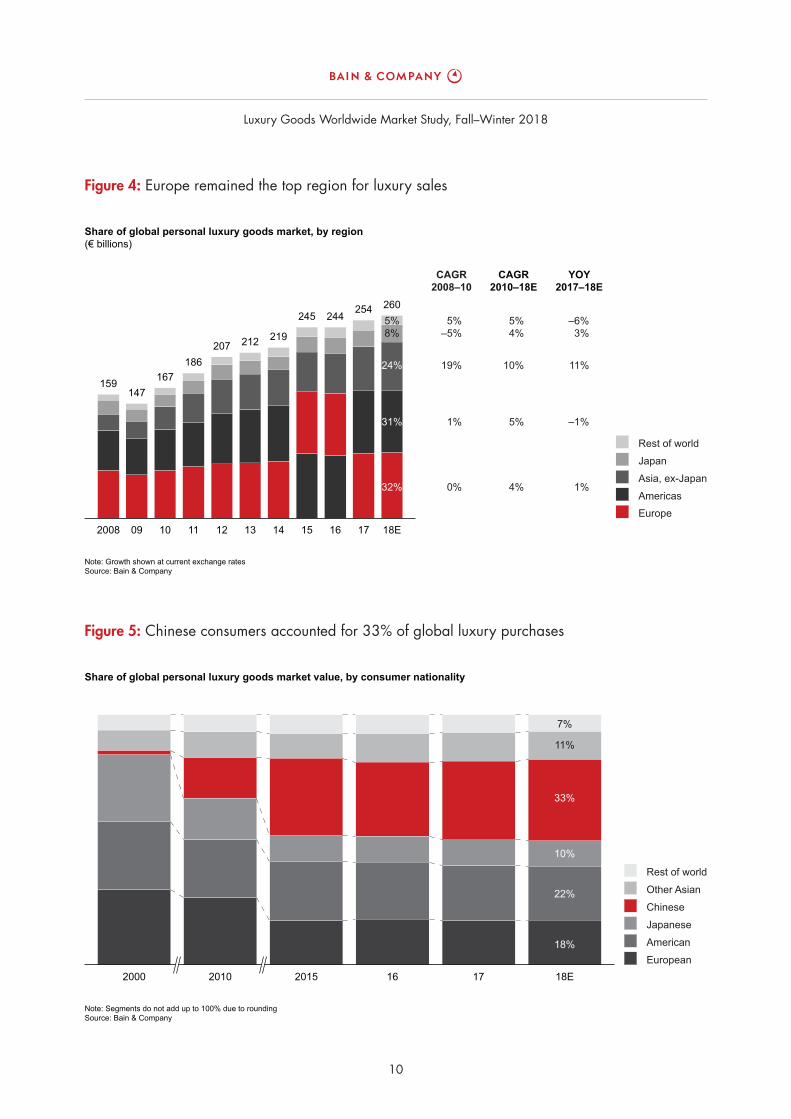
• Worldwide, the personal luxury goods market experienced growth across most regions. Europe remained the top region for sales, followed by the Americas, Asia (including mainland China), Japan and the rest of the world.
• Chinese consumers led the positive growth trend, with a 33% share of global luxury spending (up from 32% in 2017). Between 2015 and 2018, purchasing by Chinese consumers in mainland China contributed twice as much growth in absolute value as their spending abroad.
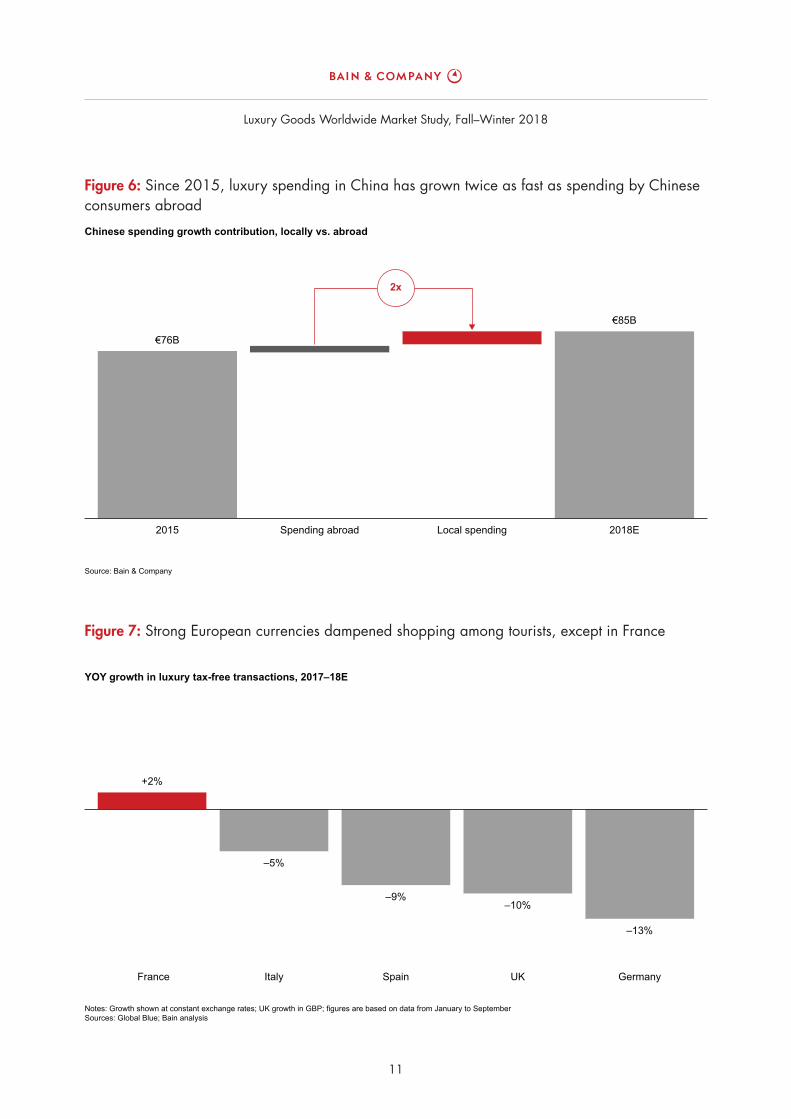
• Europe experienced moderate growth in sales in 2018. Local consumption was positive overall, helping to boost retail sales 3% (1% at current exchange rates) to €84 billion. But a deceleration in tourist spending had a major impact across European markets. Data from Global Blue—a company that tracks tax-free shopping transactions—shows that most major markets, including Germany, the UK, Spain and Italy, saw a substantial contraction in tax-free spending, as strong currencies dampened tourist shopping. France remained a bright spot, with 2% growth in tax-free transactions.
• Luxury sales in the Americas posted a growth rate of 5% (–1% at current exchange rates), rising to €80 billion. A positive US economy boosted disposable income and overall luxury spending by local consumers. However, the strong dollar curbed spending by tourists from Asia and Latin America. Canada and Mexico were strong markets in the region, while political uncertainties derailed Brazil’s performance.
• Luxury purchases in Japan eased compared with 2017 but still hit €22 billion, representing 6% growth (3% at current exchange rates). Japan enjoyed increased consump-tion by tourists, who took advantage of affordable fl ights to the main shopping cities of Tokyo, Kyoto and Osaka.
• Across the rest of Asia, sales rose 9% (11% at current exchange rates) to €39 billion, thanks to dynamic growth in local consumption in South Korea and brisk growth in Singapore, Thailand, Taiwan, Vietnam and the Philippines. Infl ows of Chinese tourists benefi ted the entire region, particularly Hong Kong and Macau.
• In other areas of the world, growth was fl at, holding at €12 billion. Consumers in the Middle East saw constrained disposable income due to a drop in oil prices and a recent government spending restriction. Additionally, the region’s turbulent geopolitical situation has reduced tourist volume.
2.Regional highlights
Luxury Goods Worldwide Market Study, Fall–Winter 2018
10
Figure 5: Chinese consumers accounted for 33% of global luxury purchases
Note: Segments do not add up to 100% due to rounding Source: Bain & Company
Share of global personal luxury goods market value, by consumer nationality
2000 2010 18E
18%
22%
10%
33%
11%
7%
17162015EuropeanAmericanJapaneseChinese
Rest of worldOther Asian
Figure 4: Europe remained the top region for luxury sales
Note: Growth shown at current exchange ratesSource: Bain & Company
Share of global personal luxury goods market, by region(€ billions)
2605%8%
32%
31%
24%
5%–5%
0%
1%
19%
5%4%
4%
5%
10%
–6%3%
1%
–1%
11%
Asia, ex-JapanJapan
Americas
Rest of world
2008
159147
09
167
10 11
186
12
207
13
212
14
219
15 16
244245
17
254
18E
YOY2017–18E
CAGR2010–18E
CAGR2008–10
Europe
Luxury Goods Worldwide Market Study, Fall–Winter 2018
11
Figure 7: Strong European currencies dampened shopping among tourists, except in France
Notes: Growth shown at constant exchange rates; UK growth in GBP; figures are based on data from January to SeptemberSources: Global Blue; Bain analysis
YOY growth in luxury tax-free transactions, 2017–18E
+2%
–5%
–9%–10%
–13%
Spain UKItaly France Germany
Figure 6: Since 2015, luxury spending in China has grown twice as fast as spending by Chinese consumers abroad
Source: Bain & Company
Chinese spending growth contribution, locally vs. abroad
€85B
€76B
2018ELocal spendingSpending abroad2015
2x
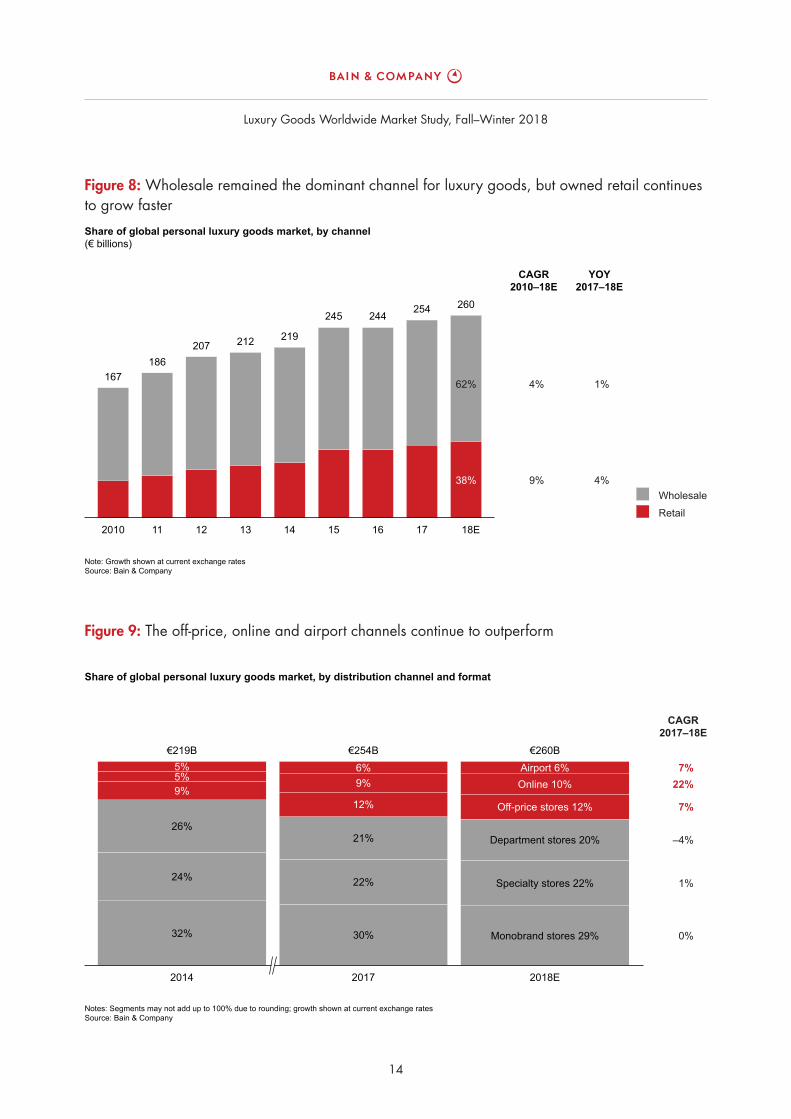
• Wholesale remained the largest channel for luxury goods, accounting for 62% of all sales. Yet the retail channel continued growing steadily—rising 4% in 2018—as companies increasingly seek to control the experience they deliver to customers. Of that gain, 1% came from new-store openings and the remaining 3% came from same-store sales growth. Wholesale grew only 1%, as specialty stores faced tough competition from the online channel. Depart-ment stores, meanwhile, saw a bifurcation between the struggling accessible segment and the recovering high-end segment.
• Off-price stores and airport stores continued to log strong growth, both gaining 7%.
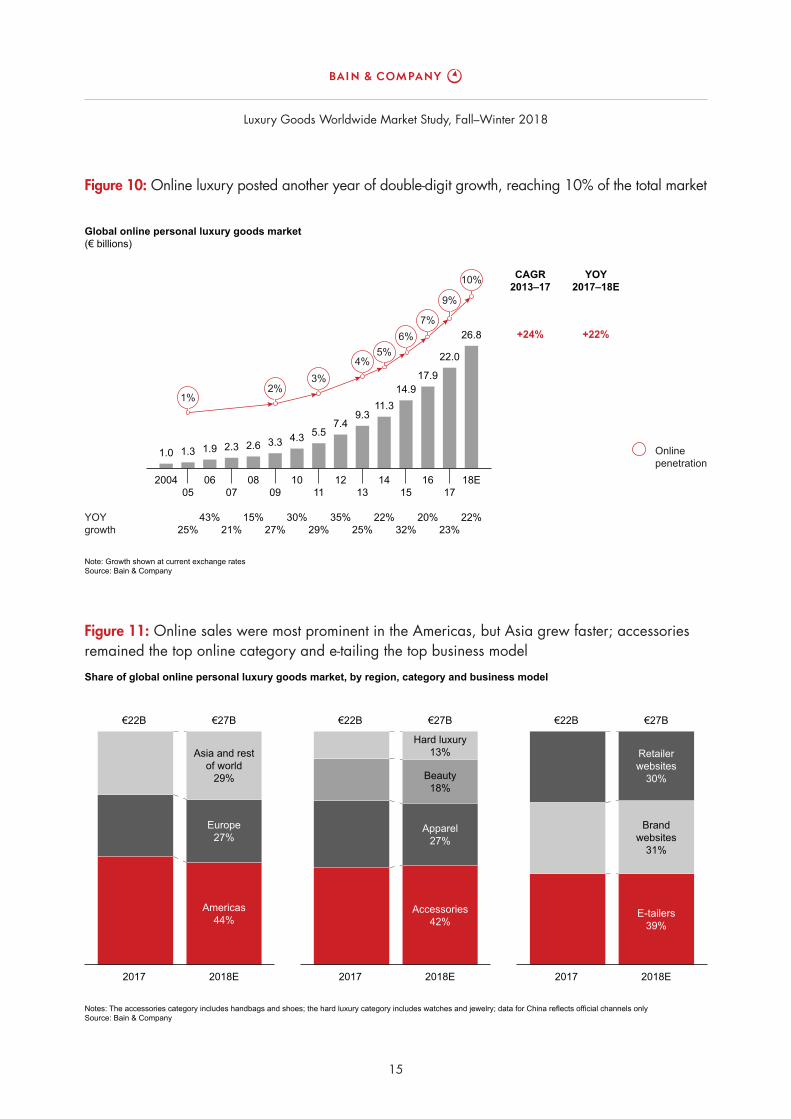
• Online remained the fastest-growing channel, increas-ing 22% and reaching 10% penetration of luxury sales globally. The Americas contributed 44% of global online luxury sales—which totaled €27 billion overall—but growth was particularly strong in Europe and Asia. Accessories remained the top category sold online, ahead of apparel, while beauty and hard luxury (jewelry and watches) were both on the rise. The biggest online channels for luxury sales were e-tailers (39%), brands’ own websites (31%) and retailers’ websites (30%).
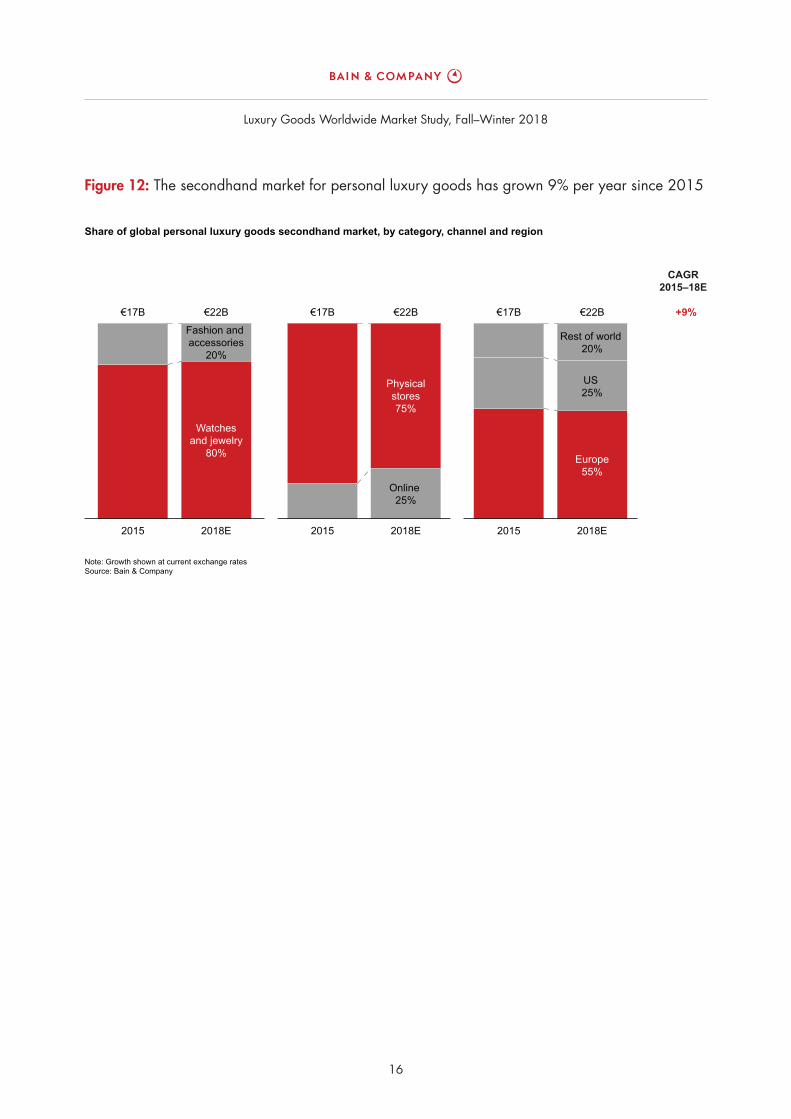
• The secondhand market for luxury goods rose to €22 billion in 2018, propelled by strong growth in Europe, which makes up more than half of this market, as well as by growth among highly specialized online platforms. Watches and jewelry are the primary cate-gories in the secondhand market, accounting for 80% of all purchases.
3.Distribution trends
Luxury Goods Worldwide Market Study, Fall–Winter 2018
14
Figure 9: The off-price, online and airport channels continue to outperform
Notes: Segments may not add up to 100% due to rounding; growth shown at current exchange ratesSource: Bain & Company
Share of global personal luxury goods market, by distribution channel and format
2014 2018E2017
€260BAirport 6%
Off-price stores 12%
Department stores 20%
Specialty stores 22%
Monobrand stores 29%
Online 10%7%
7%
–4%
1%
0%
22%
€219B
32%
24%
26%
9%
5%5%
€254B
30%
22%
12%
21%
9%6%
CAGR2017–18E
Figure 8: Wholesale remained the dominant channel for luxury goods, but owned retail continues to grow faster
Note: Growth shown at current exchange ratesSource: Bain & Company
Share of global personal luxury goods market, by channel(€ billions)
260
167
2010 11
186
12
207
13
212
14
219
15 16
244245
17
254
18E
9%
4%62%
38% 4%
1%
WholesaleRetail
YOY2017–18E
CAGR2010–18E
Luxury Goods Worldwide Market Study, Fall–Winter 2018
15
Figure 11: Online sales were most prominent in the Americas, but Asia grew faster; accessories remained the top online category and e-tailing the top business model
Notes: The accessories category includes handbags and shoes; the hard luxury category includes watches and jewelry; data for China reflects official channels onlySource: Bain & Company
Share of global online personal luxury goods market, by region, category and business model
€22B €27B €22B
2018E
Accessories42%
Apparel27%
Beauty18%
Hard luxury13%
€27B €22B €27B
2017 2018E
Americas44%
Europe27%
Asia and restof world
29%
2017 2017 2018E
E-tailers39%
Brandwebsites
31%
Retailerwebsites
30%
Figure 10: Online luxury posted another year of double-digit growth, reaching 10% of the total market
Note: Growth shown at current exchange ratesSource: Bain & Company
Global online personal luxury goods market(€ billions)
YOYgrowth
Onlinepenetration
YOY2017–18E
CAGR2013–17
+24% +22%
052004
0706
0908
1110
1312
15
14.9
1417
22.0
16
17.9
18E
26.8
25%
1.31.0
21%
2.31.9
43%27%
3.3
15%
2.6
29%
5.5
30%
4.3
25%
9.3
35%
7.4
32%22%
11.3
23%20% 22%
10%
9%
7%6%
5%4%
3%2%
1%
Luxury Goods Worldwide Market Study, Fall–Winter 2018
16
Figure 12: The secondhand market for personal luxury goods has grown 9% per year since 2015
Note: Growth shown at current exchange ratesSource: Bain & Company
Share of global personal luxury goods secondhand market, by category, channel and region
2015 2018E 2018E2015
€17B €22B €17B €22B €17B €22B
2015 2018E
Watchesand jewelry
80%
Online 25%
Europe55%
Fashion and accessories
20%
Physicalstores75%
Rest of world 20%
US 25%
+9%
CAGR2015–18E

Luxury Goods Worldwide Market Study, Fall–Winter 2018
17
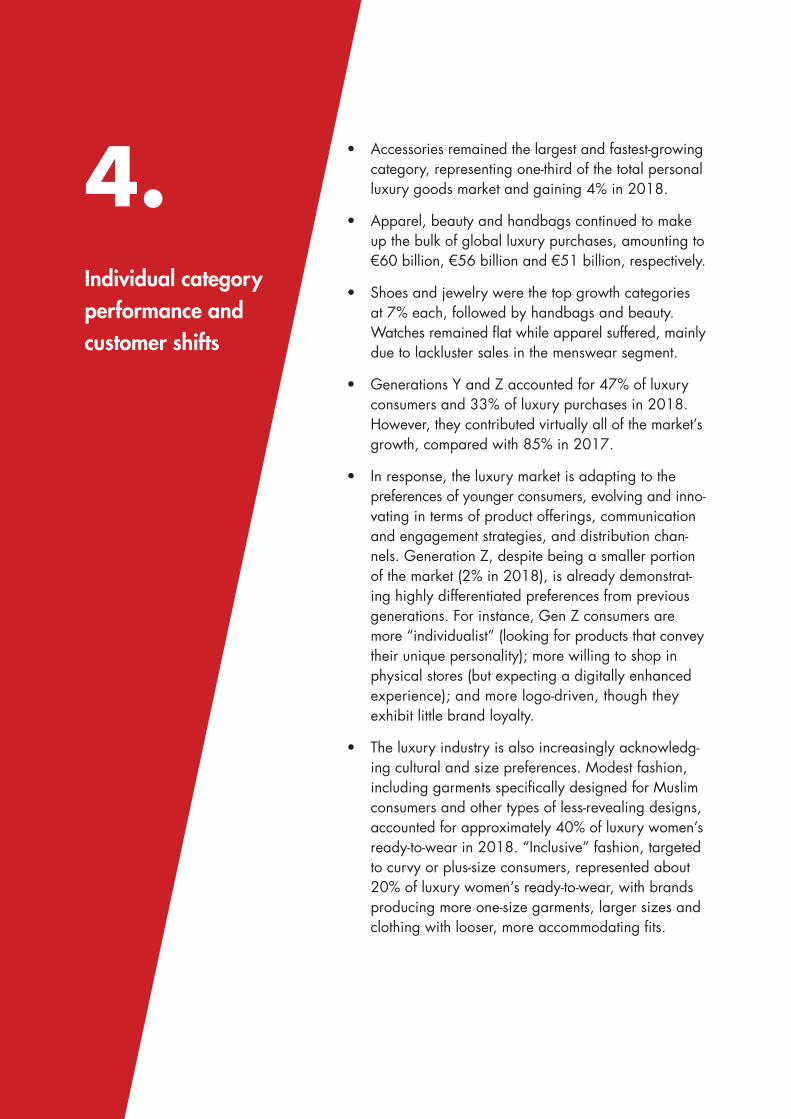
• Accessories remained the largest and fastest-growing category, representing one-third of the total personal luxury goods market and gaining 4% in 2018.
• Apparel, beauty and handbags continued to make up the bulk of global luxury purchases, amounting to €60 billion, €56 billion and €51 billion, respectively.
• Shoes and jewelry were the top growth categories at 7% each, followed by handbags and beauty. Watches remained fl at while apparel suffered, mainly due to lackluster sales in the menswear segment.
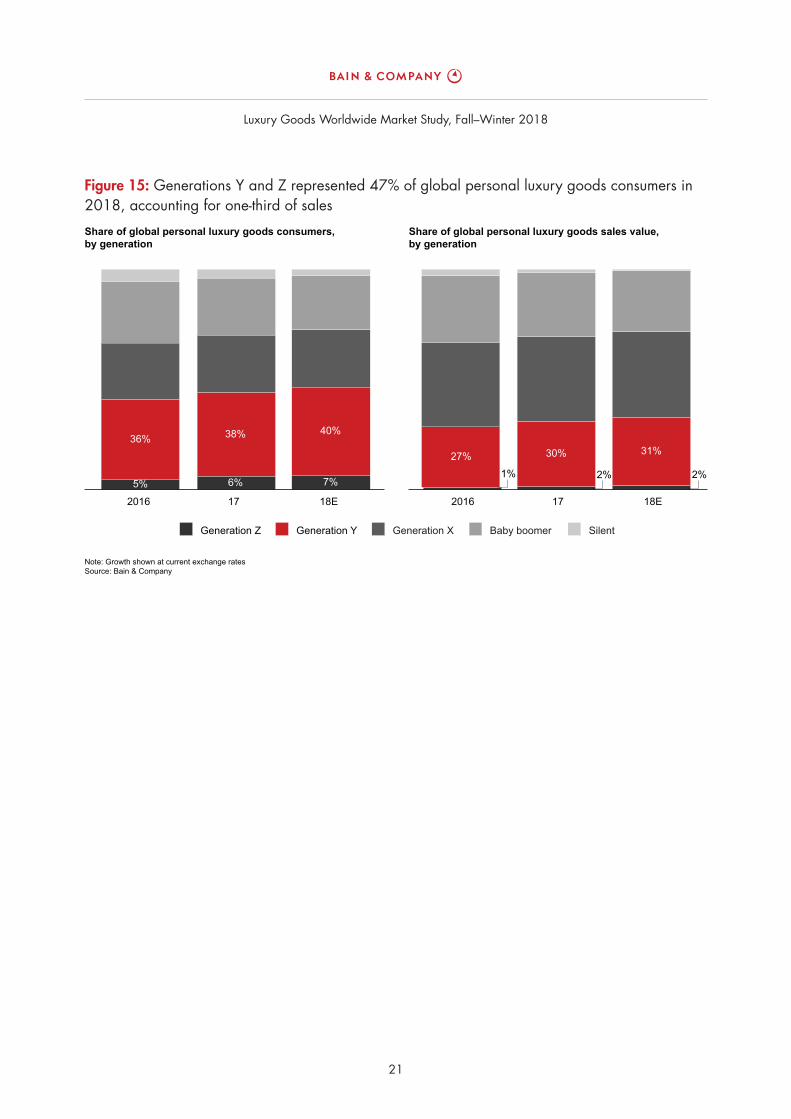
• Generations Y and Z accounted for 47% of luxury consumers and 33% of luxury purchases in 2018. However, they contributed virtually all of the market’s growth, compared with 85% in 2017.
• In response, the luxury market is adapting to the preferences of younger consumers, evolving and inno-vating in terms of product offerings, communication and engagement strategies, and distribution chan-nels. Generation Z, despite being a smaller portion of the market (2% in 2018), is already demonstrat-ing highly differentiated preferences from previous generations. For instance, Gen Z consumers are more “individualist” (looking for products that convey their unique personality); more willing to shop in physical stores (but expecting a digitally enhanced experience); and more logo-driven, though they exhibit little brand loyalty.
• The luxury industry is also increasingly acknowledg-ing cultural and size preferences. Modest fashion, including garments specifi cally designed for Muslim consumers and other types of less-revealing designs, accounted for approximately 40% of luxury women’s ready-to-wear in 2018. “Inclusive” fashion, targeted to curvy or plus-size consumers, represented about 20% of luxury women’s ready-to-wear, with brands producing more one-size garments, larger sizes and clothing with looser, more accommodating fi ts.
4.Individual category performance and customer shifts
Luxury Goods Worldwide Market Study, Fall–Winter 2018
20
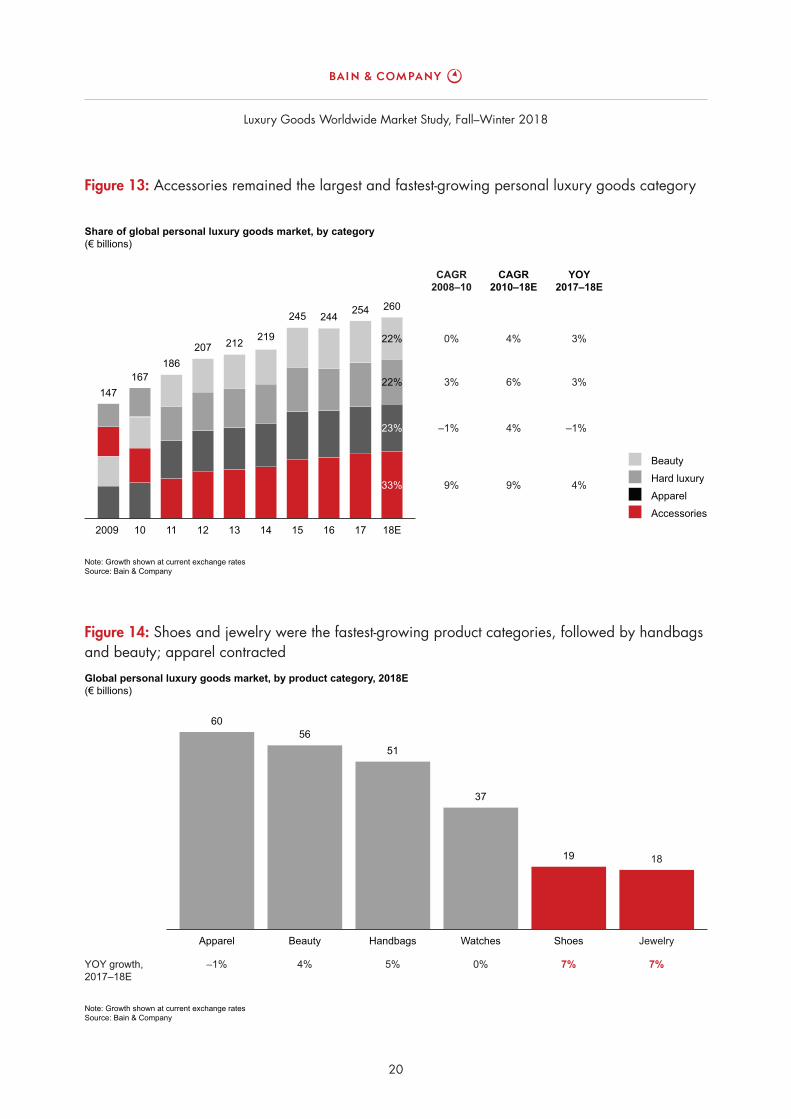
Figure 13: Accessories remained the largest and fastest-growing personal luxury goods category
Note: Growth shown at current exchange ratesSource: Bain & Company
Share of global personal luxury goods market, by category(€ billions)
260
0%
9%
–1%
3%
4%
9%
4%
6%
3%
4%
–1%
3%
AccessoriesApparelHard luxuryBeauty
147
2009
167
10 11
186
12
207
13
212
14
219
15 16
244245
17
254
18E
33%
23%
22%
22%
YOY2017–18E
CAGR2010–18E
CAGR2008–10
Figure 14: Shoes and jewelry were the fastest-growing product categories, followed by handbags and beauty; apparel contracted
Note: Growth shown at current exchange ratesSource: Bain & Company
Global personal luxury goods market, by product category, 2018E(€ billions)
Jewelry
18
60
Apparel Beauty Handbags Watches Shoes
5651
37
19
–1% 4% 5% 0% 7% 7%YOY growth,2017–18E
Luxury Goods Worldwide Market Study, Fall–Winter 2018
21
Figure 15: Generations Y and Z represented 47% of global personal luxury goods consumers in 2018, accounting for one-third of sales
Note: Growth shown at current exchange ratesSource: Bain & Company
Share of global personal luxury goods sales value,by generation
Share of global personal luxury goods consumers,by generation
18E172016
7%6%5%
40%38%36%
18E172016
Generation Y Generation X Baby boomer SilentGeneration Z
31%30%27%1% 2% 2%
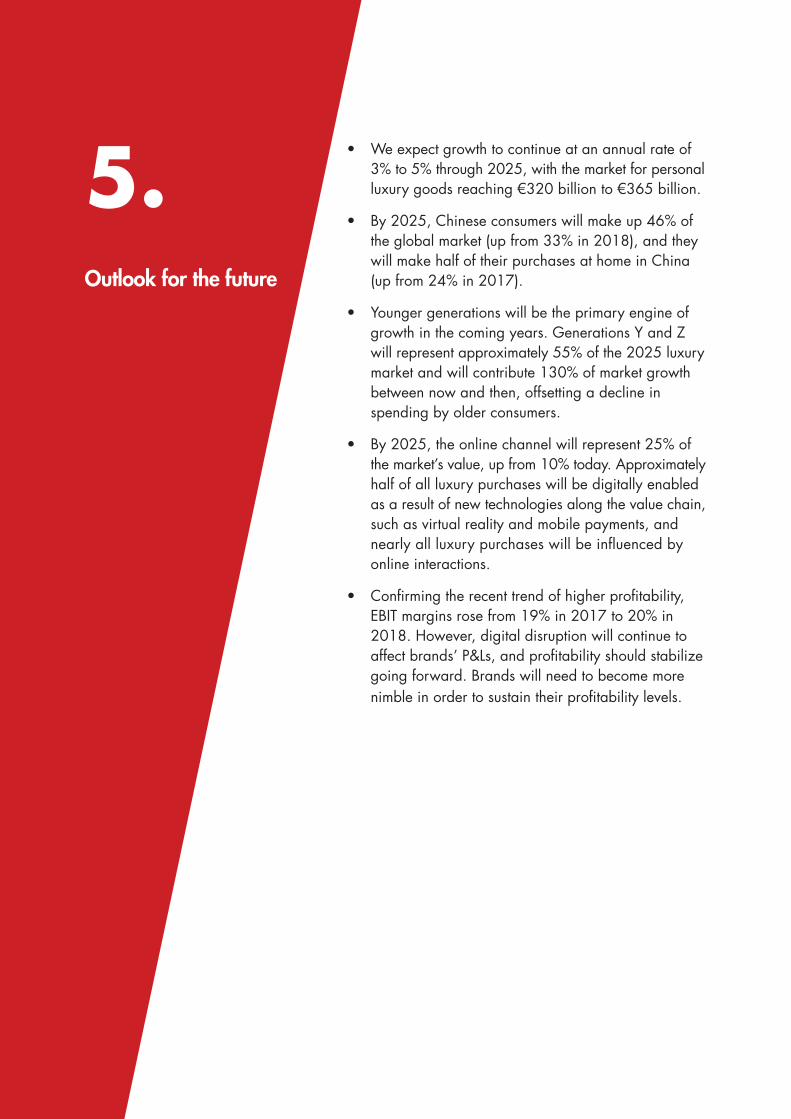
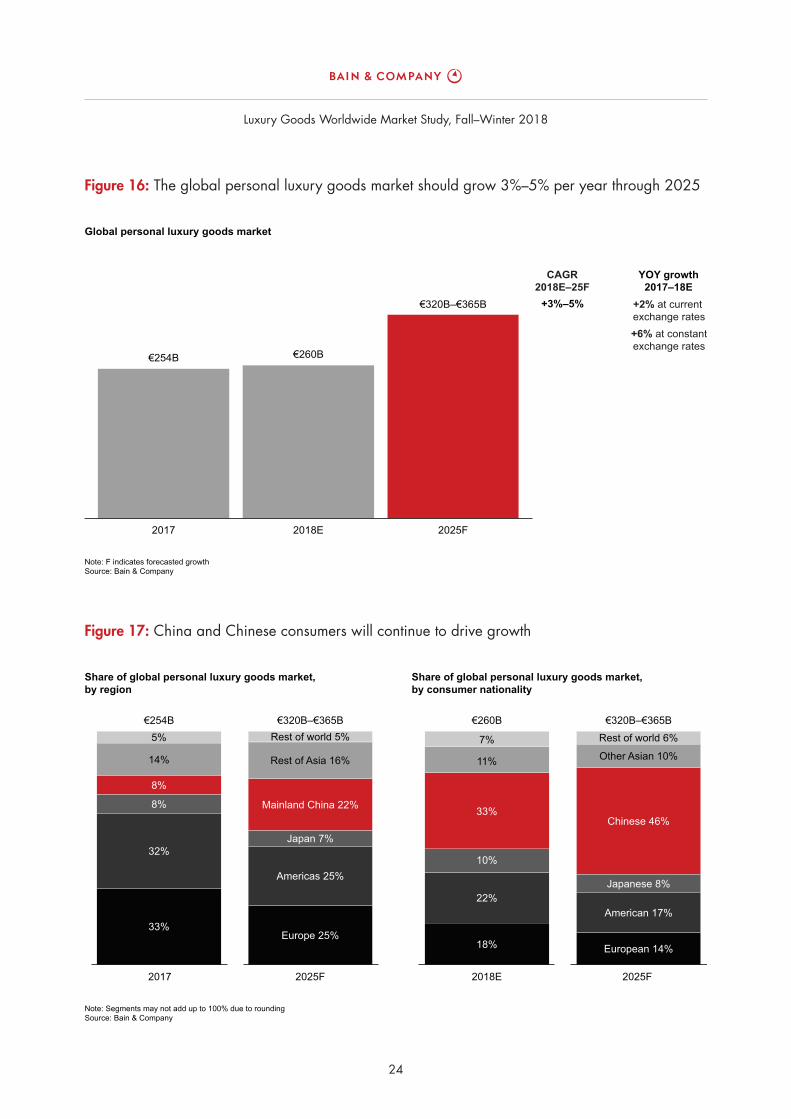
• We expect growth to continue at an annual rate of 3% to 5% through 2025, with the market for personal luxury goods reaching €320 billion to €365 billion.
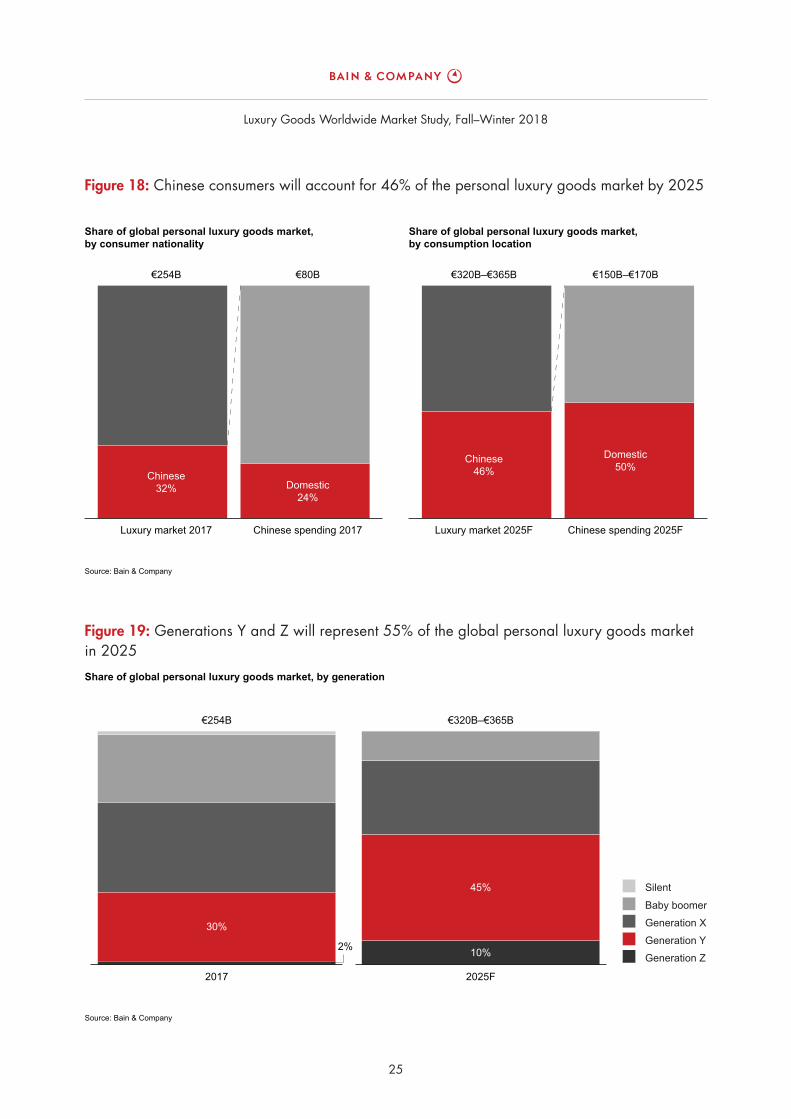
• By 2025, Chinese consumers will make up 46% of the global market (up from 33% in 2018), and they will make half of their purchases at home in China (up from 24% in 2017).
• Younger generations will be the primary engine of growth in the coming years. Generations Y and Z will represent approximately 55% of the 2025 luxury market and will contribute 130% of market growth between now and then, offsetting a decline in spending by older consumers.
• By 2025, the online channel will represent 25% of the market’s value, up from 10% today. Approximately half of all luxury purchases will be digitally enabled as a result of new technologies along the value chain, such as virtual reality and mobile payments, and nearly all luxury purchases will be infl uenced by online interactions.
• Confi rming the recent trend of higher profi tability, EBIT margins rose from 19% in 2017 to 20% in 2018. However, digital disruption will continue to affect brands’ P&Ls, and profi tability should stabilize going forward. Brands will need to become more nimble in order to sustain their profi tability levels.
5.Outlook for the future
Luxury Goods Worldwide Market Study, Fall–Winter 2018
24
Figure 17: China and Chinese consumers will continue to drive growth
Note: Segments may not add up to 100% due to roundingSource: Bain & Company
Share of global personal luxury goods market,by region
Share of global personal luxury goods market,by consumer nationality
2017
Europe 25%18%
22%
10%
33%
11%
7%
2025F 2025F2018E
€320B–€365B €260B €320B–€365B
Americas 25%
Japan 7%
Mainland China 22%
Rest of Asia 16%
Rest of world 5%
European 14%
American 17%
Japanese 8%
Chinese 46%
Other Asian 10%
Rest of world 6%
33%
32%
8%
8%
14%
5%€254B
Figure 16: The global personal luxury goods market should grow 3%–5% per year through 2025
Note: F indicates forecasted growthSource: Bain & Company
Global personal luxury goods market
2017 2018E 2025F
€254B €260B
€320B–€365B +2% at current exchange rates
YOY growth2017–18E
+3%–5%
+6% at constantexchange rates
CAGR2018E–25F
Luxury Goods Worldwide Market Study, Fall–Winter 2018
25
Figure 19: Generations Y and Z will represent 55% of the global personal luxury goods market in 2025
Source: Bain & Company
Share of global personal luxury goods market, by generation
€320B–€365B€254B
30%
45%
10% Generation ZGeneration YGeneration XBaby boomer
Silent
2%
2017 2025F
Figure 18: Chinese consumers will account for 46% of the personal luxury goods market by 2025
Source: Bain & Company
Share of global personal luxury goods market,by consumer nationality
Share of global personal luxury goods market,by consumption location
Luxury market 2017
Chinese32%
Chinese46%
Domestic24%
Domestic50%
Chinese spending 2017 Chinese spending 2025FLuxury market 2025F
€254B €80B €320B–€365B €150B–€170B
Luxury Goods Worldwide Market Study, Fall–Winter 2018
26
Figure 21: Profi tability is likely to stabilize around 20% in the coming years
Source: Bain & Company
EBIT margin evolution, selected personal luxury goods brands
2000
“Sortie dutemple”
Democratization Crisis Chinese shoppingfrenzy
Reboot Newnormal
16%
11%
18%16%
23%
18%19% 20% 20%
2002 2007 2009 2012 2016 2017 2018E 2025F
Figure 20: Online sales should reach 25% penetration by 2025
Note: Segments may not add up to 100% due to roundingSource: Bain & Company
Share of global personal luxury goods market, by distribution channel and format
2018E 2025F
€320B–€365B€260B
6%
12%
20%
22%
29%
10%
Online25%
Monobrand stores25%
Specialty stores17%
Department stores13%
Off-price stores13%
Airport 7%
Luxury Goods Worldwide Market Study, Fall–Winter 2018
27
Appendix
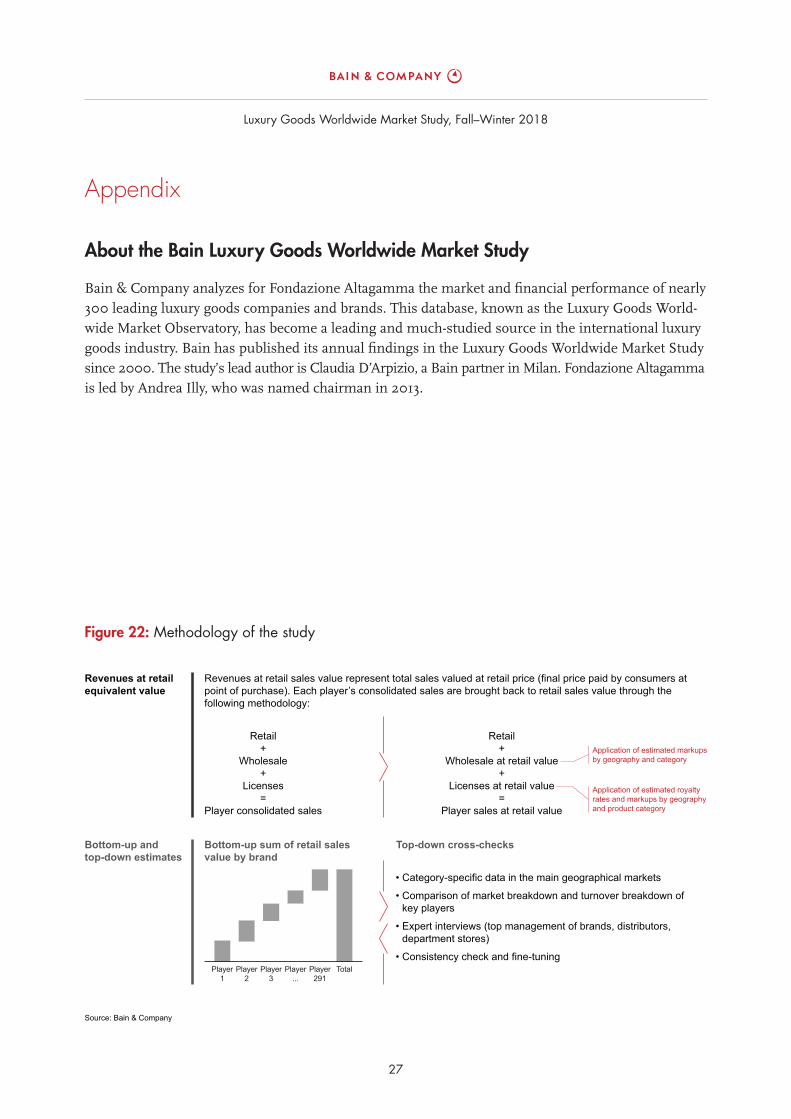
About the Bain Luxury Goods Worldwide Market Study
Bain & Company analyzes for Fondazione Altagamma the market and fi nancial performance of nearly
300 leading luxury goods companies and brands. This database, known as the Luxury Goods World-
wide Market Observatory, has become a leading and much-studied source in the international luxury
goods industry. Bain has published its annual fi ndings in the Luxury Goods Worldwide Market Study
since 2000. The study’s lead author is Claudia D’Arpizio, a Bain partner in Milan. Fondazione Altagamma
is led by Andrea Illy, who was named chairman in 2013.
Figure 22: Methodology of the study
Source: Bain & Company
Revenues at retailequivalent value
Bottom-up andtop-down estimates
Revenues at retail sales value represent total sales valued at retail price (final price paid by consumers atpoint of purchase). Each player’s consolidated sales are brought back to retail sales value through thefollowing methodology:
• Category-specific data in the main geographical markets
• Comparison of market breakdown and turnover breakdown ofkey players
• Expert interviews (top management of brands, distributors,department stores)
• Consistency check and fine-tuning
Bottom-up sum of retail salesvalue by brand
Top-down cross-checks
Retail+
Wholesale+
Licenses=
Player consolidated sales
Retail+
Wholesale at retail value+
Licenses at retail value=
Player sales at retail value
Application of estimated markupsby geography and category
Application of estimated royaltyrates and markups by geographyand product category
Player1
Player2
Player3
Player...
Player291
Total
Luxury Goods Worldwide Market Study, Fall–Winter 2018
28
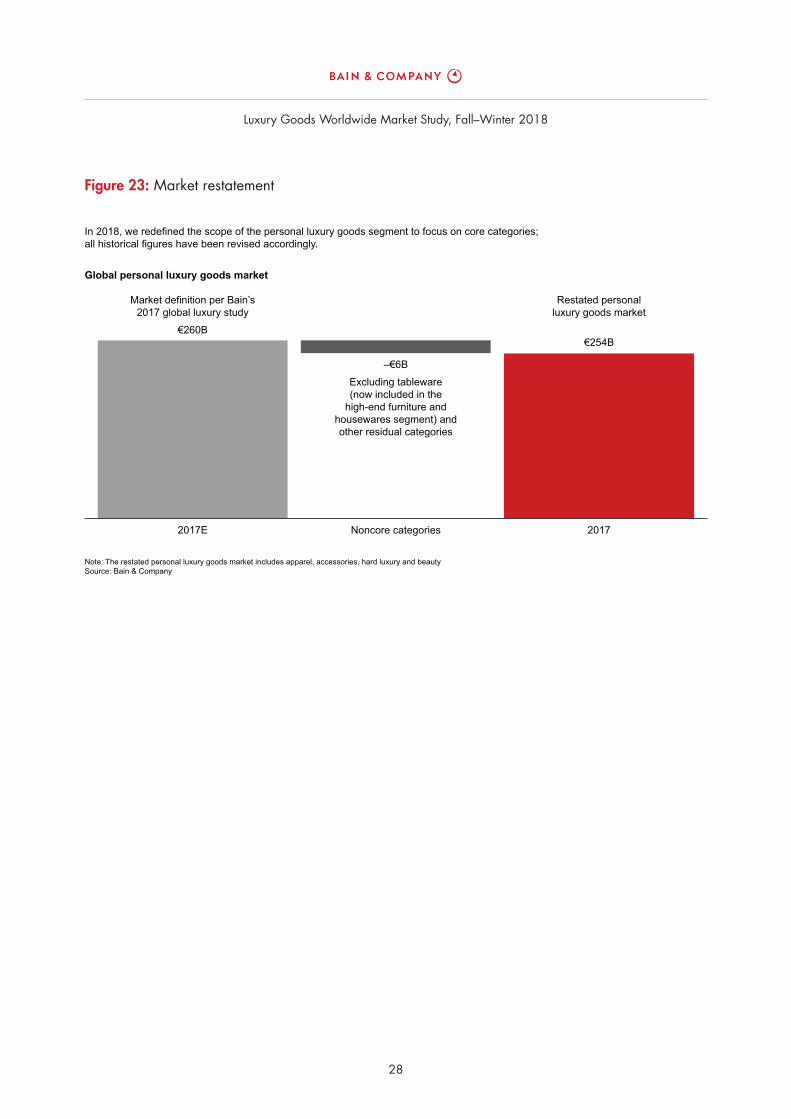
Figure 23: Market restatement
Note: The restated personal luxury goods market includes apparel, accessories, hard luxury and beautySource: Bain & Company
In 2018, we redefined the scope of the personal luxury goods segment to focus on core categories;all historical figures have been revised accordingly.
2017E 2017Noncore categories
Global personal luxury goods market
€254B€260B
Market definition per Bain’s2017 global luxury study
–€6BExcluding tableware(now included in the
high-end furniture andhousewares segment) andother residual categories
Restated personalluxury goods market

Luxury Goods Worldwide Market Study, Fall–Winter 2018
29
Luxury Goods Worldwide Market Study, Fall–Winter 2018
30
Shared Ambition, True Results
Bain & Company is the management consulting fi rm that the world’s business leaders come to when they want results.
Bain advises clients on strategy, operations, technology, organization, private equity and mergers and
acquisitions. We develop practical, customized insights that clients act on and transfer skills that make
change stick. Founded in 1973, Bain has 57 offi ces in 36 countries, and our deep expertise and client
roster cross every industry and economic sector. Our clients have outperformed the stock market 4 to 1.
What sets us apart
We believe a consulting fi rm should be more than an adviser. So we put ourselves in our clients’ shoes,
selling outcomes, not projects. We align our incentives with our clients’ by linking our fees to their results
and collaborate to unlock the full potential of their business. Our Results Delivery® process builds our
clients’ capabilities, and our True North values mean we do the right thing for our clients, people and
communities—always.

For more information, visit www.bain.com