Global Locations Annual Report 2015: Resurgence of Activity …€¦ · Coverage across all...
23
Locations Insider TM Annual Report: November 2015 – Preview Deck Global Locations Annual Report 2015: Resurgence of Activity Amidst Evolving Propositions Copyright © 2015, Everest Global, Inc. EGR-2015-2-PD-1619
Transcript of Global Locations Annual Report 2015: Resurgence of Activity …€¦ · Coverage across all...

Locations InsiderTM
Annual Report: November 2015 – Preview Deck
Global Locations Annual Report 2015: Resurgence
of Activity Amidst Evolving Propositions
Copyright © 2015, Everest Global, Inc.
EGR-2015-2-PD-1619

Copyright © 2015, Everest Global, Inc.
EGR-2015-2-PD-16192
Our research offerings for global services
1 Banking, financial services, and insurance
Custom research capabilities
Benchmarking | Pricing, delivery model, skill
portfolio
Peer analysis | Scope, sourcing models,
locations
Locations | Cost, skills, sustainability, portfolio
– plus a tracking tool
Tracking services | Service providers,
locations, risk
Other | Market intelligence, service provider
capabilities, technologies, contract assessment
Finance & Accounting
Procurement
Human Resources
Recruitment Process
PricePointTM
Global Sourcing
Locations InsiderTM
Contact Center
Market VistaTM
Global services tracking across functions, sourcing models, locations, and
service providers – industry tracking reports also available
Transaction Intelligence
Healthcare & Life Sciences
Application & Digital
Cloud & Infrastructure
BFSI1 Business Process
BFSI1 Information Technology
Subscription information
The full report is included in the following subscription(s)
– Locations InsiderTM
In addition to published research, a subscription may include analyst inquiry, data cuts,
and other services
If you want to learn whether your organization has a subscription agreement or
request information on pricing and subscription options, please contact us
Corporate Headquarters
Office: +1-214-451-3000
European Headquarters
Office: +44-207-129-1318

Copyright © 2015, Everest Global, Inc.
EGR-2015-2-PD-16193
Table of contents (page 1 of 2)
Introduction and overview 6
Summary of key messages 10
Section I: Global services market 17
Summary 18
Revenue and growth 19
Landscape of delivery locations 21
Section II: Locations activity 34
Summary 35
Update of activity in 2013 and H1 2014 36
Key trends in locations activity 42
Section III: MAP MatrixTM 52
Summary 53
Scope and framework 54
MAP MatrixTM by function 64
Topic Page no.

Copyright © 2015, Everest Global, Inc.
EGR-2015-2-PD-16194
Table of contents (page 2 of 2)
Section IV: Risk watch 79
Methodology 80
Risk dashboard 81
Key changes in risk profile 85
Appendix 93
Data tables – locations activity 94
Key definitions and inclusions 158
Glossary of terms 161
Locations Insider research calendar 162
Additional research references 164
Topic Page no.

Copyright © 2015, Everest Global, Inc.
EGR-2015-2-PD-16195
Our research methodology is based on four pillars of strength
to produce actionable and insightful research for the industry
Market thought leadership
Actionable and insightful research
Based on on-the-ground perspectives
Proprietary tracking and databases on operating costs, labor pool, market activity, and risks
Year-round tracking of 200+ locations around the world
Coverage across all offshore, nearshore, and onshore locations across regions (APAC, Europe, North America, LATAM, Africa)
Over 100 global projects on supporting clients on location decisions
Executive-level relationships with buyers, service providers, technology providers, and industry associations
Robust definitions and
frameworks
(talent pool scalability and
sustainability assessments,
cost arbitrage sustainability,
risk assessment frameworks)
Primary sources of
information
(Ongoing interactions with
buyers, GICs/captives/SSCs,
service providers, investment
promotion agencies,
recruiters, etc.)
Diverse set of market
touchpoints
(Ongoing interactions across
key stakeholders, input from
a mix of perspectives and
interests, supports both data
analysis and thought
leadership)
Fact-based research
(Data-driven analysis with
expert perspectives, year-
round tracking of location
and service provider activity,
and country briefings)
1 2 3 4

Copyright © 2015, Everest Global, Inc.
EGR-2015-2-PD-16196
Our ability to deliver insight on locations is based on
extensive databases and ongoing market research
Industry leading
databases (100+
service providers,
~2,000 GICs / Shared
service centers, and
200+ cities)
Cost database
Market activity database
GIC/SSC database

Copyright © 2015, Everest Global, Inc.
EGR-2015-2-PD-16197
The global services market is expected to witness a
marginally lower growth than in 2014 due to mixed investor
sentiment
Global services revenue and growth
2011-2015(E); US$ billion
Growth rates of regional/global GDP and global services market
2011-2015(E)1; Percentage2 (E)
1 Estimated figures for the year 2015
2 Data for constant year-on-year (Y-O-Y) prices, based on purchasing power parity
Note: Includes global services exports; excludes domestic market
Source: Country- / city-level investment promotion agencies, global services organizations (buyers, global in-house centers, service providers, Everest Group (2015)
3.90% 3.20%2.90%
3.60%3.50%
8-10% 8-10%7-9%
9-11%8-10%
1.80%
2.80%1.90%
2.80%3.60%
1.50%
-0.60% -0.40%
1.00% 1.20%
2011 2012 2013 2014 2015 1
Global services
market
Global GDP2
U.S.
Eurozone
2011 2012 2013 2014 2015 (Est.) 1
114-118123-129
134-140148-153
160-166

Copyright © 2015, Everest Global, Inc.
EGR-2015-2-PD-16198
Asia Pacific constitutes ~70% of the global services market
revenues; Nearshore Europe and Latin America & the Caribbean are
witnessing growth
1 Others include Middle East & Africa
Note: Includes global services exports; excludes domestic market
Source: Country- / city-level investment promotion agencies, global services organizations, Everest Group (2015)
Global services market | Share of delivery regions by revenue
2014; US$ billion
Asia Pacific
(APAC)
Europe
100% = 148-153
69%
10%
9%
9%2%
Canada
Latin America and
Caribbean (LAC)
India and the Philippines
together accounted for
almost 70% of the APAC
share; China is fast catching
up as a major player,
particularly in IT services
Key countries in this
category include Morocco,
Egypt, and South Africa
Poland and Ireland are the
top delivery locations,
followed by Hungary, Czech
Republic, and Portugal
Mexico, Argentina, and
Brazil constituted the top
three delivery locations in
Latin America
Others1

Copyright © 2015, Everest Global, Inc.
EGR-2015-2-PD-16199
India and Philippines continue to have the largest share of
headcount, both within Asia Pacific and globally
Global services market | Share of delivery regions by headcount2
2013-2014; Number of FTEs (in ‘000s)
1 Others include Canada, Africa and the Middle Eastern region
2 Includes global services exports for 31 leading locations. Excludes domestic market. Please refer Appendix for further details
Source: Country- / city-level investment promotion agencies, global services organizations, Everest Group (2015)
100% = 4,800-4,9004,300-4,400
80%73%
8%11%
6% 9%
6% 7%
2013 2014
APAC
Nearshore Europe
Others1
LAC
Copyright © 2015, Everest Global, Inc.
EGR-2015-2-PD-161910
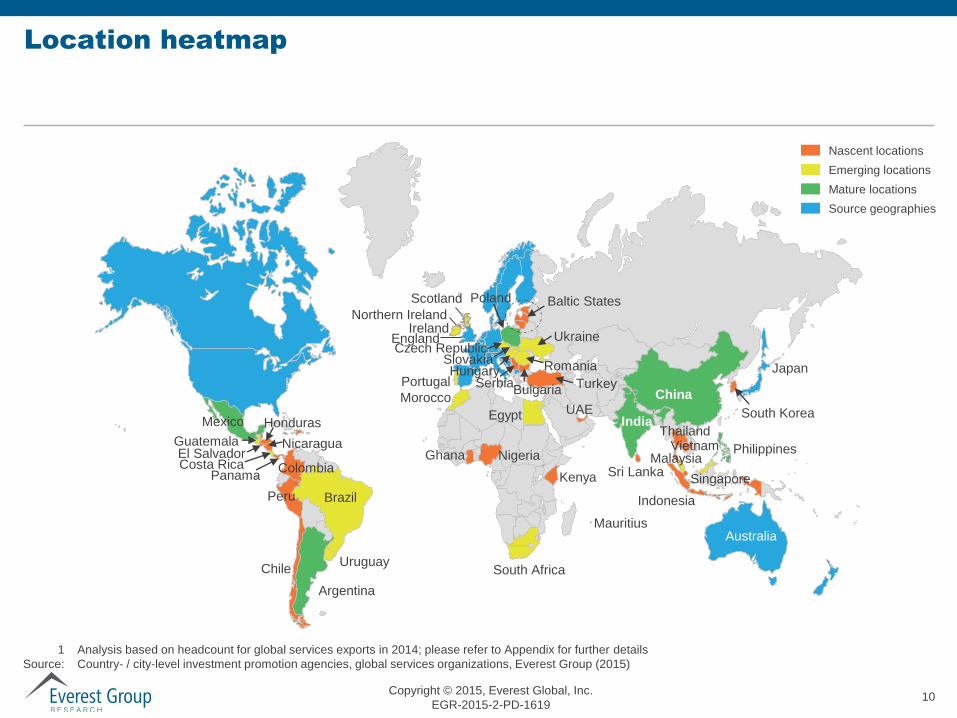
Location heatmap
1 Analysis based on headcount for global services exports in 2014; please refer to Appendix for further details
Source: Country- / city-level investment promotion agencies, global services organizations, Everest Group (2015)
Philippines
India
China
Malaysia
Singapore
South Africa
Brazil
Argentina
Chile
Mexico
Costa RicaPanama
El Salvador
Morocco
Egypt
Bulgaria
Romania
Poland
Czech Republic
Hungary
ThailandVietnam
Sri Lanka
Australia
Japan
South Korea
Baltic States
Ukraine
Serbia
Slovakia
Colombia
Peru
Guatemala
Honduras
Nicaragua
UAE
Kenya
Ghana Nigeria
Ireland
Emerging locations
Mature locations
Source geographies
Nascent locations
Northern Ireland
Scotland
England
Uruguay
Indonesia
Portugal
Mauritius
Turkey

Copyright © 2015, Everest Global, Inc.
EGR-2015-2-PD-161911
2011 2012 2013 2014 H1 2015
New center setup activity picked up significantly in 2014 after
the decline in 2013; it is expected that similar growth rates
will continue in 2015
New centers established
2011-H1 20151; Number
1 Includes data for Q1 2015 (January-March 2015) and Q2 2015 (April-June 2015)
Note: Includes global in-house centers and (third-party) service provider delivery centers
Source: Everest Group (2015)
137
155
108
145
931
1

Copyright © 2015, Everest Global, Inc.
EGR-2015-2-PD-161912
Asia Pacific has witnessed a consistent decline in its share since 2011;
Nearshore Europe has stepped up to being slightly lower than Asia Pacific,
with Latin America & the Caribbean witnessing a decline in H1 2015
1 Includes data for Q1 2015 (January-March 2015) and Q2 2015 (April-June 2015)
2 Includes activity recorded in the Middle East and Africa region
3 RoAPAC = Rest of APAC; RoNE = Rest of Nearshore Europe; RoLAC = Rest of LAC
Note: Includes global in-house centers and (third-party) service provider delivery centers
Source: Everest Group (2015)
20%
13%
13%13%
40%
58%
11%
8%
23%
22%
19%
9%9%
41%
54% 52% 53%48%
39%
18% 17%24%
21%33%
15% 23%16%
26% 16%
13%7% 7% 6%
12%
2011 2012 2013 2014 H1 2015
Breakup of new centers by region
2011-H1 20151; Number
137 155100% =
APAC
Nearshore Europe
LAC
Others2
India
Philippines
Singapore
RoAPAC3
Ireland
Romania
Poland
Mexico
Costa Rica
JamaicaChile
RoNE3
RoLAC3
108 145 93
Czech Republic

Copyright © 2015, Everest Global, Inc.
EGR-2015-2-PD-161913
Locations activity | Summary of key trends
Type of city (tier-1 and
tier-2/3 cities)
2 Increasing instances of players leveraging tier-2/3 locations, although this movement
continues to be muted in the Asia Pacific
The Middle East and African region leads the adoption of tier-2/3 cities for service
delivery, followed closely by LAC
GIC setups have increased significantly since 2012, and have overtaken service provider
setups in H1 2015
Service provider activity improved since 2013, and is expected to be at par with GIC
activity in 2015
GICs and service
providers
3
Share of top 20 service providers1 in the new center setups increased across APAC and
Middle East & Africa, whereas Nearshore Europe witnessed a significant declineType of provider
4
1 20 leading service providers across IT and BPS that Everest Group uses as “index” providers to gauge market trends
2 Includes U.S., UK, Western Europe, Nordics, Australia, New Zealand, and Japan
Source: Everest Group (2015)
Functions supported
1
Share of business process services has been consistent since 2013, while the share of IT
services has increased
Decline in share of R&D/engineering function
Increasing investments by top 20 service providers1 in onshore locations
Continental Europe witnessed a spurt in activity since 2013Onshore geographies2
5

Copyright © 2015, Everest Global, Inc.
EGR-2015-2-PD-161914
Share of United States in onshore center setups by the top-20
service providers increased since 2013, with European
locations taking the second place
1 20 leading service providers across IT and BPS that Everest Group uses as “index” providers to gauge market trends
2 Includes Australia, Japan, and New Zealand
3 Also includes Nordic and Scandinavian countries
4 Includes data for Q1 2015 (January-March 2015) and Q2 2015 (April-June 2015)
Source: Everest Group (2015)
5
United States
– Austin
– Houston
– Dallas
– Jackson
– Tampa
– Milford
Australia Japan
Liverpool Manchester
New onshore delivery centers of top 20 service providers1 by region
2012-H1 20153; Number of centers
60%
39% 43%
10% 6%
10%
49%
31%
30%
5%
20%
2012 2013 2014-H12015
Continental
Europe3
North
America
Others2
30 19100% = 25
UK
Germany
Netherlands
Belgium
Spain
France

Copyright © 2015, Everest Global, Inc.
EGR-2015-2-PD-161915
MAP Matrix™ | Definition and key components
Everest Group’s Maturity | Arbitrage | Potential (MAP) Matrix™ provides an objective, data-driven, and
comparative assessment of locations specific to a market segment (function and process).
The section presents analyses on 60+ locations (cities) for the following seven functions:
Information Technology – Application Development and Maintenance (IT-ADM)
Contact center (English language)
Transactional Business Process Services (BPS)
Complex / judgment-intensive BPS
Bilingual (Spanish and English language) BPS
Multi-lingual (European languages) BPS
Knowledge services

Copyright © 2015, Everest Global, Inc.
EGR-2015-2-PD-161916
MAP MatrixTM
| Summary
India
Leader and “Star Performer” in all the English
language / language-agnostic delivery functions
Recent decline in currency has increased cost
arbitrage with onshore locations
Increasing traction towards tier-2 Indian locations as
they offer a compelling value proposition – higher
cost savings and access to a large talent pool
No major change in the risk profile
Central America
Most of the locations are Major
Contenders for bilingual BPS
delivery
In most other categories, these
locations are Aspirants
Mexico City, Kingston, San Jose,
Guatemala, and Santo Domingo
are the “Star Performers” for
various functions
Some locations present high
operating and business risk
Latin America
Argentina and Costa Rica
are Leaders and “Star
Performers” for bilingual
BPS delivery
For other functions,
Kingston, Mexico City,
San Jose, Guatemala,
and Santo Domingo have
emerged as “Star
Performers”
Central Eastern Europe (CEE)
Poland is a Leader and “Star Performer”
for most of the functions
Dublin presents a distinct value proposition
– it is mostly leveraged for high-end
judgement intensive work
Other locations in Northern Ireland,
Romania, Hungary, and Czech Republic
have emerged as “Star Performers” for
multilingual BPS delivery
Philippines
Leader and “Star
Performer” for
functions related to
English language
voice delivery and IT-
ADM
Compelling value
proposition from cost-
talent standpoint;
continues to be the
most favorable
location after Indian
cities
Risks of disruption
from natural disasters
continue to exist;
hence, players are
adopting business
continuity measures
Source: Everest Group (2015)
Copyright © 2015, Everest Global, Inc.
EGR-2015-2-PD-161917
China tier-1(Shanghai)
Kuala Lumpur
Philippines tier-1(Metro Manila)
Singapore
Colombo
Ho Chi Minh City
Buenos Aires
Sao Paulo
Santiago
Bogota
San Jose
Guadalajara
Mexico City
San Juan
Montevideo Sofia
Tallinn Budapest
Dublin
Vilnius
Belfast
LisbonBucharest
Glasgow
Bratislava
Kiev City
Johannesburg
Port Louis
Cairo
Tel Aviv CasablancaPoland tier-2
(Lodz)
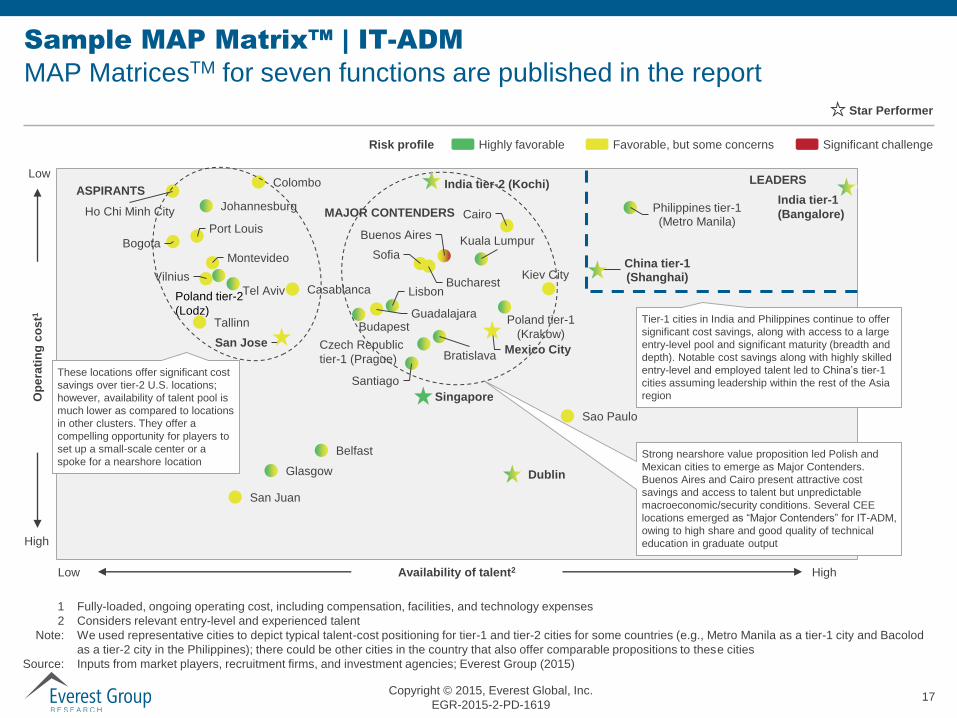
Sample MAP Matrix™ | IT-ADM
MAP MatricesTM for seven functions are published in the report
Low
High
Low
Op
era
tin
g c
os
t1
HighAvailability of talent2
LEADERSASPIRANTS
MAJOR CONTENDERS
1 Fully-loaded, ongoing operating cost, including compensation, facilities, and technology expenses
2 Considers relevant entry-level and experienced talent
Note: We used representative cities to depict typical talent-cost positioning for tier-1 and tier-2 cities for some countries (e.g., Metro Manila as a tier-1 city and Bacolod
as a tier-2 city in the Philippines); there could be other cities in the country that also offer comparable propositions to these cities
Source: Inputs from market players, recruitment firms, and investment agencies; Everest Group (2015)
Tier-1 cities in India and Philippines continue to offer
significant cost savings, along with access to a large
entry-level pool and significant maturity (breadth and
depth). Notable cost savings along with highly skilled
entry-level and employed talent led to China’s tier-1
cities assuming leadership within the rest of the Asia
region
Strong nearshore value proposition led Polish and
Mexican cities to emerge as Major Contenders.
Buenos Aires and Cairo present attractive cost
savings and access to talent but unpredictable
macroeconomic/security conditions. Several CEE
locations emerged as “Major Contenders” for IT-ADM,
owing to high share and good quality of technical
education in graduate output
These locations offer significant cost
savings over tier-2 U.S. locations;
however, availability of talent pool is
much lower as compared to locations
in other clusters. They offer a
compelling opportunity for players to
set up a small-scale center or a
spoke for a nearshore location
India tier-1
(Bangalore)
Poland tier-1
(Krakow)Czech Republic
tier-1 (Prague)
India tier-2 (Kochi)
Favorable, but some concerns Significant challengeHighly favorableRisk profile
Star Performer

Copyright © 2015, Everest Global, Inc.
EGR-2015-2-PD-161918
Changes in risk profiles across leading global services locations in 2014-Q3 2015
Summary of key messages | Risk watch
Favorable, but some concerns
Significant challenge
Highly favorable
Many Latin American currencies have depreciated sharply against the
U.S. dollar. Consequently, these locations have become more cost
competitive compared to other delivery locations
Having gone through a period of political uncertainty in 2011-2013,
Egypt’s political environment is stabilizing with a steady government at
the helm
The fall in crude oil prices globally has helped India in curbing inflation
to some extent
Risk ratings of key locations
Guatemala is witnessing a political crisis. There have been protests
against the government due to allegations of corruption
Tax legislation changes in Brazil are likely to reduce profitability of IT
service providers in the country
Increased political unrest after Petrobras scandal in Brazil
The geopolitical crisis in Ukraine have led to continued security
concerns; global services sector had adopted a cautious stance

Copyright © 2015, Everest Global, Inc.
EGR-2015-2-PD-161919
The report has 40 pages of data on locations activity – new
centers set up by GICs and service providers over 2013-H1
2014
Source: Everest Group (2015)
Copyright © 2015, Everest Global, Inc.
EGR-2015-2-PD-161920
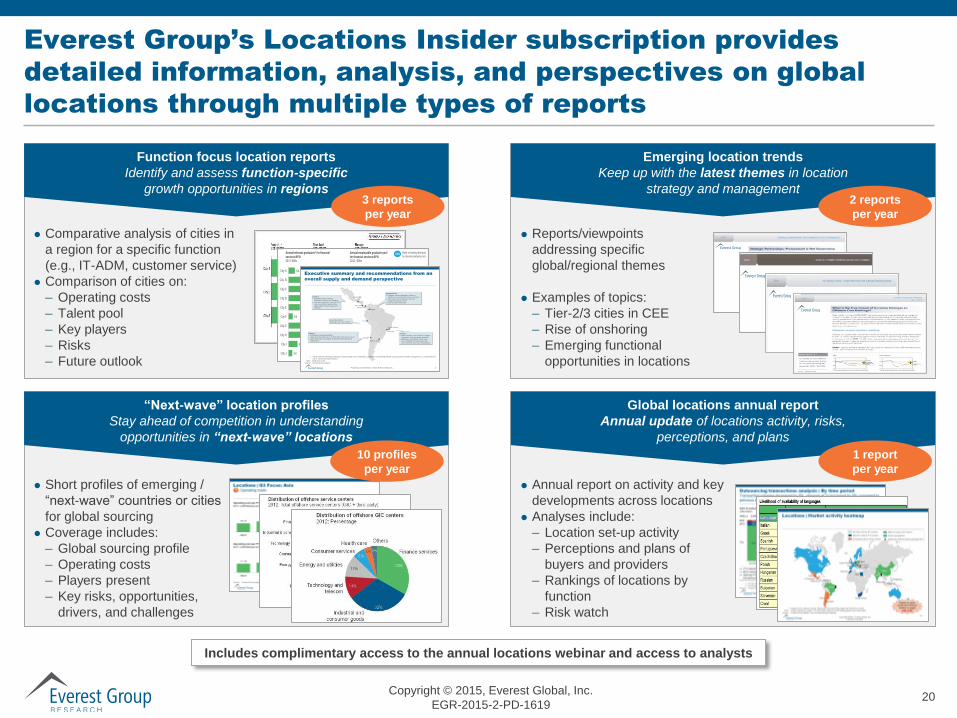
Everest Group’s Locations Insider subscription provides
detailed information, analysis, and perspectives on global
locations through multiple types of reports
Includes complimentary access to the annual locations webinar and access to analysts
“Next-wave” location profiles
Stay ahead of competition in understanding
opportunities in “next-wave” locations
Function focus location reports
Identify and assess function-specific
growth opportunities in regions
Emerging location trends
Keep up with the latest themes in location
strategy and management
Global locations annual report
Annual update of locations activity, risks,
perceptions, and plans
Short profiles of emerging /
“next-wave” countries or cities
for global sourcing
Coverage includes:
– Global sourcing profile
– Operating costs
– Players present
– Key risks, opportunities,
drivers, and challenges
Comparative analysis of cities in
a region for a specific function
(e.g., IT-ADM, customer service)
Comparison of cities on:
– Operating costs
– Talent pool
– Key players
– Risks
– Future outlook
Reports/viewpoints
addressing specific
global/regional themes
Examples of topics:
– Tier-2/3 cities in CEE
– Rise of onshoring
– Emerging functional
opportunities in locations
Annual report on activity and key
developments across locations
Analyses include:
– Location set-up activity
– Perceptions and plans of
buyers and providers
– Rankings of locations by
function
– Risk watch
XX
XX
XX
XX
XX
XX
XX
XX
XX
XX
City A
City B
City C
City D
City E
City F
City G
City H
City I
City J
Annual relevant graduates1 for financial
services BPO2012 ‘000s
Annual employable graduate pool
for financial services BPO2012; ‘000s
XX
XX
XX
XX
XX
XX
XX
XX
XX
XX
XX%
XX%
XX%
XX%
XX%
XX%
XX%
XX
XX
XX
XX
XX
XX%
XX%
XX%
Ratio of employable pool
to relevant graduate poolXX%
Proprietary & Confidential. © 2012, Everest Global, Inc. 3
Executive summary and recommendations from an
overall supply and demand perspective
Buenos Aires
San Jose
Bogota
Mexico City
Santiago
Lima
Panama City
1 These cities are relatively unattractive owing to high costs of operation, challenges in achieving desired scale, presence of better city options, or a combination of
one or more of the above factors
Note: Map not to scale
Source: Everest Group analysis
Sao Paulo
Rio de Janeiro
Cluster 3
Relatively nascent sourcing
destinations (except San Salvador)
Low cost of operations (up to 25-30%
lower than Buenos Aires) and low
wage inflation (except Rosario and
Cordoba)
Cluster 2
Labor pool likely to be sufficient to support
Accenture’s scale and growth objectives
Differences in risk drivers across cities
(e.g., competitive intensity risks in San
Jose, entry-level pool risks in Montevideo)
Cluster 1
Established sourcing destinations
High cost of operations (up to 45-50% higher than Buenos Aires)
Large talent pools; can support Accenture’s scale and growth
requirements
Guatemala City
Emerging sourcing destination; offers an
attractive risk-reward profile relative to Cluster 2
Offers lower cost of operations (20-25%
cheaper) than Buenos Aires
Some security-related risks
Do not offer distinct
advantages over other options
3 reports
per year
2 reports
per year
10 profiles
per year
1 report
per year

Copyright © 2015, Everest Global, Inc.
EGR-2015-2-PD-161921
Locations Insider research calendar
Topic Release date
Published Current
North America Domestic Outsourcing Services: Providers Embrace Onshoring – Is the World Still Flat? May 2015
Value Proposition of Tier-2/3 Cities for Global Services Delivery July 2015
"Next-wave" location profiles: Curitiba, Brazil September 2015
"Next-wave" location profiles: Brno, Czech Republic September 2015
"Next-wave" location profiles: Puerto Rico August 2015
"Next-wave" location profiles: Turkey Q4 2015
Global Locations Annual Report November 2015
"Next-wave" location profiles: Tunisia October 2015
"Next-wave" location profiles: Lodz, Poland July 2015
Next-wave Location Profile – Penang, Malaysia April 2015
Nearshore Europe Is IT! IT Services Riding The Nearshore Advantage April 2015
"Next-wave" location profiles: Lithuania July 2015
Ukraine Crisis: Is the Regional IT Service Delivery Landscape Changing? June 2015
Function focus report: Locations supporting business process services in Asian languages Q4 2015
Function focus report: Locations supporting IT services in Latin America and Caribbean Q1 2016
"Next-wave" location profiles: Nicaragua Q1 2016
Emerging Locations Trends report: SMAC delivery hotspots Q4 2015
"Next-wave" location profiles: El Salvador Q4 2015
Copyright © 2015, Everest Global, Inc.
EGR-2015-2-PD-161922
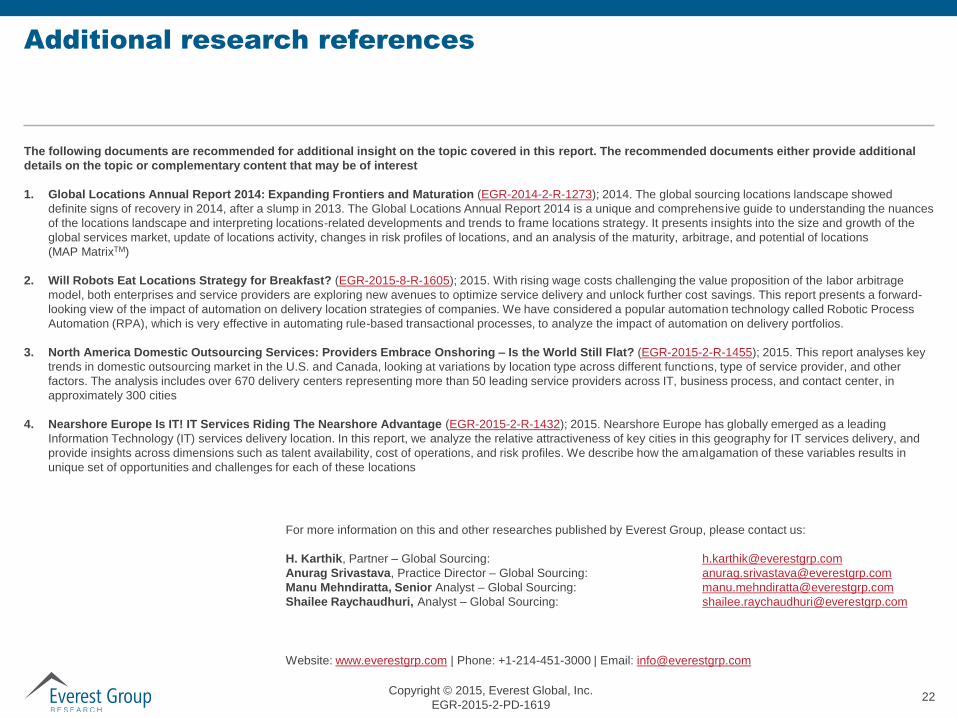
Additional research references
The following documents are recommended for additional insight on the topic covered in this report. The recommended documents either provide additional
details on the topic or complementary content that may be of interest
1. Global Locations Annual Report 2014: Expanding Frontiers and Maturation (EGR-2014-2-R-1273); 2014. The global sourcing locations landscape showed
definite signs of recovery in 2014, after a slump in 2013. The Global Locations Annual Report 2014 is a unique and comprehensive guide to understanding the nuances
of the locations landscape and interpreting locations-related developments and trends to frame locations strategy. It presents insights into the size and growth of the
global services market, update of locations activity, changes in risk profiles of locations, and an analysis of the maturity, arbitrage, and potential of locations
(MAP MatrixTM)
2. Will Robots Eat Locations Strategy for Breakfast? (EGR-2015-8-R-1605); 2015. With rising wage costs challenging the value proposition of the labor arbitrage
model, both enterprises and service providers are exploring new avenues to optimize service delivery and unlock further cost savings. This report presents a forward-
looking view of the impact of automation on delivery location strategies of companies. We have considered a popular automation technology called Robotic Process
Automation (RPA), which is very effective in automating rule-based transactional processes, to analyze the impact of automation on delivery portfolios.
3. North America Domestic Outsourcing Services: Providers Embrace Onshoring – Is the World Still Flat? (EGR-2015-2-R-1455); 2015. This report analyses key
trends in domestic outsourcing market in the U.S. and Canada, looking at variations by location type across different functions, type of service provider, and other
factors. The analysis includes over 670 delivery centers representing more than 50 leading service providers across IT, business process, and contact center, in
approximately 300 cities
4. Nearshore Europe Is IT! IT Services Riding The Nearshore Advantage (EGR-2015-2-R-1432); 2015. Nearshore Europe has globally emerged as a leading
Information Technology (IT) services delivery location. In this report, we analyze the relative attractiveness of key cities in this geography for IT services delivery, and
provide insights across dimensions such as talent availability, cost of operations, and risk profiles. We describe how the amalgamation of these variables results in
unique set of opportunities and challenges for each of these locations
Website: www.everestgrp.com | Phone: +1-214-451-3000 | Email: [email protected]
For more information on this and other researches published by Everest Group, please contact us:
H. Karthik, Partner – Global Sourcing:
Anurag Srivastava, Practice Director – Global Sourcing:
Manu Mehndiratta, Senior Analyst – Global Sourcing:
Shailee Raychaudhuri, Analyst – Global Sourcing:

Blog
www.sherpasinblueshirts.com
@EverestGroup
Stay connected
Websites
www.everestgrp.com
research.everestgrp.com
Dallas (Headquarters)
+1-214-451-3000
New York
+1-646-805-4000
Toronto
+1-647-557-3475
London
+44-207-129-1318
Delhi
+91-124-284-1000
About Everest Group
Everest Group is a consulting and research firm focused on strategic IT, business
services, and sourcing. We are trusted advisors to senior executives of leading
enterprises, providers, and investors. Our firm helps clients improve operational
and financial performance through a hands-on process that supports them in
making well-informed decisions that deliver high-impact results and achieve
sustained value. Our insight and guidance empowers clients to improve
organizational efficiency, effectiveness, agility, and responsiveness. What sets
Everest Group apart is the integration of deep sourcing knowledge, problem-
solving skills and original research. Details and in-depth content are available at
www.everestgrp.com and research.everestgrp.com.