Global Lesson Cover Page Life Cycle 3 · decompressor are needed to see this picture. Material %...
12
Global Lessons The University of Chicago Center for International Studies presents Global Lessons as part of its commitment to providing educational resources for K-12 educators. These materials offer thematic international & area studies content on topics including culture, economics, politics, history, and environmental issues. With Global Lessons, CIS aims to provide classroom materials that will not only help to expose students to global issues, but also to empower them to think critically about their role as global citizens. Understanding the Global Economy: Bringing the World Market into Your Classroom Life Cycle of a Cell Phone – Lesson 3 Valuable Metals and Materials The University of Chicago Center for International Studies
Transcript of Global Lesson Cover Page Life Cycle 3 · decompressor are needed to see this picture. Material %...

Global Lessons The University of Chicago Center for International Studies presents Global Lessons as part of its commitment to providing educational resources for K-12 educators. These materials offer thematic international & area studies content on topics including culture, economics, politics, history, and environmental issues. With Global Lessons, CIS aims to provide classroom materials that will not only help to expose students to global issues, but also to empower them to think critically about their role as global citizens.
Understanding the Global Economy: Bringing the World Market into Your Classroom
Life Cycle of a Cell Phone – Lesson 3 Valuable Metals and Materials
The University of Chicago Center for International Studies

The 2009 Summer Teacher Institute, “Understanding the Global Economy: Bringing the World Market into the Classroom,” was developed to provide educators with an interdisciplinary examination of how changes in the global economy are affecting countries around the world. Topics discussed ranged from the positive and negative effects of globalization on labor, social rights, agriculture and other natural resources, to how the effects of the current global financial crisis have been seen specifically in Japan, Brazil, Congo, India, China, the U.S., and the Gulf Region of the Middle East. International case studies were used to illustrate how trade has contributed to the interconnectedness of societies. The experts who spoke at the Institute come from diverse backgrounds, providing an in-depth and multifaceted review of the Global Economy. Lessons were created based on speakers’ presentations at the Institute, and can be appropriately incorporated into a wide array of subjects taught at K-12 grade levels. The Institute was cosponsored by the University of Chicago Center for International Studies (CIS) with the Center for East Asian Studies, the Center for Middle Eastern Studies, the Center for East European and Russian Eurasian Studies, the South Asia Language and Area Resource Center, and the Center for Latin American Studies. The following lessons were created by Keshia Korman, high school science teacher at Stone Scholastic Academy, and Jamie Bender, Outreach Coordinator for the Center for International Studies at the University of Chicago. For more information on the Center for International Studies outreach programs and to download classroom lessons developed from this Institute and resources from other events, visit: http://cis.uchicago.edu/outreach.

Center for International Studies -- Global Lessons, University of Chicago, 2009. http://cis.uchicago.edu/outreach
Life Cycle of a Cell Phone Lesson 3 Valuable Metals and Materials Subject: Science and Math
Grade Level: Middle School, High School (All lessons can be adapted for different age groups.)
Time Duration: 2-3 class periods
Illinois Learning Standards Addressed:
Math 10.A.1a Organize and display data using pictures, tallies, tables, charts or
bar graphs. 10.A.2a Organize and display data using pictures, tallies, tables, charts,
bar graphs, line graphs, line plots and stem-and-leaf graphs 10.A.3a Construct, read and interpret tables, graphs (including circle
graphs) and charts to organize and represent data. 10.A.4a Represent and organize data by creating lists, charts, tables,
frequency distributions, graphs, scatterplots and box-plots. Science
12.C.3a Explain interactions of energy with matter including changes of state and conservation of mass and energy.
Objectives:
Students will make a bar graph of the amount of materials a US citizen uses per year.
Students will identify the materials from which a cell phone is composed.
Students will make connections to the periodic table.
Students will learn that all metals are 100% recyclable.

Center for International Studies -- Global Lessons, University of Chicago, 2009. http://cis.uchicago.edu/outreach
Materials:
“Your Annual Mineral Consumption” Handout
USGS article, “Recycled Cell Phones – A Treasure Trove of Valuable Metals”. (Also found at http://pubs.usgs.gov/fs/2006/3097)
“Materials Needed Annually per U.S. Citizen” Handout “Cell Phone Materials and Metals” Handout
“Periodic Table” Handout.
Activities and Procedures:
1. Begin with asking students what their understanding is of how much of various materials each U.S. citizen uses per year. Distribute and discuss the “Your Annual Mineral Consumption” handout. Have students make a bar graph of the data. They can discuss where they think these materials originate and how they end up in materials we use on a regular basis.
2. Have your students read the USGS article, “Recycled Cell Phones – A Treasure Trove of Valuable Metals”. A good overview of the article can be found at http://pubs.usgs.gov/fs/2006/3097. This article can also be given to students to read for homework the night before. Discuss the main ideas of the article out loud, as a class.
3. Have students fill out the “Cell Phone Materials and Metals” handout by specifying which of the materials can be easily recycled. (Emphasize that all metals are recyclable.)
4. Students can discuss the percentage of metals in cell phone and research
their current market price. Have students calculate the amount of money they could make by recycling the metals that would make up the number of cell phones in the class, assuming every student would have a cell phone.
5. Have students use the metals list on the “Cell Phone Materials and
Metals” handout and highlight the metals on the Periodic Table handout. Highlighting the metals on the Periodic Table should help emphasize the importance of all metals in the lives of average people.

Center for International Studies -- Global Lessons, University of Chicago, 2009. http://cis.uchicago.edu/outreach
Assessments:
Completed “Your Annual Mineral Consumption” and “Cell Phone Materials and Metals” handouts.
Adaptations:
1. Student can research reports on how plastics are made and refined into materials. This site explains the life cycle of plastics. http://www.americanchemistry.com/s_plastics/doc.asp?CID=1571&DID=5972
2. Have students read the USGS article, “Do We Take Minerals for Granted?” http://minerals.usgs.gov/granted.html

Center for International Studies -- Global Lessons, University of Chicago, 2009. http://cis.uchicago.edu/outreach
Name ____________________________ Date ___________
Your Annual Mineral Consumption Over 48,000 pounds of minerals are required annually, per person, to maintain the current standard of living of most individuals in the U.S. Source: http://www.usgs.gov Make a bar graph of the following data:
•12,428 pounds of stone
• 9,632 pounds of sand and gravel
• 7,667 pounds of petroleum
• 6,886 pounds of natural gas
• 940 pounds of cement
• 639 pounds of nonmetals
• 425 pounds of iron ore
• 400 pounds of salt
• 307 pounds of phosphate rock
•276 pounds of clay
• 77 pounds of bauxite (aluminum)
• 29 pounds of other metals
• 17 pounds of copper
• 11 pounds of lead
• 10 pounds of zinc
• 6 pounds of manganese
• 1/3 pound of uranium
• 0.0285 ounces of gold (Hint: 16 oz = 1 pound)

Center for International Studies -- Global Lessons, University of Chicago, 2009. http://cis.uchicago.edu/outreach
Materials Needed Annually per U.S. Citizen
lbs
Center for International Studies -- Global Lessons, University of Chicago, 2009. http://cis.uchicago.edu/outreach
Name ________________________________ Date ___________
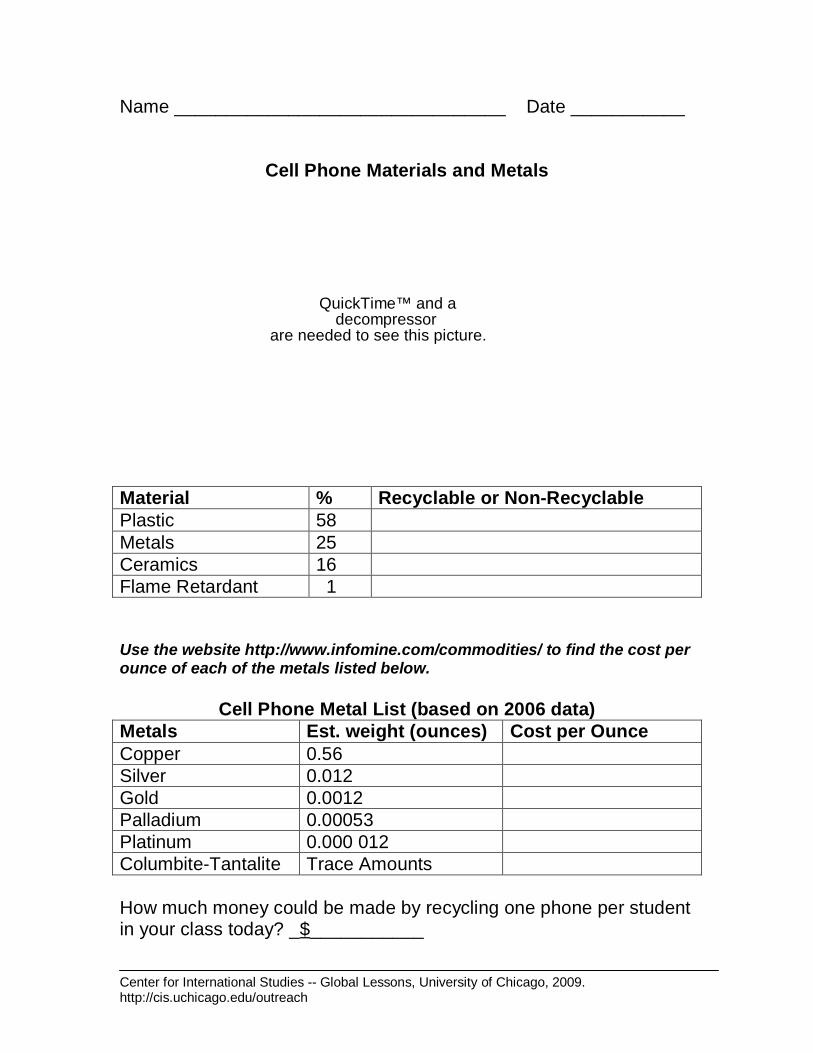
Cell Phone Materials and Metals
QuickTime™ and a decompressor
are needed to see this picture.
Material % Recyclable or Non-Recyclable Plastic 58 Metals 25 Ceramics 16 Flame Retardant 1 Use the website http://www.infomine.com/commodities/ to find the cost per ounce of each of the metals listed below.
Cell Phone Metal List (based on 2006 data) Metals Est. weight (ounces) Cost per Ounce Copper 0.56 Silver 0.012 Gold 0.0012 Palladium 0.00053 Platinum 0.000 012 Columbite-Tantalite Trace Amounts How much money could be made by recycling one phone per student in your class today? _$___________

U.S. Department of the InteriorU.S. Geological Survey
Fact Sheet 2006–3097July 2006
Recycled Cell Phones—A Treasure Trove of Valuable Metals
Printed on recycled paper
IntroductionThe U.S. Geological Survey (USGS) collects worldwide
data on almost all mineral commodities. Recycling, a significant factor in the supply of many of the metals used in our soci-ety, provides environmental benefits, such as energy savings, reduced volumes of waste, and reduced emissions associated with energy savings. In addition, recycling reduces the amount of virgin metals that must be mined to support our lifestyle. This USGS Fact Sheet examines the potential value of recycling the metals found in obsolete cell phones.
Cell phones seem ubiquitous in the United States and com-monplace throughout most of the world. There were approxi-mately 1 billion cell phones in use worldwide in 2002 (Fishbein, 2002). In the United States (fig. 1), the number of cell phone subscribers increased from 340,000 in 1985 to 180 million in 2004 (Most, 2003; Charny, 2005).
Worldwide, cell phone sales (fig. 2) have increased from slightly more than 100 million units per year in 1997 to an estimated 779 million units per year in 2005. As shown in figure 2, sales increased from 1997 through 2000 and then leveled off through 2002. In 2003, sales began to increase again. Cell phone sales are projected to exceed 1 billion units per year in 2009, with an estimated 2.6 billion cell phones in use by the end of that year (Gartner Inc., 2005). Sales are driven by new subscrib-ers signing up for services, by subscribers purchasing additional phones, and by subscribers replacing obsolete cell phones.
The U.S. Environmental Protection Agency estimated that, by 2005, as many as 130 million cell phones would be retired annually in the United States (U.S. Environmental Protection Agency, 2005). The nonprofit organization INFORM, Inc., anticipated that, by 2005, a total of 500 million obsolete cell phones would have accumulated in consumers’ desk drawers, store rooms, or other storage, awaiting disposal (Most, 2003). Typically, cell phones are used for only 1½ years before being replaced (Fishbein, 2002). These unused (or obsolete) cell phones usually are replaced because they do not have desired features, they are not compatible with a new provider, or they no longer function.
Less than 1 percent of the millions of cell phones retired and discarded annually are recycled (Most, 2003). Of this small percentage recovered, most are refurbished and put into use or used for replacement parts. If these options are not possible, core elements (such as copper) are recycled (Heine, 2002).
When discarded cell phones are not recycled, most eventu-ally end up in municipal solid waste facilities. Although there are cell phone collection and recycling programs, they have had little impact on this waste stream. According to INFORM, Inc. (Most, 2003), the lack of impact results from an inefficient recycling infrastructure, insufficient publicity for the programs, small-scale collection sites, and few or insufficient financial incentives. Figure 3 shows the cell phone life cycle, including the recycling option.
Mill
ions
of
subs
crib
ers
Year
1985 1995 20041990 2000
100
180
160
140
120
80
60
40
20
0
Figure 1. Growth in the number of U.S. cell phone subscribers from 1985 to 2004 (Most, 2003; Charny, 2005).

Metal Contents in Cell Phones
The Environmental Literacy Council (2004) reported that the weight of a typical cell phone in the early 1990s was 10.5 ounces (298 grams; for comparison, a paperclip weighs about 1 gram) and in 2000 was 7.7 ounces (218 grams). In 2005, a typical cell phone weighed about 4 ounces (113 grams) (Nokia, 2005), exclusive of batteries and battery charger; this weight was used as the basis for the analyses that follow.
Figure 4 (based on data modified from Mobile Takeback Forum, 2005) shows estimated materials content in the average cell phone in 2000 (the data do not include the material in bat-teries or chargers). Metals included in the estimate are primar-
ily copper, iron, nickel, silver, and zinc, with small amounts of aluminum, gold, lead, manganese, palladium, platinum, and tin.
More recent information from Falconbridge Limited was used to construct table 1. Falconbridge recycles cell phones for their metal content. The company estimated that, in 1 metric ton of obsolete cell phones (exclusive of batteries), the average copper content was 140 kilograms; silver, 3.14 kilograms; gold, 300 grams; palladium, 130 grams; and platinum, 3 grams (Rob Bouma, Falconbridge Ltd., written and oral communs., 2005).
In 2004, there were approximately 180 million cell phone subscribers in the United States (Charny, 2005). If each sub-scriber used only one phone and if an average active cell phone weighed 113 grams, then the minimum total weight of cell phones in use was about 20,000 metric tons. Table 1 shows that
Figure 2. Trends in cell phone sales worldwide from 1997 to 2005 (Gartner Inc., 2005).
Mill
ions
of
units
sol
d
Year
19981997 1999 20042000 2005200320022001
400
300
200
100
800
700
600
500
0
Table 1. Weight and gross value of selected metals in cell phones in the United States.
[The average weight (wt) of a cell phone is estimated to be 113 grams (g), exclusive of batteries and charger (Nokia, 2005). Metal contents are weights in metric tons (t), unless otherwise noted. Values in U.S. dollars are calculated by using the average of prices for 2002–2004 from USGS Mineral Commodity Summaries 2005 (Amey, 2005; Edelstein, 2005; Hilliard, 2005a,b). The gross values do not include costs of recycling. Data may not add to totals shown because of independent rounding]
Metal
Metal content and value estimated for a
typical cell phone
Metal content and value for 180 million cell phones
in use in 20042
Metal content and value for 130 million cell phones
retired in 20052
Metal content and value for 500 million obsolete cell
phones in storage in 20052
Wt1 (g) Value Wt3 (t) Value Wt3 (t) Value Wt3 (t) ValueCopper 16 $0.03 2,900 $6.2 million 2,100 $4.6 million 7,900 $17 millionSilver 0.35 $0.06 64.1 $11 million 46 $7.9 million 178 $31 millionGold 0.034 $0.40 6.2 $72 million 3.9 $52 million 17 $199 million
Palladiun 0.015 $0.13 2.7 $22.7 million 2.0 $16 million 7.4 $63 million
Platinum 0.00034 $0.01 0.06 $1.4 million 0.04 $1 million 0.18 $3.9 million
Total 2,973 $113 million 2,152 $82 million 8,102 $314 million1Metal content (wt) calculated from weight of a typical cell phone (Nokia, 2005) and data from Rob Bouma, Falconbridge Ltd., written and oral communs., 2005.
2Number of cell phones in use in 2004 from Charny, 2005. Number of cell phones retired in 2005 from U.S. Environmental Protection Agency, 2005. Number of obsolete cell phones projected to be in storage in 2005 from Most, 2003.
3Metal content (wt) calculated from data from Rob Bouma, Falconbridge Ltd., written and oral communs., 2005.

tons of copper recovered from obsolete scrap in the United States in 2004 (Edelstein, 2005). The average price of copper for 3 years, 2002 through 2004, was about $0.98 per pound (about 454 grams) (Edelstein, 2005). At this price, a cell phone contains about 3.5 cents worth of copper. The total value of the copper in cell phones retired annually, without accounting for the recovery costs, is approximately $4.6 million; the value for obsolete cell phones in storage is $17 million.
Silver.—If the 46 metric tons of silver in cell phones retired annually and the 178 metric tons of silver in cell phones in stor-age were recycled, then the silver recovered from cell phones would amount to almost 3 percent and 10 percent, respectively, of the 1,700 metric tons of silver recovered from scrap from U.S. recycling activity in 2004 (Hilliard, 2005a). The price of silver averaged from 2002 through 2004 was $5.33 per troy ounce (about 31.1 grams) (Hilliard, 2005a). At this price, a cell phone contains about 6 cents worth of silver. The total value of silver in cell phones retired annually, without accounting for the recovery costs, is $7.9 million; the value for obsolete cell phones in storage is $31 million.
Gold.—If the 3.9 metric tons of gold in cell phones retired annually and the 17 metric tons of gold in cell phones in storage were recycled, then the gold recovered from cell phones would amount to 4 percent and 18 percent, respectively, of the 95 metric tons of refined gold recovered from recycled materials in the United States in 2004 (Amey, 2005). The price of gold aver-aged from 2002 through 2004 was $362 per troy ounce (Amey, 2005). At this price, a cell phone contains slightly more than 40 cents worth of gold. The total value of the gold in cell phones retired annually, without accounting for the recovery costs, is $52 million; the value for obsolete cell phones in storage is $199 million.
there were about 2,900 metric tons of copper, 64 metric tons of silver, 6 metric tons of gold, almost 3 metric tons of palladium, and 0.06 metric ton of platinum in these phones.
About 130 million cell phones are retired annually in the United States (U.S. Environmental Protection Agency, 2005). Col-lectively, these cell phones weigh about 14,000 metric tons. Table 1 shows that annually retired cell phones contain almost 2,100 metric tons of copper, 46 metric tons of silver, 3.9 metric tons of gold, 2 metric tons of palladium, and 0.04 metric ton of platinum.
The number of obsolete cell phones stored in drawers and closets by 2005 was forecast to be 500 million (Most, 2003). For these analyses, it was assumed that the average obsolete cell phone also weighs 113 grams. At this weight, 500 million obsolete cell phones would have a collective weight of more than 56,000 metric tons. As shown in table 1, these cell phones would contain approximately 7,900 metric tons of copper, 178 metric tons of silver, 17 metric tons of gold, 7.4 metric tons of palladium, and 0.18 metric ton of platinum.
The Value of Metals in Cell PhonesCell phones are small, and so the quantity of metals
contained in each cell phone is also small. When many phones become obsolete, however, the quantity and value of the metals contained in those phones become significant.
Copper.—If the 2,100 metric tons of copper in cell phones retired annually and the 7,900 metric tons in cell phones in storage were recycled in the United States, then the copper recovered from cell phones would amount to 1 percent and 3.5 percent, respectively, of the 225,000 metric
Figure 3. Cell phone life cycle.
ManufacturingIn use Obsolete
In storageDiscarded
Refurbishing
Materialsrecovery
Otheruses
Disposal
Recycling

Palladium.—The average price of palladium for the period 2002 through 2004 was $265 per troy ounce (Hilliard, 2005b). At this average price, a cell phone contains almost 13 cents worth of palladium. The total value of palladium in cell phones retired annually, without accounting for the recovery costs, is $16 million; the value for obsolete cell phones in storage is $63 million.
Platinum.—The average price of platinum for the period 2002 through 2004 was $696 per troy ounce (Hilliard, 2005b). At this average price, a cell phone contains less than 1 cent worth of platinum. The total value of platinum in cell phones retired annually, without accounting for the recovery costs, is nearly $1 million; the value for obsolete cell phones in storage is $3.9 million.
These values illustrate that, when large numbers of cell phones become obsolete, large quantities of valuable metals end up either in storage or in landfills. The amount of metals poten-tially recoverable would make a significant addition to total metals recovered from recycling in the United States and would supplement virgin metals derived from mining.
SummaryRecovery and recycling of cell phones are in the early
stages of development, as is the case for recycling of electron-ics in general. For cell phone recycling to grow, recycling must become economically viable. Efficient recovery infrastructure, product designs that simplify dismantling, and other changes are needed to facilitate the growth of cell phone recycling.
References Cited
Amey, E.B., 2005, Gold: U.S. Geological Survey Mineral Com-modity Summaries 2005, p. 72–73. (Also available online at http://minerals.usgs.gov/minerals/pubs/mcs/2005/mcs2005.pdf.)
Charny, Ben, 2005, U.S. cell tally—180 million users and counting: CNET.com Web site at http://news.com.com/ U.S.+cell+tally+180+million+users+and+counting/ 2110-1039_3-5615778.html. (Accessed March 28, 2005.)
Edelstein, D.L., 2005, Copper: U.S. Geological Survey Min-eral Commodity Summaries 2005, p. 54–55. (Also available online at http://minerals.usgs.gov/minerals/pubs/mcs/2005/mcs2005.pdf.)
Environmental Literacy Council, 2004, Life cycle of a cell phone: Environmental Literacy Council Web site at http://www.enviroliteracy.org/article.php/1119.php. (Accessed January 21, 2005.)
Fishbein, B.K., 2002, Waste in the wireless world—The chal-lenge of cell phones: New York, N.Y., INFORM, Inc., 81 p.
Gartner Inc., 2005, Gartner says mobile phone sales will exceed one billion in 2009: Gartner Inc. Web site at http://www.gartner.com/press_releases/asset_132473_11.html. (Accessed August 29, 2005.)
Heine, Seth, 2002, Interview with Seth Heine: CollectiveGood, Inc., Web site at http://www.collectivegood.com/about.asp. (Accessed April 7, 2005.)
Hilliard, H.E., 2005a, Silver: U.S. Geological Survey Mineral Commodity Summaries 2005, p. 150–151. (Also available online at http://minerals.usgs.gov/minerals/pubs/mcs/2005/mcs2005.pdf.)
Hilliard, H.E., 2005b, Platinum-group metals: U.S. Geological Survey Mineral Commodity Summaries 2005, p. 124–125. (Also available online at http://minerals.usgs.gov/minerals/pubs/mcs/2005/mcs2005.pdf.)
Mobile Takeback Forum, 2005, FAQ: What is a mobile phone made from?: Mobile Takeback Forum Web site at http://www.mobiletakeback.co.uk/. (Accessed January 21, 2005.)
Most, Eric, 2003, Calling all cell phones—Collection, reuse, and recycling programs in the U.S.: New York, N.Y., INFORM, Inc., 48 p.
Nokia, 2005, Nokia 3595 phone features: Nokia Web site at http://www.nokiausa.com/phones/3595/0,2803,feat:1,00.html. (Accessed February 16, 2005.)
U.S. Environmental Protection Agency, 2005, eCycling: U.S. Environmental Protection Agency Web site at http://www.epa.gov/epaoswer/hazwaste/recycle/ecycling/faq.htm. (Accessed January 10, 2006.)
By Daniel E. Sullivan
For more information, please contactDaniel E. SullivanU.S. Geological SurveyBox 25046Denver Federal Center, Mail Stop 750Denver, CO 80225–0046Telephone: 303–236–8747 x267E-mail: [email protected]
Figure 4. Components (in weight percent) in a typical cell phone in 2000 (data modified from Mobile Takeback Forum, 2005).
Plastics58% Metals
25%
Ceramics16%
Flameretardant
1%

![WELCOME []€¦ · TIFF (LZW) decompressor are needed to see this picture. QuickTime™ and a TIFF (LZW) decompressor ... – Using virgin fibre destroys carbon sinks](https://static.fdocuments.us/doc/165x107/5ac3e7327f8b9a57528ca583/welcome-tiff-lzw-decompressor-are-needed-to-see-this-picture-quicktime.jpg)