Global Growth: Rocky Mountain High€¦ · Douglas Porter, CFA, Chief Economist, BMO Financial...
14
Douglas Porter, CFA, Chief Economist, BMO Financial Group April 27, 2018 BMO Capital Markets Economics economics.bmocapitalmarkets.com 1-800-613-0205 Please refer to page 14 for important disclosures Global Growth: Rocky Mountain High BoC’s Poloz in No Rush to Hike Rates U.S. GDP Better than Expected U.K. GDP Slowest in 5 Years Cautious ECB on Hold BoJ Drops Inflation Target Timeline NAFTA Talks Continue Feature Article Page 6
Transcript of Global Growth: Rocky Mountain High€¦ · Douglas Porter, CFA, Chief Economist, BMO Financial...

Douglas Porter, CFA, Chief Economist, BMO Financial Group
April 27, 2018
BMO Capital Markets Economics economics.bmocapitalmarkets.com 1-800-613-0205
Please refer to page 14 for important disclosures
Global Growth: Rocky Mountain High
BoC’s Poloz in No Rush to Hike Rates
U.S. GDP Better than Expected
U.K. GDP Slowest in 5 Years
Cautious ECB on Hold
BoJ Drops Inflation Target Timeline
NAFTA Talks Continue
Feature ArticlePage 6

Page 2 of 14 Focus — April 27, 2018
Our Thoughts
U.S. Economy Starts 2018 with Latent Steam
.S. real GDP expanded at a 2.3% annual rate in Q1, which was in line with our forecast and slightly above the consensus call (2.0%). Despite being below the
3.0% average pace of the past three periods, this was a strong result, best demonstrated by final domestic demand (FDD, which strips out inventories and net exports). It grew 1.6% in Q1 (as inventories and net exports contributed 20 bps and 43 bps, respectively, to GDP growth), suffering a fully-anticipated payback after Q4’s super-strong, post-hurricanes-boosted 4.5% rate. Averaging the past two quarters (which removes the boom-bust pattern), FDD grew a sturdy 3.1%. This means the softer tone in FDD, and thus GDP more broadly, was purely a technical payback.
Note that there may also have been some “residual seasonality” at play as per the norm for Q1s, in which growth appears weaker than it really is due to inadequate seasonal adjustment. However, this might be less of an issue this year than in the past (e.g., last year, seasonally adjusting a second time resulted in a 0.8-ppt upgrade to Q1 growth). A key culprit for this phenomenon is national defence outlays, but this year they actually registered positive Q1 growth for the first time in a decade. Perhaps the statisticians at the BEA have gotten a grip on the issue. Of course, that also means a much smaller (or no) bump for Q2 and other quarters.
Three key factors also bestowed a “strong” moniker on economic performance in Q1. First, nonresidential fixed investment increased 6.1% annualized, keeping to the 5%-to-7% range for a fifth consecutive quarter. A big part of this trend reflects rising (and now record) oil production. But, importantly, it also reflects capital spending across all sectors incented by late-cycle capacity constraints and, starting this quarter, tax cuts. Exports expanded 4.8%, also up a fifth consecutive quarter. Prodding this trend, global economic growth has been strengthening (we estimate 4.0% y/y in 2017 Q4 vs. 3.3% a year ago) and the U.S. dollar has been weakening (the real broad trade-weighted index is down 8% from its December 2016 peak). Third, also related to tax cuts, real disposable personal income increased 3.4% in Q1 (it topped 6% in nominal terms), which was a three-year high and bodes well for consumer spending in Q2 and beyond (lower withholding taxes appear to be trickling into savings first).
On balance, the economy expanded 2.9% during the past year, and it is expected to average this rate for the remainder of the year owing to fiscal stimulus. Such economic performance will push the output gap increasingly into positive territory, pull down the unemployment rate below 4%, and push the headline and core inflation metrics consistently above 2%. These trends, in turn, will keep the Fed well on its current policy normalization path.
Michael Gregory, CFA Deputy Chief Economist [email protected] 416-359-4747
U
Page 3 of 14 Focus — April 27, 2018
Our Thoughts
3 ≠ 4
quity markets are on pins and needles over whether the benchmark Treasury yield will breach 3%. Get a grip.
OK, 3% is a four-year high, but that doesn’t mean it’s high. In fact, it’s only one percentage point above core CPI inflation, compared with an average real yield of 2.4% in the past six decades and 1.7% in the past two. This means the yield likely needs to rise ¾ of a percentage point to return to neutral levels, which we don’t see happening until 2020, and only if the Fed lifts rates seven more times.
Still worried? Here are two more reasons not to lose sleep over a moderate further increase in the 10-year rate. First, it’s helping to prevent a further flattening of the yield curve as the Fed rebalances policy. A flatter yield curve would squeeze bank funding, slow credit growth and depress the economy. Higher bond yields mean investors see a greater chance of inflation rising than the economy shrinking. And, a moderate rise in inflation wouldn’t be a big deal for earnings as higher prices (and revenue) would largely offset higher costs, though customer purchasing power would get dinged. Second, higher bond yields will attract capital to the U.S. economy, which is sorely needed to expand capacity amid demand-stoking fiscal stimulus.
The apparent dread over a 3% benchmark yield could simply reflect investors losing sight of what normal is. And who could blame them with central banks holding down policy rates for so long. The federal funds rate has been below core CPI inflation since April 2008—a whole decade, and seven years longer than the second longest stretch in the past six decades. Apart from a few odd months, the Bank of Canada has kept real policy rates negative since November 2008. This might have been necessary during the early days of the recovery, but not nine years into an expansion, especially with governments in both countries priming the fiscal pump. While we are generally sanguine about the inflation outlook due to the restraining effect of automation, and see some limited scope for higher participation rates to keep wages in check, the time to test the economy’s long-run speed limit is when the road is dry, not wet; that is, when policy rates are near perceived long-run neutral levels. If the economy overheats, it will be easier to apply the policy brakes when your foot is off the gas pedal.
Although stocks are expensive, they likely can withstand some moderate further increase in interest rates. The 2.2% dividend yield for the Dow is 0.8 ppts below the 10-year yield. It was actually higher than the risk-free return in 2016 and about on par in 2017, offering good value in a relative sense. The fact that the dividend yield is somewhat lower now shouldn’t be alarming, as it was more than 2 ppts lower for several years prior to the last recession and, on average, in the past six decades. Moreover, while the 12-month earnings yield has fallen in recent years to 4%, it’s still a full percentage point above the 10-year rate, which is a higher premium than historically.
The upshot is that, unless other risks intensify, a moderate further rise in bond yields should merely slow the equity train rather than derail it.
Sal Guatieri Senior Economist [email protected] 416-359-5295
E

Page 4 of 14 Focus — April 27, 2018
Our Thoughts
Stalling
ofter growth around the start of the year, as well as some ongoing risks on the trade file, is causing some central banks to be a little more uncomfortable on
the road to normalization.
Let’s take the ECB, which stayed on hold this week. President Draghi’s cautious comments during the press conference, and reports that he was reluctant to discuss the future path of policy during the meeting (although a few other members of the Governing Council, including Austria’s Nowotny, brought it up), are indications of his hesitancy on pulling the plug on QE. Expect more cautiousness in coming months. Still, monthly purchases will likely be trimmed starting in the fall, before finishing up around the turn of the year.
The BoJ also stayed on hold this week, with the dovish Gourshi Kataoka again dissenting in favour of more stimulus. What was a surprise, though, was the tossing of the timeline for when the seemingly-elusive 2% inflation target will be reached. The line “The timing of the year-on-year rate of change in the CPI reaching around 2 percent will likely be around fiscal 2019.” disappeared. But, Governor Kuroda insisted “there’s no deep meaning” behind the move, and they still believe inflation will reach 2% during fiscal 2019. Still, the purposely vague reference indicates that the central bank is digging its heels further into the ground and will be employing monetary stimulus for longer than what was previously assumed. Lifting the target on the 10-year yield (from 0% to, say, 0.15%) should be considered a baby step toward normalization, but it appears that it is not even under discussion (officially).
Then there’s the BoE. After the central bank warned earlier this year of sooner-than-expected rate hikes, markets rushed to price in a May move. Last week, Governor Carney threw cold water on those expectations (that the BoE set), warning that “I don’t want to get too focused on the precise timing” and the Bank is “conscious that there are other meetings”. The slowest real GDP growth in five years supported his caution, although some of it was due to winter storms. In any event, we pulled our call for a 25-bp rate hike in May, pushing it to August if the monthly surveys point to a bounce-back in Q2.
Bottom Line: Central banks will continue on the road to normalization, but at a slower, more plodding pace.
Jennifer Lee Senior Economist [email protected] 416-359-4092
S
Page 5 of 14 Focus — April 27, 2018
Recap
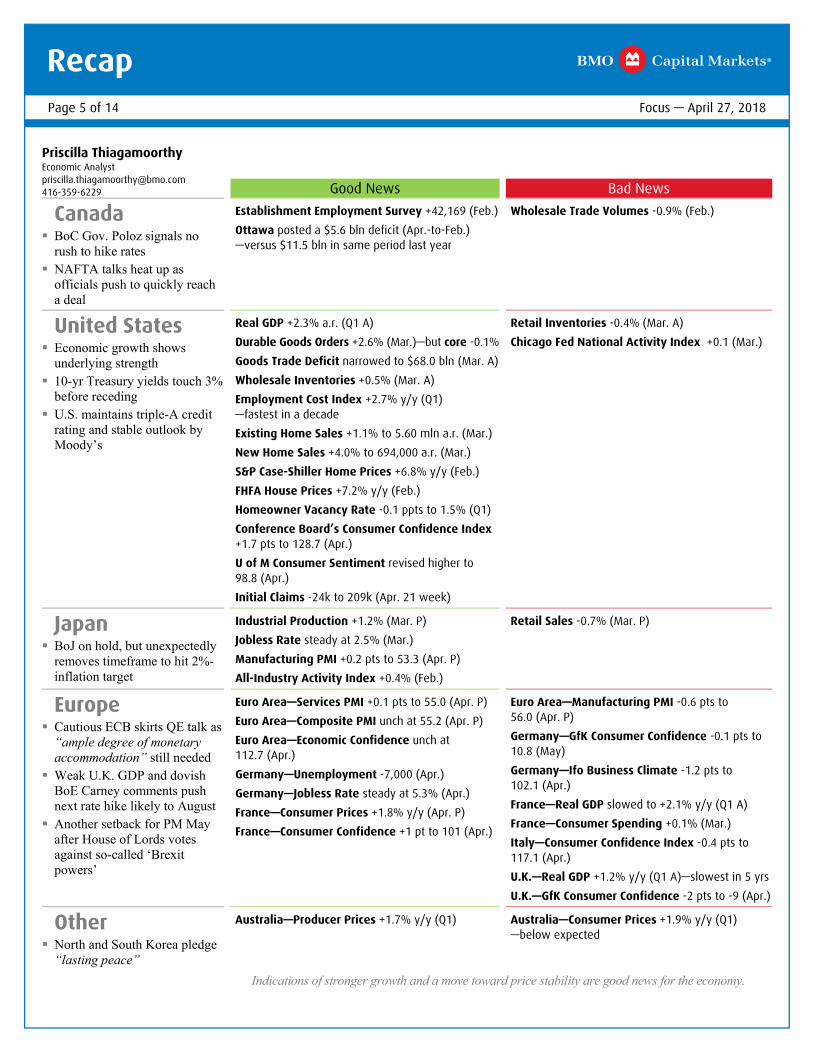
Priscilla Thiagamoorthy Economic Analyst [email protected] 416-359-6229
Good News Bad News
Canada BoC Gov. Poloz signals no
rush to hike rates NAFTA talks heat up as
officials push to quickly reach a deal
Establishment Employment Survey +42,169 (Feb.) Ottawa posted a $5.6 bln deficit (Apr.-to-Feb.) —versus $11.5 bln in same period last year
Wholesale Trade Volumes -0.9% (Feb.)
United States Economic growth shows
underlying strength 10-yr Treasury yields touch 3%
before receding U.S. maintains triple-A credit
rating and stable outlook by Moody’s
Real GDP +2.3% a.r. (Q1 A) Durable Goods Orders +2.6% (Mar.)—but core -0.1% Goods Trade Deficit narrowed to $68.0 bln (Mar. A) Wholesale Inventories +0.5% (Mar. A) Employment Cost Index +2.7% y/y (Q1) —fastest in a decade Existing Home Sales +1.1% to 5.60 mln a.r. (Mar.) New Home Sales +4.0% to 694,000 a.r. (Mar.) S&P Case-Shiller Home Prices +6.8% y/y (Feb.) FHFA House Prices +7.2% y/y (Feb.) Homeowner Vacancy Rate -0.1 ppts to 1.5% (Q1) Conference Board’s Consumer Confidence Index +1.7 pts to 128.7 (Apr.) U of M Consumer Sentiment revised higher to 98.8 (Apr.) Initial Claims -24k to 209k (Apr. 21 week)
Retail Inventories -0.4% (Mar. A) Chicago Fed National Activity Index +0.1 (Mar.)
Japan BoJ on hold, but unexpectedly
removes timeframe to hit 2%-inflation target
Industrial Production +1.2% (Mar. P) Jobless Rate steady at 2.5% (Mar.) Manufacturing PMI +0.2 pts to 53.3 (Apr. P) All-Industry Activity Index +0.4% (Feb.)
Retail Sales -0.7% (Mar. P)
Europe Cautious ECB skirts QE talk as
“ample degree of monetary accommodation” still needed
Weak U.K. GDP and dovish BoE Carney comments push next rate hike likely to August
Another setback for PM May after House of Lords votes against so-called ‘Brexit powers’
Euro Area—Services PMI +0.1 pts to 55.0 (Apr. P) Euro Area—Composite PMI unch at 55.2 (Apr. P) Euro Area—Economic Confidence unch at 112.7 (Apr.) Germany—Unemployment -7,000 (Apr.) Germany—Jobless Rate steady at 5.3% (Apr.) France—Consumer Prices +1.8% y/y (Apr. P) France—Consumer Confidence +1 pt to 101 (Apr.)
Euro Area—Manufacturing PMI -0.6 pts to 56.0 (Apr. P) Germany—GfK Consumer Confidence -0.1 pts to 10.8 (May) Germany—Ifo Business Climate -1.2 pts to 102.1 (Apr.) France—Real GDP slowed to +2.1% y/y (Q1 A) France—Consumer Spending +0.1% (Mar.) Italy—Consumer Confidence Index -0.4 pts to 117.1 (Apr.) U.K.—Real GDP +1.2% y/y (Q1 A)—slowest in 5 yrs U.K.—GfK Consumer Confidence -2 pts to -9 (Apr.)
Other North and South Korea pledge
“lasting peace”
Australia—Producer Prices +1.7% y/y (Q1) Australia—Consumer Prices +1.9% y/y (Q1) —below expected
Indications of stronger growth and a move toward price stability are good news for the economy.

Page 6 of 14 Focus — April 27, 2018
Feature
Global Growth: Rocky Mountain High Douglas Porter, CFA, Chief Economist • [email protected] • 416-359-4887
The global economy is running at its fastest pace since the very early days of this long economic recovery, in a classic case of the cycle finding its second wind. The IMF recently upgraded its outlook for this year and next, and calls for the world economy to clock in at almost 4% growth in that period, nearly matching the blistering pace set in the prior decade. Beyond the impressive headline tally, the details reveal that every major economy is expected to remain in expansion mode, a synchronicity not seen since the heady 1990s (Chart 1). This broad strength is a key factor driving global yields and commodity prices higher. In a nutshell, world output has powered through trade uncertainty, initial Fed tightening, rising fuel costs, and a return of some market volatility. The key questions now are: Is this sustainable? What are the implications, and the risks?
Sustainability: Despite the gaudy headlines, global growth may already be topping out, and could moderate over the next two years. Looking at our quarterly estimates, we see growth ebbing somewhat in Q1 from a hot 4.0% y/y clip at the end of 2017. And, the OECD’s leading indicator points to a modest cooling in coming quarters (Chart 2). Some moderation is no big concern, as the underlying trend for the global economy is likely closer to 3½%. Indeed, in its latest Monetary Policy Report, the Bank of Canada estimates global potential growth to be between 3.25%-to-3.50%, well shy of the recent heated trend in the world economy.
One potential support factor for growth, and a rare wildcard at this advanced stage of the cycle, is the currently unfolding U.S. fiscal stimulus. The IMF estimates that the structural budget deficit among advanced economies will widen 0.3 percentage points as a share of GDP this year, and another 0.6 ppts in 2019—a rough measure of the net fiscal stimulus to growth, with almost all coming from the U.S. tax and spending steps (Chart 3). In fact, the IMF warned of “unnecessary stimulus” at this stage of the cycle, a point we—and others—have raised many times in recent months.
Implications: The sustained bout of solid late-cycle global growth—and the tightening output gap for the world economy—is making an impact through a variety of channels. The uptick has played a role in firmer commodity prices, most notably for oil (Chart 4). The BMO Commodity Price Index is now expected to be 20% above year-ago levels for all of Q2, with gains spread across all four major categories of goods. In particular, crude oil prices have now climbed nearly 40% from year-ago levels, with solid underlying demand growth and surprisingly tight OPEC discipline more than compensating for record U.S. production.
2017:Q4
[Q1]
[Q1]
[Q1][Q1]
1.01.21.52.12.22.42.82.92.92.96.87.2
-3 0 3 6 9
RussiaUK
MexicoJapanBrazil
AustraliaEurozone
USCanada
South KoreaChinaIndia
Real GDP
Global Growth I: Solid and Synchronized(y/y % chng)
Chart 1
Sources: BMO Economics, Haver Analytics
CurrentYearago
16 17 18f 19fWorld 3.2 3.8 3.8 3.6
Current
-4
-2
0
2
4
6
94
96
98
100
102
07 09 11 13 15 17
Global Growth II: Topping Out?Chart 2
¹ (lhs : index : s.a. : amplitude adjusted)² (rhs : PPP weights : y/y % chng)Sources: BMO Economics, Haver Analytics
OECDLeadingIndicator¹
GlobalGDP²
2012 2013 2014 2015 2016 2017 2018 2019-8
-6
-4
-2
0
Structural Budget Balance
Budget Deficit Growing(% of GDP)
Chart 3
Sources: BMO Economics, IMF
Industrial Economies
United States
forecast

Page 7 of 14 Focus — April 27, 2018
Feature
In turn, the strength in commodities, especially oil, and a fading global output gap are putting gradual upward pressure on inflation. In a major change from recent years, headline consumer price inflation in the OECD has spent most of the past year above 2%, with each of Britain, the U.S. and Canada now running above that threshold. Core inflation among the industrialized world remains notably calmer just below that mark; but, even by that metric, there is a subtle drift higher (Chart 5). While we are not in the camp looking for a big break-out for inflation, it’s also pretty clear that deflation risks have been deflated. To wit, the IMF now pegs the risks of deflation in the U.S. over the next year as next to nil.
The combination of a slow upward tilt in headline inflation, a widening structural budget deficit for developed nations, solid growth, and a tight output gap have put renewed upward pressure on bond yields. Of course, rumbling away in the background has been the slow, but steady, Fed tightening campaign, the beginning of a reversal of QE, and even some small sporadic moves by other major central banks to move away from ultra-loose policy stances. Against the challenging backdrop for bonds, the benchmark 10-year Treasury famously hit the 3% threshold this week (Chart 6). True, we visited these levels earlier in the cycle. The difference between now and the 2013 Taper Tantrum is that global growth is on a firmer footing, the output gap is smaller, headline inflation is higher, and the Fed is actually tightening policy (not just talking about the abstract possibility). While much of this news is likely built into today’s rates, we see yields continuing a push higher toward 3.5% by late 2019.
Risks: The one thing that could up-end our call on yields is if global growth cools faster than expected. And, despite the sunny IMF outlook, there is no shortage of risks surrounding the world economy. Briefly, the biggest are: (1) threat of protectionism, trade tiffs; (2) restraining impact of higher energy prices, higher yields and/or tighter financial conditions generally; (3) an overly aggressive Fed; (4) renewed market volatility, perhaps due to concerns in a specific sector (e.g., tech); and, (5) geo-political tensions.
Despite the long list of potential threats, we would note that the global economy has been remarkably resilient to an array of moderate shocks and uncertainties in recent years, and suspect that growth will ultimately remain buoyant through next year.
The Bottom Line: The world economy is now as healthy as at any time since the start of this cycle. While there are early indications that growth may be topping out, it will be supported over the next year by U.S. fiscal stimulus. Still-solid global growth will keep the slowly grinding upward pressure on commodity prices, inflation, and bond yields. That combination will, in turn, likely eventually sow the seeds of the next economic setback, in the years after 2019.
-60
-40
-20
0
20
40
60
80
12 13 14 15 16 17 18
Commodities Cruising(y/y % chng)
Chart 4
Sources: BMO Economics, Haver Analytics
BMO Ex-Energy Commodity Price Index
WTI Crude
-1
0
1
2
3
4
09 10 11 12 13 14 15 16 17 18
OECD Consumer Price Index
Inflation Grinds Higher(y/y % chng)
Chart 5
Sources: BMO Economics, Haver Analytics
Core
Headline
1
2
3
4
5
6
04 06 08 10 12 14 16 18
10-Year Treasury Note Yield
Bond Yield BreakoutUnited States (% : as of April 27, 2018, 10:15 am)
Chart 6
Shading marks period of U.S. recessionSources: BMO Economics, Haver Analytics
7-yearm.a.

Page 8 of 14 Focus — April 27, 2018
Economic Forecast
Economic Forecast Summary for April 27, 2018 BMO Capital Markets Economic Research
2017 2018 AnnualQ1 Q2 Q3 Q4 Q1 Q2 Q3 Q4 2017 2018 2019
CANADAReal GDP (q/q % chng : a.r.) 4.0 4.4 1.5 1.7 1.5 2.3 2.1 1.9 3.0 2.0 1.8
Consumer Price Index (y/y % chng) 1.9 1.3 1.4 1.8 2.1 2.4 2.5 2.3 1.6 2.3 2.1
Unemployment Rate (percent) 6.6 6.5 6.2 6.0 5.8 5.8 5.7 5.5 6.3 5.7 5.5
Housing Starts (000s : a.r.) 222 207 223 229 224 220 220 218 220 220 210
Current Account Balance ($blns : a.r.) -54.6 -61.3 -74.4 -65.4 -64.1 -60.2 -58.5 -57.1 -63.9 -60.0 -56.0
Interest Rates (average for the quarter : %)
Overnight Rate 0.50 0.50 0.83 1.00 1.25 1.25 1.50 1.75 0.71 1.44 2.31
3-month Treasury Bill 0.47 0.54 0.81 0.92 1.14 1.20 1.45 1.70 0.69 1.35 2.20
10-year Bond 1.71 1.51 1.95 1.96 2.24 2.30 2.40 2.50 1.78 2.35 2.80
Canada-U.S. InterestRate Spreads (average for the quarter : bps)
90-day -13 -36 -25 -30 -44 -67 -60 -53 -26 -56 -35
10-year -73 -75 -30 -41 -52 -62 -61 -58 -55 -58 -50
UNITED STATESReal GDP (q/q % chng : a.r.) 1.2 3.1 3.2 2.9 2.3 2.8 2.9 2.9 2.3 2.8 2.5
Consumer Price Index (y/y % chng) 2.6 1.9 2.0 2.1 2.3 2.7 2.8 2.5 2.1 2.6 2.1
Unemployment Rate (percent) 4.6 4.3 4.3 4.1 4.1 4.0 3.8 3.7 4.4 3.9 3.5
Housing Starts (mlns : a.r.) 1.24 1.17 1.17 1.26 1.32 1.28 1.30 1.28 1.21 1.29 1.28
Current Account Balance ($blns : a.r.) -451 -495 -406 -513 -543 -556 -572 -591 -466 -565 -625
Interest Rates (average for the quarter : %)
Fed Funds Target Rate 0.71 0.96 1.13 1.21 1.46 1.71 1.96 2.21 1.00 1.83 2.73
3-month Treasury Bill 0.60 0.90 1.06 1.23 1.58 1.85 2.05 2.20 0.95 1.90 2.55
10-year Note 2.44 2.26 2.24 2.37 2.76 2.95 3.05 3.10 2.33 2.95 3.30
EXCHANGE RATES (average for the quarter)
US¢/C$ 75.6 74.4 79.9 78.6 79.1 77.9 78.8 79.7 77.1 78.9 81.1
C$/US$ 1.32 1.34 1.25 1.27 1.27 1.28 1.27 1.25 1.30 1.27 1.23
¥/US$ 114 111 111 113 108 108 107 106 112 107 104
US$/Euro 1.07 1.10 1.18 1.18 1.23 1.23 1.24 1.25 1.13 1.24 1.27
US$/£ 1.24 1.28 1.31 1.33 1.39 1.40 1.40 1.42 1.29 1.40 1.45
Blocked areas represent BMO Capital Markets forecastsUp and down arrows indicate changes to the forecast Spreads may differ due to rounding
Page 9 of 14 Focus — April 27, 2018
Key for Next Week
Canada The Canadian economy likely rebounded in February after a surprise contraction in GDP to start 2018. Oil was the big driver of the drop in January GDP, as unseasonal oil sands maintenance subtracted 0.2 ppts from the headline. A rebound in the sector would add a similar amount to February GDP, which would likely be enough to push growth up to 0.3% (source of upside risk to our call). However, the lack of a rebound would impart downside risk. Excluding oil, growth is expected to be about +0.1%, similar to last month. Home sales were down on the month but gains in manufacturing and retail sales will provide an offset. A drop in wholesale activity will weigh on the headline as well, while continued issues with rail transportation are a potential negative. However, hours worked were up sharply in the month, supporting the upside risks to our forecast. Our call is consistent with Q1 GDP growth of about 1.5%. Anything below a solid 0.2% print would flag downside risk to the quarter.
Canada’s trade deficit is expected to narrow to $2.2 bln in March, which would be among the smallest shortfalls reported over the past nine months. Oil prices rose substantially in the month, which should lift energy exports to their best level since late-2014. Broadly higher commodity prices and an anticipated increase in manufacturing are expected to lift exports as well. Imports saw a chunky gain in February and we look for a more subdued increase this time. Note that electronic & electrical equipment import volumes are down sharply to start the year, retracing some of Q4’s big gain, not a good sign for Q1 investment. We’ll be watching for signs of a rebound in Q2. And, we’ll see if non-commodity export volumes can gain any traction after moving sideways for nearly a decade. Continued lack of improvement strongly suggests there are broader competitiveness issues at play.
United States The BEA reported that consumer spending slowed to a 1.1% annual rate in Q1 from 4.0% in Q4, so the monthly release should merely confirm that the quarter ended on a positive note. Solid rebounds in auto and retail sales flag a 0.4% increase in spending. Fuelled by lower tax withholdings, consumer spending should snap back 3% in Q2. Rising wages likely lifted personal income 0.4% in March, while disposable income rose a hefty 6.2% a.r. in the quarter. Although cheaper fuel likely flattened the PCE deflator in the month, core prices should increase 0.2%. The core rate has risen 2.8% annualized in the past three months, the fastest this cycle. The expected advance in March will contrast with a rare decline a year ago (stemming from lower wireless service charges), ratcheting the annual rate four notches higher to a six-year peak of 2.0%. Core inflation will likely reach 2.3% later this year, far from alarming but above the Fed’s target and sure to keep bond holders on edge.
Real GDP at Basic Prices Tuesday, 8:30 am Feb. (e) +0.2% Consensus +0.3%
Jan. -0.1%
Benjamin Reitzes Canadian Rates & Macro Strategist [email protected] 416-359-5628
Merchandise Trade Deficit Thursday, 8:30 am Mar. (e) $2.2 bln Consensus $2.0 bln
Feb. $2.7 bln
Michael Gregory, CFA Deputy Chief Economist [email protected] 416-359-4747 Sal Guatieri Senior Economist [email protected] 416-359-5295
Personal Spending and Income Monday, 8:30 am Personal Personal
Spending Income Mar. (e) +0.4% +0.4% Consensus +0.4% +0.4%
Feb. +0.2% +0.4% Core PCE Price Index Mar. (e) +0.2% +2.0% y/y Consensus +0.2% +2.0% y/y
Feb. +0.2% +1.6% y/y

Page 10 of 14 Focus — April 27, 2018
Key for Next Week
After slipping from 14-year highs in March, we look for the ISM index to decline a bit further in April to 58.6. The regional manufacturing indices released so far (and recast on an ISM basis where possible) were more down (3) than up (1) this month. However, this is still a solid result, with the index now running above the lofty 58.2 level for the past nine consecutive months (again, a run not seen since 2004). On balance, America’s factories are doing fine these days, supported by solid exports and domestic demand. The prices paid index (nsa) should increase again (up from 78.1), hitting a seven-year high, reflecting supply shortages (as Jennifer Lee notes… either of workers or widgets or materials that go into a widget) and tariffs.
We look for no change in Fed policy next week. Indeed, apart from any references to the rate hike, March’s FOMC statement could be repeated verbatim. Sticking to the now-rote forward guidance on the policy normalization process, and with the risk assessment likely still “roughly balanced”, March’s economic view remains valid. However, we’ll likely see some tweaking on the latter front, if only to signal that a June rate hike remains on the table (perhaps pointing to inflation’s continued uptrend or Q1’s solid nonresidential investment and exports). Currently, the market is pricing in near-zero chances of a move next week and about 90% odds of a June 13th rate hike (taking into account the fact that the effective fed funds rates is currently trading some 7+ bps above the midpoint of its target range owing to technical issues in the money market).
Like its factory cousin, the ISM non-manufacturing index (NMI) has been slipping from multiyear highs (in this case, a near-12½ year peak of 59.9 in January). It should dip a bit further in April to 58.5, reflecting the recent cooling in broad economic activity (Q1 GDP growth at 2.3% annualized versus a 3.0% average pace in the prior three periods). However, several key economic indicators were improving in March (such as retail sales and housing starts), suggesting that the NMI should soon stabilize or even turn up again. Released a day before the jobs report, the NMI’s employment component will be scrutinized; it improved in March but remained below January’s record (since 1997) high.
After two volatile months, nonfarm payrolls are expected to return to a more trend-like increase of 190,000 in April, just a mild step back from the robust six-month mean of 211,000. Construction jobs should rebound after sagging due to bad weather. The biggest challenge for the U.S. economy now is too-few workers rather than lack of jobs. Barring an upturn in the participation rate, the jobless rate is expected to decline for the first time in seven months to a 17-year low of 4.0%. We see it sliding further to 3.7% by year-end, a 48-year nadir (which is where new jobless claims sit). Also look for the more comprehensive U6 measure of joblessness to probe new lows below 8%. With little slack left, the economy would benefit from an upturn in labour force participation. The part rate has changed little in the past four years, as retiring baby boomers neatly offset an upturn in prime-age (25 to 54 years) job seekers (partly due to an upturn in disabled persons entering the workforce). Widespread labour shortages should lift average hourly earnings 0.3% in the month and 2.8% in the past year, the top end of the cycle range.
Manufacturing ISM (PMI) Tuesday, 10:00 am Apr. (e) 58.6 Consensus 58.5
Mar. 59.3
FOMC Announcement Wednesday, 2:00 pm
Non-manufacturing ISM (NMI) Thursday, 10:00 am Apr. (e) 58.5 Consensus 58.0
Mar. 58.8
Nonfarm Payrolls Friday, 8:30 am Apr. (e) +190,000 Consensus +185,000
Mar. +103,000 Unemployment Rate Apr. (e) 4.0% Consensus 4.0%
Mar. 4.1% Average Hourly Earnings Apr. (e) +0.3% +2.8% y/y Consensus +0.2% +2.7% y/y
Mar. +0.3% +2.7% y/y
Page 11 of 14 Focus — April 27, 2018
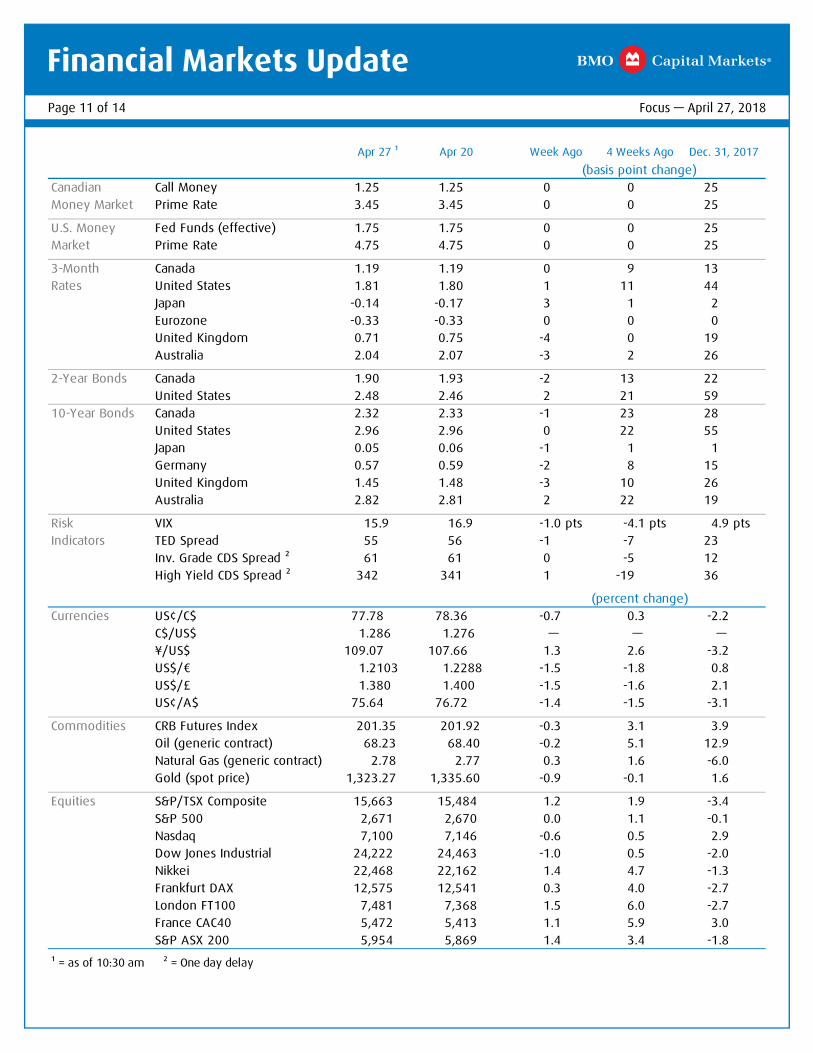
Financial Markets Update
Apr 27 ¹ Apr 20 Week Ago 4 Weeks Ago Dec. 31, 2017(basis point change)
Canadian Call Money 1.25 1.25 0 0 25 Money Market Prime Rate 3.45 3.45 0 0 25
U.S. Money Fed Funds (effective) 1.75 1.75 0 0 25 Market Prime Rate 4.75 4.75 0 0 25
3-Month Canada 1.19 1.19 0 9 13 Rates United States 1.81 1.80 1 11 44
Japan -0.14 -0.17 3 1 2 Eurozone -0.33 -0.33 0 0 0 United Kingdom 0.71 0.75 -4 0 19 Australia 2.04 2.07 -3 2 26
2-Year Bonds Canada 1.90 1.93 -2 13 22 United States 2.48 2.46 2 21 59
10-Year Bonds Canada 2.32 2.33 -1 23 28 United States 2.96 2.96 0 22 55 Japan 0.05 0.06 -1 1 1 Germany 0.57 0.59 -2 8 15 United Kingdom 1.45 1.48 -3 10 26 Australia 2.82 2.81 2 22 19
Risk VIX 15.9 16.9 -1.0 pts -4.1 pts 4.9 pts Indicators TED Spread 55 56 -1 -7 23
Inv. Grade CDS Spread ² 61 61 0 -5 12 High Yield CDS Spread ² 342 341 1 -19 36
(percent change)Currencies US¢/C$ 77.78 78.36 -0.7 0.3 -2.2
C$/US$ 1.286 1.276 — — — ¥/US$ 109.07 107.66 1.3 2.6 -3.2 US$/€ 1.2103 1.2288 -1.5 -1.8 0.8 US$/£ 1.380 1.400 -1.5 -1.6 2.1 US¢/A$ 75.64 76.72 -1.4 -1.5 -3.1
Commodities CRB Futures Index 201.35 201.92 -0.3 3.1 3.9 Oil (generic contract) 68.23 68.40 -0.2 5.1 12.9 Natural Gas (generic contract) 2.78 2.77 0.3 1.6 -6.0 Gold (spot price) 1,323.27 1,335.60 -0.9 -0.1 1.6
Equities S&P/TSX Composite 15,663 15,484 1.2 1.9 -3.4 S&P 500 2,671 2,670 0.0 1.1 -0.1 Nasdaq 7,100 7,146 -0.6 0.5 2.9 Dow Jones Industrial 24,222 24,463 -1.0 0.5 -2.0 Nikkei 22,468 22,162 1.4 4.7 -1.3 Frankfurt DAX 12,575 12,541 0.3 4.0 -2.7 London FT100 7,481 7,368 1.5 6.0 -2.7 France CAC40 5,472 5,413 1.1 5.9 3.0 S&P ASX 200 5,954 5,869 1.4 3.4 -1.8
¹ = as of 10:30 am ² = One day delay

Upcoming Policy Meetings | BoE: May 10, June 21, Aug. 2 | ECB: June 14, July 26, Sep. 13
Global Calendar April 30 – May 4
Monday April 30 Tuesday May 1 Wednesday May 2 Thursday May 3 Friday May 4
Japa
n
Manufacturing PMI Apr. F (e) 53.3 Mar. 53.1
Services PMI Apr. Mar. 50.9
Composite PMI Apr. Mar. 51.3
Consumer Confidence Index Apr. (e) 44.5 Mar. 44.3
Markets Closed
Euro
Are
a E U R O A R E A M3 Money Supply Mar. (e) +4.1% y/y Feb. +4.2% y/y
G E R M A N Y Retail Sales Mar. (e) +0.8% +1.5% y/y Feb. -0.5% +1.3% y/y
Consumer Price Index Apr. P (e) -0.1% +1.4% y/y Mar. +0.4% +1.5% y/y
I T A L Y Consumer Price Index Apr. P (e) +0.6% +0.8% y/y Mar. +2.3% +0.9% y/y
E U R O A R E A
Markets Closed E U R O A R E A
Real GDP Q1 A (e) +0.4% +2.5% y/y Q4 +0.6% +2.7% y/y
Jobless Rate Mar. (e) 8.5% Feb. 8.5%
Manufacturing PMI Apr. F (e) 56.0 Mar. 56.6
F R A N C E Jobless Rate Mar. Feb. 8.9%
I T A L Y Real GDP Q1 P (e) +0.3% +1.5% y/y Q4 +0.3% +1.6% y/y
Jobless Rate Mar. P (e) 10.9% Feb. 10.9%
E U R O A R E A Consumer Price Index Apr. (e) +1.3% y/y Mar. +1.4% y/y
Core CPI Apr. A (e) +0.9% y/y Mar. +1.0% y/y
Producer Price Index Mar. (e) +0.1% +2.1% y/y Feb. +0.1% +1.6% y/y
E U R O A R E A Services PMI Apr. F (e) 55.0 Mar. 54.9
Composite PMI Apr. F (e) 55.2 Mar. 55.2
Retail Sales Mar. (e) +0.5% +2.0% y/y Feb. +0.1% +1.8% y/y
F R A N C E Trade Deficit Mar. (e) €5.1 bln Feb. €5.2 bln
U.K.
Manufacturing PMI Apr. (e) 54.8 Mar. 55.1
Services PMI Apr. (e) 53.5 Mar. 51.7
Composite PMI Apr. (e) 53.5 Mar. 52.5
U.K. local elections
Construction PMI Apr. (e) 50.4 Mar. 47.0
Othe
r C H I N A Mfg PMI Nonmfg PMI Apr. (e) 51.3 54.5 Mar. 51.5 54.6
M E X I C O Real GDP Q1 P (e) +0.6% +1.6% y/y Q4 +0.8% +1.5% y/y
C H I N A
Markets Closed
A U S T R A L I A RBA Monetary Policy Meeting
C H I N A Caixin Manufacturing PMI Apr. (e) 50.9 Mar. 51.0
A U S T R A L I A Trade Surplus Mar. (e) A$865 mln Feb. A$825 mln
Building Approvals Mar. (e) +1.0% +10.8% y/y Feb. -6.2% -3.1% y/y
C H I N A Caixin Services PMI Apr. (e) 52.3 Mar. 52.3
Caixin Composite PMI Apr. Mar. 51.8
A U S T R A L I A
RBA Statement on Monetary Policy

D = date approximate
North American Calendar April 30 – May 4
Monday April 30 Tuesday May 1 Wednesday May 2 Thursday May 3 Friday May 4
Cana
da
8:30 am Industrial Raw Product Materials Price Index Price Index
Mar. (e) +0.8% +4.0% Feb. +0.1% -0.3%
8:30 am Real GDP at Basic Prices Feb. (e) +0.2% Consensus +0.3% Jan. -0.1%
9:30 am Markit Manufacturing PMI Apr. Mar. 55.7
2:30 pm BoC Gov. Poloz speaks on “Canada’s Economy & Household Debt: How Big Is the Problem?”, Yellowknife Chamber of Commerce; 4:10 pm press conference
Auto Sales D Apr. Mar. -0.6% y/y
10:30 am 3-, 6- & 12-month bill auction $12.5 bln (new cash -$0.7 bln)
8:30 am Merchandise Trade Deficit Mar. (e) $2.2 bln Consensus $2.0 bln Feb. $2.7 bln
2-year bond auction announcement
10:00 am Ivey Purchasing Managers’ Index (s.a.)
Apr. Mar. 59.8
7:30 am Challenger Layoff Report Apr. Mar. +39.4% y/y
8:30 am Initial Claims Apr. 28 Apr. 21 209k (-24k)
8:30 am Continuing Claims Apr. 21 Apr. 14 1,837k (-29k)
8:30 am Productivity Unit Labour Costs
Q1 P (e) +0.5% a.r. +3.5% a.r. Consensus +0.9% a.r. +3.0% a.r. Q4 unch +2.5% a.r.
8:30 am Goods & Services Trade Deficit
Mar. (e) $50.0 bln Consensus $55.6 bln Feb. $57.6 bln
9:45 am Markit Services/Composite PMI (Apr. F)
10:00 am Factory Orders Mar. (e) +1.4% Consensus +1.3% Feb. +1.2%
10:00 am Non-manufacturing ISM (NMI)
Apr. (e) 58.5 Consensus 58.0 Mar. 58.8
8:30 am Nonfarm Payrolls Apr. (e) +190,000 Consensus +185,000 Mar. +103,000
8:30 am Unemployment Rate Apr. (e) 4.0% Consensus 4.0% Mar. 4.1%
8:30 am Average Hourly Earnings Apr. (e) +0.3% +2.8% y/y Consensus +0.2% +2.7% y/y Mar. +0.3% +2.7% y/y
Unite
d St
ates 8:30 am Personal Personal
Spending Income Mar. (e) +0.4% +0.4% Consensus +0.4% +0.4% Feb. +0.2% +0.4%
8:30 am Core PCE Price Index Mar. (e) +0.2% +2.0% y/y Consensus +0.2% +2.0% y/y Feb. +0.2% +1.6% y/y
9:45 am Chicago PMI Apr. (e) 58.0 Consensus 58.0 Mar. 57.4
10:00 am Pending Home Sales Mar. (e) +1.0% Consensus +0.5% Feb. +3.1%
10:30 am Dallas Fed Mfg. Activity Apr. (e) 23.0 Consensus 25.0 Mar. 21.4
11:00 am 4-week bill auction announcement
11:30 am 13- & 26-week bill auction $90 bln
9:45 am Markit Manufacturing PMI (Apr. F)
10:00 am Manufacturing ISM (PMI) Apr. (e) 58.6 Consensus 58.5 Mar. 59.3
10:00 am Construction Spending Mar. (e) +0.5% Consensus +0.5% Feb. +0.1%
Ward’s Total Vehicle Sales D Apr. (e) 17.3 mln a.r. Consensus 17.2 mln a.r. Mar. 17.4 mln a.r.
FOMC Meeting begins
Exemptions for steel and aluminum tariffs conditionally expire for
Canada, Mexico and other nations
11:30 am 4-week bill auction
7:00 am MBA Mortgage Apps Apr. 27 Apr. 20 -0.2%
8:15 am ADP National Employment Report
Apr. (e) +190,000 Consensus +193,000 Mar. +241,000
2:00 pm FOMC Announcement
8:30 am 3- & 10-year note, 30-year bond auction and other quarterly refinancing announcements
Treasury Secretary Mnuchin and senior officials visit China for trade talks (tentatively May 3-4)
11:00 am 13- & 26-week bill auction announcements
Fed Speakers: New York’s Dudley (noon); Gov. Quarles (5:30 pm); Dallas’
Kaplan (8:00 pm)
Sunday May 6
Fed Speaker: Gov. Quarles (7:00 pm)
Upcoming Policy Meetings | Bank of Canada: May 30, July 11, Sep. 5 | FOMC: June 12-13, July 31-Aug. 1, Sep. 25-26

Page 14 of 14 Focus — April 27, 2018
General Disclosure
“BMO Capital Markets” is a trade name used by the BMO Financial Group for the wholesale banking businesses of Bank of Montreal and its subsidiaries BMO Nesbitt Burns Inc., BMO Capital Markets Limited in the U.K. and BMO Capital Markets Corp. in the U.S. BMO Nesbitt Burns Inc., BMO Capital Markets Limited and BMO Capital Markets Corp are affiliates. This document is issued and distributed in Hong Kong by Bank of Montreal (“BMO”). BMO is an authorized institution under the Banking Ordinance (Chapter 155 of the Laws of Hong Kong) and a registered institution with the Securities and Futures Commission (CE No. AAK809) under the Securities and Futures Ordinance (Chapter 571 of the Laws of Hong Kong). BMO does not represent that this document may be lawfully distributed, or that any financial products may be lawfully offered or dealt with, in compliance with any regulatory requirements in other jurisdictions, or pursuant to an exemption available thereunder. This document is directed only at entities or persons in jurisdictions or countries where access to and use of the information is not contrary to local laws or regulations. Their contents have not been reviewed by any regulatory authority. Bank of Montreal or its subsidiaries (“BMO Financial Group”) has lending arrangements with, or provide other remunerated services to, many issuers covered by BMO Capital Markets. The opinions, estimates and projections contained in this report are those of BMO Capital Markets as of the date of this report and are subject to change without notice. BMO Capital Markets endeavours to ensure that the contents have been compiled or derived from sources that we believe are reliable and contain information and opinions that are accurate and complete. However, BMO Capital Markets makes no representation or warranty, express or implied, in respect thereof, takes no responsibility for any errors and omissions contained herein and accepts no liability whatsoever for any loss arising from any use of, or reliance on, this report or its contents. Information may be available to BMO Capital Markets or its affiliates that is not reflected in this report. The information in this report is not intended to be used as the primary basis of investment decisions, and because of individual client objectives, should not be construed as advice designed to meet the particular investment needs of any investor. This document is not to be construed as an offer to sell, a solicitation for or an offer to buy, any products or services referenced herein (including, without limitation, any commodities, securities or other financial instruments), nor shall such Information be considered as investment advice or as a recommendation to enter into any transaction. Each investor should consider obtaining independent advice before making any financial decisions. This document is provided for general information only and does not take into account any investor’s particular needs, financial status or investment objectives. BMO Capital Markets or its affiliates will buy from or sell to customers the securities of issuers mentioned in this report on a principal basis. BMO Capital Markets or its affiliates, officers, directors or employees have a long or short position in many of the securities discussed herein, related securities or in options, futures or other derivative instruments based thereon. The reader should assume that BMO Capital Markets or its affiliates may have a conflict of interest and should not rely solely on this report in evaluating whether or not to buy or sell securities of issuers discussed herein.
Dissemination of Research
Our publications are disseminated via email and may also be available via our web site http://economics.bmocapitalmarkets.com. Please contact your BMO Financial Group Representative for more information.
Conflict Statement
A general description of how BMO Financial Group identifies and manages conflicts of interest is contained in our public facing policy for managing conflicts of interest in connection with investment research which is available at http://researchglobal.bmocapitalmarkets.com/Public/Conflict_Statement_Public.aspx.
ADDITIONAL INFORMATION IS AVAILABLE UPON REQUEST
BMO Financial Group (NYSE, TSX: BMO) is an integrated financial services provider offering a range of retail banking, wealth management, and investment and corporate banking products. BMO serves Canadian retail clients through BMO Bank of Montreal and BMO Nesbitt Burns. In the United States, personal and commercial banking clients are served by BMO Harris Bank N.A., Member FDIC. Investment and corporate banking services are provided in Canada and the US through BMO Capital Markets. BMO Capital Markets is a trade name used by BMO Financial Group for the wholesale banking businesses of Bank of Montreal, BMO Harris Bank N.A, BMO Ireland Plc, and Bank of Montreal (China) Co. Ltd. and the institutional broker dealer businesses of BMO Capital Markets Corp. (Member SIPC), BMO Nesbitt Burns Securities Limited (Member SIPC) in the U.S., BMO Nesbitt Burns Inc. (Member Canadian Investor Protection Fund) in Canada, Europe and Asia, BMO Capital Markets Limited in Europe, Asia and Australia and BMO Advisors Private Limited in India.
“Nesbitt Burns” is a registered trademark of BMO Nesbitt Burns Inc., used under license. “BMO Capital Markets” is a trademark of Bank of Montreal, used under license. "BMO (M-Bar roundel symbol)" is a registered trademark of Bank of Montreal, used under license.
® Registered trademark of Bank of Montreal in the United States, Canada and elsewhere.
™ Trademark Bank of Montreal in the United States and Canada.
© COPYRIGHT 2018 BMO CAPITAL MARKETS CORP.
A member of BMO Financial Group