GLOBAL FUND DISTRIBUTION 2017 - homepage | Alfi · GLOBAL FUND DISTRIBUTION 2017. ... 5.8 7 7.3 7.6...
17
GLOBAL FUND DISTRIBUTION 2017
Transcript of GLOBAL FUND DISTRIBUTION 2017 - homepage | Alfi · GLOBAL FUND DISTRIBUTION 2017. ... 5.8 7 7.3 7.6...
GLOBAL FUND DISTRIBUTION 2017
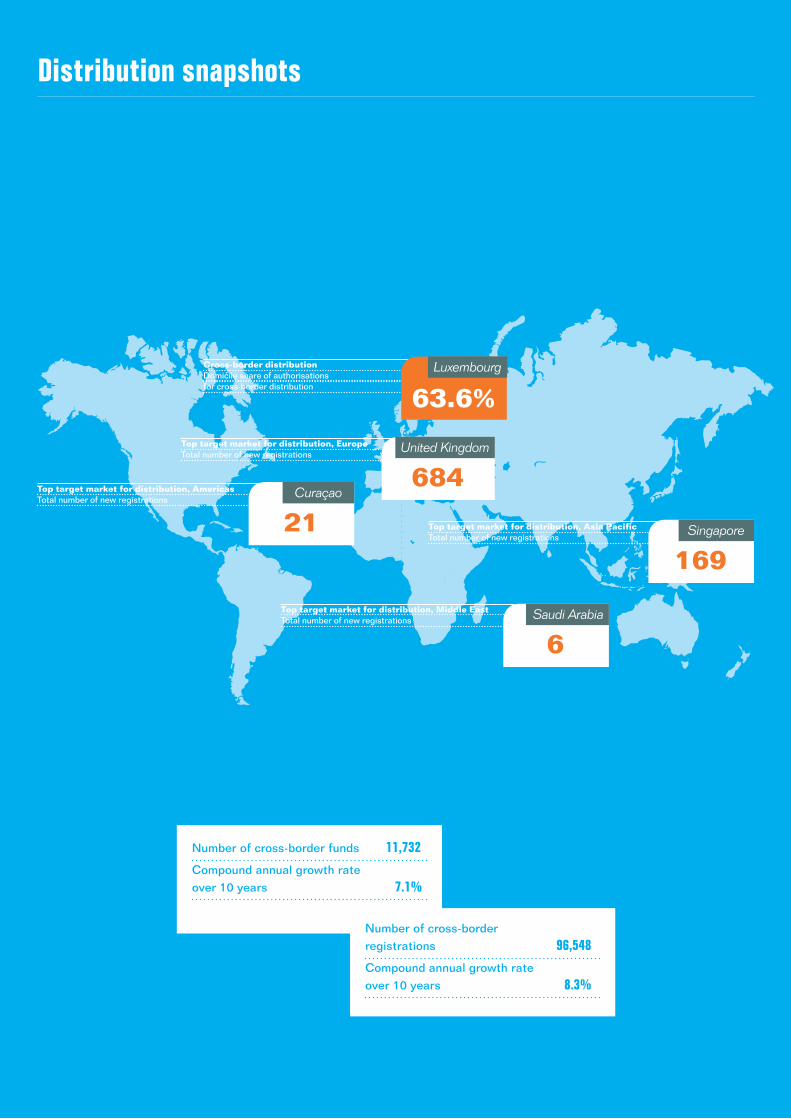
Distribution snapshots
Number of cross-border funds 11,732Compound annual growth rate over 10 years 7.1%
Number of cross-border registrations 96,548Compound annual growth rate over 10 years 8.3%
Top target market for distribution, AmericasTotal number of new registrations
21Curaçao
Top target market for distribution, EuropeTotal number of new registrations
684United Kingdom
Cross-border distributionDomicile share of authorisationsfor cross-border distribution
63.6% Luxembourg
Top target market for distribution, Asia PacificTotal number of new registrations
169Singapore
Top target market for distribution, Middle EastTotal number of new registrations
6Saudi Arabia
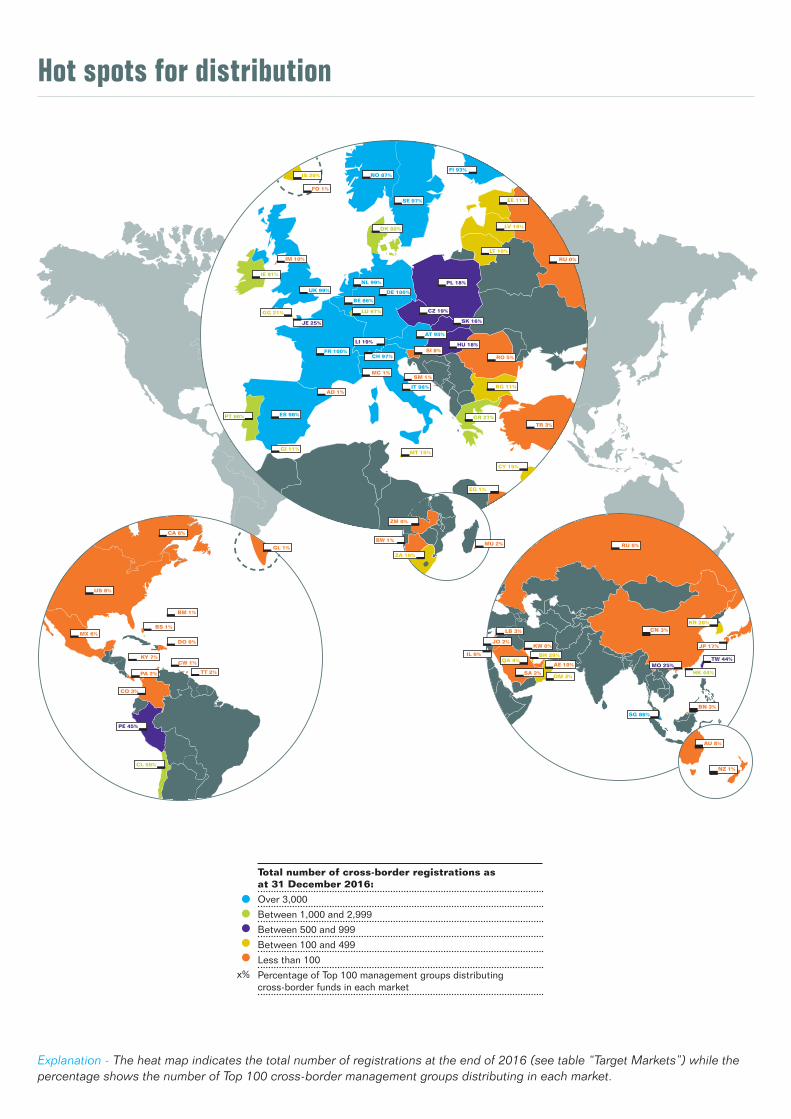
Hot spots for distribution
Total number of cross-border registrations as at 31 December 2016:
Over 3,000
Between 1,000 and 2,999
Between 500 and 999
Between 100 and 499
Less than 100
Percentage of Top 100 management groups distributing cross-border funds in each market
x%
Explanation - The heat map indicates the total number of registrations at the end of 2016 (see table “Target Markets”) while the percentage shows the number of Top 100 cross-border management groups distributing in each market.
TT 2%
CW 1%
MX 6%
US 8%
PA 2%
CO 3%
KY 7%
DO 0%
BS 1%
BM 1%
CL 59%
PE 45%
CA 6%
GL 1%
HK 44%
SG 86%
MO 25%
KR 28%
JP 17%
BH 29%
SA 2%OM 3%
QA 4%
KW 0%
AE 10%
JO 2%
LB 3%
IL 0%TW 44%
RU 0%
AU 8%
BN 3%
NZ 1%
CN 3%
JE 25%
GG 21%
CH 97%
LI 19%
DE 100%
AT 95%
FR 100%
MC 1%SM 1%
NL 99%
UK 99%
ES 98%
GI 11%
IT 98%
SE 97%
DK 80%
FI 93%NO 87%
BE 86%
LU 97%
PT 60%
CZ 19%
SK 16%
GR 27%
IE 81%
PL 18%
EE 11%
LV 10%
RU 0%
LT 10%
IS 20%
HU 18%
MT 15%
IM 10%
FO 1%
BG 11%
RO 5%
TR 3%
SI 8%
MU 2%
AD 1%
ZA 10%
BW 1%
ZM 0%
CY 15%
EG 1%
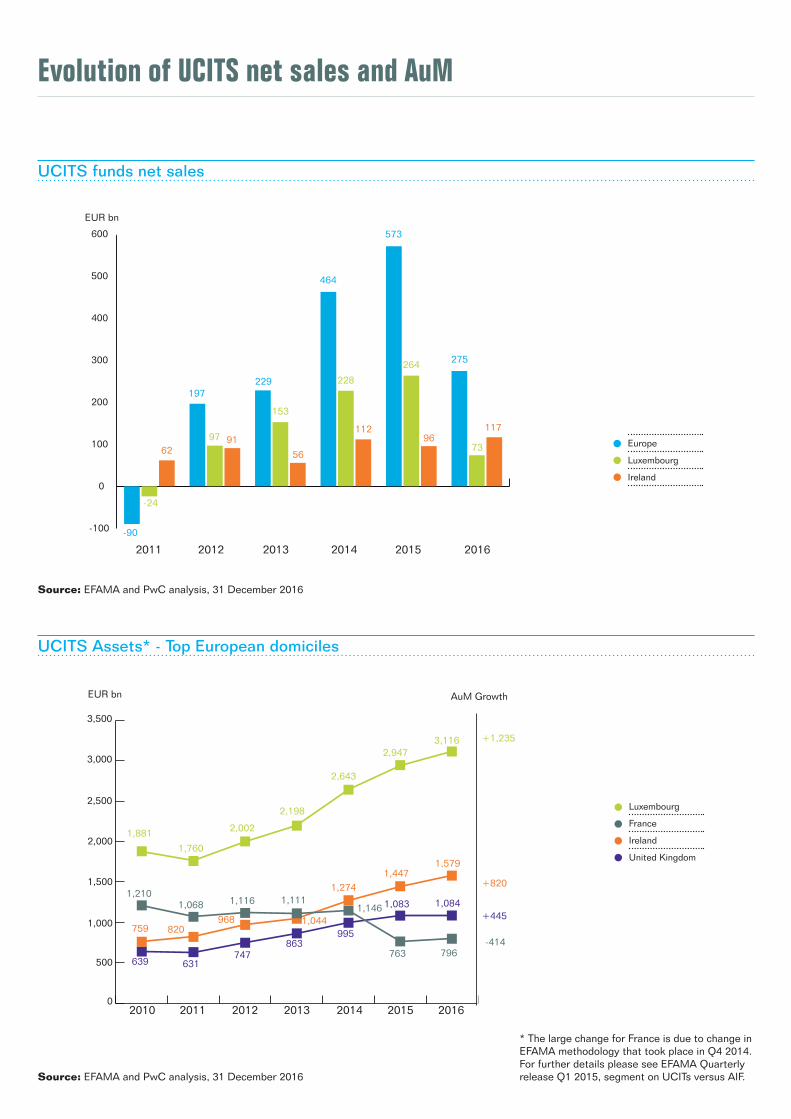
Evolution of UCITS net sales and AuM
Source: EFAMA and PwC analysis, 31 December 2016
Source: EFAMA and PwC analysis, 31 December 2016
* The large change for France is due to change in EFAMA methodology that took place in Q4 2014. For further details please see EFAMA Quarterly release Q1 2015, segment on UCITs versus AIF.
UCITS funds net sales
Europe
Luxembourg
Ireland
-100
0
100
200
300
400
500
600EUR bn
0
200
400
300
100
500
600
-100
2011 2012 2013 2014 2015 2016
-90
197229
464
573
275
-24
97
153
228
264
736291
56
11296
117
UCITS Assets* - Top European domiciles
Luxembourg
France
Ireland
United Kingdom
2010 2011 2012 2013 2014 2015 2016
1,500
2,500
3,000
3,500
0
500
2,000
1,000 759
1,210
1,760
2,002
2,198
1,881
639 631747
863995
1,083 1,084
2,643
2,9473,116
1,4471,579
1,068 1,116 1,1111,146
763 796
820968 1,044
1,274
+1,235
-414
+820
+445
EUR bn AuM Growth
Evolution of cross-border distribution
Top 5 destinations of leading fund domiciles:
Sources: Lipper LIM and PwC analysis, 31 December 2016 Note: Only true cross-border funds were taken into account - i.e. funds distributed in at least three countries, including their domicile
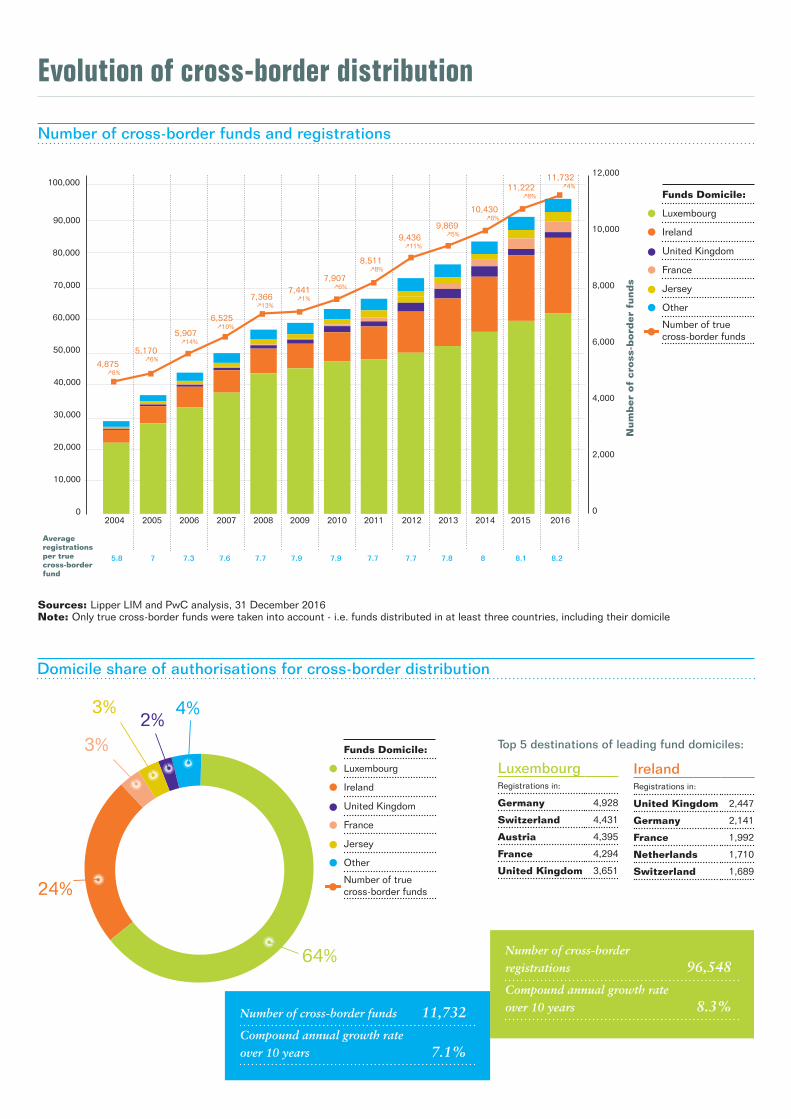
Number of cross-border funds and registrations
Average registrations per true cross-border fund
5.8 7 7.3 7.6 7.7 7.9 7.9 7.7 7.7 7.8 8 8.1 8.2
Num
ber
of
cross
-bord
er
fund
s
0
20,000
40,000
30,000
10,000
60,000
80,000
70,000
50,000
90,000
100,000
2007 2008 2009 2010 2011 2012 2013 2014 2015 20162004 2005 2006
8,000
10,000
6,000
4,000
2,000
0
12,000
7,9076%7,441
1%
8,5118%
9,43611%
7,36613%
6,52510%
5,90714%
9,8695%
10,4306%
11,2228%
11,7324%
5,1706%
4,8758%
Funds Domicile:
Luxembourg
Ireland
United Kingdom
France
Jersey
Other
Number of true cross-border funds
IrelandRegistrations in:
United Kingdom 2,447
Germany 2,141
France 1,992
Netherlands 1,710
Switzerland 1,689
LuxembourgRegistrations in:
Germany 4,928
Switzerland 4,431
Austria 4,395
France 4,294
United Kingdom 3,651
Funds Domicile:
Luxembourg
Ireland
United Kingdom
France
Jersey
Other
Number of true cross-border funds
Domicile share of authorisations for cross-border distribution
64%
3%
24%
3% 2%
4%
Number of cross-border registrations 96,548
Compound annual growth rate over 10 years 8.3%Number of cross-border funds 11,732
Compound annual growth rate over 10 years 7.1%
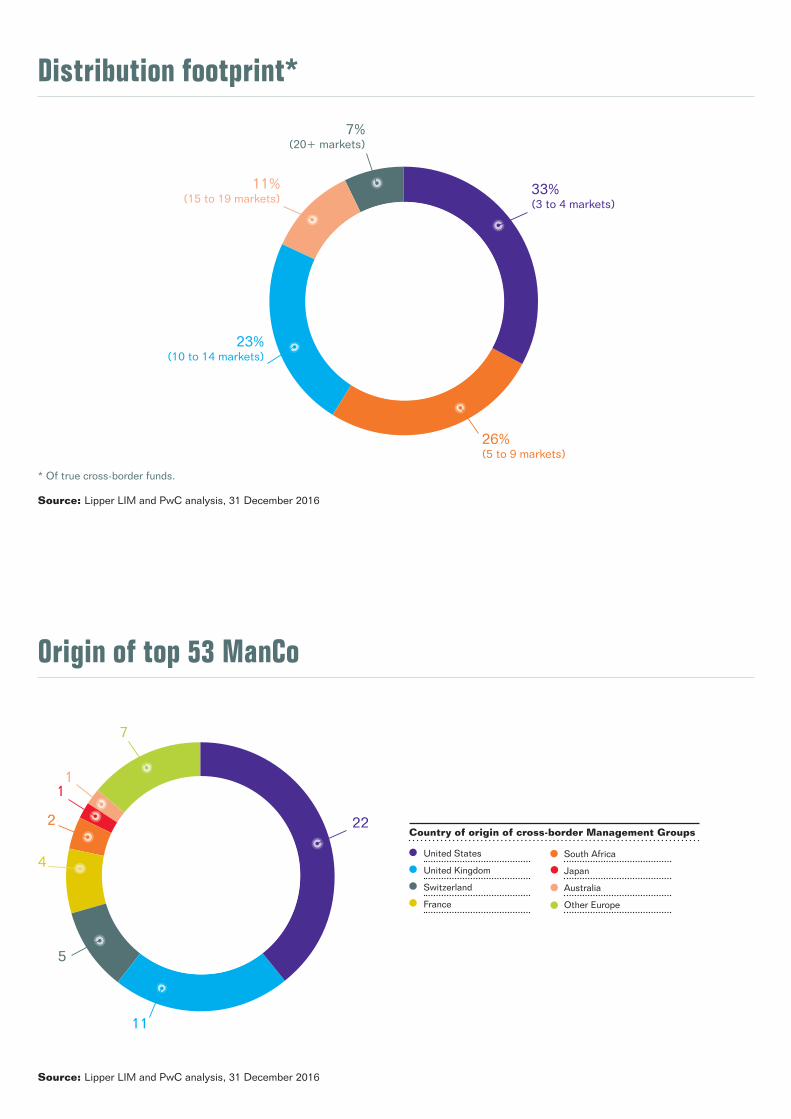
Distribution footprint*
* Of true cross-border funds.
Source: Lipper LIM and PwC analysis, 31 December 2016
Origin of top 53 ManCo
Source: Lipper LIM and PwC analysis, 31 December 2016
33% (3 to 4 markets)
7%(20+ markets)
26% (5 to 9 markets)
11%(15 to 19 markets)
23%(10 to 14 markets)
United States
United Kingdom
Switzerland
France
South Africa
Japan
Australia
Other Europe
Country of origin of cross-border Management Groups22
7
11
2
4
5
11
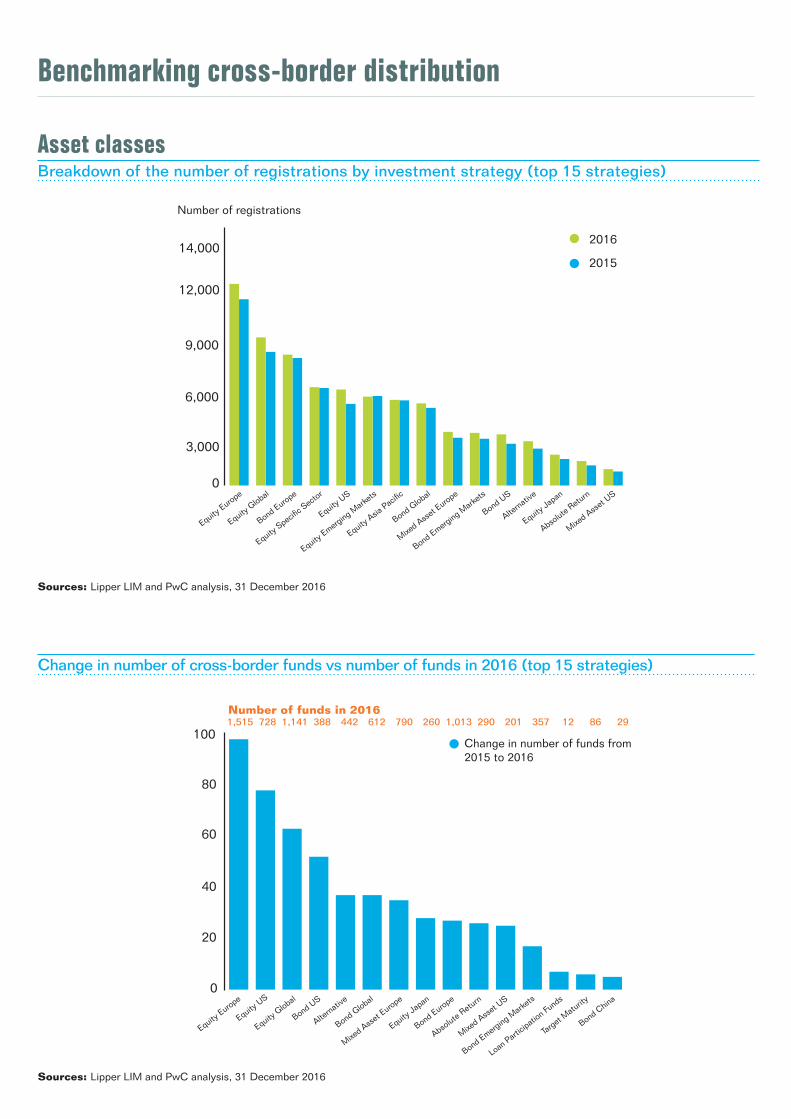
Benchmarking cross-border distribution
Asset classes
Sources: Lipper LIM and PwC analysis, 31 December 2016
Sources: Lipper LIM and PwC analysis, 31 December 2016
Change in number of funds from 2015 to 2016
Breakdown of the number of registrations by investment strategy (top 15 strategies)
0
3000
6000
9000
12000
15000
3,000
0
Number of registrations
Equity Europe
Equity G
lobal
Bond Europe
Equity Specifi
c Secto
r
Equity U
S
Equity Emerging M
arkets
Equity Asia
Pacific
Bond Global
Mixed Asse
t Europe
Bond Emerging Mark
ets
Bond US
Alternati
ve
Equity Jap
an
Absolute Return
Mixed Asse
t US
14,000
12,000
9,000
6,000
2016
2015
Change in number of cross-border funds vs number of funds in 2016 (top 15 strategies)
0
20
40
60
80
100
0
20
40
60
80
100
Equity G
lobal
Equity Europe
Equity U
S
Mixed Asse
t Europe
Alternati
ve
Bond Global
Bond Europe
Absolute Return
Bond US
Target M
aturity
Bond China
Mixed Asse
t US
Bond Emerging Mark
ets
Equity Jap
an
Loan Part
icipati
on Funds
1,515 728 1,141 388 442 612 790 260 1,013 290 201 357 12 86 29Number of funds in 2016
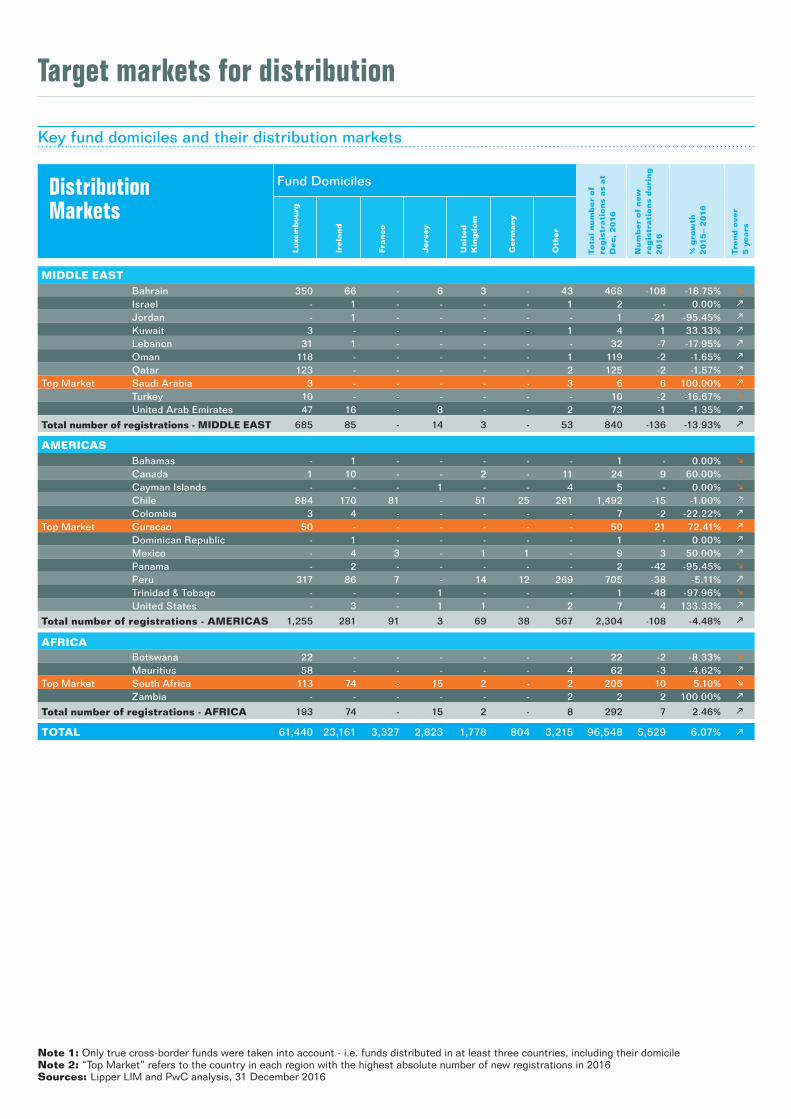
Target markets for distribution
Note 1: Only true cross-border funds were taken into account - i.e. funds distributed in at least three countries, including their domicileNote 2: “Top Market” refers to the country in each region with the highest absolute number of new registrations in 2016Sources: Lipper LIM and PwC analysis, 31 December 2016
Key fund domiciles and their distribution markets
Distribution Markets
Fund Domiciles
Tota
l n
um
ber
of
reg
istr
ati
on
s as
at
Dec, 2
016
Nu
mb
er
of
new
re
gis
trati
on
s d
uri
ng
2
016
% g
row
th
20
15
– 2
016
Tre
nd
ove
r 5
years
Luxe
mbourg
Irela
nd
France
Jers
ey
Unit
ed
K
ing
dom
Germ
any
Oth
er
EUROPEAndorra 12 - - - - - - 12 - 0.00% Austria 4,395 1,627 251 10 120 174 209 6,786 310 4.79% Belgium 2,363 465 135 83 64 24 19 3,153 263 9.10% Bulgaria 136 12 - - 1 - 9 158 11 7.48% Cyprus 338 20 - - 2 - 1 361 -77 -17.58% Czech Republic 593 12 - - 1 1 122 729 34 4.89% Denmark 1,750 773 56 228 78 20 15 2,920 324 12.48% Estonia 373 1 - - 1 - 12 387 -24 -5.84% Faroe Islands 3 - - - - - - 3 - 0.00% Finland 2,627 1,118 100 225 64 21 98 4,253 321 8.16% France 4,294 1,992 - 399 166 77 166 7,094 616 9.51% Germany 4,928 2,141 537 421 124 - 351 8,502 282 3.43% Gibraltar 294 36 - 2 - - 12 344 53 18.21% Greece 998 61 3 - 3 - 1 1,066 48 4.72% Greenland 8 - - - - - - 8 - 0.00% Guernsey 281 127 - 7 78 - - 493 13 2.71% Hungary 551 7 - - 1 - 19 578 31 5.67% Iceland 392 39 - - 1 7 2 441 58 15.14% Ireland 1,621 - 22 184 137 - 37 2,001 133 7.12% Isle of Man 43 38 - 5 4 - - 90 5 5.88% Italy 3,504 1,424 395 311 73 55 63 5,825 486 9.10% Jersey 617 136 - - 77 - 7 837 71 9.27% Latvia 315 - - - 1 - 25 341 -33 -8.82% Liechtenstein 788 130 - - - 8 45 971 68 7.53% Lithuania 283 1 - - 1 - 10 295 -12 -3.91% Luxembourg - 1,499 169 - 81 45 207 2,001 136 7.29% Malta 214 21 - 2 2 - 1 240 9 3.90% Monaco 2 2 - - - - 1 5 1 25.00% Netherlands 3,395 1,710 307 139 96 66 112 5,825 320 5.81% Norway 2,270 854 42 97 36 21 92 3,412 235 7.40% Poland 527 6 - - 1 - 21 555 35 6.73% Portugal 1,261 312 13 137 51 4 - 1,778 81 4.77% Romania 23 1 - - 1 - 4 29 13 81.25% Russian Federation - 1 - - - - - 1 1 100.00% San Marino 1 - - - - - - 1 1 100.00% Slovakia 459 16 1 - 2 1 103 582 34 6.20% Slovenia 33 1 - - 2 - 23 59 -1 -1.67% Spain 3,583 1,364 291 177 89 46 70 5,620 508 9.94% Sweden 3,091 1,446 94 178 66 21 102 4,998 336 7.21% Switzerland 4,431 1,689 365 - 143 132 198 6,958 135 1.98%
Top Market United Kingdom 3,651 2,447 392 149 - 22 81 6,742 684 11.29%
Total number of registrations - EUROPE 54,448 21,529 3,173 2,754 1,567 745 2,238 86,454 5,509 6.81%
ASIA PACIFIC
Australia 5 18 - 1 1 - 21 46 1 2.22% Brunei Darussalam 82 - - - - - - 82 32 64.00% China - - - - - - 3 3 3 100.00% Hong Kong 887 210 - - 38 3 37 1,175 -2 -0.17% Japan 59 10 - 21 - 4 11 105 10 10.53% Korea 433 35 - - 3 1 - 472 54 12.92% Macau 599 131 - - 6 - 62 798 -25 -3.04% New Zealand 1 1 - - 1 - 1 4 2 100.00% =
Top Market Singapore 2,147 648 60 15 78 5 196 3,149 169 5.67% Taiwan 646 139 3 - 10 8 18 824 13 1.60%
Total number of registrations - ASIA PACIFIC 4,859 1,192 63 37 137 21 349 6,658 257 4.01%
Note 1: Only true cross-border funds were taken into account - i.e. funds distributed in at least three countries, including their domicileNote 2: “Top Market” refers to the country in each region with the highest absolute number of new registrations in 2016Sources: Lipper LIM and PwC analysis, 31 December 2016
Target markets for distribution
Key fund domiciles and their distribution markets
Distribution Markets
Fund Domiciles
Tota
l n
um
ber
of
reg
istr
ati
on
s as
at
Dec, 2
016
Nu
mb
er
of
new
re
gis
trati
on
s d
uri
ng
2
016
% g
row
th
20
15
– 2
016
Tre
nd
ove
r 5
years
Luxe
mbourg
Irela
nd
France
Jers
ey
Unit
ed
K
ing
dom
Germ
any
Oth
er
MIDDLE EASTBahrain 350 66 - 6 3 - 43 468 -108 -18.75% Israel - 1 - - - - 1 2 - 0.00% Jordan - 1 - - - - - 1 -21 -95.45% Kuwait 3 - - - - - 1 4 1 33.33% Lebanon 31 1 - - - - - 32 -7 -17.95% Oman 118 - - - - - 1 119 -2 -1.65% Qatar 123 - - - - - 2 125 -2 -1.57%
Top Market Saudi Arabia 3 - - - - - 3 6 6 100.00% Turkey 10 - - - - - - 10 -2 -16.67% United Arab Emirates 47 16 - 8 - - 2 73 -1 -1.35%
Total number of registrations - MIDDLE EAST 685 85 - 14 3 - 53 840 -136 -13.93%
AMERICASBahamas - 1 - - - - - 1 - 0.00% Canada 1 10 - - 2 - 11 24 9 60.00% Cayman Islands - - - 1 - - 4 5 - 0.00% Chile 884 170 81 - 51 25 281 1,492 -15 -1.00% Colombia 3 4 - - - - - 7 -2 -22.22%
Top Market Curacao 50 - - - - - - 50 21 72.41% Dominican Republic - 1 - - - - - 1 - 0.00% Mexico - 4 3 - 1 1 - 9 3 50.00% Panama - 2 - - - - - 2 -42 -95.45% Peru 317 86 7 - 14 12 269 705 -38 -5.11% Trinidad & Tobago - - - 1 - - - 1 -48 -97.96% United States - 3 - 1 1 - 2 7 4 133.33%
Total number of registrations - AMERICAS 1,255 281 91 3 69 38 567 2,304 -108 -4.48%
AFRICABotswana 22 - - - - - - 22 -2 -8.33% Mauritius 58 - - - - - 4 62 -3 -4.62%
Top Market South Africa 113 74 - 15 2 - 2 206 10 5.10% Zambia - - - - - - 2 2 2 100.00%
Total number of registrations - AFRICA 193 74 - 15 2 - 8 292 7 2.46%
TOTAL 61,440 23,161 3,327 2,823 1,778 804 3,215 96,548 5,529 6.07%
Sources: Lipper LIM and PwC analysis, 31 December 2016 Note: Refer to the map for country codes
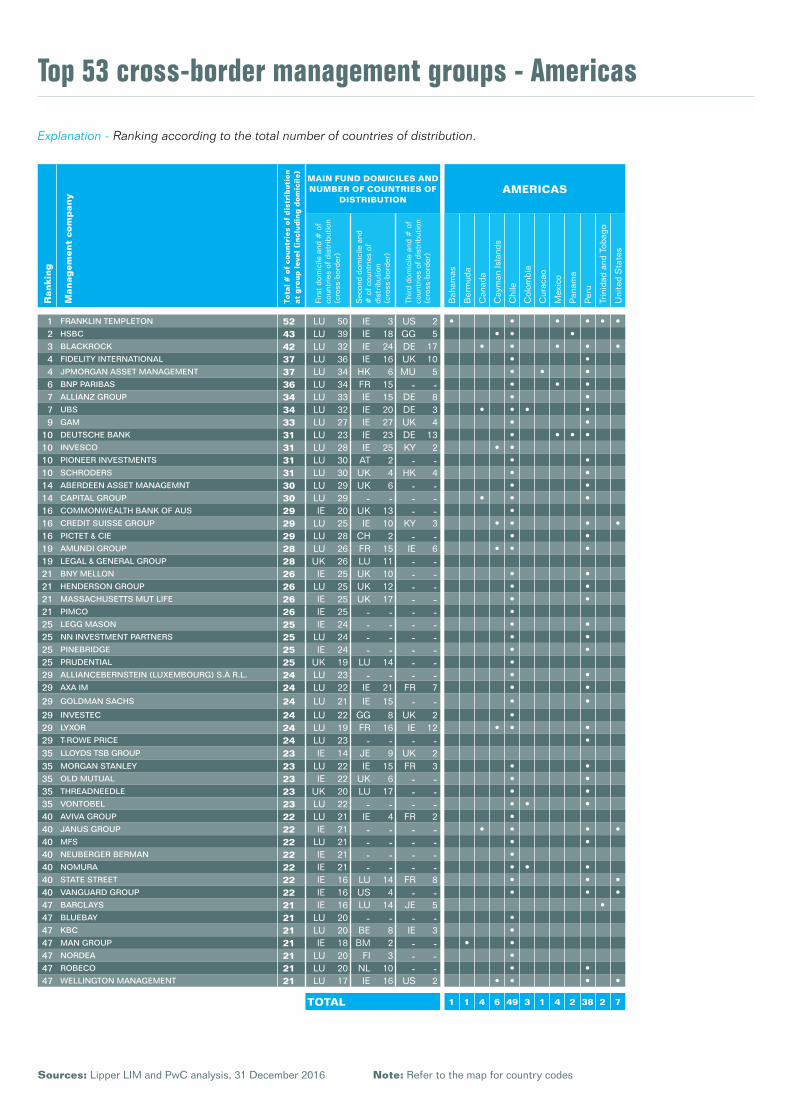
Top 53 cross-border management groups - Americas
Explanation - Ranking according to the total number of countries of distribution.
Rankin
g
Manag
em
ent
com
pany
Tota
l # o
f co
untr
ies
of d
istr
ibut
ion
at g
roup
lev
el (
incl
udin
g d
omic
ile) MAIN FUND DOMICILES AND
NUMBER OF COUNTRIES OF DISTRIBUTION
AMERICAS
Firs
t do
mic
ile a
nd #
of
coun
trie
s of
dis
trib
utio
n (c
ross
-bor
der)
Sec
ond
dom
icile
and
#
of
coun
trie
s of
di
stri
butio
n(c
ross
-bor
der)
Third
dom
icile
and
# o
f co
untr
ies
of d
istr
ibut
ion
(cro
ss-b
orde
r)
Bah
amas
Ber
mud
a
Can
ada
Cay
man
Isla
nds
Chi
le
Col
ombi
a
Cur
acao
Mex
ico
Pan
ama
Peru
Trin
idad
and
Tob
ago
Uni
ted
Sta
tes
1 FRANKLIN TEMPLETON 52 LU 50 IE 3 US 2 • • • • • •2 HSBC 43 LU 39 IE 18 GG 5 • • •3 BLACKROCK 42 LU 32 IE 24 DE 17 • • • • •4 FIDELITY INTERNATIONAL 37 LU 36 IE 16 UK 10 • •4 JPMORGAN ASSET MANAGEMENT 37 LU 34 HK 6 MU 5 • • •6 BNP PARIBAS 36 LU 34 FR 15 - - • • •7 ALLIANZ GROUP 34 LU 33 IE 15 DE 8 • •7 UBS 34 LU 32 IE 20 DE 3 • • • •9 GAM 33 LU 27 IE 27 UK 4 • •
10 DEUTSCHE BANK 31 LU 23 IE 23 DE 13 • • • •10 INVESCO 31 LU 28 IE 25 KY 2 • •10 PIONEER INVESTMENTS 31 LU 30 AT 2 - - • •10 SCHRODERS 31 LU 30 UK 4 HK 4 • •14 ABERDEEN ASSET MANAGEMNT 30 LU 29 UK 6 - - • •14 CAPITAL GROUP 30 LU 29 - - - - • • •16 COMMONWEALTH BANK OF AUS 29 IE 20 UK 13 - - •16 CREDIT SUISSE GROUP 29 LU 25 IE 10 KY 3 • • • •16 PICTET & CIE 29 LU 28 CH 2 - - • •19 AMUNDI GROUP 28 LU 26 FR 15 IE 6 • • •19 LEGAL & GENERAL GROUP 28 UK 26 LU 11 - -21 BNY MELLON 26 IE 25 UK 10 - - • •21 HENDERSON GROUP 26 LU 25 UK 12 - - • •21 MASSACHUSETTS MUT LIFE 26 IE 25 UK 17 - - • •21 PIMCO 26 IE 25 - - - - •25 LEGG MASON 25 IE 24 - - - - • •25 NN INVESTMENT PARTNERS 25 LU 24 - - - - • •25 PINEBRIDGE 25 IE 24 - - - - • •25 PRUDENTIAL 25 UK 19 LU 14 - - •29 ALLIANCEBERNSTEIN (LUXEMBOURG) S.À R.L. 24 LU 23 - - - - • •29 AXA IM 24 LU 22 IE 21 FR 7 • •29 GOLDMAN SACHS 24 LU 21 IE 15 - - • •29 INVESTEC 24 LU 22 GG 8 UK 2 •29 LYXOR 24 LU 19 FR 16 IE 12 • • •29 T-ROWE PRICE 24 LU 23 - - - - •35 LLOYDS TSB GROUP 23 IE 14 JE 9 UK 235 MORGAN STANLEY 23 LU 22 IE 15 FR 3 • •35 OLD MUTUAL 23 IE 22 UK 6 - - • •35 THREADNEEDLE 23 UK 20 LU 17 - - • •35 VONTOBEL 23 LU 22 - - - - • • •40 AVIVA GROUP 22 LU 21 IE 4 FR 2 •40 JANUS GROUP 22 IE 21 - - - - • • • •40 MFS 22 LU 21 - - - - • •40 NEUBERGER BERMAN 22 IE 21 - - - - •40 NOMURA 22 IE 21 - - - - • • •40 STATE STREET 22 IE 16 LU 14 FR 8 • • •40 VANGUARD GROUP 22 IE 16 US 4 - - • • •47 BARCLAYS 21 IE 16 LU 14 JE 5 •47 BLUEBAY 21 LU 20 - - - - •47 KBC 21 LU 20 BE 8 IE 3 •47 MAN GROUP 21 IE 18 BM 2 - - • •47 NORDEA 21 LU 20 FI 3 - - •47 ROBECO 21 LU 20 NL 10 - - • •47 WELLINGTON MANAGEMENT 21 LU 17 IE 16 US 2 • • • •
TOTAL 1 1 4 6 49 3 1 4 2 38 2 7
Rankin
g
Manag
em
ent
com
pany
Tota
l # o
f co
untr
ies
of d
istr
ibut
ion
at g
roup
lev
el (
incl
udin
g d
omic
ile) MAIN FUND DOMICILES AND
NUMBER OF COUNTRIES OF DISTRIBUTION
EUROPE
Firs
t do
mic
ile a
nd #
of
coun
trie
s of
dis
trib
utio
n (c
ross
-bor
der)
Sec
ond
dom
icile
and
#
of
coun
trie
s of
di
stri
butio
n(c
ross
-bor
der)
Third
dom
icile
and
# o
f co
untr
ies
of d
istr
ibut
ion
(cro
ss-b
orde
r)
And
orra
Aus
tria
Bel
gium
Bul
gari
a
Cyp
rus
Cze
ch R
epub
lic
Den
mar
k
Est
onia
Finl
and
Fran
ce
Ger
man
y
Gib
ralta
r
Gre
ece
Gue
rnse
y
Hun
gary
Icel
and
Irel
and
Isle
of
Man
Ital
y
Jers
ey
Latv
ia
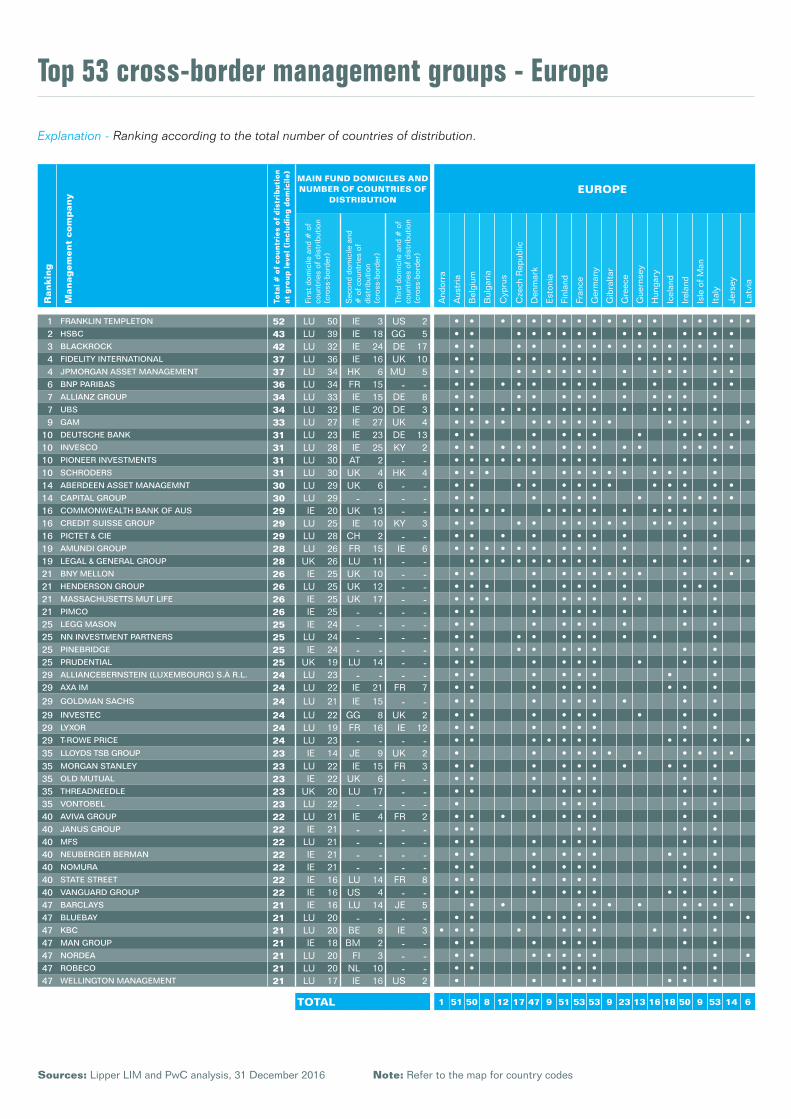
1 FRANKLIN TEMPLETON 52 LU 50 IE 3 US 2 • • • • • • • • • • • • • • • • • •2 HSBC 43 LU 39 IE 18 GG 5 • • • • • • • • • • • • • • •3 BLACKROCK 42 LU 32 IE 24 DE 17 • • • • • • • • • • • • • • • •4 FIDELITY INTERNATIONAL 37 LU 36 IE 16 UK 10 • • • • • • • • • • • • •4 JPMORGAN ASSET MANAGEMENT 37 LU 34 HK 6 MU 5 • • • • • • • • • • • • • •6 BNP PARIBAS 36 LU 34 FR 15 - - • • • • • • • • • • • • •7 ALLIANZ GROUP 34 LU 33 IE 15 DE 8 • • • • • • • • • • • •7 UBS 34 LU 32 IE 20 DE 3 • • • • • • • • • • • • •9 GAM 33 LU 27 IE 27 UK 4 • • • • • • • • • • • • • •
10 DEUTSCHE BANK 31 LU 23 IE 23 DE 13 • • • • • • • • • • •10 INVESCO 31 LU 28 IE 25 KY 2 • • • • • • • • • • • • • •10 PIONEER INVESTMENTS 31 LU 30 AT 2 - - • • • • • • • • • • • • •10 SCHRODERS 31 LU 30 UK 4 HK 4 • • • • • • • • • • • • •14 ABERDEEN ASSET MANAGEMNT 30 LU 29 UK 6 - - • • • • • • • • • • • • •14 CAPITAL GROUP 30 LU 29 - - - - • • • • • • • • • • • •16 COMMONWEALTH BANK OF AUS 29 IE 20 UK 13 - - • • • • • • • • • • • • •16 CREDIT SUISSE GROUP 29 LU 25 IE 10 KY 3 • • • • • • • • • • • • •16 PICTET & CIE 29 LU 28 CH 2 - - • • • • • • • • • •19 AMUNDI GROUP 28 LU 26 FR 15 IE 6 • • • • • • • • • • • •19 LEGAL & GENERAL GROUP 28 UK 26 LU 11 - - • • • • • • • • • • • • • •21 BNY MELLON 26 IE 25 UK 10 - - • • • • • • • • • • • •21 HENDERSON GROUP 26 LU 25 UK 12 - - • • • • • • • • • • •21 MASSACHUSETTS MUT LIFE 26 IE 25 UK 17 - - • • • • • • • • • • •21 PIMCO 26 IE 25 - - - - • • • • • • • • •25 LEGG MASON 25 IE 24 - - - - • • • • • • • • •25 NN INVESTMENT PARTNERS 25 LU 24 - - - - • • • • • • • • • •25 PINEBRIDGE 25 IE 24 - - - - • • • • • • • • •25 PRUDENTIAL 25 UK 19 LU 14 - - • • • • • • • • •29 ALLIANCEBERNSTEIN (LUXEMBOURG) S.À R.L. 24 LU 23 - - - - • • • • • • • •29 AXA IM 24 LU 22 IE 21 FR 7 • • • • • • • • •29 GOLDMAN SACHS 24 LU 21 IE 15 - - • • • • • • • • •29 INVESTEC 24 LU 22 GG 8 UK 2 • • • • • • • • •29 LYXOR 24 LU 19 FR 16 IE 12 • • • • • • • •29 T-ROWE PRICE 24 LU 23 - - - - • • • • • • • • • • •35 LLOYDS TSB GROUP 23 IE 14 JE 9 UK 2 • • • • • • • • • • •35 MORGAN STANLEY 23 LU 22 IE 15 FR 3 • • • • • • • • • •35 OLD MUTUAL 23 IE 22 UK 6 - - • • • • • • • •35 THREADNEEDLE 23 UK 20 LU 17 - - • • • • • • • •35 VONTOBEL 23 LU 22 - - - - • • • • • •40 AVIVA GROUP 22 LU 21 IE 4 FR 2 • • • • • • • • •40 JANUS GROUP 22 IE 21 - - - - • • • • • •40 MFS 22 LU 21 - - - - • • • • • • • •40 NEUBERGER BERMAN 22 IE 21 - - - - • • • • • • • • •40 NOMURA 22 IE 21 - - - - • • • • • • • •40 STATE STREET 22 IE 16 LU 14 FR 8 • • • • • • • • •40 VANGUARD GROUP 22 IE 16 US 4 - - • • • • • • • • •47 BARCLAYS 21 IE 16 LU 14 JE 5 • • • • • • • • • •47 BLUEBAY 21 LU 20 - - - - • • • • • • • • • •47 KBC 21 LU 20 BE 8 IE 3 • • • • • • • • • •47 MAN GROUP 21 IE 18 BM 2 - - • • • • • • • •47 NORDEA 21 LU 20 FI 3 - - • • • • • • • • •47 ROBECO 21 LU 20 NL 10 - - • • • • • • •47 WELLINGTON MANAGEMENT 21 LU 17 IE 16 US 2 • • • • • • • •
TOTAL 1 51 50 8 12 17 47 9 51 53 53 9 23 13 16 18 50 9 53 14 6
Sources: Lipper LIM and PwC analysis, 31 December 2016 Note: Refer to the map for country codes
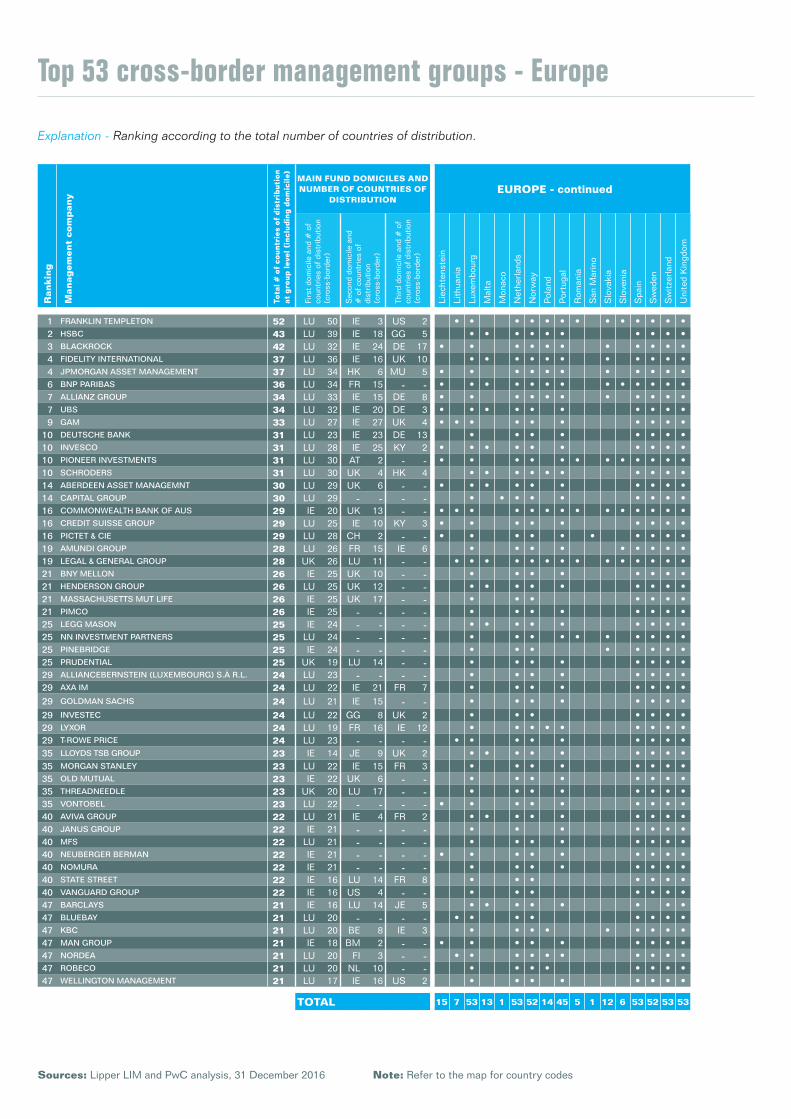
Top 53 cross-border management groups - Europe
Explanation - Ranking according to the total number of countries of distribution.
Top 53 cross-border management groups - EuropeR
ankin
g
Manag
em
ent
com
pany
Tota
l # o
f co
untr
ies
of d
istr
ibut
ion
at g
roup
lev
el (
incl
udin
g d
omic
ile) MAIN FUND DOMICILES AND
NUMBER OF COUNTRIES OF DISTRIBUTION
EUROPE - continued
Firs
t do
mic
ile a
nd #
of
coun
trie
s of
dis
trib
utio
n (c
ross
-bor
der)
Sec
ond
dom
icile
and
#
of
coun
trie
s of
di
stri
butio
n(c
ross
-bor
der)
Third
dom
icile
and
# o
f co
untr
ies
of d
istr
ibut
ion
(cro
ss-b
orde
r)
Liec
hten
stei
n
Lith
uani
a
Luxe
mbo
urg
Mal
ta
Mon
aco
Net
herl
ands
Nor
way
Pol
and
Por
tuga
l
Rom
ania
San
Mar
ino
Slo
vaki
a
Slo
veni
a
Spa
in
Sw
eden
Sw
itzer
land
Uni
ted
Kin
gdom
1 FRANKLIN TEMPLETON 52 LU 50 IE 3 US 2 • • • • • • • • • • • • •2 HSBC 43 LU 39 IE 18 GG 5 • • • • • • • • • •3 BLACKROCK 42 LU 32 IE 24 DE 17 • • • • • • • • • • •4 FIDELITY INTERNATIONAL 37 LU 36 IE 16 UK 10 • • • • • • • • • • •4 JPMORGAN ASSET MANAGEMENT 37 LU 34 HK 6 MU 5 • • • • • • • • • • •6 BNP PARIBAS 36 LU 34 FR 15 - - • • • • • • • • • • • • •7 ALLIANZ GROUP 34 LU 33 IE 15 DE 8 • • • • • • • • • • •7 UBS 34 LU 32 IE 20 DE 3 • • • • • • • • • •9 GAM 33 LU 27 IE 27 UK 4 • • • • • • • • • •
10 DEUTSCHE BANK 31 LU 23 IE 23 DE 13 • • • • • • • •10 INVESCO 31 LU 28 IE 25 KY 2 • • • • • • • • • •10 PIONEER INVESTMENTS 31 LU 30 AT 2 - - • • • • • • • • • • • •10 SCHRODERS 31 LU 30 UK 4 HK 4 • • • • • • • • • •14 ABERDEEN ASSET MANAGEMNT 30 LU 29 UK 6 - - • • • • • • • • • •14 CAPITAL GROUP 30 LU 29 - - - - • • • • • • • • •16 COMMONWEALTH BANK OF AUS 29 IE 20 UK 13 - - • • • • • • • • • • • • • •16 CREDIT SUISSE GROUP 29 LU 25 IE 10 KY 3 • • • • • • • • •16 PICTET & CIE 29 LU 28 CH 2 - - • • • • • • • • • •19 AMUNDI GROUP 28 LU 26 FR 15 IE 6 • • • • • • • • •19 LEGAL & GENERAL GROUP 28 UK 26 LU 11 - - • • • • • • • • • • • • • •21 BNY MELLON 26 IE 25 UK 10 - - • • • • • • • •21 HENDERSON GROUP 26 LU 25 UK 12 - - • • • • • • • • •21 MASSACHUSETTS MUT LIFE 26 IE 25 UK 17 - - • • • • • • •21 PIMCO 26 IE 25 - - - - • • • • • • • •25 LEGG MASON 25 IE 24 - - - - • • • • • • • • •25 NN INVESTMENT PARTNERS 25 LU 24 - - - - • • • • • • • • • •25 PINEBRIDGE 25 IE 24 - - - - • • • • • • • •25 PRUDENTIAL 25 UK 19 LU 14 - - • • • • • • • •29 ALLIANCEBERNSTEIN (LUXEMBOURG) S.À R.L. 24 LU 23 - - - - • • • • • • • •29 AXA IM 24 LU 22 IE 21 FR 7 • • • • • • • •29 GOLDMAN SACHS 24 LU 21 IE 15 - - • • • • • • • •29 INVESTEC 24 LU 22 GG 8 UK 2 • • • • • • •29 LYXOR 24 LU 19 FR 16 IE 12 • • • • • • • • •29 T-ROWE PRICE 24 LU 23 - - - - • • • • • • • • •35 LLOYDS TSB GROUP 23 IE 14 JE 9 UK 2 • • • • • • • • •35 MORGAN STANLEY 23 LU 22 IE 15 FR 3 • • • • • • • •35 OLD MUTUAL 23 IE 22 UK 6 - - • • • • • • • •35 THREADNEEDLE 23 UK 20 LU 17 - - • • • • • • • •35 VONTOBEL 23 LU 22 - - - - • • • • • • • • •40 AVIVA GROUP 22 LU 21 IE 4 FR 2 • • • • • • • • •40 JANUS GROUP 22 IE 21 - - - - • • • • • • •40 MFS 22 LU 21 - - - - • • • • • • • •40 NEUBERGER BERMAN 22 IE 21 - - - - • • • • • • • • •40 NOMURA 22 IE 21 - - - - • • • • • • • •40 STATE STREET 22 IE 16 LU 14 FR 8 • • • • • • •40 VANGUARD GROUP 22 IE 16 US 4 - - • • • • • • •47 BARCLAYS 21 IE 16 LU 14 JE 5 • • • • • • • •47 BLUEBAY 21 LU 20 - - - - • • • • • • • •47 KBC 21 LU 20 BE 8 IE 3 • • • • • • • • •47 MAN GROUP 21 IE 18 BM 2 - - • • • • • • • • •47 NORDEA 21 LU 20 FI 3 - - • • • • • • • • • •47 ROBECO 21 LU 20 NL 10 - - • • • • • • • •47 WELLINGTON MANAGEMENT 21 LU 17 IE 16 US 2 • • • • • • • •
TOTAL 15 7 53 13 1 53 52 14 45 5 1 12 6 53 52 53 53
Sources: Lipper LIM and PwC analysis, 31 December 2016 Note: Refer to the map for country codes
Explanation - Ranking according to the total number of countries of distribution.
Top 53 cross-border management groups - OthersR
ankin
g
Manag
em
ent
com
pany
Tota
l # o
f co
untr
ies
of d
istr
ibut
ion
at g
roup
lev
el (
incl
udin
g d
omic
ile) MAIN FUND DOMICILES AND
NUMBER OF COUNTRIES OF DISTRIBUTION
ASIA PACIFIC MIDDLE EAST AFRICA
Firs
t do
mic
ile a
nd #
of
coun
trie
s of
dis
trib
utio
n (c
ross
-bor
der)
Sec
ond
dom
icile
and
#
of
coun
trie
s of
di
stri
butio
n(c
ross
-bor
der)
Third
dom
icile
and
# o
f co
untr
ies
of d
istr
ibut
ion
(cro
ss-b
orde
r)
Aus
tral
ia
Bru
nei D
arus
sala
m
Chi
na
Hon
g K
ong
Japa
n
Kor
ea
Mac
au
Sin
gapo
re
Taiw
an
Bah
rain
Jord
an
Leba
non
Om
an
Qat
ar
Sau
di A
rabi
a
Turk
ey
Uni
ted
Ara
b E
mir
ates
Bot
swan
a
Egy
pt
Mau
ritiu
s
Sou
th A
fric
a
1 FRANKLIN TEMPLETON 52 LU 50 IE 3 US 2 • • • • • • • • • • • • • • •2 HSBC 43 LU 39 IE 18 GG 5 • • • • • • • • • • • • • • •3 BLACKROCK 42 LU 32 IE 24 DE 17 • • • • • • • • • •4 FIDELITY INTERNATIONAL 37 LU 36 IE 16 UK 10 • • • • • • • • • • •4 JPMORGAN ASSET MANAGEMENT 37 LU 34 HK 6 MU 5 • • • • • • • • •6 BNP PARIBAS 36 LU 34 FR 15 - - • • • • • • •7 ALLIANZ GROUP 34 LU 33 IE 15 DE 8 • • • • • • • • •7 UBS 34 LU 32 IE 20 DE 3 • • • • • • •9 GAM 33 LU 27 IE 27 UK 4 • • • • • • •
10 DEUTSCHE BANK 31 LU 23 IE 23 DE 13 • • • • • • • •10 INVESCO 31 LU 28 IE 25 KY 2 • • • • •10 PIONEER INVESTMENTS 31 LU 30 AT 2 - - • • • •10 SCHRODERS 31 LU 30 UK 4 HK 4 • • • • • •14 ABERDEEN ASSET MANAGEMNT 30 LU 29 UK 6 - - • • • • •14 CAPITAL GROUP 30 LU 29 - - - - • • • • • •16 COMMONWEALTH BANK OF AUS 29 IE 20 UK 13 - - •16 CREDIT SUISSE GROUP 29 LU 25 IE 10 KY 3 • • •16 PICTET & CIE 29 LU 28 CH 2 - - • • • • • • •19 AMUNDI GROUP 28 LU 26 FR 15 IE 6 • • • •19 LEGAL & GENERAL GROUP 28 UK 26 LU 11 - -21 BNY MELLON 26 IE 25 UK 10 - - • • • •21 HENDERSON GROUP 26 LU 25 UK 12 - - • • • •21 MASSACHUSETTS MUT LIFE 26 IE 25 UK 17 - - • • • • • •21 PIMCO 26 IE 25 - - - - • • • • • • • •25 LEGG MASON 25 IE 24 - - - - • • • • •25 NN INVESTMENT PARTNERS 25 LU 24 - - - - • • •25 PINEBRIDGE 25 IE 24 - - - - • • • • • •25 PRUDENTIAL 25 UK 19 LU 14 - - • • • • • • •29 ALLIANCEBERNSTEIN (LUXEMBOURG) S.À R.L. 24 LU 23 - - - - • • • • • •29 AXA IM 24 LU 22 IE 21 FR 7 • • • • •29 GOLDMAN SACHS 24 LU 21 IE 15 - - • • • • •29 INVESTEC 24 LU 22 GG 8 UK 2 • • • • • • •29 LYXOR 24 LU 19 FR 16 IE 12 • • • •29 T-ROWE PRICE 24 LU 23 - - - - • • •35 LLOYDS TSB GROUP 23 IE 14 JE 9 UK 2 • • •35 MORGAN STANLEY 23 LU 22 IE 15 FR 3 • • •35 OLD MUTUAL 23 IE 22 UK 6 - - • • • • •35 THREADNEEDLE 23 UK 20 LU 17 - - • • • • •35 VONTOBEL 23 LU 22 - - - - • • • • •40 AVIVA GROUP 22 LU 21 IE 4 FR 2 • • •40 JANUS GROUP 22 IE 21 - - - - • • • • •40 MFS 22 LU 21 - - - - • • • •40 NEUBERGER BERMAN 22 IE 21 - - - - • • •40 NOMURA 22 IE 21 - - - - • • •40 STATE STREET 22 IE 16 LU 14 FR 8 • • •40 VANGUARD GROUP 22 IE 16 US 4 - - • • •47 BARCLAYS 21 IE 16 LU 14 JE 5 • •47 BLUEBAY 21 LU 20 - - - - • •47 KBC 21 LU 20 BE 8 IE 3 •47 MAN GROUP 21 IE 18 BM 2 - - • •47 NORDEA 21 LU 20 FI 3 - - •47 ROBECO 21 LU 20 NL 10 - - • • • •47 WELLINGTON MANAGEMENT 21 LU 17 IE 16 US 2 •
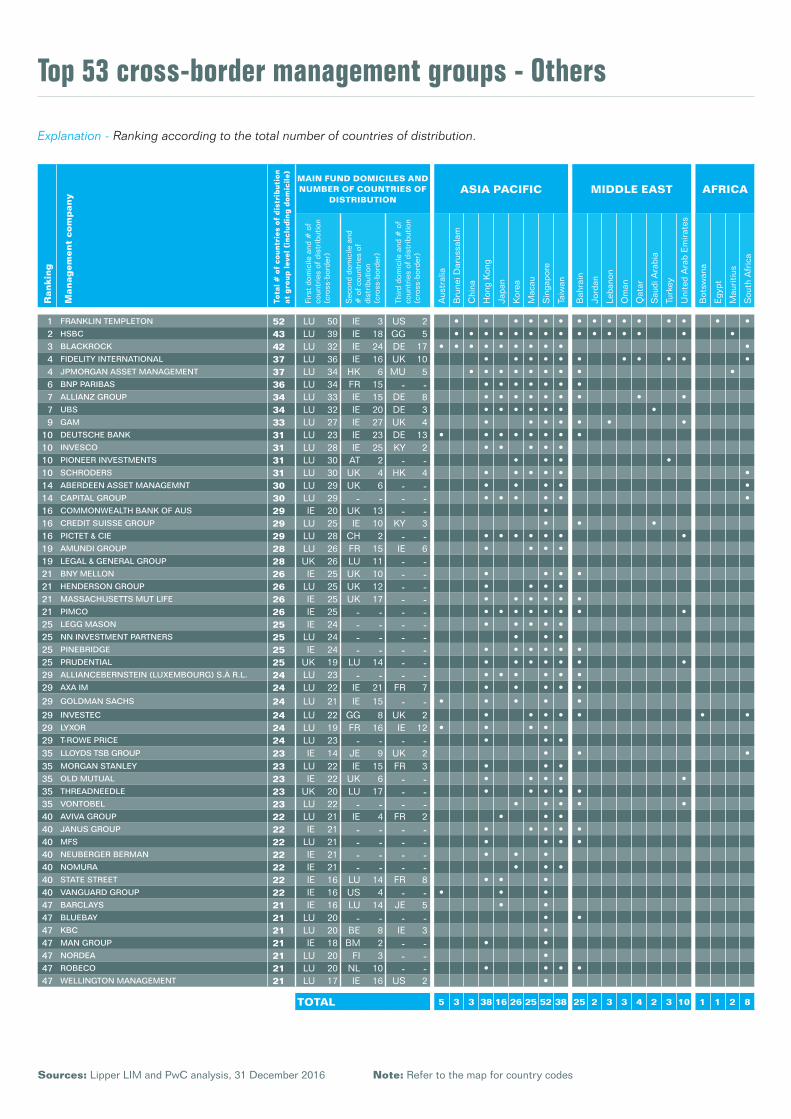
TOTAL 5 3 3 38 16 26 25 52 38 25 2 3 3 4 2 3 10 1 1 2 8
Sources: Lipper LIM and PwC analysis, 31 December 2016 Note: Refer to the map for country codes
Explanation - Ranking according to the total number of countries of distribution.
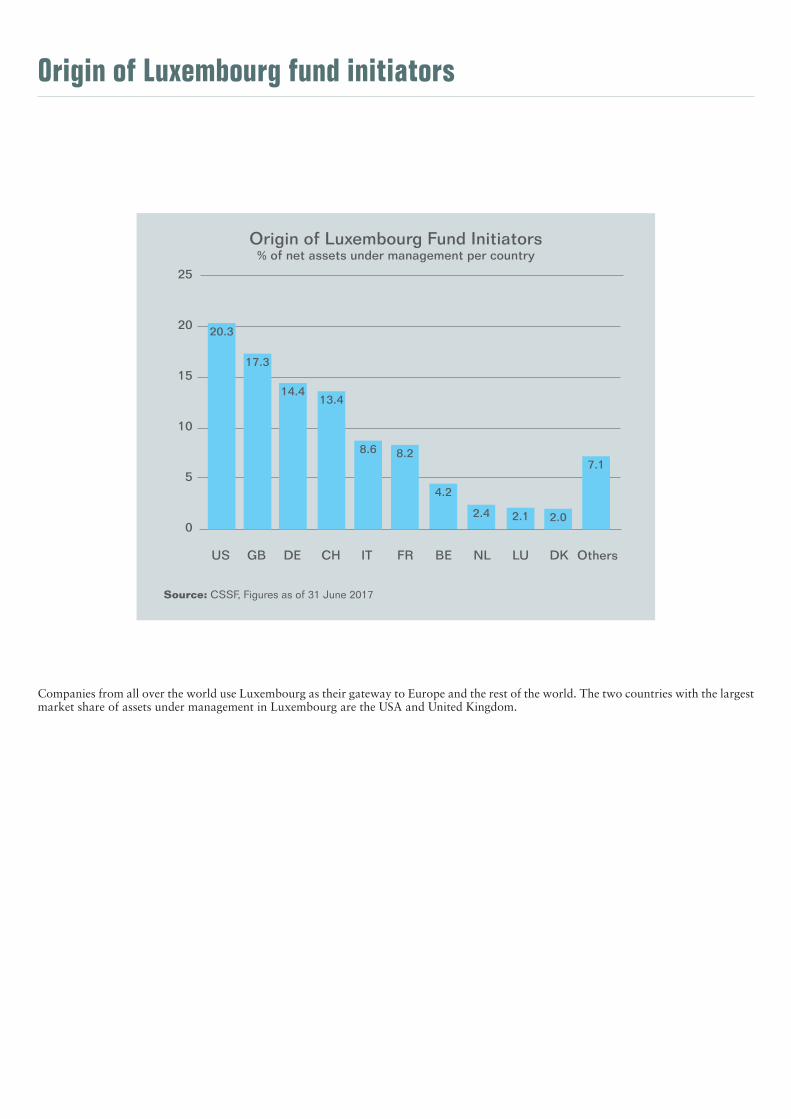
Origin of Luxembourg fund initiators
Companies from all over the world use Luxembourg as their gateway to Europe and the rest of the world. The two countries with the largest market share of assets under management in Luxembourg are the USA and United Kingdom.
Source: CSSF, Figures as of 31 June 2017
Origin of Luxembourg Fund Initiators% of net assets under management per country
25
20
15
10
5
0
US GB DE CH IT FR BE NL LU DK Others
4.2
2.4 2.1 2.0
20.3
17.3
7.1
14.413.4
8.6 8.2
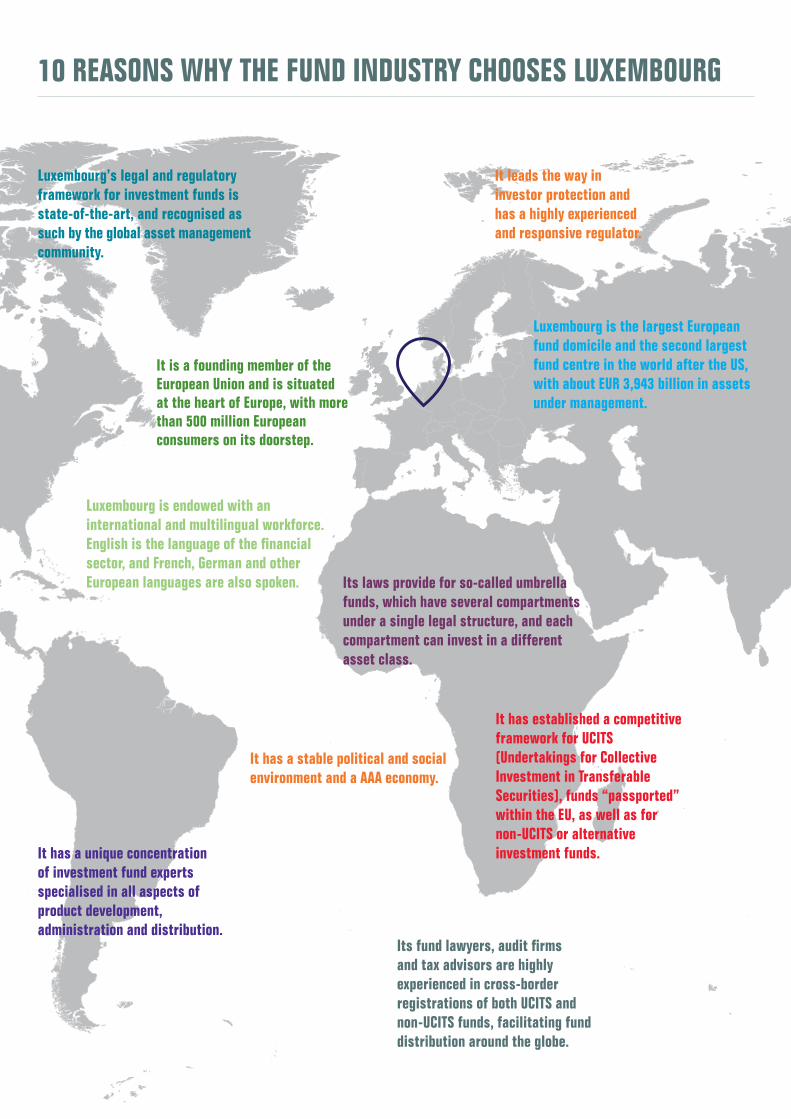
10 REASONS WHY THE FUND INDUSTRY CHOOSES LUXEMBOURG
It has a stable political and social environment and a AAA economy.
It is a founding member of the European Union and is situated at the heart of Europe, with more than 500 million European consumers on its doorstep.
Luxembourg is the largest European fund domicile and the second largest fund centre in the world after the US, with about EUR 3,943 billion in assets under management.
Its fund lawyers, audit firms and tax advisors are highly experienced in cross-border registrations of both UCITS and non-UCITS funds, facilitating fund distribution around the globe.
It has established a competitive framework for UCITS (Undertakings for Collective Investment in Transferable Securities), funds “passported” within the EU, as well as for non-UCITS or alternative investment funds.
It leads the way in investor protection and has a highly experienced and responsive regulator.
It has a unique concentration of investment fund experts specialised in all aspects of product development, administration and distribution.
Luxembourg is endowed with an international and multilingual workforce. English is the language of the financial sector, and French, German and other European languages are also spoken. Its laws provide for so-called umbrella
funds, which have several compartments under a single legal structure, and each compartment can invest in a different asset class.
Luxembourg’s legal and regulatory framework for investment funds is state-of-the-art, and recognised as such by the global asset management community.
About ALFI
The Association of the Luxembourg Fund Industry (ALFI), the representative body forthe Luxembourg investment fund community,was founded in 1988. Today it represents morethan 1 500 Luxembourg-domiciled investmentfunds, asset management companies and a widevariety of service providers including depositarybanks, fund administrators, transfer agents, distributors, law firms, consultants, tax advisers,auditors and accountants, specialist IT providersand communications agencies.Luxembourg is the largest fund domicilein Europe and its investment fund industryis a worldwide leader in cross-border funddistribution. Luxembourg-domiciledinvestment structures are distributed inmore than 70 countries around the globe,with a particular focus on Europe, Asia,Latin America and the Middle East.ALFI defines its mission as to “Lead industryefforts to make Luxembourg the mostattractive international centre”.
Its main objectives are to:
n Help members capitalise on industry trends ALFI’s many technical committees and working
groups constantly review and analyse developments worldwide, as well as legal and regulatory changes in Luxembourg, the EU and beyond, to identify threats and opportunities for the Luxembourg fund industry.
n Shape regulation An up-to-date, innovative legal and fiscal
environment is critical to defend and improve Luxembourg’s competitive position as a centre for the domiciliation, administration and distribution of investment funds. Strong relationships with regulatory authorities, the government and the legislative body enable ALFI to make an effective contribution to decisionmaking through relevant input for changes to the regulatory framework, implementation of European directives and regulation of new products or services.
n Foster dedication to professional standards, integrity and quality
Investor trust is essential for success in
collective investment services and ALFI thus does all it can to promote high professional standards, quality products and services, and integrity. Action in this area includes organising training at all levels, defining codes of conduct, transparency and good corporate governance, and supporting initiatives to combat money laundering.
n Promote the Luxembourg investment fund industry
ALFI actively promotes the Luxembourg
investment fund industry, its products and its services. It represents the sector in financial and in economic missions organised by the Luxembourg government around the world and takes an active part in meetings of the global fund industry.
ALFI is an active member of the European
Fund and Asset Management Association, of the International Investment Funds Association, of Pensions Europe, of the International Association of Pension Funds Administrators and of the Global Impact Investing Network.
For more information, visit our website: www.alfi.lu and follow ALFI on

Tel: +352 22 30 26 - 1Fax: +352 22 30 93
alfi | association of theluxembourg fund industry
12, rue ErasmeL- 1468 Luxembourg
September 2017 © 2017 ALFI. All rights reserved.
ALFI thanks PwC Luxembourg, which produced the content of this document in association with Lipper and Thomson Reuters, for its authorisation to reprint. PwC Luxembourg is a member of ALFI.For further information, please contact us or visit our website www.alfi.lu


![Hitachi Metals Financial Results for Fiscal Year …[7.1% ] 20.1 [7.7%] 28.0 +7.9 and the consolidation of Waupaca Foundry, Inc., among other factors. Segment operating income Techno,](https://static.fdocuments.us/doc/165x107/5f0e89bf7e708231d43fb9b1/hitachi-metals-financial-results-for-fiscal-year-71-201-77-280-79-and.jpg)