GLOBAL FORUM ON TRADE TRADE AND CLIMATE CHANGE
41
GLOBAL FORUM ON TRADE TRADE AND CLIMATE CHANGE Paris, 9 and 10 June 2009 COUNTING CARBON IN THE MARKETPLACE: PART I – OVERVIEW PAPER by Simon Bolwig, DTU Climate Centre Risø, Technical University of Denmark and Peter Gibbon, Senior Researcher, Head of research unit on Trade and development, Danish Institute for International Studies * * The views expressed in this study are those of the author and do not necessarily reflect those of the OECD or of any of its Member governments.
Transcript of GLOBAL FORUM ON TRADE TRADE AND CLIMATE CHANGE

GLOBAL FORUM ON TRADE
TRADE AND CLIMATE CHANGE
Paris, 9 and 10 June 2009 COUNTING CARBON IN THE MARKETPLACE:
PART I – OVERVIEW PAPER
by
Simon Bolwig, DTU Climate Centre Risø, Technical University of Denmark and Peter Gibbon, Senior Researcher, Head of research unit on Trade and development, Danish Institute
for International Studies*
* The views expressed in this study are those of the author and do not necessarily reflect those of the OECD or of any of its Member
governments.

2
TABLE OF CONTENTS
COUNTING CARBON IN THE MARKETPLACE: PART I – OVERVIEW PAPER ................................. 3
Executive Summary ..................................................................................................................................... 3 I. Introduction .......................................................................................................................................... 5 II. Why carbon footprinting? ................................................................................................................. 6 III. Methodological issues in product carbon footprinting ...................................................................... 7 IV. Overview of carbon footprinting standards and schemes ................................................................. 8 V. Consumer perceptions of and reactions to product carbon footprinting ......................................... 17 VI. Discussion and conclusion .............................................................................................................. 18
REFERENCES .............................................................................................................................................. 20
Annex1. Characteristics of surveyed product carbon footprinting schemes (as of April 2009) .................... 22
Annex 2. List of product or supply-chain focused carbon accounting schemes and standards .................... 29
Annex 3. Questionnaire for characterisation of product carbon footprinting (PCF) schemes ..................... 33
Annex 4. Consumer survey material on carbon labeling .............................................................................. 37
Annex 5. Examples of product carbon footprinting labels and logos ............................................................ 40

3
COUNTING CARBON IN THE MARKETPLACE: PART I – OVERVIEW PAPER
Simon Bolwig1 and Peter Gibbon
2
Executive Summary
Concern over climate change has stimulated interest in estimating the total amount of greenhouse
gasses (GHG) produced during the different stages in the ―life cycle‖ of goods and services — i.e. their
production, processing, transportation, sale, use and disposal. The outcome of these calculations are often
referred to as ―product carbon footprints‖ (PCFs), where ―carbon footprint‖ is the total amount of GHGs
produced for a given activity and ―product‖ is any good or service that is marketed. PCFs are thus distinct
from GHG assessments performed at the level of projects, corporations, supply chains, municipalities,
nations or individuals.
This paper discusses the rationale, context, coverage and characteristics of emerging voluntary
standards and schemes that estimate and designate PCFs for internationally traded products.
Product carbon footprinting is currently dominated by private standards and by certification schemes
operated by small for-profit and not-for-profit consultancy companies and in a few cases by large retailers
and manufacturers. Government support to PCF schemes and standards has been limited so far. The
exceptions are the PAS 2050 standard, the development of which was supported by the UK Department for
Environment, Food and Rural Affairs (Defra); Japan's pilot Carbon Footprint Scheme, launched in April
2009; and the assistance provided by the French Agence de l'Environnement et de la Maîtrise de l'Energie
(ADEME) in the development of a scheme operated by the food retailer Casino. At the international level,
PCF standards are being developed by the World Resources Institute (WRI) and the World Business
Council for Sustainable Development (WBCSD-WRI), through its Greenhouse Gas Protocol; and by the
International Office for Standardization.
We estimate that globally there were only 15 to 20 PCF schemes as of April 2009. The study provides
detailed information on 12 operational schemes, and some information on a further three. All of these
schemes have been established within the last two years. Considering the sometimes high costs and
technical challenges of PCF, it is therefore no surprise that only a small number of certified carbon-
footprinted products so far have found their way onto retail-outlet shelves. While some schemes report
strong interest in PCF from producers and retailers, and are expanding their clientele and product range, we
could not identify any clear trends in these respects.
The investigated schemes display large differences in scale and product coverage, type of claim made
and (where applicable) certification offered, GHG assessment methods, communication approaches, and
levels and means of verification and transparency. A range of factors may account for this diversity, such
as differences in ambition, technical competence and access to external support; differences in economic
resources; different country and business contexts; and the absence of a dominant PCF standard.
1 DTU Climate Centre Risø, Technical University of Denmark ([email protected]).
2 Danish Institute for International Studies, Trade and Development Research Unit ([email protected]).

4
Meanwhile, consumers show some interest in PCF information and seem to indicate that they would
probably prefer carbon-labelled products and firms over others, other things being equal. It is also likely
that a minority are, or would be, willing to pay a price premium for products with significantly lower
footprints than like ones, not much different from organic price premium. But consumers are also sceptical
about the credibility of the ―climate-friendly‖ claims made by retailers and manufacturers and show a
preference for third-party verification. This contrasts with the relatively weak verification systems
currently used in PCF. All this indicates that there are limits to the direct commercial benefits from PCF in
terms of increased sales, as opposed to benefits related to cost reductions and to compliance with future
climate-change legislation.
We have also examined, although somewhat superficially, factors that help assess the potential effects
of PCF on international trade. First, the lack of an international PCF standard could favour producers based
in countries with national public standards (so far only the UK), with trusted and workable private
standards, or with well-functioning, non-proprietary scheme operators (Canada, Germany, the United
Kingdom and the United States). In this regard, only one scheme, the Carbon Labelling Company, operates
internationally. Second, PCF calculation and certification is expensive and demanding on human resources
(for data provision and effective communication of the PCF). This tends to favour large and resourceful
producers, who may benefit from significant economies of scale (a low cost of certification per product
sold). This could exclude most companies in developing countries. Third, and unexpectedly perhaps, no
bias was found in the way the GHG assessments treated long-distance transport relative to other emission
sources, although we did not investigate this aspect in depth, and only one scheme highlights the distance
travelled by the product (along with other ―sustainability‖ criteria). Finally, the GHG assessment method
of the potentially influential PAS 2050 standard, by excluding emissions associated with capital plant, has
an in-built bias against relatively labour-intensive production systems, which are typical of developing
countries. Other schemes and standards may also contain such biases, in principle or in practice, but more
in-depth research is needed to document this.
In sum, although PCF, because it is based on LCA, is likely to have a higher degree of credibility with
consumers than any other sort of claim made by operators in relation to the climate-change attributes of
products, is also difficult and costly to perform and its impact on sales remains unclear. Moreover,
measurement of GHG emissions at a corporate level probably provides more accessible opportunities for
corporate cost savings than PCF. Therefore, whatever its implications for developing countries in principle,
its adoption seems likely to remain limited and therefore its impacts on trade and development seem
unlikely to be substantial – at least in the short-to-medium term.

5
I. Introduction
1. Concern over climate change has stimulated interest in estimating the total amount of greenhouse
gasses (GHG) produced during the different stages in the ―life cycle‖ of goods and services — i.e. their
production, processing, transportation, sale, use and disposal (Brenton et al., 2008; Brenton et al., 2008;
Øresund Food Network, 2008). In this paper we refer to the outcome of these calculations as product
carbon footprints (PCFs), where ―carbon footprint‖ is the total amount of GHGs produced for a given
activity and ―product‖ is any good or service that is marketed. PCFs are thus distinct from GHG
assessments performed at the level of projects, corporations, supply chains, municipalities, nations or
individuals.
2. A PCF like other GHG assessments is expressed in terms of its global warming potential (GWP).
GWP embraces the impact of different GHGs (CO2, N2O, CH4, O3, etc.) on global warming and the GWP
of all GHGs are expressed in terms of the impact on global warming of the equivalent weight (usually in
grams or kilograms) of CO2–equivalent (CO2e).3 After summing up all the GHGs produced at each stage in
the life of the product, the PCF can then be expressed as grams or kilograms of CO2e per unit of product.
For example, the carbon footprint of a 330 ml can of Coke that has been purchased, refrigerated, consumed
and then recycled by a consumer in the UK is 170 g CO2e.4 We emphasize however that very different
footprint values for the same product and country can be obtained, depending on the databases and
calculation methods used (Kejun et al., 2008).
3. The development of public and international PCF standards is at a very early stage. The first with
the ambition to cover a wide range of diverse products, PAS 2050, was published in October 2008 by the
British Standards Institute and the Carbon Trust, while the International Organisation for Standardization
only started to develop a ―carbon footprint of products‖ standard (ISO/NP 14067-1/2) in late 2008.5 The
World Resources Institute and the World Business Council on Sustainable Development, authors of the
widely recognised and used Greenhouse Gas Protocol for project and corporate level GHG assessments,
started to develop its Product and Supply Chain GHG Accounting and Reporting Standard in September
2008. This new standard, expected to be published in May 2010, will include guidelines on both product
life-cycle accounting and calculation and reporting of corporate ‗Scope 3‘ emissions (corporations‘ indirect
emissions, other than those already counted under ‗Scope 2‘, which refers to emissions from generation of
bought-in energy).6 In Japan in June 2008 the Ministry of Economy, Trade and Industry initiated the
development of a voluntary PCF scheme. A trial project period commenced in April 2009 and will cover
57 different products (Ikezuki, 2009). Finally, the EU is drawing up a regulation for biofuels that will
include requirements relating to biofuel PCF (see Case Study), while California has proposed a Low
Carbon Fuel Standard which from 2011 will require companies to lower the overall carbon intensity of
their various fuels at a rate that will increase every year until 2020, or else buy credits from companies that
sell cleaner fuels.7
4. This paper is primarily concerned with private PCF schemes and standards, which — with the
notable exception of standards and regulations pertaining to transport fuels — have developed at a faster
3 This is because the GWP of 1 kg of a GHG varies between the different GHGs. For example, the impact of
1 kg of CH4 (methane) on global warming is equivalent to 25 kg of CO2.
4 Source: http://www.cokecorporateresponsibility.co.uk/carbontrust/product-carbon-footprints.html
5 Source: http://www.iso.org/iso/iso_catalogue/catalogue_tc/catalogue_detail.htm?csnumber=43278
6 Source: http://www.ghgprotocol.org/standards/product-and-supply-chain-standard
7 Source: http://www.latimes.com/news/opinion/la-ed-lowcarbon20-2009apr20,0,1679884.story

6
pace than the public ones. A number of private certification schemes have emerged in the last couple of
years that offer retailers and manufacturers methodology and expertise to footprint their products, as well
in some cases procedures for verifying and certifying or labelling PCF assertions. The majority of these
schemes are operated by private (for-profit or not-for-profit) consultants, while a few have been developed
by manufacturers or retailers. In the absence of any dominant public or international standards for PCF, all
these schemes except one, which uses the PAS 2050 standard, can be regarded as supplying de facto
private standards.
5. In light of these observations, the aim of this paper is to provide an overview of existing PCF
schemes and standards that can help inform the discussion of research priorities, policy options and public
investments in this area. Section II briefly discusses the business and environmental rationales of PCF as
well as the possible risks and biases. This is followed, in Section III by a discussion of the life-cycle
analysis (LCA) methods and international (ISO) standards that PCF may draw on. Based on a global
survey of 12 private PCF schemes, we then examine in Section IV some salient characteristics of PCF as
carried out in practice, including the geographical and product coverage; the combination of PCF with
other sustainability criteria; the approaches, methods and costs involved; the kind of certification offered;
and the communication of the PCF information to consumers. This is followed by a section (V)
considering how consumers perceive and respond to PCF. A final section (VI) concludes.
II. Why carbon footprinting?
6. It has been estimated that the consumable goods and appliances that the average consumer in the
UK buys and uses account for 20% of her total carbon emissions (not counting the energy to run them), of
which food and non-alcoholic drinks, at 9%, comprise the largest category (Carbon Trust, 2006).8 It is
therefore worth investigating if and how influencing consumers‘ purchasing decisions through the
provision of information about the global warming impact of different products can contribute to climate-
change mitigation.
7. Surveys in several OECD countries suggest that consumers are increasingly interested in
information about the climate impact of products, while they also indicate that many other factors besides a
low-carbon footprint determine what products end up in the shopping basket, and that consumers are
generally sceptical about retailers‘ and manufacturers‘ ―climate friendly‖ claims (see below). As this paper
will show, some retailers and manufacturers have responded to these trends in consumer interests and
behaviour by calculating and displaying carbon footprints for a small number of products. In most cases
these initiatives were not launched with the primary purpose of increasing market share of the product
itself through improved differentiation, but more as part of a general effort to demonstrate commitment to
climate-change mitigation to consumers, and to lawmakers planning to introduce strict regulatory measures
(e.g. in the UK), or as part of broader corporate social responsibility policies.
8. Calculating the carbon footprints of products can also help companies reduce GHG emissions at
the levels of the corporation and the supply chain by identifying major emission sources as well as ways to
achieve reductions relatively quickly and cheaply. Indeed, investing in reducing carbon footprints may give
positive returns through significant energy-cost savings.
9. On the other hand, PCF if adopted at a large scale could have significant cost and (negative)
demand effects on producers and exporters in different parts of the world, including in developing
countries (Edwards-Jones et al., 2008). Research on the governance of global value chains for food
8 The categories are: food and non-alcoholic drink; other personal effects; household appliances; furnishings
and other household; clothing and footwear; alcohol and tobacco; and books and newspapers.
7
products shows that retailers and other ―lead firms‖ located near consumers to a large extent define product
quality standards and at the same time are able to push the cost of complying with these increasingly
demanding standards (along with other performance requirements) down the supply chain to producers
(Gibbon and Ponte, 2005). There is also a risk that PCF schemes and standards, if not carefully designed,
may involve discriminatory practices that affect competitiveness and trade (Brenton et al., 2008; Kasterine
and Vanzetti, 2009). This is particularly clear where special emphasis is placed on transport, for example
by using life cycle analysis only for this part of the product life cycle. This will of course tend to favour
domestic producers over more distant ones (Bolwig, 2008).
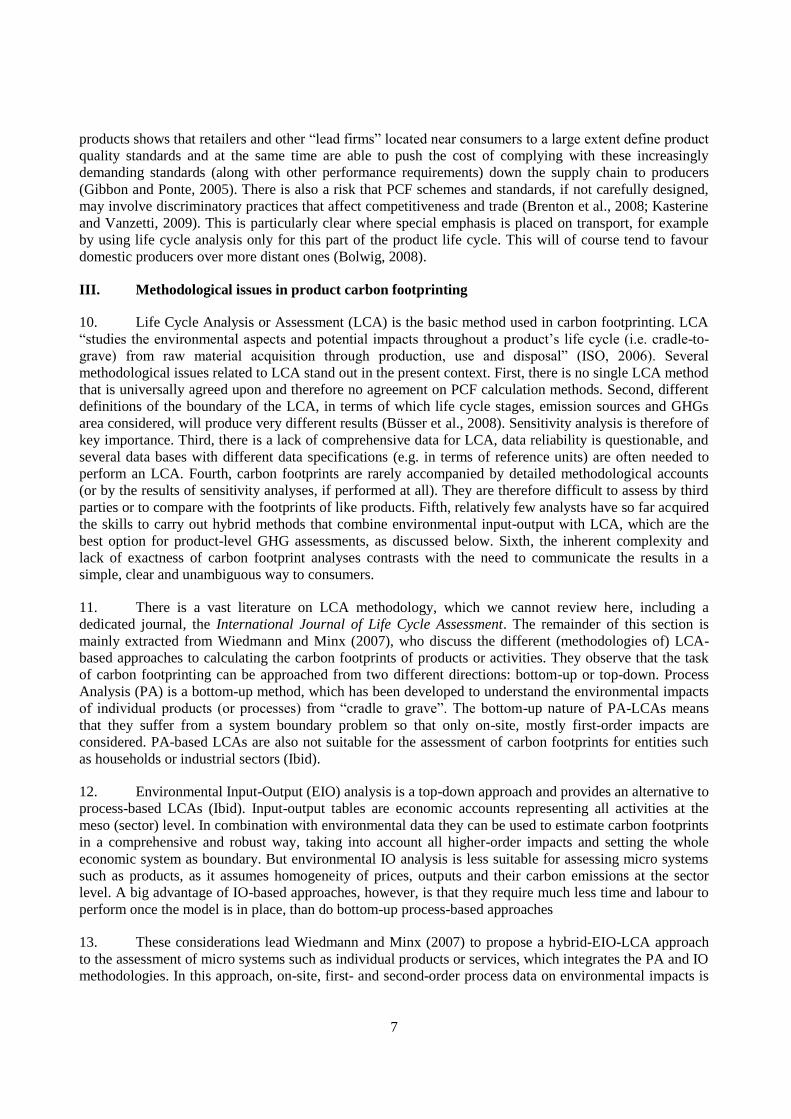
III. Methodological issues in product carbon footprinting
10. Life Cycle Analysis or Assessment (LCA) is the basic method used in carbon footprinting. LCA
―studies the environmental aspects and potential impacts throughout a product‘s life cycle (i.e. cradle-to-
grave) from raw material acquisition through production, use and disposal‖ (ISO, 2006). Several
methodological issues related to LCA stand out in the present context. First, there is no single LCA method
that is universally agreed upon and therefore no agreement on PCF calculation methods. Second, different
definitions of the boundary of the LCA, in terms of which life cycle stages, emission sources and GHGs
area considered, will produce very different results (Büsser et al., 2008). Sensitivity analysis is therefore of
key importance. Third, there is a lack of comprehensive data for LCA, data reliability is questionable, and
several data bases with different data specifications (e.g. in terms of reference units) are often needed to
perform an LCA. Fourth, carbon footprints are rarely accompanied by detailed methodological accounts
(or by the results of sensitivity analyses, if performed at all). They are therefore difficult to assess by third
parties or to compare with the footprints of like products. Fifth, relatively few analysts have so far acquired
the skills to carry out hybrid methods that combine environmental input-output with LCA, which are the
best option for product-level GHG assessments, as discussed below. Sixth, the inherent complexity and
lack of exactness of carbon footprint analyses contrasts with the need to communicate the results in a
simple, clear and unambiguous way to consumers.
11. There is a vast literature on LCA methodology, which we cannot review here, including a
dedicated journal, the International Journal of Life Cycle Assessment. The remainder of this section is
mainly extracted from Wiedmann and Minx (2007), who discuss the different (methodologies of) LCA-
based approaches to calculating the carbon footprints of products or activities. They observe that the task
of carbon footprinting can be approached from two different directions: bottom-up or top-down. Process
Analysis (PA) is a bottom-up method, which has been developed to understand the environmental impacts
of individual products (or processes) from ―cradle to grave‖. The bottom-up nature of PA-LCAs means
that they suffer from a system boundary problem so that only on-site, mostly first-order impacts are
considered. PA-based LCAs are also not suitable for the assessment of carbon footprints for entities such
as households or industrial sectors (Ibid).
12. Environmental Input-Output (EIO) analysis is a top-down approach and provides an alternative to
process-based LCAs (Ibid). Input-output tables are economic accounts representing all activities at the
meso (sector) level. In combination with environmental data they can be used to estimate carbon footprints
in a comprehensive and robust way, taking into account all higher-order impacts and setting the whole
economic system as boundary. But environmental IO analysis is less suitable for assessing micro systems
such as products, as it assumes homogeneity of prices, outputs and their carbon emissions at the sector
level. A big advantage of IO-based approaches, however, is that they require much less time and labour to
perform once the model is in place, than do bottom-up process-based approaches
13. These considerations lead Wiedmann and Minx (2007) to propose a hybrid-EIO-LCA approach
to the assessment of micro systems such as individual products or services, which integrates the PA and IO
methodologies. In this approach, on-site, first- and second-order process data on environmental impacts is

8
collected for the product or service system under study, while higher-order requirements are covered by IO
analysis, drawing on generalised tools, such as the Bottomline tool (www.bottomline3.co.uk). Yet they
also observe that while such hybrid assessments are considered state-of-the art in economic ecological
modelling, the literature and models are still relatively new and few are able to carry them out in practice.
This situation is likely to improve fast in developed countries, but the capacity of most developing
countries to carry out hybrid-EIO-LCA is likely to remain limited.
14. There is scant discussion in the PCF literature about the possible biases against developing
countries imparted by using one type of methodology rather than another. This revolves substantially
around the issue of where system boundaries are set. Generally, the more direct and indirect inputs to the
PCF that are considered, the fewer biases there should be against developing countries. Excluding for
example emissions from the manufacture of capital goods used to produce footprinted products, as in PAS
2050, could impart a bias against labour-intensive industrial production systems. This discussion parallels
that of the implications of excluding ‗other indirect‘ or Scope 3 emissions from corporate footprints (see
next section).
IV. Overview of carbon footprinting standards and schemes
ISO environmental standards and carbon footprinting
15. Since 1997 ISO has published a number of standards that are relevant to carbon footprinting. This
process is ongoing: in 2008 the organization announced that its Technical Committee 207 had begun a
work programme on carbon footprinting of products (ISO, 2008).
16. The first ISO standards in this area to be issued were the ISO 14040 series dealing with LCA,
which describe the procedures that should be followed in conducting LCAs. They were consolidated into
two revised standards in 2006, without substantial change. A second standard is ISO 14025 (2000) on
―Environmental labels and Declarations – Type III Environmental Declarations‖. This recommends the
functional unit approach in communication of LCA results - as opposed to reporting mass or volume,
which are considered as insufficient to allow comparison. This group of standards was adopted against a
background wherein several approaches to LCA had been developed over the previous two decades. There
was a resulting danger that, as the method became more widely used, its results thus would be
incommensurate and lack credibility.
17. ISO 14064 (2006-07) has a somewhat different focus. This group of standards is concerned not
with the measurement of the overall environmental impact of the production, consumption and disposal of
specific products or services over an unspecified time period, but with corporate and ―project‖-level GHG
emissions within annual time frames. The immediate background is the emergence of a number of
emission ―cap and trade‖ programmes or schemes, each with similar though different approaches to
emission measurement and validation.9 The wider background is the probable adoption of a mandatory
scheme in the United States and the probable integration of the United States and other large emitters into
the Kyoto process. These developments have the potential to create a huge global market in emission
credits10
and to stimulate a substantial number of new offsetting projects in developing countries, under the
9 Under this concept, ceilings are established for total emissions by covered emitters. Emitters are then
assigned some proportion of allowable emissions, and must then reduce their actual emissions to those
assigned to them, or acquire offsets that will cover the difference. Offsets can be purchased on a special
market from other regulated emitters who reduce their emissions over and above target, or acquired
through arrangements with unregistered emitters, or earned through carbon sequestration.
10 It is estimated that the US market alone will be worth USD 300 billion (Gray and Edens, 2008).

9
Clean Development Mechanism. In this context, these standards aim at facilitating a harmonized system
for organisation- and project-level carbon accounting.
18. Although a Working Group that contained experts from 45 countries drew up IS 14064 over a
four-year period, most of its elements appear to be derived from a single source, the Greenhouse Gas
Protocol (hereafter GHG-P), launched in 1997 by the World Resources Institute and the World Business
Council on Sustainable Development and revised in 2000 to include a corporate accounting and reporting
protocol. Comparisons of the two standards (McGray, 2003; Spanangle, 2003) agree that their main
differences are that (i) GHG-P, unlike ISO 14064, provides detailed guidance notes and calculation tools,
while (ii) ISO 14064, unlike GHG-P, covers verification.
19. ISO 14064-1 deals with corporate GHG accounting while ISO 14064-2 deals with project
accounting. ISO 14064-3 deals with validation and verification of GHG plans and accounts and ISO 14065
deals with the accreditation of bodies that carry out third party validation or verification.11
In all cases, the
standards only lay down a series of managerial steps that shall be followed in planning, executing and
monitoring activity. Specific actions to be taken at each step, for example the choice of methodologies for
quantifying emissions or how to determine the skills of verifiers, remain at the discretion of the corporation
or whatever regulatory authority manages a scheme. In this sense there is a strong resemblance to the ISO
14000 and ISO 9000 series of standards.
20. The standards have been criticized in some quarters for lack of prescription in what are construed
as key areas. For example, with respect to corporate GHG accounting (ISO 14064-1), managers are
required to identify the boundaries of the emissions that they will quantify. It is stated, that in doing so,
they shall include direct emissions from activities of the corporation and indirect emissions from the
generation of electricity consumed by the corporation (Scopes 1 and 2 respectively in the GHG-P) and that
they shall ―consider‖ the inclusion of other indirect emissions (the GHG-P‘s Scope 3). The standard‘s main
objective here is to establish transparency in respect of what is being measured, rather than to require that
all emissions be considered.12
21. Perhaps the part of ISO 14064 that will prove most relevant to whatever ISO standards are
eventually developed for carbon footprinting are the provisions on verification in 14064-3. These state that
a verification plan shall be formulated which sets out objectives, a data collection approach, a sampling
plan, a schedule for performing tests, and a system for maintaining test records and other relevant
documents.13
In respect of ―objectives‖, verifiers shall not only consider where to draw system boundaries
(see above) but also be transparent as to whether they are requiring ―reasonable‖ or only ―limited‖
assurance. Finally there are a series of requirements concerning the competence and experience of
verifiers. ―Competences‖ are defined in terms of a list of suggested – but not mandatory – skills (rather
than specific qualifications), while ―experience‖ is defined in terms both of relevant work experience and
attendance at training events and seminars. Examples of suggested skills include knowledge of legal rules,
knowledge of the sector, knowledge of emission quantification, knowledge of monitoring methodologies,
knowledge of GHG data auditing, and knowledge of risk assessment or verification techniques.
11 ISO 14064-3 uses the term validation in relation to project plans and verification in relation to claims about
GHG emissions.
12 According to Braunschweig (n.d.) the standard here reflects a misleadingly narrow interpretation of
managerial responsibility. ―Typically, many organisational decision responsibilities are hidden in the ‗other
indirect emissions‘ category.‖
13 ―Process documentation‖ and ―Communication and reporting documentation‖.
10
Characteristics of some product carbon footprinting schemes
22. A review of documents and websites was carried out for this study, resulting in the identification
of 30 schemes worldwide that take either a product or a supply-chain approach, or both, to carbon
footprinting, as opposed to the more common company and project levels GHG assessments. The schemes
are listed in Annex 2. From this list we were able to positively identify 15 schemes worldwide which have
carried out carbon footprints for products (as opposed to for supply chains) and that are operational in the
sense that at least one product carbon footprinted by the scheme is being retailed.14
Of these we surveyed
12 schemes, while three schemes (Bilan CO2, Greenice and Carbon Action Plan) were excluded due to
time constraints or to difficulties in obtaining critical information. The survey was carried out by the
authors during March and April 2009. Data collection was assisted by a questionnaire (Annex 3), filled in
by the scheme operator or by the authors through interviews with scheme staff, or by the authors based on
a review of website documentation. The cases where website information alone was used were ones where
scheme operators failed to respond to the questionnaire. The remainder of this section reports the results of
the survey of 12 PCF schemes.
Background and context
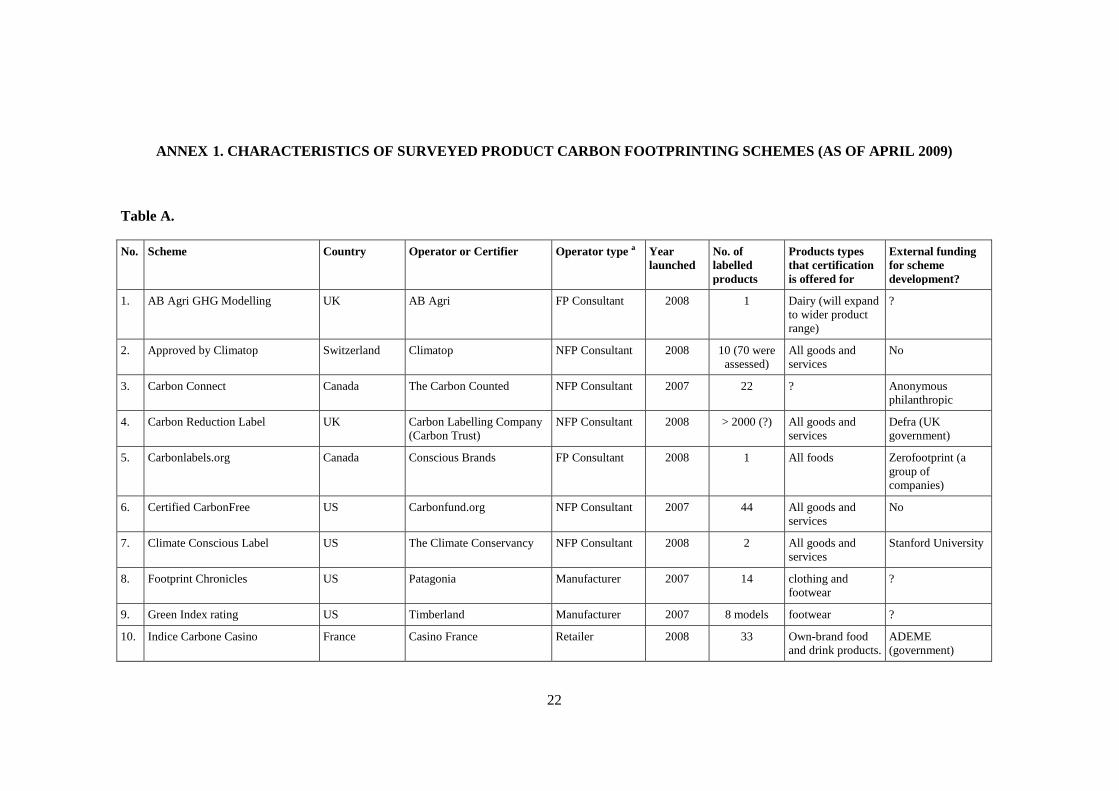
23. Table 1 shows selected characteristics of the surveyed PCF schemes. All schemes were launched
during 2007 or 2008. They were typically developed over 1–1½ years, which is a short time when
considering the many technical problems involved in PCF; most operators were thus still developing their
methodologies as of April 2009. The surveyed schemes cover the Canada, the EU Switzerland and the
United States. With the exception of the Carbon Labelling Company, all operate only in their home
markets. Additional PCF schemes are also being developed in Australia, China, Japan, Korea, Sweden and
Thailand, but these were not included in the survey due to their lack of application in practice.
24. Half of the schemes are operated by not-for-profit consultancy companies and environmental
organisations, and two by for-profit consultants. The remaining four are user-operated, proprietary schemes
operated by, respectively, a retailer, a bioethanol importer, and two clothing and footwear manufacturers
(i.e. the companies themselves assess and label the products they manufacture or sell). External funds
contributed to the establishment of at least five of the schemes, of which two received support from public
environmental agencies in their respective countries.
Inclusion of additional sustainability criteria in product assessments
25. Seven schemes limited their product assessments to GHG emissions, while four included one or
more other environmental criteria, including chemical use, resource consumption, use of organic
production methods, recycling, distance travelled, or an indicator for ―total environmental impact‖. The
former group were all operated by (for-profit or not-for-profit) consultants specialising in climate change
issues, while the latter were typically proprietary schemes of manufacturers or retailers, for which PCF was
part of broader corporate social responsibility strategies, including corporate-level emission reductions. In
one instance, the Verified Sustainable Ethanol Initiative, PCF was combined with a range of environmental
and social criteria, with the broader aims of ―shifting the entire Brazilian ethanol industry towards more
sustainable production‖ (against a background of widespread critique of this industry) as well as of
―expedit(ing) the development of international regulations for sustainable biofuels.‖ Many of the users of
14 Because they were not yet operational, the review did not include the ISO and GHG Protocol product-level
standards discussed earlier as well as a number of country-level PCF schemes, including: Climate
Labelling for Food, ICA pilot project, METI Carbon Footprint System, Cool (CO2) Label, and Carbon
Label Promotion Committee.
11
the schemes operated by consultants clearly also applied PCF as part of a broader CSR strategy, but we did
not collect detailed information on this aspect (the survey was carried out at the level of schemes rather
than users). It is clear, however, that for companies such as Casino, Tesco and Patagonia, PCF was a minor
part of their climate-change-related CSR activities.
Product type, volume and origin
26. Five schemes offer PCF for all goods and services, while the rest limit themselves to specific
product types (food and drinks, clothes, footwear, and biofuel) according to the product specialisation of
the scheme operator. It was not possible to make a complete inventory of all products certified by the 12
schemes. It is clear that, though agricultural value chains have received the most attention, PCF has by no
means been limited to food and drinks, for which GHG LCAs are relatively simple, but has also been done
for a diverse range of more complex manufactured goods (e.g. cell phones) and services (e.g. savings
accounts), which are more demanding in terms of data and methods.
27. The largest scheme by far in terms of number of products is the Carbon Reduction Label,
operated by the Carbon Labelling Company (part of Carbon Trust) in the UK, which since 2007 has
certified more than 2000 (?) products for (?) clients. The 11 remaining schemes have together calculated
the carbon footprint for around 200 products, ranging in number from 1 to 70. Not all these footprints have
been publicized, however. For example, Climatop performed GHG LCA studies for 70 products in order to
label 10 ―carbon champions‖ within 9 product groups, while AB Agri GHG Modelling has not published
the carbon footprints that were calculated for dairy products.
28. It was not possible to enumerate all users of the schemes. PAS 2050 is used by, for example,
Coca Cola Great Britain, PepsiCo (Tropicana brand juices) and Continental Clothing, while a number of
companies targeting or based in the German market, such as Voelkel GmbH (juice) and Platanera Rio
Sixaola (bananas), have certified products to the Stop Climate Change standard.15
In the United States,
Certified CarbonFree has certified a total of 44 products for, among others, Motorola (cell phone),
Monarch Beverages (energy drinks), Tandus (carpeting) and GBS Enterprises (mattresses).
29. The small numbers of products that have been footprinted to date reflect the youthfulness of the
schemes, the costs and technical challenges involved in PCF, and continued uncertainty among users about
the benefits of PCF (see below). Thus most users have only footprinted a small share of their product
range, and often on a pilot basis. For example, the French retailer Casino have labelled only 33 out of a
planned 3000 own-brand staple food and drink products under its Indice Carbone Casino scheme; the UK
retailer Tesco is selling 20 footprinted products on a pilot basis using the Carbon Reduction Label16
; while
10 products sold by Migros, the largest retailer in Switzerland, have received the Approved by Climatop
label. At the other end of the scale, Marshalls (UK) has published the footprints of all its 503 domestic
landscaping products, using the Carbon Reduction Label. In general, when comparing the numbers of
footprinted products today with earlier statements made by users it is clear that many have fallen short of
their initial targets.
15 A list of products certified to the PAS 2050 can be found at http://www.carbon-
label.com/business/productdirectory.htm; companies certified to the Stop Climate Change standard are
listed at http://www.stop-climate-change.de/en/Mitglieder.htm; and products certified by Climatop are
displayed at http://www.climatop.ch/index.php?l=d&p=products.
16 Source:
http://www.tescoplc.com/plc/corporate_responsibility/caring_environment/climate_change/empowering_c
ustomers /carbon_labelling/
12
30. Seven schemes offer carbon footprinting for all products irrespective of their country of origin,
while three schemes only assess domestically produced products. One scheme (for fuel ethanol) only
applies to producers in Brazil, while one scheme did not provide information on country of origin. Hence
no strong bias against imported products was found in terms of this factor.
Carbon footprinting approaches and data
31. Poor access to technical documentation, as far it exists, as well as the limited scope of this study,
prevents a comprehensive comparison of the scope and methodological rigour of the PCFs performed by
the schemes. In lieu of a full technical evaluation, we discuss some key aspects of the PCF approaches
used by the schemes.
Publication of methods and assessment results
32. Regarding the transparency of the assessments, six schemes – Carbon Reduction Label, Climate
Conscious Label, Stop Climate Change, Certified CarbonFree, Carbon Connect and Verified Sustainable
Ethanol Initiative use a written document (standard or description of methodology) published on their
websites to guide the product-level GHG emission assessments, but it should be noted that the quality and
completeness of this type of documentation differs greatly. The Approved by Climatop scheme takes
another approach to transparency by publishing the results of their assessments as well as the peer review
reports of these. This does not necessarily mean that the other schemes apply less rigorous or
comprehensive methodologies, only that these are less accessible to the public.
Use of recognised standards for life-cycle analysis
33. All schemes relied on life-cycle analysis (LCA) for PCF calculations. The measurement
methodology of most schemes related, in one way or another, to recognised international or national
standards for LCA-based GHG accounting. Six schemes referred to the ISO 14044, ISO 14064 or the
WRI-WBCSD Greenhouse Gas Protocol (discussed above), without necessarily following these to the
letter. Two schemes were certified to PAS 2050 of the British Standards Institute, which ―builds on
existing methods established through BS EN ISO 14040 and BS EN ISO 14044 by specifying requirements
for the assessment of the life cycle GHG emissions of products‖ (www.bsigroup.com), and a third scheme
will use PAS 2050 for the further development of its methodology. Finally, Indice Carbone Casino builds
on the Bilan Carbone methodology for corporate GHG accounting, developed by the French l‘Agence de
l‘Environnement et de la Maîtrise de l‘Energie (ADEME), and which also follows ISO 14064 in several
respects (ADEME, 2007, p.85).
34. As discussed above, it is noteworthy that both the Bilan Carbone and the ISO standards are
concerned with corporate or project-level GHG emissions, or both, rather than product-level ones.
Moreover, ISO 14064 is mainly concerned with the transparency and management of GHG accounting and
so it does not specify which methods to use for quantifying emissions or which emission sources or
greenhouse gasses to include. The PAS 2050 standard, on the other hand, is specifically designed for
product-level GHG accounting and has very detailed methodological specifications. But this standard was
only published in October 2008 and so was not widely used at the time of the survey.
Scope of GHG emission assessments
35. Regarding the scope of the PCFs, nine schemes claimed to include GHG emissions from all
stages in the product life cycle in the footprint calculation, while two schemes focused on the production
stage and one let the scope depend on the client‘s preferences. However, ―all stages‖ clearly meant
different things to the different schemes. As noted above, emissions from the production of capital goods is
omitted in the otherwise comprehensive PAS 2050 methodology used by the Carbon Reduction Label,

13
while the similarly ambitious Stop Climate Change methodology includes this source but chooses to
disregard the ―transport of the product to the consumer‘s house‖ stage. But most schemes were less explicit
about how they set the boundaries of their GHG assessments, preventing a meaningful comparison across
schemes, and some claimed not to have omitted any stages in the life cycle in their calculations - although
this is clearly almost impossible in practice. A lack of consistent and transparent boundary setting
obviously constrains the assessment and comparison of the carbon footprints of different products,
especially among products footprinted by different schemes. For example, including the domestic use
phase significantly affects the footprint of coffee; the brewing stage thus accounts for about 70% of the
total CO2e emissions from a cup of black coffee and considerably more if the user does not behave in an
economic way when brewing (Büssser et al., 2008).
36. Another important methodological choice is which GHGs to include in the assessments. This
question was not explored in detail by the survey, but most schemes appear to include all the major GHGs,
while one explicitly limits itself to considering only CO2.
Data sources and quality
37. A key aspect affecting the validity of a PCF is data quality. An indicator for good data quality is
the use of primary activity data in the calculation of energy and raw material use at the different stages in a
product‘s life cycle, in addition to secondary data sources (from data bases and literature). All schemes
claim to use both types of data sources, and cite a number of European and US LCA databases, but it was
beyond the scope of this study to assess the ―appropriateness‖ of the choice of data sources in each case. A
few of the publicised standards used by the schemes are explicit on the use of primary and secondary data.
For example, the PAS 2050:2008 states that ―primary activity data shall be collected from those processes
owned, operated or controlled by the organization implementing the PAS...The primary activity data shall
not apply to downstream emission sources‖ (p. 17). The CarbonCounted Standard 1.2 is more flexible,
stating that ―Initially, we will use an 80/20 practical approach to determining the footprint. If some data is
not available, we should state this and provide a reasonable estimate for its contribution‖ (item 2.10).
Scheme scope and kinds of certification offered
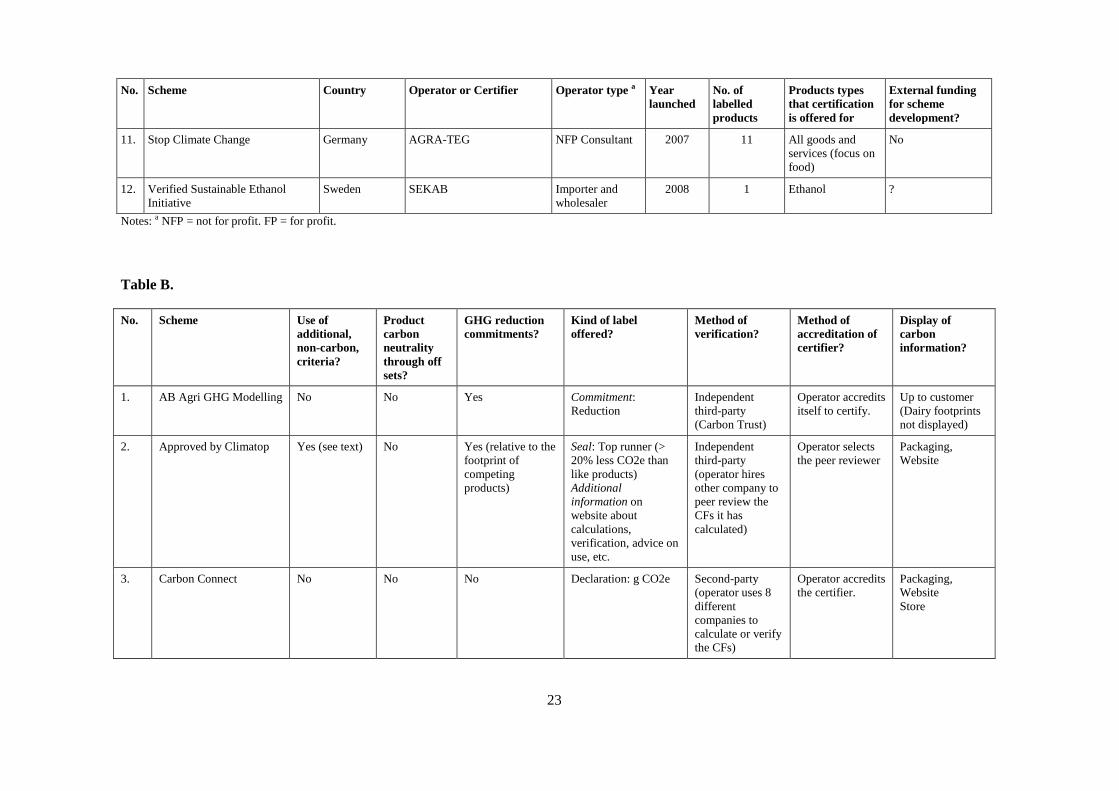
38. Besides the calculation of PCFs, ten schemes require meeting one or more additional climate-
change related criteria. The most common is a commitment to reduce the overall carbon footprint at either
the product or corporate level. The proprietary schemes operated by Timberland, Patagonia and Casino
France all include reduction commitments at the corporate level, although these are often stated in a very
general way. Common to these schemes is also that PCF seems to be (still) a minor element in their
climate-related CSR activities. Commitments to reducing PCF over a specified time period are embodied
in five schemes. Two schemes use economic incentives to encourage – rather than require – such
reductions. One, Certified CarbonFree, offers financial incentives for users who can prove reductions of
more than 10% per year. In the other, Approved by Climatop, a product is certified as a ―carbon champion‖
if its carbon footprint is 20% or below than that of 6 – 7 like products (within a given category) with which
it is compared. Because certification must be renewed every two years, comparison between products in
this scheme allegedly encourages producers to reduce their emissions.17
17 Comparing the carbon footprint with that of like products is an option in the display or labelling technology
offered by at least two other schemes – the Carbon Reduction Label and the Climate Conscious Label. It is
unclear if displaying such comparative information is meant to directly incentivise users to reduce product
footprints, rather than indirectly through consumer behaviour.

14
39. Secondly, product endorsement in two schemes requires the footprint to be lower than a
―baseline‖ value: In the Verified Sustainable Ethanol Initiative, the ―field–to–wheel‖ emissions of the
ethanol has to be 85% lower than the ―well–to–wheel‖ emissions from petrol, while Approved by Climatop
only certifies a few ―carbon champions‖ within each product category, as just mentioned.
40. Thirdly, two schemes — Certified CarbonFree and Stop Climate Change — require carbon
neutrality at product level to be achieved through carbon offsetting. The latter scheme has formulated
detailed minimum standards for projects that qualify as offsets, while the former is silent on this aspect.
Altogether, the surveyed schemes show great variation in the actual content of their requirements. It is not
possible to judge from this overview which general approach is ―better‖ from a climate-change
perspective; rather the diversity found points to opportunities for cross-learning and the need for work to
identify ―best practices‖ suitable for different kinds of operators, users and countries. This level of
diversity is not unusual during the first few years when standards emerge in a new area. Later diversity
may become reduced through natural selection and pressures for harmonization.
Does the transportation stage get special treatment?
41. GHG emissions from the transportation of goods across long distances have been the subject of
much debate in recent years, and in this context some retailers, standard-setting bodies and Northern
farmer advocacy groups launched various initiatives to measure, label, restrict or ―green‖ the transportation
of especially food (Bolwig, 2008; AEA, 2005, Kasterine and Vanzetti, 2008).18
The authors have argued
elsewhere (Gibbon and Bolwig, 2007; Bolwig, op.cit;) that a narrow focus on emissions from
transportation, as opposed to considering all stages in the product life cycle, may discriminate against
exporting nations, especially poor countries that are often located distant from OECD markets and
moreover typically have less access to high-volume shipping systems that are usually more energy
efficient.19
At the same time, a number of LCA studies show that favouring locally produced goods does
not guarantee a reduction in GHG emissions. This is due to the fact that producers in distant locations may
be more carbon efficient than those nearby, and that this gain may outweigh the higher emissions from
transportation (Edwards-Jones et al., 2008). It is has also been observed that the mode of transport — sea,
air, road, rail — as well as the transport technology used within each mode can significantly influence the
size of a PCF (Michaelowa and Krause, 2000). In this regard, the relatively high carbon efficiency of sea
freight can in some cases be an advantage for distant producers. For example, transporting broccoli 12,000
kilometres from Ecuador to Sweden by boat produces only 40% of the emissions of trucking broccoli
3,200 kilometres across Europe from Spain (Angervall et al., 2006).
18 An example is Wal-Mart‘s ―Food Miles Calculator, which allows our buyers to enter information on each
supplier and product, determine product pickup locations and select which of our 38 food distribution
centres the product will reach. With this information, the calculator computes the total food miles, which
the buyer can use when making buying decisions.‖ (Source: http://instoresnow.walmart.com/food-
article_ektid44214.aspx).
19 For example, the capacities of container ships serving West Africa range between 2,000 and 3,000
containers, while those landing at the major ports in the EU, the US and East Asia have a tonnage from
8,000 to 12,000 containers (personal communication with Morten Nielsen, SAFE Shipping). Moreover, the
low level of development of rail transport in many developing regions, especially in Africa, means higher
dependence on road transport, which is less carbon efficient. Africa also has a relatively large proportion of
land-locked regions. Finally, less reliable and more expensive sea freight systems in poor countries,
combined with sometimes low and variable export volumes, mean higher dependence on air freight for
certain products, especially fresh produce (Gibbon and Bolwig, 2007).

15
42. All surveyed schemes except one20
include the transport stage in the calculation of the PCF, up to
at least the stage of wholesale and in most cases up to the retail outlet, while some also include transport to
the consumer‘s house. Assuming that the calculation methods in these cases also take account of the
different modes of transport used (which is relatively easy to do), this suggests that the schemes at least do
not under-estimate emissions from transportation or disregard especially climate-unfriendly modes of
transportation such as air freight and diesel-based trucking.21
The survey also asked whether a scheme
placed special emphasis on transport-related GHG emissions. Only one scheme, Patagonia‘s footprint
chronicles, appears to do this, by displaying information on the website on the distance (in km) travelled by
the product from the stage of raw material to garment delivery at the company‘s Nevada distribution
centre. It is noteworthy that a draft version of the Indice Carbone Casino label highlighted, as the only
source, GHG emissions from transport, while the version finally used shows emissions from all stages in
the life cycle.22
We can thus conclude from this that the design and methods adopted by the schemes
generally do not discriminate against products originating in distant countries. We underline however that
the users of the schemes themselves may still decide to focus on reducing emissions from transportation
through other climate-change initiatives, which may disadvantage certain exporting nations. For example,
in 2008, Tesco ―continued to use our ―By Air‖ sticker in the UK to identify airfreighted products and have
achieved our target of limiting airfreighted produce to under 1% of the products we sell, with a bias
towards products from developing countries‖23
(these stickers were eventually removed, in 2009).
Conformity assessment
43. In all the schemes examined, the product GHG assessments are carried out by the scheme‘s own
staff or by (other) consultants hired by the users or scheme operators to do so. The schemes can be divided
according firstly, to whether any independent verification is (required to be) performed of these
calculations, and secondly who is supposed to perform this verification where it is required.
44. No verification appears to be performed of the PCF assertions used by the proprietary Footprint
Chronicle, Green Index Rating, Carbonlabels.org, Climate Conscious Label and Indice Carbone Casino
schemes, although in the last of these cases the general footprinting methodology has been validated by a
public agency (ADEME). Nor does there seem to be an independent stage of verification in the Carbon
Connect, Certified CarbonFree and Verified Sustainable Ethanol Initiative schemes, although in all three of
these cases calculations have to be performed by consultants or companies independent of the standard
setter and specified in a list.
45. A system of independent (third-party) verification, i.e., one where consultants or companies
independent of those making the calculations perform a check of these calculations, is required in the case
of the Stop Climate Change, Approved by Climatop and AB Agri GHG Modelling, as well as in the ―third-
party certification‖ and ―other-party verification‖ options offered by the Carbon Reduction Label.
20 A second scheme, AB Agri GHG Modelling, does not consider emissions from the wholesale and retail
distribution of the product (dairy) because the scheme is focused at the farm level.
21 It was outside the scope of the study to qualify this statement through examining possible biases caused by
the choice of emission factors for different transport modes or the accuracy with which distance travelled
with different determined transport modes and technologies is determined in each case.
22 This development is mirrored in the evolution of the KRAV-Svenskt Sigill Climate Labelling of Food
standard (see Case Study 1).
23 Source:
http://www.tescoplc.com/plc/corporate_responsibility/caring_environment/climate_change/empowering_c
ustomers/ carbon_labelling/
16
However, the Carbon Reduction Label also offers ―self-verification‖ as a less demanding (and costly)
certification option.
46. Systems of accrediting consultants or companies qualified to carry out both original calculations
and verifications of them generally lack transparency. In the case of the Stop Climate Change and Verified
Sustainable Ethanol Initiative approved consultants or companies are ISO 14065 accredited, although in
neither case is it clear that this is a requirement.
Costs of life-cycle analyses and certification
47. GHG life-cycle assessments are generally believed to be very expensive to perform, but little
reliable information exists on this important issue. The survey therefore asked scheme operators to estimate
the cost of calculating the footprint of one product. We received comprehensive answers from only two
schemes. The first one observed that LCAs for ―typical‖ agricultural products cost between € 2 500 and
€ 6 000 to perform, depending on the size of the company. The annual adjustments of the LCAs cost
considerably less. According to the experience of the second scheme, which certifies both food and
manufactured products, LCAs cost USD 5 000–USD 15 000 but can cost as much as USD 70 000 or more,
depending on the complexity of the product and its supply chain. One scheme operator also observed that
calculating the footprint of the first products in a given category, or for a given company and supply chain,
naturally is more expensive than subsequent ones, as the client (and the scheme operator) is progressing
along a learning curve. In this regard, the costs of future assessments and audits can be lowered by building
the LCA data models in a modular way, which would allow for future flexibility in calculations and the
inclusion of new data.
48. The survey did not systematically ask about the cost of verification, but some information was
nevertheless obtained. In one scheme certification costs between € 1 500 and € 5 000 per product, while
another observed that the annual certification of the PCFs costs typically USD 100-USD 250 for small to
medium-sized businesses where this only requires a documentary review, and USD 1 000-USD 5 000 for
larger businesses that require on-site audits. The above brief discussion suggests the need for further
research into the costs of compliance and certification to PCF standards.
Communication of product carbon information
49. The survey revealed great variation in the way the schemes and its users chose to communicate
through text and graphics the product carbon information related to the certification. All schemes offer a
carbon label or mark as a proof of certification, often in the form of a seal carrying a logo and the name of
the scheme or the organisation operating it (Annex 5 shows some examples). In seven schemes, the label
also shows the actual value of the PCF, expressed in CO2e per unit of product, while in one case — the
Green Index rating — the footprint is placed on a scale from 1 to 10 (where 1 denotes <2.5 kg and 10
denotes >100 kg per pair of shoe). Two schemes show both the CO2e value and its position on a scale.
Some of the labels display additional information relating to the certification on the packaging; for
example, the Carbon Reduction Label reads ―we have committed to reduce this carbon footprint‖ while the
Indice Carbone Casino label states that ―Casino s‘engage pour l‘environnement en collaboration avec ses
fournisseurs pour réduire ses emissions de gaz à effect de serre‖ (―Casino works for the environment in
collaboration with its suppliers to reduce its GHG emissions‖). Both these labels also carry a brief
explanation of what a PCF is. Other labels for display on packaging carry simpler but not less powerful
messages, such as ―certified carbon free‖ (Certified CarbonFree), ―climate friendly‖ (Stop Climate
Change) or ―verified sustainable‖ (Verified Sustainable Ethanol Initiative). In most cases, the more
complex information associated with the certification is displayed on websites (see URLs in Annex 2) and
in some cases also in the store. A few users choose not to publicise any specific carbon information, such
17
as Sainsbury‘s Dairy Development Group applying the AB Agri Greenhouse Gas Modelling scheme,
instead using it for internal purposes only.
V. Consumer perceptions of and reactions to product carbon footprinting
50. At least six studies of UK consumers, two of Swedish consumers, one of US consumers and one
of UK and US consumers jointly have been carried out on climate-change issues since 2006. Almost all
deal with the climate-change impacts of food. No recent studies of German or French consumers on this
issue could be traced on the internet.
51. Most of these studies deal with consumer decision-making, such as overall determinants of
purchase decisions, decisions concerning choice of retailer, and decisions concerning willingness to pay a
premium. A number also or instead deal with consumers‘ perceptions of retailers and manufacturers, in
relation to their overall credibility on environmental issues, whether they provide enough information in
the climate area, and whether the information that they do provide is trustworthy. A few studies also cover
consumers‘ views on how GHG emissions from products should be labelled.
52. The studies mostly take the form of reports on survey results. In a majority of cases these were
obtained during so-called ―omnibus‖ surveys by market-research companies, i.e. surveys covering a variety
of unrelated topics. In most cases the sample size was between one thousand and three thousand
respondents. A few focus group studies have also been reported.
53. The main conclusions can be summarized as follows. UK consumers are largely sceptical about
the overall environmental and climate convictions of manufacturers and retailers. They, and Swedish
consumers, are also interested in obtaining more information from manufacturers and retailers on the
climate impact of specific products. However, neither in the US or the UK do they trust business to report
this information accurately. Hence, they would prefer statements and claims in this area to be verified
independently.
54. While there is interest among consumers in obtaining relevant information in this area, climate-
change concerns are unlikely to become a major driver of most consumers‘ buying decisions relative to
factors such as price and food safety. All other things being equal (especially price), businesses that carry
out carbon labelling and products that are carbon labelled are likely to be preferred over comparable
business and products that do not or are not. But if they were required to pay more than 20% more for a
product with a significantly lower PCF than a comparable one, less than 10% of UK and US consumers,
and 27.5% of Swedish ones, would do so. These figures are considerably higher than the market shares
represented, for example, by organic food sales, which on average also command a premium of roughly
20%. Notable in this context is that the proportion of UK consumers reporting regular purchase of organic
food is three times higher than the actual share of organic sales in total food sales.
55. Only very limited ex post information is available on consumers‘ reactions to products that have
been PCF labelled. Timberland publishes quarterly information, direct or indirect, on sales of its Green
Index labelled products. This label has been applied to eight of Timberland‘s models within the Mios
sandal and Outdoor Performance ranges. Sales of labelled products declined sharply during 2008, although
according to Timberland this was mainly an effect of the phase out of the Mios range. It is not clear
whether labelling positively affected the Mios range of shoes at an earlier stage.24
24 Source: Timberland CSR Quarterly Reports, Quarters 3 and 4 2008: Product Data. At
http://www.justmeans.com/usercontent/companydocs/docs/company-docs/1229713191.pdf (Q3) and
…/1238577936.pdf (Q4).
18
56. The surveys show no consistent response on the type of carbon labelling consumers would prefer.
All the results are reported in more detail in Annex 4.
VI. Discussion and conclusion
57. This paper has discussed the rationale, context, coverage and characteristics of emerging product
carbon footprint schemes and standards, and has reported on how consumers perceive carbon footprinting
and labelling and companies‘ climate change policies in general. We found that PCF is dominated by
private certification schemes operated by small for-profit and not-for-profit consultancy companies and in
a few cases by large retailers and manufacturers. All schemes have been established within the last two
years and we estimate that globally there are only 15 to 20 schemes operational as of April 2009, of which
we provide detailed information on 12 and some information on a further three. Considering the sometimes
high costs and technical challenges of PCF, it is therefore no surprise that only a small number of certified
carbon footprinted products so far have found their way to retail outlets. While some schemes report strong
interest in PCF from producers and retailers, and are expanding their clientele and product range, we could
not identify any clear trends in these respects.
58. The investigated schemes display large differences in scale and product coverage, type of claim
made and (where applicable) certification offered, GHG assessment methods, communication approaches,
and levels and means of verification and transparency. A range of factors may account for this diversity:
differences in ambition, technical competence and access to external support; differences in economic
resources; different country and business contexts; and the absence of a dominant PCF standard.
59. Meanwhile, consumers show some interest in PCF information and would probably prefer
carbon-labelled products and firms over others, other things being equal. It is also likely that a minority
are, or would be, willing to pay a price premium for products with significantly lower footprints than like
ones, not much different from organic price premium. But consumers are also sceptical about the
credibility of the ―climate-friendly‖ claims made by retailers and manufacturers and show a preference for
third-party verification. This contrasts with the relatively weak verification systems currently used in PCF.
All this indicates that there are limits to the direct commercial benefits from PCF in terms of increased
sales, as opposed to benefits related to cost reductions and to compliance with future climate-change
legislation.
60. National governments and international organisations have so far played a very minor role in the
development of PCF standards25
or in the establishment of PCF certification schemes. The exception is the
UK Department for Environment, Food and Rural Affairs (Defra), which supported the development of the
first public PCF standard (the PAS 2050) as well as helped establish the organisation (the Carbon Trust)
which has already certified a relatively large number of products to this standard. On a smaller scale, the
French Agence de l’Environnement et de la Maîtrise de l'Energie (ADEME) has assisted the development
of a scheme operated by the retailer Casino, based on its elaborate methodology for corporate GHG
accounting. Finally, the Japanese government launched a PCF pilot project in April 2009. The international
standards relating to carbon footprinting at the corporate and project levels are the WBCSD-WRI
Greenhouse Gas Protocol and the ISO 14040 and 14064 standards series. These two organisations
commenced work to develop PCF standards in recent months. It is unclear how exactly these two processes
will relate to each other and to PAS 2050, but there are obviously considerable opportunities for co-
ordination.
25 Again, the notable exception is standards based on the life-cycle emissions of transport fuels, especially
biofuels.
19
61. We have also examined, although somewhat superficially, factors that help assess the potential
effects of PCF on international trade. First, the lack of an international PCF standard could favour
producers based in countries with national public standards (so far only the UK), with trusted and workable
private standards, or with well-functioning, non-proprietary scheme operators (Canada, Germany, the
United Kingdom and the United States). In this regard, only one scheme, the Carbon Labelling Company,
operates internationally. Second, PCF calculation and certification is expensive and demanding on human
resources (for data provision and effective communication of the PCF). This tends to favour large and
resourceful producers, who may benefit from significant economies of scale (low cost of certification per
product sold). This could exclude most companies in developing countries. Third, and unexpectedly
perhaps, no bias was found in the way the GHG assessments treated long-distance transport relative to
other emission sources, although we did not investigate this aspect in depth, and only one scheme
highlights the distance travelled by the product (along with other ―sustainability‖ criteria). Finally, the
GHG assessment method of the potentially influential PAS 2050 standard has an in-built bias against
relatively labour-intensive production systems, which are typical of developing countries. Other schemes
and standards may also contain such biases, in principle or in practice, but more in-depth research is
needed to document this.
62. In sum, although PCF, because it is based on LCA, is likely to have a higher degree of credibility
with consumers than any other sort of claim made by operators in relation to the climate change attributes
of products, is also difficult and costly to perform and its impact on sales remains unclear. Moreover,
measurement of GHG emissions at a corporate level probably provides more accessible opportunities for
corporate cost savings than PCF. Therefore, whatever its implications for developing countries in principle,
its adoption seems likely to remain limited and therefore its impacts on trade and development seem
unlikely to be substantial – at least in the short-to-medium term.

20
REFERENCES
ADEME (l‘Agence de l‘Environnement et de la Maîtrise de l‘Energie). (2007). Bilan Carbone®
Entreprises et Collectivités. Guide méthodologique,version 5.0, objectifs et principes de
comptabilisation.
AEA (2005). The Validity of Food Miles as an Indicator of Sustainable Development: Final Report.
Department for Environment, Food and Rural Affairs, United Kingdom.
Angervall, T, B. Florén, and F. Ziegler. (2006). Vilken bukett broccoli väljer du? The Swedish Institute for
Food and Biotechnology.
Berry, T., D. Crosslet and J. Jewell (2008). Check-out carbon. The role of carbon labeling in delivering a
low-carbon shopping basket. Forum for the Future and Lloyd‘s Register.
Bolwig, S. (2008) ‗The Food Miles Debate and Developing Country Exports‖. Short paper presented at the
―Buying Local: Miles Better?‖ session of the World Export Development Forum (WEFD) of the
International Trade Centre UNCTAD/WTO, Montreux 08-11 October.
Braunschweig, A. (n.d.). The relation between LCA and GHG accounting. EZ Management Consulting
AG, Zurich.
Brenton, P., Edwards-Jones, G. and Jensen, M.F. (2008). Carbon labelling and low income country
exports: a look at the issues. Washington, D.C.: The World Bank.
Büsser, S., R. Steiner, N. Jungbluth (2008). LCA of packed food products – the function of flexible
packaging. ESU-services Ltd., Uster, Switzerland. Report made for Flexible Packaging Europe.
Carbon Trust, The (2006), The carbon emissions generated in all that we consume, London: The Carbon
Trust.
Edwards-Jones, G., Plassmann, K., York, E.H., Hounsome, B., Jones, D.L. and Milá i Canals, L. (2008)
―Vulnerability of exporting nations to the development of a carbon label in the United Kingdom‖.
Environmental Science and Policy, doi:10.1016/j.envsci.2008.10.005.
Gibbon, P. and Bolwig. S. (2007) The Economic Impact of a Ban on Imports of Air freighted Organic
Products to the UK. DIIS Working Paper 2007/23, Danish Institute for International Studies.
Gibbon, P. and Ponte, S. (2005) Trading Down: Africa, Value Chains and the Global Economy.
Philadelphia: Temple University Press.
Gray, P. and Edens, G. (2008). Carbon accounting: A practical guide for lawyers. Natural Resources and
Environment, 22 (3) 41-49.

21
ISO (International Organization for Standardisation) (2008). Responding to the global and related
challenges of climate change, energy, water and nutrition. APEC Conference on Standards and
Conformance, August 2008/SOM3/SCSC/CONF/012
ISO (International Organization for Standardisation). (2006). Environmental management – Life cycle
assessment – Principles and framework. Geneva: ISO.
Kasterine, A and Vanzetti, D. (2009). Market based instruments and voluntary measures to mitigate
greenhouse gas emissions from the agri-food sector. Draft manuscript, 20/04/2009.
Kejun, J., A. Cosbey and D. Murphy. (2008). Embedded carbon in traded goods. Background paper for the
Trade and Climate Change Seminar, June 18-20, 2008, Copenhagen, Denmark. Energy Research
Institute, China, and International Institute for Sustainable Development, Canada.
McGray, H. (2003). GHG accounting: the GHG-P versus the ISO draft standard, at
http://www.ecologia.org/ems/ghg/news/cop9/summary.html, accessed 24-03-09
Michaelowa, A. and K. Krause (2000). ―International maritime transport and climate policy.‖
Intereconomics, 35 (3), p. 127-136.
Øresund Food Network (2008). Climate change and the food industry, Climate labelling for food products:
potential and limitations, Copenhagen, Denmark www.oresund-environment.org.
Spanangle, M. (2003). A comparison of ISO 14064-1 and the GHG-P corporate module.
Wenzel, H., Hauschild, M. and Alting, L. (1997) Environmental Assessments of products –Vol 1:
Methodology, tools and case studies in product development. London. Chapman & Hall.
Wiedmann, T. and J. Minx (2007). A Definition of ―Carbon Footprint‖. ISA Research Report 07-01. ISA
(UK) Research and Consulting. Available at www.isa-research.co.uk.
Additional materials
ANNEX 1. Characteristics of surveyed product carbon footprinting schemes (as of April 2009)
ANNEX 2. List of product or supply-chain focused carbon accounting schemes and standards
ANNEX 3. Survey questionnaire
ANNEX 4. Consumer survey material on carbon labelling
ANNEX 5. Examples of product carbon footprinting labels and logos
22
ANNEX 1. CHARACTERISTICS OF SURVEYED PRODUCT CARBON FOOTPRINTING SCHEMES (AS OF APRIL 2009)
Table A.
No. Scheme Country Operator or Certifier Operator type a Year
launched
No. of
labelled
products
Products types
that certification
is offered for
External funding
for scheme
development?
1. AB Agri GHG Modelling UK AB Agri FP Consultant 2008 1 Dairy (will expand
to wider product
range)
?
2. Approved by Climatop Switzerland Climatop NFP Consultant 2008 10 (70 were
assessed)
All goods and
services
No
3. Carbon Connect Canada The Carbon Counted NFP Consultant 2007 22 ? Anonymous
philanthropic
4. Carbon Reduction Label UK Carbon Labelling Company
(Carbon Trust)
NFP Consultant 2008 > 2000 (?) All goods and
services
Defra (UK
government)
5. Carbonlabels.org Canada Conscious Brands FP Consultant 2008 1 All foods Zerofootprint (a
group of
companies)
6. Certified CarbonFree US Carbonfund.org NFP Consultant 2007 44 All goods and
services
No
7. Climate Conscious Label US The Climate Conservancy NFP Consultant 2008 2 All goods and
services
Stanford University
8. Footprint Chronicles US Patagonia Manufacturer 2007 14 clothing and
footwear
?
9. Green Index rating US Timberland Manufacturer 2007 8 models footwear ?
10. Indice Carbone Casino France Casino France Retailer 2008 33 Own-brand food
and drink products.
ADEME
(government)
23
No. Scheme Country Operator or Certifier Operator type a Year
launched
No. of
labelled
products
Products types
that certification
is offered for
External funding
for scheme
development?
11. Stop Climate Change Germany AGRA-TEG NFP Consultant 2007 11 All goods and
services (focus on
food)
No
12. Verified Sustainable Ethanol
Initiative
Sweden SEKAB Importer and
wholesaler
2008 1 Ethanol ?
Notes: a NFP = not for profit. FP = for profit.
Table B.
No. Scheme Use of
additional,
non-carbon,
criteria?
Product
carbon
neutrality
through off
sets?
GHG reduction
commitments?
Kind of label
offered?
Method of
verification?
Method of
accreditation of
certifier?
Display of
carbon
information?
1. AB Agri GHG Modelling No No Yes Commitment:
Reduction
Independent
third-party
(Carbon Trust)
Operator accredits
itself to certify.
Up to customer
(Dairy footprints
not displayed)
2. Approved by Climatop Yes (see text)
No Yes (relative to the
footprint of
competing
products)
Seal: Top runner (>
20% less CO2e than
like products)
Additional
information on
website about
calculations,
verification, advice on
use, etc.
Independent
third-party
(operator hires
other company to
peer review the
CFs it has
calculated)
Operator selects
the peer reviewer
Packaging,
Website
3. Carbon Connect No No No Declaration: g CO2e
Second-party
(operator uses 8
different
companies to
calculate or verify
the CFs)
Operator accredits
the certifier.
Packaging,
Website
Store

24
No. Scheme Use of
additional,
non-carbon,
criteria?
Product
carbon
neutrality
through off
sets?
GHG reduction
commitments?
Kind of label
offered?
Method of
verification?
Method of
accreditation of
certifier?
Display of
carbon
information?
4. Carbon Reduction Label No No Yes Declaration: g CO2e
Commitment:
Reduction
Seal: endorsement by
the Carbon Trust
Optional: comparison
with like products,
consumer action tips,
explanation, etc.
Three options:
1) Independent
third-party,
accredited to PAS
2050.
2) Other party,
who can
demonstrate
compliance with
recognized ISO or
BS standards
3) Self-
verification,
through
application of BS
ISO 14021
Operator accredits
itself or another
certifier,
depending on
method of
verification used.
Operator is part of
UK Accreditation
Service process
Packaging, Shelf
Website, Not
displayed
5. Carbonlabels.org No No Yes Declaration: g CO2e
Second-party
(Operator or its
partner
Zerofootprint
verifies)
Operator accredits
itself or
Zerofootprint to
certify.
Packaging,
Website
6. Certified CarbonFree No Mandatory Encouraged
through financial
incentives
Seal: Off setting Second party
(operator decides
which consultants
can make the CF
assessments)
Operator accredits
itself to certify.
Packaging,
Website
Shelf
7. Climate Conscious Label No No No Scale: g CO2e per
dollar, relative to
other products
Seal: Meeting criteria
Second-party
(Operator
verifies)
Operator accredits
itself to certify.
Packaging

25
No. Scheme Use of
additional,
non-carbon,
criteria?
Product
carbon
neutrality
through off
sets?
GHG reduction
commitments?
Kind of label
offered?
Method of
verification?
Method of
accreditation of
certifier?
Display of
carbon
information?
8. Footprint Chronicles Information
also provided
about energy
use, waste and
distance
travelled.
No Yes Declaration: g CO2e
emitted
Additional
information: CO2
compared to weight of
pg roduct, information
on distance travelled,
waste generated and
energy used.
Self-verification
(Operator verifies
the footprints of
own products; no
particular method
mentioned)
Not applicable
(no use of
certifier).
Website
9. Green Index rating Overall GI
rating is an
average of
three ratings:
carbon
footprint,
chemical use
and resource
consumption.
No Yes (corporate
level)
Declaration: Scale (0
– 10 rating, where 1
denotes < 2.50 kg and
10 = >100 kg CO2e
per pair of shoe).
Self-verification
(Operator verifies
the CFs of own
products; no
particular method
mentioned)
Not applicable
(no use of
certifier).
Packaging
10. Indice Carbone Casino Yes
(percentage of
packaging that
is and can be
recycled)
No Yes (corporate
level; verification
method is unclear)
Declaration: g CO2e,
scale
Commitment:
Reduction (at
corporate level)
Self-verification
(Operator verifies
the CFs of own
products,
calculated by a
consultant)
Not applicable
(no use of
certifier, but
ADEME has
validated the
general
methodology
applied by the
scheme).
Packaging,
Website
11. Stop Climate Change No Mandatory Yes Seal: Meeting criteria
(carbon neutral), off
setting
Commitment:
Reduction
Independent
third-party
(Operator uses 3
different
certification
bodies)
Operator accredits
the certifiers, all
of which are ISO
14065 certified.
Operator also
reviews and trains
the certifiers
annually.
Packaging, Shelf
Website, Not
displayed

26
No. Scheme Use of
additional,
non-carbon,
criteria?
Product
carbon
neutrality
through off
sets?
GHG reduction
commitments?
Kind of label
offered?
Method of
verification?
Method of
accreditation of
certifier?
Display of
carbon
information?
12. Verified Sustainable
Ethanol Initiative
Yes (rainforest
protection,
other
ecological
impacts, child
labour, worker
conditions)
No Yes (relative to
fixed baseline of
85% of fossil
fuels).
Seal: Meeting criteria
(‗verified
sustainable‘)
Second-party
(Operator hires
international QA
company to
validate and
verify the CFs)
Operator accredits
the certifier (SGS
Int.). The certifier
used is ISO 14065
certified.
Website
Fuel distribution
trucks
Table C.
No. Scheme Stages of the product
life cycle included?
Omitted stages in life
cycle?
Special emphasis on
transport-related
emissions?
Measurement
methodology?
Use of
primary
activity data?
Use of
published
standard?
1. AB Agri GHG Modelling All stages of dairy
production (including
electricity, manure
storage, machinery and
fuel)
Transport, distribution
and sale (scope is
production level)
No Based on PAS 2050 /
Carbon Trust methodology
Yes No (but
certified to
PAS 2050)
2. Approved by Climatop Entire cycle, from
production to disposal
None No LCA according to ISO
14040
Ecoinvent database
GHG according to IPCC
2001
Ecological scarcity model
Yes – hybrid
EIO-LCA
approach
No (but very
transparent,
published
assessments)
3. Carbon Connect All stages, but depends
on client‘s preferences
Depends on client‘s
preferences
No CarbonConnect method.
Total energy used or total
material consumed in
production, converted into
CO2 equivalents according
to IPCC‘s GWP coefficients.
An 80/20 practical approach
is adopted.
Yes Yes
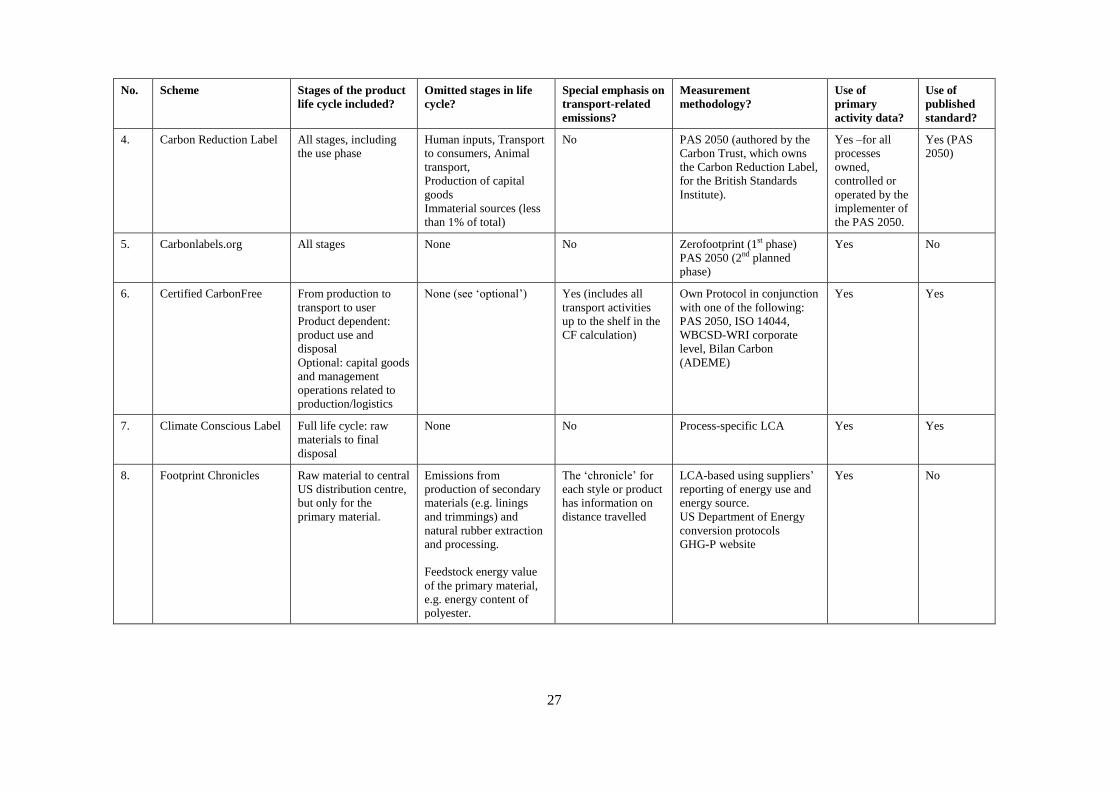
27
No. Scheme Stages of the product
life cycle included?
Omitted stages in life
cycle?
Special emphasis on
transport-related
emissions?
Measurement
methodology?
Use of
primary
activity data?
Use of
published
standard?
4. Carbon Reduction Label All stages, including
the use phase
Human inputs, Transport
to consumers, Animal
transport,
Production of capital
goods
Immaterial sources (less
than 1% of total)
No PAS 2050 (authored by the
Carbon Trust, which owns
the Carbon Reduction Label,
for the British Standards
Institute).
Yes –for all
processes
owned,
controlled or
operated by the
implementer of
the PAS 2050.
Yes (PAS
2050)
5. Carbonlabels.org All stages None No Zerofootprint (1st phase)
PAS 2050 (2nd planned
phase)
Yes No
6. Certified CarbonFree From production to
transport to user
Product dependent:
product use and
disposal
Optional: capital goods
and management
operations related to
production/logistics
None (see ‗optional‘) Yes (includes all
transport activities
up to the shelf in the
CF calculation)
Own Protocol in conjunction
with one of the following:
PAS 2050, ISO 14044,
WBCSD-WRI corporate
level, Bilan Carbon
(ADEME)
Yes Yes
7. Climate Conscious Label Full life cycle: raw
materials to final
disposal
None No Process-specific LCA Yes Yes
8. Footprint Chronicles Raw material to central
US distribution centre,
but only for the
primary material.
Emissions from
production of secondary
materials (e.g. linings
and trimmings) and
natural rubber extraction
and processing.
Feedstock energy value
of the primary material,
e.g. energy content of
polyester.
The ‗chronicle‘ for
each style or product
has information on
distance travelled
LCA-based using suppliers‘
reporting of energy use and
energy source.
US Department of Energy
conversion protocols
GHG-P website
Yes No

28
No. Scheme Stages of the product
life cycle included?
Omitted stages in life
cycle?
Special emphasis on
transport-related
emissions?
Measurement
methodology?
Use of
primary
activity data?
Use of
published
standard?
9. Green Index rating Raw material
production and shoe
production
Possibly, all stages
except raw material and
shoe production are
omitted from the
product-level
calculations.
Transport appears to
be ignored in product
footprint
calculations, but not
in corporate level
GHG emission
calculations.
Corporate: GHG-P
calculator tool
Corporate Transport:
methodology developed by
Clean Cargo working group
Product-level: GaBi,
commercial software (PE
International)
No (?) No
10. Indice Carbone Casino All stages from
production to
distribution to
consumer‘s house
? No (but a draft
version of the label
highlighted the GHG
emissions from
transport)
? (developed with support
from ADEME – Bilan
Carbon, and Bio Intelligence
Service)
Yes No
11. Stop Climate Change All stages (includes
production of capital
goods and transport of
workers in all stages)
Transport of product to
consumer‘s house
No Own methodology, based on
ISO 14064 as far as
applicable.
Yes Yes (in 3
languages)
12. Verified Sustainable
Ethanol Initiative
All stages: from
cultivation to
transportation (details
not known)
? No Based on the UK Renewable
Transport Fuel Obligation
(RTFO) principles.
? Yes (but not
very
detailed)
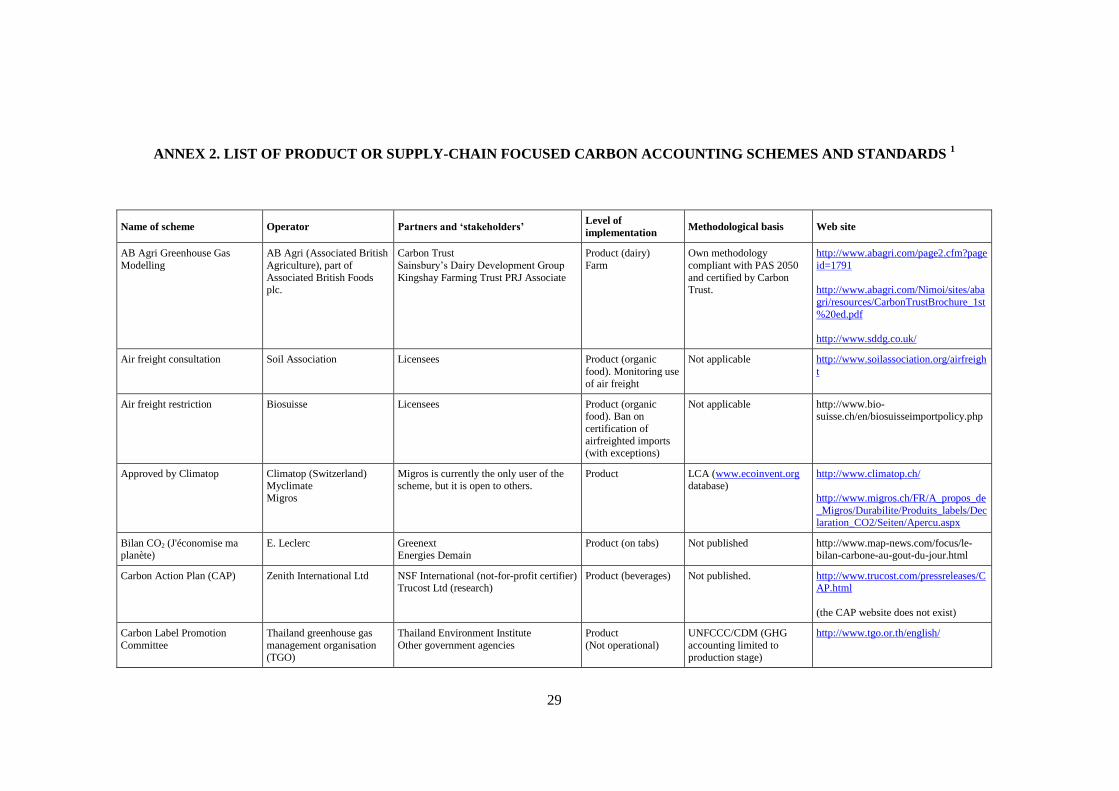
29
ANNEX 2. LIST OF PRODUCT OR SUPPLY-CHAIN FOCUSED CARBON ACCOUNTING SCHEMES AND STANDARDS 1
Name of scheme Operator Partners and ‘stakeholders’ Level of
implementation Methodological basis Web site
AB Agri Greenhouse Gas
Modelling
AB Agri (Associated British
Agriculture), part of
Associated British Foods plc.
Carbon Trust
Sainsbury‘s Dairy Development Group
Kingshay Farming Trust PRJ Associate
Product (dairy)
Farm
Own methodology
compliant with PAS 2050
and certified by Carbon Trust.
http://www.abagri.com/page2.cfm?page
id=1791
http://www.abagri.com/Nimoi/sites/aba
gri/resources/CarbonTrustBrochure_1st
%20ed.pdf
http://www.sddg.co.uk/
Air freight consultation Soil Association Licensees Product (organic
food). Monitoring use
of air freight
Not applicable http://www.soilassociation.org/airfreigh
t
Air freight restriction Biosuisse Licensees Product (organic food). Ban on
certification of
airfreighted imports (with exceptions)
Not applicable http://www.bio-suisse.ch/en/biosuisseimportpolicy.php
Approved by Climatop Climatop (Switzerland) Myclimate
Migros
Migros is currently the only user of the scheme, but it is open to others.
Product LCA (www.ecoinvent.org database)
http://www.climatop.ch/
http://www.migros.ch/FR/A_propos_de
_Migros/Durabilite/Produits_labels/Declaration_CO2/Seiten/Apercu.aspx
Bilan CO2 (J'économise ma planète)
E. Leclerc Greenext Energies Demain
Product (on tabs) Not published http://www.map-news.com/focus/le-bilan-carbone-au-gout-du-jour.html
Carbon Action Plan (CAP) Zenith International Ltd
NSF International (not-for-profit certifier) Trucost Ltd (research)
Product (beverages) Not published. http://www.trucost.com/pressreleases/CAP.html
(the CAP website does not exist)
Carbon Label Promotion
Committee
Thailand greenhouse gas
management organisation
(TGO)
Thailand Environment Institute
Other government agencies
Product
(Not operational)
UNFCCC/CDM (GHG
accounting limited to
production stage)
http://www.tgo.or.th/english/

30
Name of scheme Operator Partners and ‘stakeholders’ Level of
implementation Methodological basis Web site
Carbon Reduction Label Carbon Trust BSI
Product
Company
PAS 2050 http://www.carbontrust.co.uk/default.ct
Carbon Scorecards Wal-Mart ? Suppliers Not published No information found on the Wal-Mart
website.
CarbonCountedTM Standard CarbonCounted Carbon
Footprint Solutions
11 consulting partners
Advisory Team
Product Own method ‗aligned in
practical manner with GHG Protocol and ISO 14064‘
and subject to annual
reviews.
www.Carboncounted.com
http://www.carboncounted.com/downlo
ads/CarbonCounted_Standard.pdf
Carbonlabels.org Conscious Brands International organisations and NGOs.
10 Pilot Clients
Product Builds on PAS 2050 www.Carbonlabels.org
Certified Carbonfree Carbon Fund
(Washington, US)
Edinburgh Centre for Carbon
Management (ECCM) Technical Advisory Group.
Product
Product Life-Cycle
Assessment (LCA) .
http://www.carbonfund.org/products
Climate Conscious Carbon Label
The Climate Conservancy (US)
Advisory Board of Stanford University scientists
Product Full LCA (own methodology until
international one is
established)
http://www.climateconservancy.org/
Climate Labelling of Food KRAV
Svenskt Sigill Kvalitetssystem AB
Swedish food companies and Swedish
Board of Agriculture (SJV).
Product (focus on
production methods)
Original standards proposal
was partly LCA-based. Now under further
development
http://www.klimatmarkningen.se/in-
english/
Cool (CO2) Label Korea Eco-Products
Institute
Korean government Product
(Not operational)
TOTAL (Tool for Type III
labelling and LCA), based
on LCA and PAS 2050.
http://www.koeco.or.kr/eng/index.asp.
Eco Options The Home Depot ? Unclear if carbon
footprint analysis is
used.
Not published http://www6.homedepot.com/ecooption
s/
Footprint Chronicles™ Patagonia Bluesign Technologies (data) Product
LCA http://www.patagonia.com/web/us/foot
print/index.jsp
http://www.thecleanestline.com/footpri
nt_chronicles/index.html
German Product Carbon
Footprint Project
Product Carbon Footprint
Project
10 German companies; WWF
Institute for Applied Ecology; Potsdam
Institute for Climate Impact Research
THEMA1
Product
(Not operational)
Work towards an
international standard
methodology for PCF
measurement in 2010 or
2011.
www.pcf-projekt.de 2

31
Name of scheme Operator Partners and ‘stakeholders’ Level of
implementation Methodological basis Web site
GHG Protocol Product and
Supply Chain Accounting and Reporting Standard
World Resources Institute &
World Business Council for Sustainable Development
Members of Technical Working Groups
‗Pilot Testers‘
Product,
Supply chain (Not operational)
Own methodology http://www.ghgprotocol.org/standards/p
roduct-and-supply-chain-standard#usermessage3a
Green Index™ rating Timberland GreenNet Clean Air-Cool Planet (CACP)
The Climate Group
Product Based partly on LCAs perfomed using GaBi
(www.gabi-software.com).
http://www.timberland.com/corp/index.jsp?page=csr_green_index
Greenice ISA Methodology for
Carbon Footprints
Greenice R&D and
Sustainability consultants
Centre of Integrated Sustainability
Analysis, University of Sydney
Company
Supply Chain Project
Product (but no label)
Own ―ISA Methodology‖
based on Input-Output Analysis and compliant
with ISO 14044.
www.greenice.com.au
ICA (title not yet determined) ICA Group (Swedish
retailer).
Swedish Institute for Food and
Biotechnology (SIK).
Product (food)
(pilot project to
analyze 100 own-brand food products.
Not yet operational)
? http://www.ica.se/file_archive/pdf/2008
_ICA_Annualreport_ENG_final.pdf
(ICA Annual Report 2008).
Indice Carbone Casino Casino France K Développement Durable
Bio Intelligence Service
ADEME (l'Agence de l'Environnement et de la Maîtrise de l'Energie) for validation
and support.
Product Method developed by
ADEME
WRI GHG Protocol ISO 14064
http://www.groupe-
casino.fr/legroupe/?sr=99&id_article=1
72&lang=fr
http://www.produits-
casino.fr/spip.php?page=developpement_durable_infos_produits&debut_article
s=15#pagination_articles
ISO Carbon Footprint of
Products (ISO/NP 14067-1/2)
International Organisation
for Standardization
National standards organisations, expert
members of technical committee
Product (standard)
(Not operational)
To be developed between
January 2009 and May
2010.
http://www.iso.org/iso/iso_catalogue/ca
talogue_tc/catalogue_detail.htm?csnum
ber=43278
Méthode Bilan Carbone® ADEME (l'Agence de
l'Environnement et de la Maîtrise de l'Energie)
? Corporate
Supply Chain
Own methodology
http://www2.ademe.fr/servlet/KBaseSh
ow?sort=-1&cid=15729&m=3&catid=15730
METI Carbon Footprint System Ministry of Economy, Trade and Industry (METI) (Japan)
Japan Environmental Management Association for Industry (JEMAI)
Ministries of Environment & Agriculture
University of Tokyo British Standards and the Carbon Trust
Product (Not operational)
―Guidelines on the Carbon Footprint System‖ &
―Standards for Establishing
Product Category Rules‖
http://www.meti.go.jp/english/press/data/nBackIssue20080731_03.html
PAS 2050 British Standards Institute Carbon Trust and Defra Product
Own methodology http://www.bsi-global.com/en/Standards-and-
Publications/How-we-can-help-
you/Professional-Standards-
Service/PAS-2050/

32
Name of scheme Operator Partners and ‘stakeholders’ Level of
implementation Methodological basis Web site
Stop Climate Change AGRA-TEG Gmbh University of Göttingen
Independent Governing Board
Product (food)
Company
Company specific, builds
on ISO 14064
http://www.stop-climate-change.de/en/
UNEP Life Cycle Management UNEP Danish Standards Supply chain
Company
GHG Reduction
Management tool
http://www.unep.org/pdf/dtie/DTI0889
PA.pdf
Verified Sustainable Ethanol
Initiative
SEKAB Biofuels and
Chemicals (Sweden)
Ethanol producers and sugar cane
industry (UNICA) in Brasil. BioAlcohol Fuel Foundation
SGS Group (auditor)
Product (ethanol
only)
Field-to-wheel (LCA)
RTFO principles
www.sustainableethanolinitiative.com
Notes: 1 The list includes only manufacturers who are using their own ‗in-house‘ carbon footprinting standard/scheme, and not those that have adopted product carbon footprinting using
schemes/standards operated by other organizations (e.g. PAS 2050, Stop Climate Change, Climatop). 2 Some large schemes were identified but not included in the table because they focused at neither
the product nor the supply chain levels: a) The Carbon Disclosure Project (http://www.cdproject.net), a large scheme led by an UK company; b) The Voluntary Carbon Standard by the Climate Group
(www.theclimategroup.org), which is a standard for carbon off-set projects; c) The Carbon Footprint Approved System (http://www.carbonfootprint.com/ carbonfootprintapproved.html) by Carbon
Footprint Ltd, which is implemented at the company level; d) The CarbonNeutral Company (http://www.carbonneutral.com) is using the Carbon Neutral Protocol
(http://www.carbonneutral.com/uploadedfiles/TCNC%20Protocol% 202008.pdf) and is implemented at the company, event and project levels.
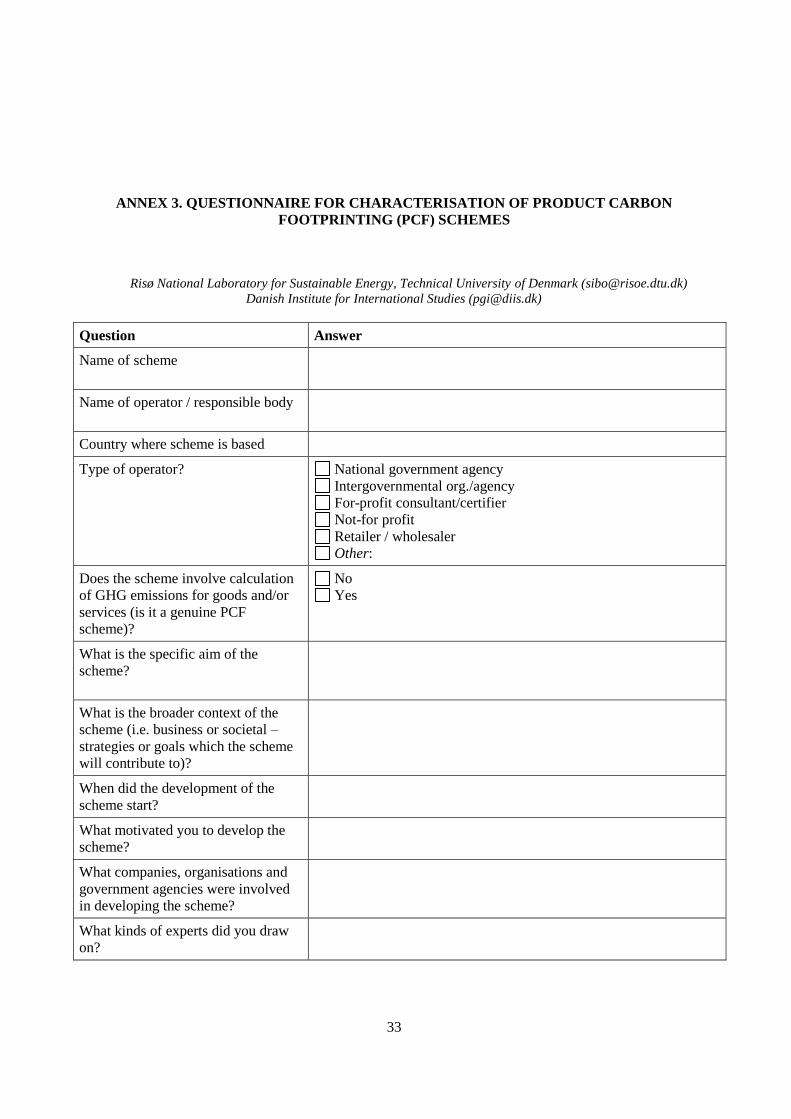
33
ANNEX 3. QUESTIONNAIRE FOR CHARACTERISATION OF PRODUCT CARBON
FOOTPRINTING (PCF) SCHEMES
Risø National Laboratory for Sustainable Energy, Technical University of Denmark ([email protected])
Danish Institute for International Studies ([email protected])
Question Answer
Name of scheme
Name of operator / responsible body
Country where scheme is based
Type of operator? National government agency
Intergovernmental org./agency
For-profit consultant/certifier
Not-for profit
Retailer / wholesaler
Other:
Does the scheme involve calculation
of GHG emissions for goods and/or
services (is it a genuine PCF
scheme)?
No
Yes
What is the specific aim of the
scheme?
What is the broader context of the
scheme (i.e. business or societal –
strategies or goals which the scheme
will contribute to)?
When did the development of the
scheme start?
What motivated you to develop the
scheme?
What companies, organisations and
government agencies were involved
in developing the scheme?
What kinds of experts did you draw
on?

34
Question Answer
Does the scheme include criteria not
related to GHG emissions (other
environment, social, etc)?
No
Yes
If yes, which criteria?
What is the current situation or stage
of the scheme?
Under development, no pilots completed
Under development, at least one pilot completed
Fully operational
Other:
What are the ‗property rights‘ of the
scheme?
Proprietary of the end user (not accessible to others)
Accessible to more than one end user
Other:
What kinds of products is carbon
footprinting offered for?
Organic food only
All foods
All goods and services
Other:
What product destinations (country of
origin) is carbon footprinting offered
for?
All countries of origin
Only domestically produced products
Other:
Which products have been approved
/certified /labelled to date under the
scheme?
How many products have been
approved/certified/labelled?
How many additional products are
currently being assessed under the
scheme (‗in the pipe line‘)?
How many firms have applied the
scheme (certified at least one product
on a pilot or permanent basis)?
Is a PCF mark/label offered? No
Yes
If yes, what kind(s) of mark/label? Declaration
g CO2 eq.
Scale
Other:
Seal
Meeting
criteria
Top runner
Off setting
Commitment
Reduction
Other:
Other comments:

35
Question Answer
How/where is the carbon footprint
information displayed?
Packaging
Shelf / point-of-sale
Website
Not for display, but for internal use
Other:
What elements does the label/mark
show?
Certification body
Comparison (with other products)
Claim (specify):
Rating
Achieved reduction
Explanation
Other:
GHG reduction commitments are: Mandatory
Optional
Not part of the scheme
Other:
Have producers and other suppliers
been asked to reduce the GHG
emissions?
No
Yes
If yes, which specifically?
What measurement methodology
(ies) is used to estimate the carbon
footprint?
Who provides technical assistance
(LCA studies, verification etc)?
What stages of the product life cycle
(supply chain) is covered?
What GHG emission sources are
omitted (if any)?
Do you put special emphasis on
transport-related GHG emissions?
No
Yes
If yes, why and how?
From where do the data come (tick
one or more option)?
Primary activity data
Secondary data
Database/source(s):
Other:
Have producers provided data for the
carbon footprinting?
No
Yes
Who pays for the carbon footprint
assessments (LCA studies)?
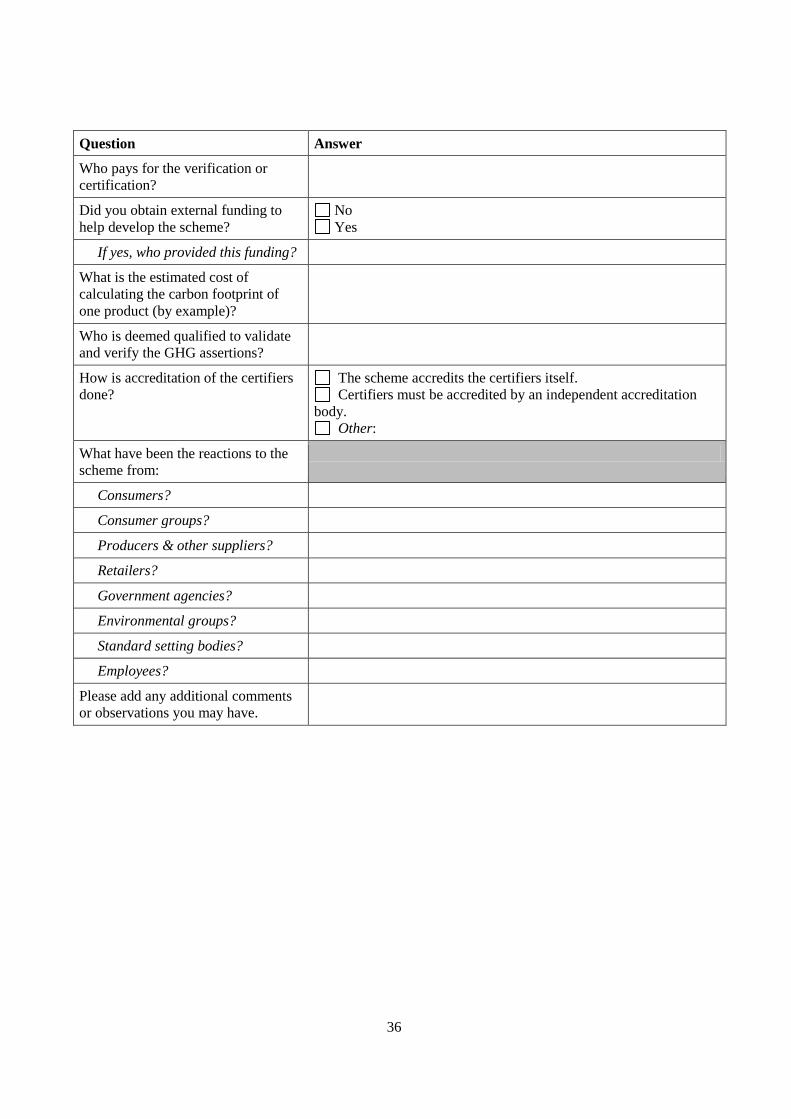
36
Question Answer
Who pays for the verification or
certification?
Did you obtain external funding to
help develop the scheme?
No
Yes
If yes, who provided this funding?
What is the estimated cost of
calculating the carbon footprint of
one product (by example)?
Who is deemed qualified to validate
and verify the GHG assertions?
How is accreditation of the certifiers
done?
The scheme accredits the certifiers itself.
Certifiers must be accredited by an independent accreditation
body.
Other:
What have been the reactions to the
scheme from:
Consumers?
Consumer groups?
Producers & other suppliers?
Retailers?
Government agencies?
Environmental groups?
Standard setting bodies?
Employees?
Please add any additional comments
or observations you may have.

37
ANNEX 4. CONSUMER SURVEY MATERIAL ON CARBON LABELING
Businesses
Business performance on environment and climate issues
‗Satisfied with the industry‘s efforts to reduce its environmental impact‘, 17%. ‗Dissatisfied with the
industry‘s impact in reducing environmental impact‘, 24%. ‗The industry could do better on reducing its
environmental impact‘, 29%. (EDS, own survey, UK)
Provision of information
About 56.3% of US and 64.4% of UK respondents want companies to provide more product-based
information on climate impacts. (Accountability & CI, own survey US-UK).
‗When making a buying decision would you value information in the form of a product CL?‘ Yes,
56% ‗No‘, 27% ‗Don‘t know‘, 17% (LEK, own survey, UK).
‗59% of consumers want to know more about the climate change impacts of the everyday products
that they buy‘. (Berry, Crossley and Jewell, own survey, UK)
‗Would it be a good or a bad thing if there was a climate label that informed you which products were
produced with low GHG emissions?‘ ‗Very good idea‘, 65%, ‗Quite a good idea‘, 28% (Naturvårdverket,
own survey, SE)
Trust of information provided by business on climate change issues
‗Do you trust information on climate change issues from retailers and manufacturers‘? (UK and US
combined) ‗A lot‘, 9% ‗A little‘, 46% ‗Not very or not at all‘, 45%. (Accountability & CI, own survey
US-UK).
‗How credible are the green claims made by retailers and manufacturers from whom you buy?‘ ‗Not
very or not at all‘, 57%. (LEK, own survey, UK)
63% of US and 76.8% of UK respondents stated that, where businesses made climate change claims,
these should be verified by independent parties. (Accountability & CI, own survey US-UK).
Consumer choices
‘Hierarchies of need’ in buying decisions
Consumers‘ informational priorities in relation to fresh and processed foods: price took clear
preference, followed by food safety (in form of use-by dates) and whether the product was subject to a
promotion (e.g., ‗buy one get one free‘). Country of origin/locally produced was prioritised next, followed
by nutritional and environmental claims (about equal). (EDS, own survey, UK)

38
Even for ‗green‘ consumers, consideration of these issues…was subsequent to price in purchase
decisions. (Vision21, own focus groups UK)
Choice of retailer and climate change issues
48.5% of US and 51.6% of UK respondents agreed with a statement that ‗they would rather do
business with companies willing to reduce their contribution to climate change‘. (Accountability & CI,
own survey)
66% stated they prefer to buy from businesses that work to reduce climate change impacts.
(Naturvårdverket, own survey, SE)
Carbon Labels and purchasing decisions
59% of ‗concerned consumers‘ and 41% of non-concerned consumers said that they would be more
likely to buy a product if it carried a CL.‘ (Upham and Bleda, own survey, UK)
Over half of those participating thought that a carbon label would make some difference to their
shopping decisions, although the great majority of these said it would make only ‗a little‘ difference.
(Vision21, own focus groups, UK)
‗If you had reliable information on the CF of a product…would you…‘ ‗Switch to a product at the
same price with a lower CF, 44%‘, ‗Pay more for a product with a smaller CF‘, 14%, ‗Do nothing‘ 17%.
(LEK, own survey, UK)
‗How much extra cost per year would you incur to minimize your (shopping) CF?‘ ‗None‘, 40%,
‗<£20‘, 16%, £20-£50‘, 20%, ‗>£50‘, 7%. (LEK, own survey, UK)
‗Pilots reveal no clear impact on shoppers‘ behaviour‘ (Aitken, no source cited, UK).
‗Consumers overwhelmingly said that they would not be willing to pay a premium for carbon labeled
products – even those who said they might pay a little more for ethically-sourced, local or organic
products.‘ (Upham and Bleda, reporting Pepisco focus groups, UK)
‗Would you buy carbon labeled products?‘ ‗Yes, if there was a 5-10% price increase (only)‘, 9%
‗Yes, but only if there was no price increase‘, 44%, ‗No‘, 25% ‗Don‘t know‘, 22%. (Pirog & Rasmussen,
own survey, US)
‗What would you pay for a product that had a PCF 50% lower than another in the same category?‘
‗I‘d pay less‘, 8% ‗I‘d only pay the same amount‘, 54% ‗I‘d pay 10% more‘, 29% ‗I‘d pay 20% more‘,
5% ‗I‘d pay 30% more‘, 2%. (Pirog & Rasmussen, own survey, US)
‗How often would you choose climate labeled food if this was possible?‘ ‗Always‘, 16%, ‗Often‘,
57%, ‗Sometimes‘, 20%, ‗Never‘, 5%. (Toivonen, own survey, SE)
‗32% would certainly pay 5% more for a product from a business they knew was working to reduce
GHG emissions, and 48% would probably pay more‘. (Naturvårdverket, own survey, SE)
‗How much extra would you be willing to pay for climate labeled food?‘ ‗Nothing, 10%. ‗10%‘,
40%, ‗20%‘, 22.5%, ‗30% or more‘, 5%, ‗Don‘t know‘, 15%.(Toivonen, own survey, SE)

39
Carbon Label Design
Labels stating PCF in grams were considered unhelpful since they required the consumer to find and
review other products before making a decision. A traffic light system would avoid this problem.
(Vision21, own focus groups, UK)
The most popular format with consumers would be traffic lights or a low carbon stamp. ‗Our research
showed a mismatch between the information that consumers want and what they are likely to get through
the Carbon Trust approach.‘ (Berry, Crossley and Jewell, own focus groups, UK)
72% said that they thought that, on a CF label, the number of grams CO2e should be stated.‘ (Upham
and Bleda, reporting Boots Advantage Cardholders‘ survey, UK)
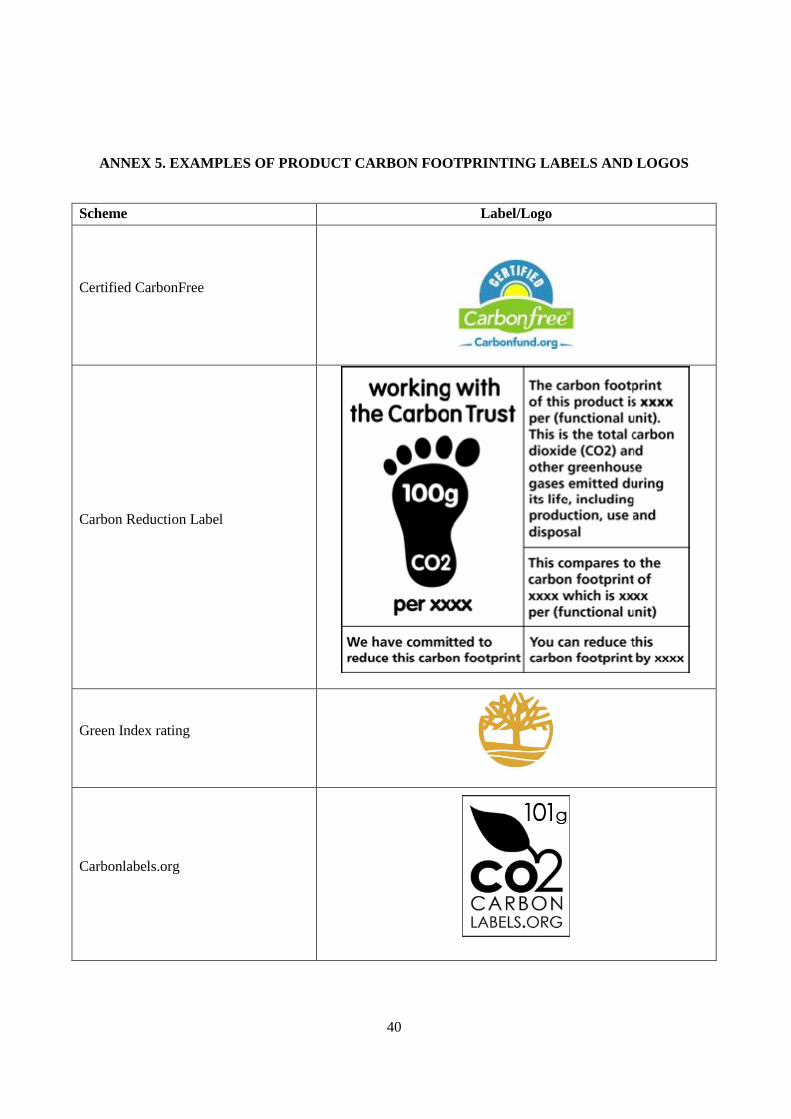
40
ANNEX 5. EXAMPLES OF PRODUCT CARBON FOOTPRINTING LABELS AND LOGOS
Scheme Label/Logo
Certified CarbonFree
Carbon Reduction Label
Green Index rating
Carbonlabels.org

41
Scheme Label/Logo
Carbon Connect
Approved by Climatop
Stop Climate Change
L‘Indice Carbone Casino
Verified Sustainable Ethanol Initiative