Global Footprint | November 2008 | © 2008 PRTM Proprietary and Confidential Michael Aghajanian...
16
Global Footprint | November 2008 | © 2008 PRTM Proprietary and Confidential Michael Aghajanian Michael Aghajanian Managing Director Managing Director PRTM PRTM Global Footprint Global Footprint Overview Overview
-
Upload
holly-barrett -
Category
Documents
-
view
214 -
download
0
Transcript of Global Footprint | November 2008 | © 2008 PRTM Proprietary and Confidential Michael Aghajanian...

Global Footprint | November 2008 | © 2008 PRTM Proprietary and Confidential
Michael AghajanianMichael Aghajanian
Managing Director Managing Director PRTMPRTM
Global Footprint OverviewGlobal Footprint Overview

Global Footprint | November 2008 | © 2008 PRTM Proprietary and Confidential
PanelistsPanelists
Name Title/Company Discussion Topic
Michael Aghajanian Managing Director – PRTM Global footprint overview
David Pyott Chairman and CEO – AllerganGlobal supply chain, beyond logistics
Stephen MarlowExecutive Vice President – Toshiba America Electronic Components
Supplying global customers/ geographic risk management
John O’ Connor Director of Global Supply Chain – Cisco Supply chain resiliency
Kate GutmannVice President, Marketing, Europe Region – UPS
Enabling globalization
2
Global Footprint | November 2008 | © 2008 PRTM Proprietary and Confidential
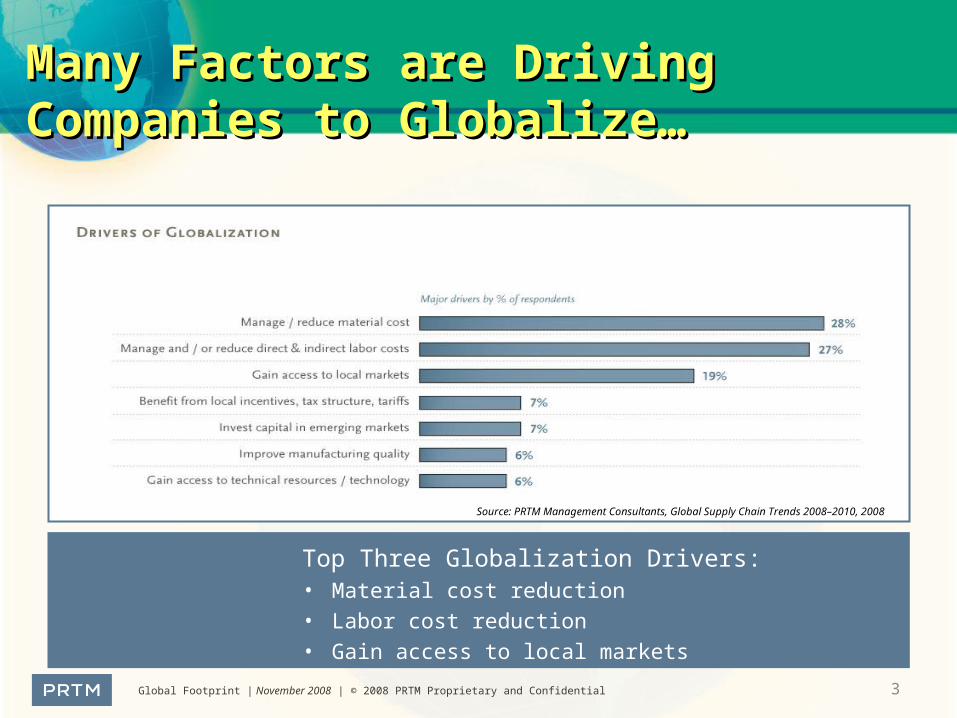
Many Factors are Driving Companies Many Factors are Driving Companies to Globalize…to Globalize…
3
Top Three Globalization Drivers:• Material cost reduction• Labor cost reduction• Gain access to local markets
Source: PRTM Management Consultants, Global Supply Chain Trends 2008–2010, 2008

Global Footprint | November 2008 | © 2008 PRTM Proprietary and Confidential
……As a Result, Globalization Is As a Result, Globalization Is AcceleratingAccelerating
Source: PRTM Management Consultants, Global Supply Chain Trends 2008–2010, 2008
• More than 50% of manufacturing will be globalized by 2010• Product Development globalization to increase 105% by 2010
4

Global Footprint | November 2008 | © 2008 PRTM Proprietary and Confidential
What Is a Global Footprint?What Is a Global Footprint?
5
Manufacturing & Assembly
Research & Development
Contract manufacturing
Distribution Hubs
Strategic Suppliers
Sales Office
Global Footprints often expand as a result of individual functional initiatives
East coast expansion
Expansion to leverage acquisition
Europeangrowth
Expansion for low-cost manufacturing and market access
Expansion for back office support and software development
Silicon valley startup
?
Future emerging market expansion
?

Global Footprint | November 2008 | © 2008 PRTM Proprietary and Confidential
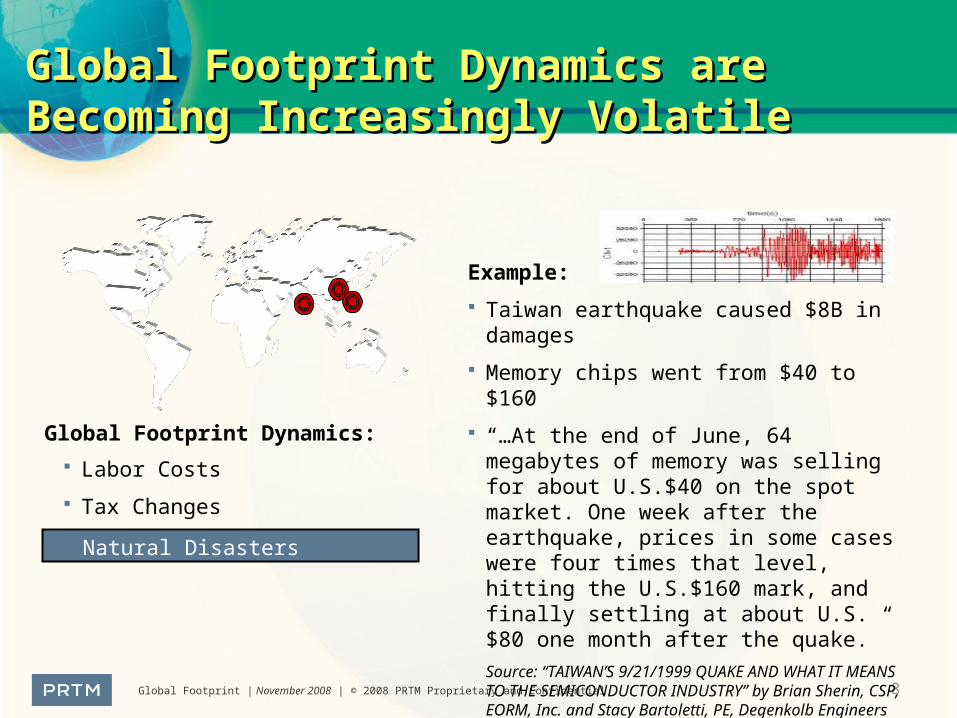
Global Footprint Dynamics are Becoming Global Footprint Dynamics are Becoming Increasingly VolatileIncreasingly Volatile
Global Footprint Dynamics:
6
Labor Costs
Example:
India's software-and-service association puts wage inflation in its industry at 10% to 15% a year
Can the U.S. Bring Jobs Back from China?June 19, 2008
Typical annual salary increases in China are between 8–15%

Global Footprint | November 2008 | © 2008 PRTM Proprietary and Confidential
Global Footprint Dynamics are Becoming Global Footprint Dynamics are Becoming Increasingly VolatileIncreasingly Volatile
Global Footprint Dynamics:
Example:
Effective January 1, 2008, the Chinese government has removed the two-year tax holiday for foreign invested manufacturing enterprises in China
In the past, foreign investors in Chinese manufacturing operations were eligible for a two-year, 100 percent tax holiday followed by a 50 percent income tax rate reduction for the next three years
The change will have a significant impact on the taxation of foreign invested enterprises operating in China
Tax Changes
7
Labor Costs
Global Footprint | November 2008 | © 2008 PRTM Proprietary and Confidential
Global Footprint Dynamics are Becoming Global Footprint Dynamics are Becoming Increasingly VolatileIncreasingly Volatile
Global Footprint Dynamics:
Labor Costs
Tax Changes
8
Example:
Taiwan earthquake caused $8B in damages
Memory chips went from $40 to $160
“…At the end of June, 64 megabytes of memory was selling for about U.S.$40 on the spot market. One week after the earthquake, prices in some cases were four times that level, hitting the U.S.$160 mark, and finally settling at about U.S.$80 one month after the quake.”
Source: “TAIWAN’S 9/21/1999 QUAKE AND WHAT IT MEANS TO THE SEMICONDUCTOR INDUSTRY” by Brian Sherin, CSP, EORM, Inc. and Stacy Bartoletti, PE, Degenkolb Engineers
Natural Disasters

Global Footprint | November 2008 | © 2008 PRTM Proprietary and Confidential
Global Footprint Dynamics are Becoming Global Footprint Dynamics are Becoming Increasingly VolatileIncreasingly Volatile
Global Footprint Dynamics:
9
Logistics/Shipping Costs
Example:
Volatile crude oil prices ranged between $145 and below $60
Can the U.S. Bring Jobs Back from China?June 19, 2008
Labor Costs
Tax Changes
Natural Disasters
Global Footprint | November 2008 | © 2008 PRTM Proprietary and Confidential
Global Footprint Dynamics are Becoming Global Footprint Dynamics are Becoming Increasingly VolatileIncreasingly Volatile
1010
Global Footprint Dynamics:
Labor Costs
Tax Changes
Natural Disasters
Logistics/Shipping Costs
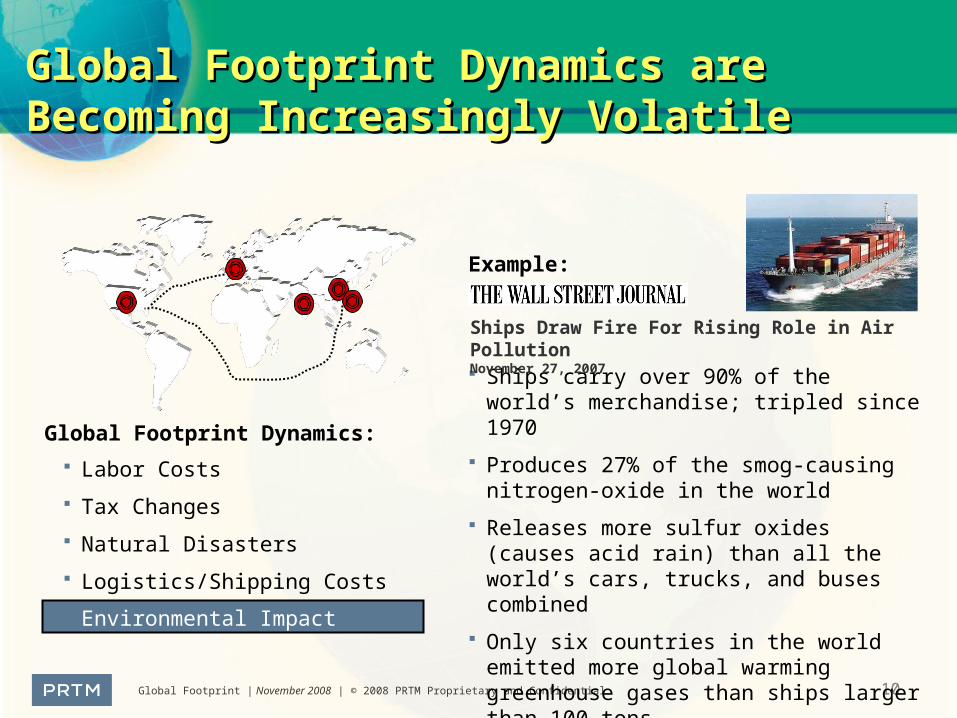
Example:
Ships carry over 90% of the world’s merchandise; tripled since 1970
Produces 27% of the smog-causing nitrogen-oxide in the world
Releases more sulfur oxides (causes acid rain) than all the world’s cars, trucks, and buses combined
Only six countries in the world emitted more global warming greenhouse gases than ships larger than 100 tons
Ships Draw Fire For Rising Role in Air PollutionNovember 27, 2007
Environmental Impact

Global Footprint | November 2008 | © 2008 PRTM Proprietary and Confidential
Global Footprint Dynamics are Becoming Global Footprint Dynamics are Becoming Increasingly VolatileIncreasingly Volatile
Global Footprint Dynamics:
Labor Costs
Tax Changes
Natural Disasters
Logistics/Shipping Costs
Environmental Impact
11
Example:
U.S. Dollar vs. Brazil Real fluctuated by over 35% in a three-month period; NII Holdings (South American wireless operator) reported a Q308 $56.4M foreign currency transaction loss Source: NII Holdings Q308 Results
Recently, Yen appreciated 15% vs. U.S. Dollar; Honda: Q308, reported a $454M foreign currency affect loss-- Kochi Kondo, EVP, Honda: “Each one-yen rise against the dollar reduces the company’s annual operating profit by 18 billion yen” Source: Honda Q308 Results
STMicroelectronics: Q208, a 17% change in $/Euro resulted in 46% loss in operating income Source: STMicroelectronics Q208 Investor Presentation
Currency Fluctuations
Global Footprint | November 2008 | © 2008 PRTM Proprietary and Confidential
Global Footprint Dynamics Are Becoming Global Footprint Dynamics Are Becoming Increasingly VolatileIncreasingly Volatile
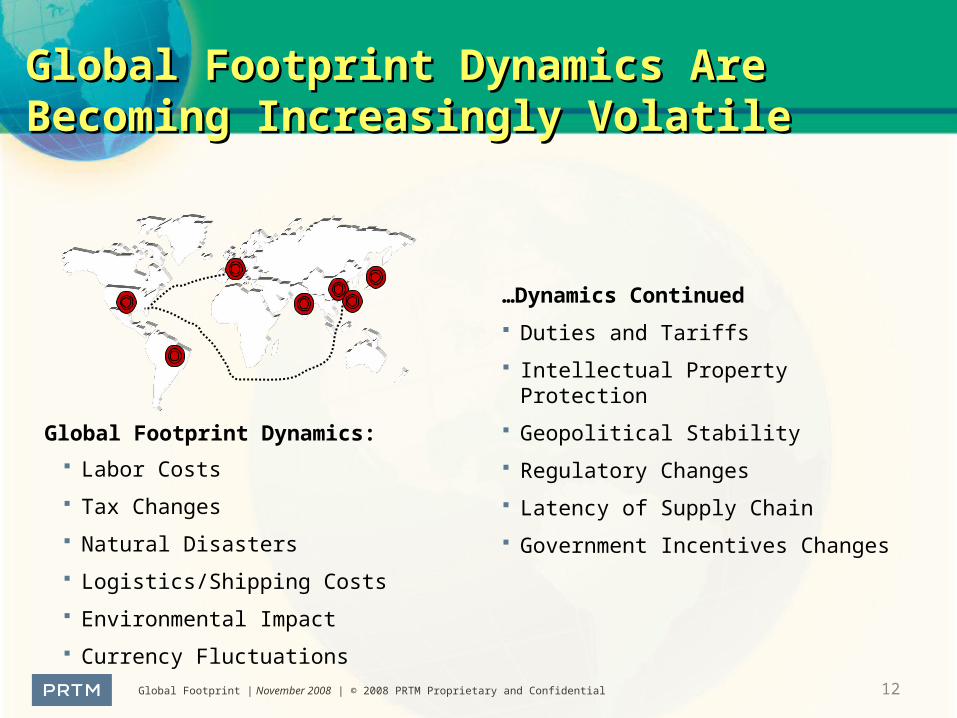
…Dynamics Continued
Duties and Tariffs
Intellectual Property Protection
Geopolitical Stability
Regulatory Changes
Latency of Supply Chain
Government Incentives Changes
Global Footprint Dynamics:
Labor Costs
Tax Changes
Natural Disasters
Logistics/Shipping Costs
Environmental Impact
Currency Fluctuations
12

Global Footprint | November 2008 | © 2008 PRTM Proprietary and Confidential
Operational Risks are Escalating as a Result of Operational Risks are Escalating as a Result of Footprint Expansion and Volatile Global DynamicsFootprint Expansion and Volatile Global Dynamics
13
+ =Global Footprint
Expansion
Increasing Global
Dynamics Volatility
Escalating Operational
Risks
Out of a random sampling of twenty Fortune 500 manufacturing companies, 100% of them have identified multiple global footprint risks in their annual report

Global Footprint | November 2008 | © 2008 PRTM Proprietary and Confidential
Global Footprints Must Be Strategically Global Footprints Must Be Strategically ManagedManaged
14
Assess Current Footprint Optimized FootprintGlobal Footprint Redesign
Global Footprints must be: Dynamically managed with designated resources
Designed with a short-time horizon for break even cost/benefit analysis
Fully evaluated with exit/switching costs and high variance sensitivity analysis
Designed with flexibility by including options that hedge against risks
Benefits
Risks
Non-OptimizedFootprint
OptimizedGlobal Footprint
Efficient Frontier

Global Footprint | November 2008 | © 2008 PRTM Proprietary and Confidential
Case Example: Medical Devices Case Example: Medical Devices CompanyCompany
15
100%
88%
3%
1%6%
1%
1%
SpendAddressed
G&A Indirect Mfg. R&D Logistics TargetSpend
Identified and achieving significant EBITDA improvement
Lowering G&A reducing global operational complexity
Moving to indirect and export models for sub-scale countries
Reconfiguring with low-cost country manufacturing
Realigning the global R&D capability to leverage low cost countries
Identifying risks through high variance sensitivity analysis and mitigating risks with exit strategy planning and hedging
Situation Summary Global Operations Levers Impact
COGSR&DSG&A
12%
Over $100M of EBITDA improvement being delivered

Global Footprint | November 2008 | © 2008 PRTM Proprietary and Confidential
ConclusionsConclusions
16
Most companies are not adequately assessing or mitigating escalating Global
Footprint risks
Companies must closely examine their Global Footprint…
On a semi-annual basis and when major events occur
In a rigorous, repeatable, and structured process
With designated resources and executive support
The Global Footprint must be strategically planed from an end-to-end
perspective, not driven via functional silos (e.g., logistics, manufacturing, R&D)
Do you fully understand the value and risks associated with your Global Footprint?