
Global Express and Small Parcels Report 2017 - Sample · Global Express and Small Parcels Report /...
8
Global Express and Small Parcels Report 2017 - Sample
Transcript of Global Express and Small Parcels Report 2017 - Sample · Global Express and Small Parcels Report /...
Global Express and Small Parcels Report 2017 - Sample
Global Express and Small Parcels Report / 2017
ti-insight.com 2
ABOUT Ti 3
01 Disruption and Innovation in the Express and Parcels Sector 4
1.1 SHARING ECONOMY AND CROWDSHIPPING 5
1.2 NEW MARKET ENTRANTS 8
1.3 INCUMBENTS: FIGHTING BACK 10
1.4 AMAZON – THE ULTIMATE DISRUPTOR 13
1.5 BLOCKCHAIN IN THE EXPRESS INDUSTRY 16
1.6 ALTERNATIVE FUEL VEHICLES 18
1.7 NEW TECHNOLOGIES 21
02 Future Trends 26
2.1 URBANIZATION 26
2.2 GLOBALIZATION OR REGIONALIZATION? 33
03 Market Size and Forecasts 40
3.1 GLOBAL EXPRESS PARCELS MARKET 40
3.2 ASIA PACIFIC EXPRESS PARCELS MARKET 44
3.3 EUROPEAN EXPRESS PARCELS MARKET 47
3.4 MIDDLE EAST EXPRESS PARCELS MARKET 50
3.5 NORTH AMERICAN EXPRESS PARCELS MARKET 52
3.6 RUSSIA, CAUCASUS AND CENTRAL ASIA EXPRESS PARCELS MARKET 55
3.7 SOUTH AMERICAN EXPRESS PARCELS MARKET 57
3.8 SUB-SAHARAN AFRICA EXPRESS PARCELS MARKET 60
04 Global Express Market Survey 62
05 Major Express Players 70
5.1 COMPARATIVE REVIEW OF THE YEAR 70
5.2 UPS 74
5.3 FEDEX 81
5.4 DHL 88
5.5 REVIEW OF MARKET ACTIVITY BY REGION 93
CONTACT US 103
CONTENTS
Global Express and Small Parcels Report / 2017
ti-insight.com 3
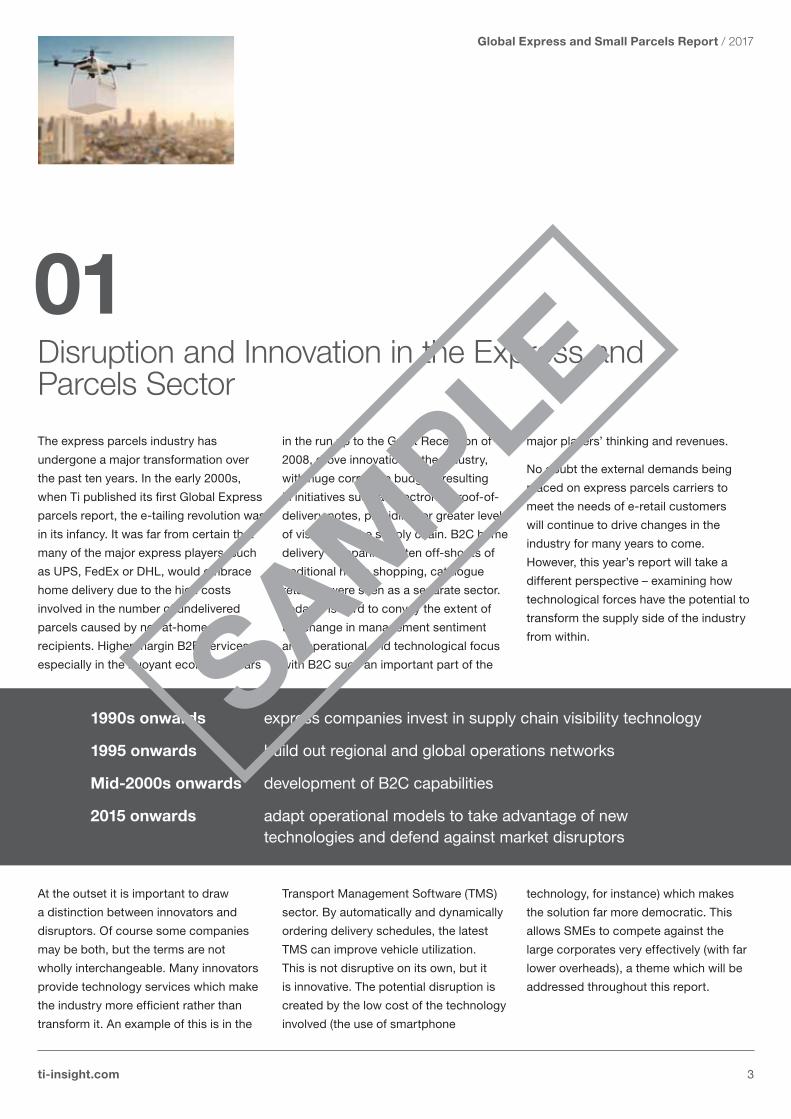
The express parcels industry has
undergone a major transformation over
the past ten years. In the early 2000s,
when Ti published its first Global Express
parcels report, the e-tailing revolution was
in its infancy. It was far from certain that
many of the major express players, such
as UPS, FedEx or DHL, would embrace
home delivery due to the high costs
involved in the number of undelivered
parcels caused by not-at-home end-
recipients. Higher margin B2B services,
especially in the buoyant economic years
in the run up to the Great Recession of
2008, drove innovation in the industry,
with huge corporate budgets resulting
in initiatives such as electronic proof-of-
delivery notes, providing for greater levels
of visibility in the supply chain. B2C home
delivery companies, often off-shoots of
traditional home shopping, catalogue
retailers were seen as a separate sector.
Today it is hard to convey the extent of
the change in management sentiment
and operational and technological focus
with B2C such an important part of the
major players’ thinking and revenues.
No doubt the external demands being
placed on express parcels carriers to
meet the needs of e-retail customers
will continue to drive changes in the
industry for many years to come.
However, this year’s report will take a
different perspective – examining how
technological forces have the potential to
transform the supply side of the industry
from within.
At the outset it is important to draw
a distinction between innovators and
disruptors. Of course some companies
may be both, but the terms are not
wholly interchangeable. Many innovators
provide technology services which make
the industry more efficient rather than
transform it. An example of this is in the
Transport Management Software (TMS)
sector. By automatically and dynamically
ordering delivery schedules, the latest
TMS can improve vehicle utilization.
This is not disruptive on its own, but it
is innovative. The potential disruption is
created by the low cost of the technology
involved (the use of smartphone
technology, for instance) which makes
the solution far more democratic. This
allows SMEs to compete against the
large corporates very effectively (with far
lower overheads), a theme which will be
addressed throughout this report.
1990s onwards express companies invest in supply chain visibility technology
1995 onwards build out regional and global operations networks
Mid-2000s onwards development of B2C capabilities
2015 onwards adapt operational models to take advantage of new technologies and defend against market disruptors
01Disruption and Innovation in the Express and Parcels Sector

Global Express and Small Parcels Report / 2017
ti-insight.com 4
According to a recent report by the UN,
the current world population of 7.6 billion
is expected to reach 8.6 billion in 2030, 9.8
billion in 2050 and 11.2 billion in 2100.
From 2017 to 2050, it is expected that half
of the world’s population growth will be
concentrated in just nine countries: India,
Nigeria, the Democratic Republic of the
Congo, Pakistan, Ethiopia, the United
Republic of Tanzania, the United States of
America, Uganda and Indonesia (ordered
by their expected contribution to total
growth).
At present, 54.5% live in urban
settlements. By 2030, this is expected to
rise to 60% and by 2050, this could rise to
two-thirds of the population. For express
providers, the denser population provides
opportunities. However, the growth in
population also adds to congestion issues
and it will require a partnership between
administrators, infrastructure providers,
technology companies and express
operators to devise solutions to these
challenges.
The network profile of operators will
inevitably vary depending on the type
of development experienced. This in
turn will depend on the competence of
urban planners. One study concluded
that growth is rarely optimized when
‘…multiple objectives such as profit,
equity, and ecological integrity come
into conflict.’ This can result in what has
been termed ‘urban sprawl’ which is
exacerbated by enhanced mobility.
In less developed countries, the rapid
movement of populations to areas just
outside cities provides complex problems.
The favelas of Rio de Janerio are an
example of this, where living conditions
are poor and poverty is widespread.
Careful city planning can provide
opportunities for express providers.
With more efficient transport networks
surrounding these areas, the last mile
service is more efficient than it would be
for rural areas. However urban sprawl is
generally lower density than inner cities
and so efficiency is decreased from that
perspective.
As well as growing wider, cities are
also getting taller. Within the last
mile, providing services to a denser
population is far more beneficial than
moving towards rural areas. However,
building up means there is increased
congestion on the ground. This provides
transport challenges and means that
more sophisticated infrastructure
planning is needed. These challenges
will only be exacerbated by the increased
e-commerce volumes.
02Future Trends
2.1 URBANIZATION
Global Express and Small Parcels Report / 2017
ti-insight.com 5
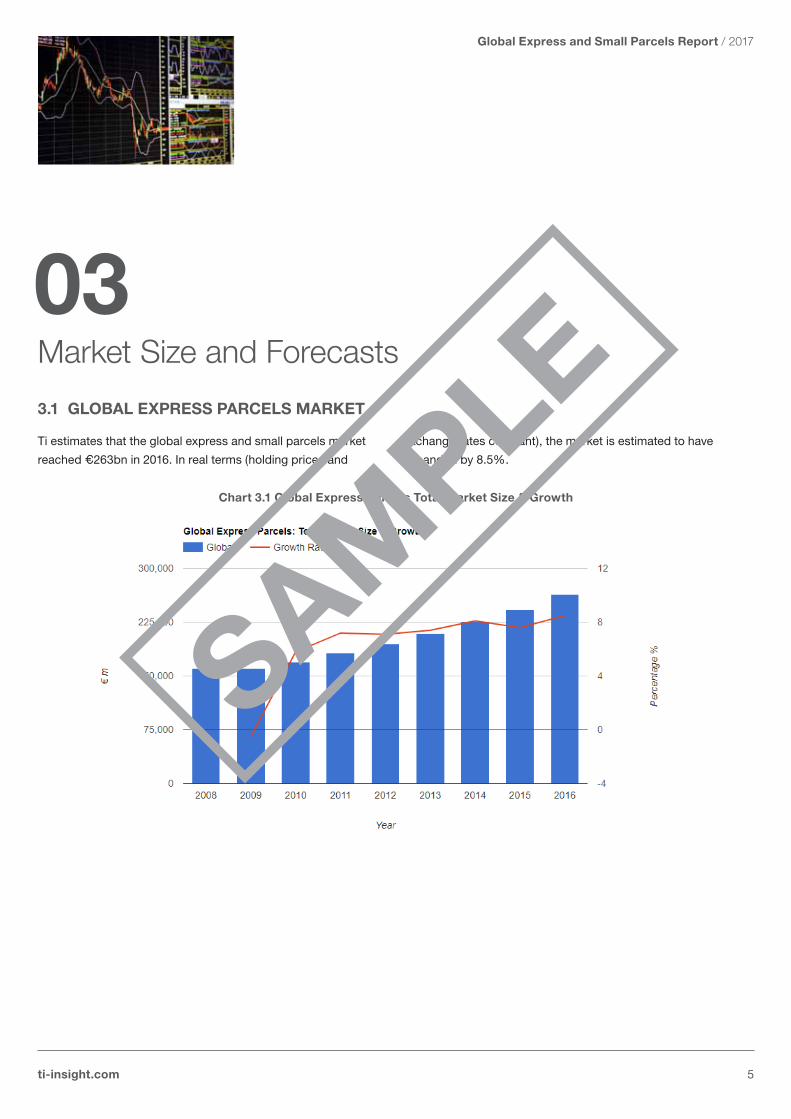
Ti estimates that the global express and small parcels market
reached €263bn in 2016. In real terms (holding prices and
exchange rates constant), the market is estimated to have
expanded by 8.5%.
03Market Size and Forecasts
3.1 GLOBAL EXPRESS PARCELS MARKET
Chart 3.1 Global Express Parcels Total Market Size & Growth

Global Express and Small Parcels Report / 2017
ti-insight.com 6
In July 2017 Ti undertook a market survey of over 100 executives active in the global express and parcels market.
Cross-Border Volumes
Chart 4.1 What changes are you experiencing in cross-border parcel volumes in the following regions?
Cross-border volumes, especially related
to the growth in e-commerce platforms
such as Alibaba and Amazon have been
identified by many large express carriers
as a driver of future growth. This is borne
out by the results of the survey although
not every region has benefited to the same
degree.
China, then Europe followed by the rest of
the Asia Pacific region (excluding China
and India) are experiencing the greatest
increases in cross-border volumes. In
fact, 46% of European respondents
indicated that they were experiencing
volume growth of more 10%, a fact no
doubt attributable to the closely integrated
Single European Market. China, the
world’s largest manufacturing exporter,
also saw double digit-plus growth in
cross-border volumes.
At the other end of the spectrum, the Latin
America and Middle East/North Africa
regions reported the fewest respondents
experiencing 10%+ growth. This is
reflected in the chart below which shows
overall indicative average cross-border
growth rates by region.
04Global Express Market Survey
ti-insight.com 7
05Major Express Players
All of the major express carriers benefited
from the positive impact of e-commerce
and a more robust global economy in
2016. Indeed, this has carried into the first
half of 2017.
DHL’s ‘Post-eCommerce-Parcel’(PeP)
saw revenues increase by 4.1% fuelled
by volume increases in the e-commerce-
Parcel unit, 9.3% in Germany for instance.
Profit margins hardened from 6.8% in
2015 to 8.6% in 2016.
Its Express division, focused on the more
mature time definite B2B market, saw
revenues increase by a slower 2.7%,
impacted by currency fluctuations.
Without these, revenue growth would
have been 5.9%. Its international volumes
increased by 7.6% (domestic by 9.9%)
and profits jumped by double digits
(11.3%). This allowed it to increase
margins to just over 11%, coming into line
with its closest competitors.
For 2016, UPS recorded a revenue
increase of 4.2% in its U.S. Domestic
Package segment. Despite volume growth
of 4.1% and the growth of the number of
delivery stops by 4.4%, the use of its new
ORION transport management system
meant that package miles only increased
by 0.2%.
It was not all good news. Yields fell in its
Next Day Air and Ground businesses due,
in part, to lighter packages caused by a
greater volume of e-commerce packages.
UPS’s International Package division
achieved year-on-year revenue growth
of 1.7%: Domestic package volumes (i.e.
non-USA domestic packages) increased
by 3.8% for the year, whilst Export (cross-
border) volumes rose by 5.1%. However
as can be deduced from these figures,
there were declines in yields caused by
currency and fuel surcharge rates. UPS
noted particular success in its export
services on the Europe-to-U.S. and intra-
Europe trade lanes, though exports from
the US were negatively affected by the
strength of the US Dollar.
FedEx Express revenue increased 3% in
2016 (year end 31 May 2017), impacted by
unfavourable currency rates (not including
revenue from its TNT acquisition). Overall
average daily volumes grew by 2%,
although international volumes grew faster
at 3%, and margin reached 9.8% with
profits increasing strongly as a result of
growth in e-commerce, including B2B
e-commerce, and global trade growth.
FedEx Ground revenues increased 10%
in the year although segment margin
(including FedEx Supply Chain) was down
on the previous year at 12.7%, partly as
a result of network expansion costs. Its
volumes were up 5%.
Including the TNT acquisition, the
company’s overall revenues increased by
20%.
In Europe, GeoPost, the subsidiary of La
Poste Group, saw its revenues increase
by 8.6%, an improvement which was
primarily driven by an increase in volumes
(11.2%). Best performing markets were
UK, France and Spain, all recording
double digit revenue increases. B2C has
become highly important to the company
with this segment increasing by 22% year-
on-year. Margins improved from 4.7% to
7.1% as the company managed its cost
base effectively.
Rival Royal Mail-owned GLS, also
performed well. Its revenues increased by
9% excluding acquisitions and its volumes
rose at the same rate. Due to a more
beneficial product mix with the increase
of international volumes, this would have
been greater but for lower average parcel
weights. Margins improved slightly to
7.8%.
Aramex saw a significant increase in
revenue by 15.7% whilst at the same time
5.1 COMPARATIVE REVIEW OF THE YEAR

Global Express and Small Parcels Report / 2017
ti-insight.com 8
CONTACT US
Michael Clover
Business Development Manager
Direct: +44(0)1666 519907
Email: [email protected]
Skype: mjcloverti
Linkedin: uk.linkedin.com/in/michael-clover-95625187