global equity capital markets review - Thomson Reuters Deal
18
GLOBAL EQUITY CAPITAL MARKETS REVIEW MANAGING UNDERWRITERS First Half 2013
Transcript of global equity capital markets review - Thomson Reuters Deal
GLOBAL EQUITY CAPITAL MARKETS REVIEWMANAGING UNDERWRITERS
First Half 2013

14
3
EMEA Convertibles (C9d)
2
2
EMEA Rights Offerings (C8fr)
Japan Equity & Equity-Related (C1e)
Regional Contacts
13
9
15
8
9
Japan Common Stock (C4d)
9 14
3
3
Global Deals Intelligence
Leading Underwriters for Second Qtr '13
Global Scorecard
Global Debt, Equity & Equity Related (A1)
1
2
2
Global Equity
Global Common Stock (C2)
Global Convertibles (C9)
15
13
Asia Equity
9
Global IPOs (C5)
8
Japan IPOs (C7d)
Criteria Summary
EMEA Equity
EMEA Equity & Equity-related (C1d)
EMEA Common Stock (C4c)
EMEA Deals Intelligence
EMEA IPOs (C7c)
Global Equity & Equity-Related (C1)
Equity Capital Markets Criteria Summary
10
Japan Convertible Offerings (C9e)
First Half 2013 | Equity Capital Markets | Managing Underwriters
Equity Capital Markets ReviewTable of Contents
14
Asia Equity & Equity-Related, inc Chinese A-shares (C1b)
Japan Secondary Offerings (C8d)
Japan Equity
New Zealand Common Stock (Custom) 12
4
7
6
6
6
5
US Convertibles (C9a)
US Common Stock (C3)
US Equity
US Deals Intelligence
12
5
11
11
Asia Convertibles, inc Chinese A-shares (C9b)
Asia IPOs, inc Chinese A-shares (C7a)
US IPOs (C6)
5
Banking Composite of Top US Equity Bookrunners
Asia Common Stock, inc Chinese A-shares (C4a) 11
Asia Equity & Equity-Related, ex Chinese A-shares (C1ba)
Asia Secondary Offerings, inc Chinese A-shares (C8c)
10
11
Australian Equity & Equity-related (AK1)
Australia & New Zealand Equity
Australian Common Stock (AK2) 12
Thomson Reuters Solutions for the Deal Making Community
16
US Block Trades and Accelerated Bookbuilds (C3a)
US Equity & Equity-Related (C1a)
Global Equity Rankings - Last Ten Years
https://www.thomsonone.com
Global Deals Intelligence
Global Equity & Equity-Related Volume
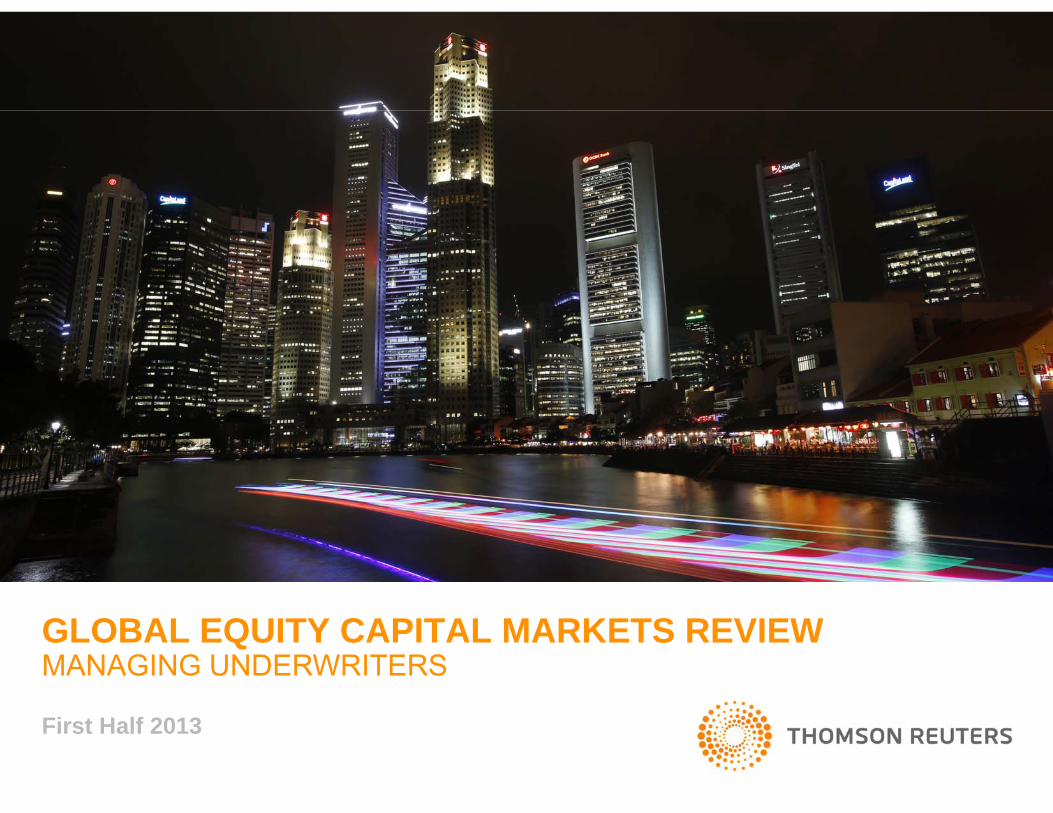
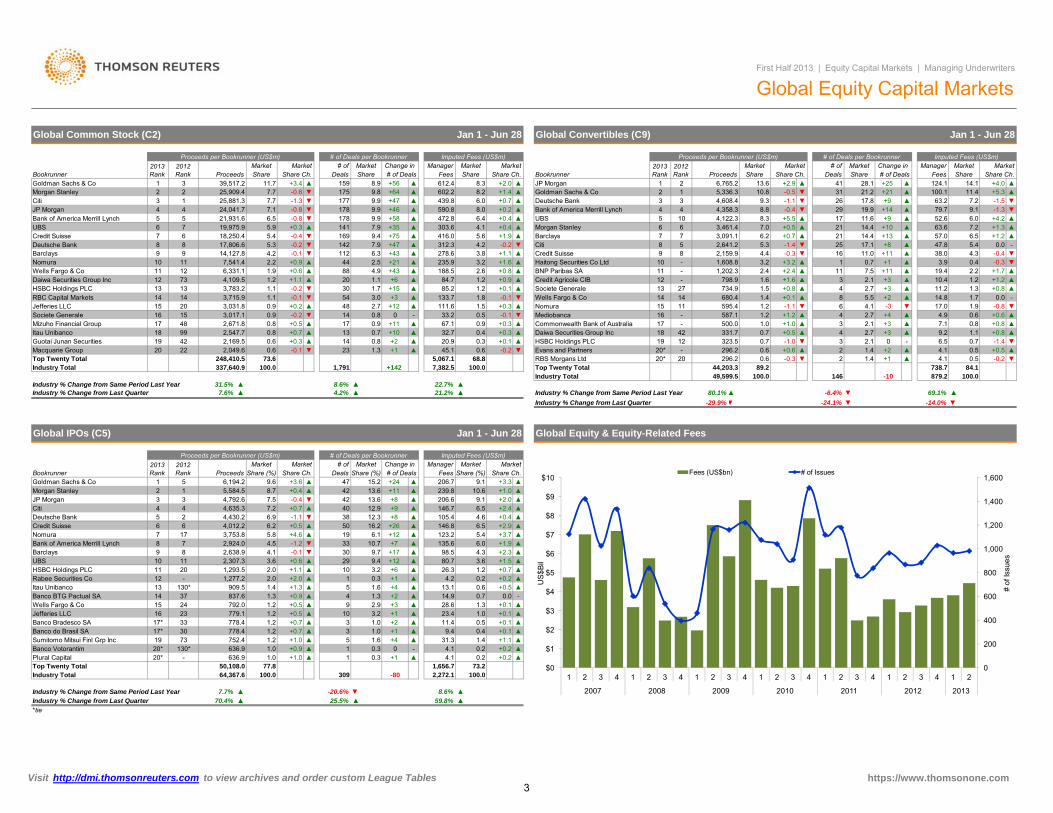
Global Equity Capital Markets Up 36% Over 2012 I Follow-On Activity Up 39% I Emerging Markets IPOs Account for 32% I Goldman Sachs Tops ECM Ranking
EQUITY CAPITAL MARKETS REVIEWFirst Half 2013
Global IPOs and Emerging Markets
GLOBAL ECM ACTIVITY UP 36% - Equity capital markets activity totaled US$387.2 billion during the first half of2013, a 36% increase from the comparable period in 2012 and the strongest annual start for global equity capitalmarkets issuance in two years. Second quarter equity capital markets issuance totaled US$195.4 billion, a 2%increase compared to the first quarter of this year.
FOLLOW-ONS UP 39% FROM 2012 - Global follow-on offerings totaled US$273.3 billion during first half 2013, anincrease of 39% compared to the first half of 2012. Follow-on common stock sales from the real estate sectorraised $46.8 billion during the first half of 2013, accounting for 17% of overall activity. Offerings from the UnitedStates accounted for 34% of global follow-on issuance, while China and Japan comprised 9% and 7%,respectively.
IPOs UP 8% FROM 2012; EMERGING MARKETS ACCOUNT FOR 32% - Initial public offering activity during thefirst half of 2013 totaled US$64.4 billion, an increase of 8% from last year at this time. IPO activity during thesecond quarter of 2013 increased 70% compared to the first quarter of this year. Issuers from the emergingmarkets raised US$20.4 billion during the first half of 2013, accounting for 32% of IPO volume during the period.
UNITED STATES ISSUERS ACCOUNT FOR 35% - Issuers from the United States raised US$135.6 billion in theglobal equity capital markets during the first half of 2013, up 20% compared to last year at this time. Issuers from
1,600$400Proceeds (US$b) # of Issues
0
10
20
30
40
50
60
70
80
$0
$20,000
$40,000
$60,000
$80,000
$100,000
$120,000
$140,000
1 2 3 4 1 2 3 4 1 2 3 4 1 2 3 4 1 2 3 4 1 2 3 4 1 2
2007 2008 2009 2010 2011 2012 2013
% o
f Pro
ceed
s fro
m E
mer
ging
Mar
kets
Pro
ceed
s (U
S$b
)
Global IPOs (US$bil) % of Emerging Markets IPOs
Global Equity & Equity-Related Volume by Domicile Region
global equity capital markets during the first half of 2013, up 20% compared to last year at this time. Issuers fromChina and Japan accounted for 9% and 7%, respectively, of overall equity capital markets activity during the firsthalf of 2013.
FOUR SECTORS ACCOUNT FOR 60% OF ACTIVITY - Led by financial issuers (19%), the overall volume ofequity capital markets activity remained highly concentrated among four main sectors including real estate (16%),energy and power (14%) and industrials (12%).
GOLDMAN SACHS TOPS OVERALL ECM RANKING - Goldman Sachs led all equity capital marketsunderwriters during the first half of 2013 with US$44.9 billion in proceeds from 190 issues, an increase of 3.0market share points compared to the first half of 2012. Goldman Sachs registered strong market share gains totake the top spot for global IPOs and global common stock offerings. JP Morgan topped the list of globalconvertible underwriters, with 13.6% market share.
ECM FEES UP 26% - According to estimates from Freeman Consulting, fees from equity capital marketstransactions during the first half of 2013 totaled US$8.3 billion, a 26% increase from this time last year.
0
200
400
600
800
1,000
1,200
1,400
$0
$50
$100
$150
$200
$250
$300
$350
1 2 3 4 1 2 3 4 1 2 3 4 1 2 3 4 1 2 3 4 1 2 3 4 1 2
2007 2008 2009 2010 2011 2012 2013
# of
Issu
es
Pro
ceed
s (U
S$b
)
Proceeds (US$b) # of Issues
0%
10%
20%
30%
40%
50%
60%
70%
80%
90%
100%
2000 2001 2002 2003 2004 2005 2006 2007 2008 2009 2010 2011 2012 H12013Africa/Middle East/Central Asia Japan Asia-Pacific Europe Americas
https://www.thomsonone.comVisit http://dmi.thomsonreuters.com to view archives and order custom League Tables1
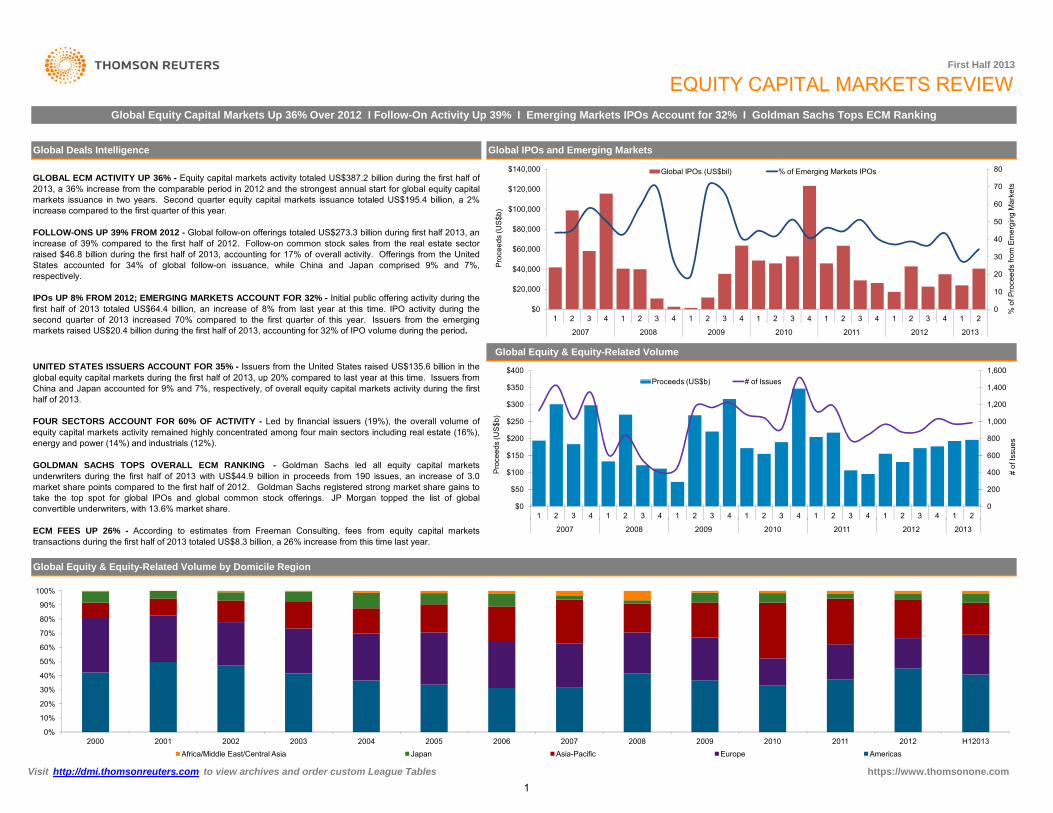
Global ScorecardLeading Underwriters for the Second Quarter 2013 Jan 1 - Jun 28
▼
10,669.5
36.2%113,081.1
4.9%617
26
1
337,640.9115,925.4
65,480.1
4Global Equity & Equity-related (C1)
25,903.6
135,596.5
10.6-3.15.7
9
2
27,756.4
-2.010.0 1.8JP Morgan
Goldman Sachs & Co
JP Morgan
Market Sector
10.8Global IPOs (C5)
Latin America (C4e)
Japan (C7d)
1
▲
34.9
Global Global Equity & Equity-Related (C1)
Asia Pacific ex Australia (C1b)United States (C1a)
Global Disclosed Fees (A2)Australia (C1c)
Global Common Stock (C2)
Global Debt, Equity & Equity-Related (A1)▲▼
Goldman Sachs & Co
1.6
8 494 954,857.6
▼▲▲
1160
186
Latin America (C7e)
▼23 0%
▲▲
1,260
▲
594
482
7,631.3
270
26
46,289.4
197,043.3
Asia Pacific ex Australia (C7a)Australia (C7b)
Australia (C8b)
Global Secondary Offerings (C8)United States (C8a)
317 18.5%
5,910.1 58
202.7%3,064.438.7% ▲
▲▲
8 ▲
26.9%280
389
21 359.7%
▼
▲224 ▼
7.7%
127.9%
-46.4%69 -25.8%
393.0%7
Latin America (C1f)
52,846.45,965.58,895.935
▲
1977,251.2 -16.1%
103,226.0 12.3%349
277▼
443
119.8%
8,639.3
45315
256,785.3
-1.0%54166,125.8
334.2%78.4%
Japan (C1e)EMEA - Europe, Middle East & Africa (C1d)
97389109,806.2
1,791
4118.9
US
Global Convertibles (C9)
16.0US Common Stock (C3) Goldman Sachs & Co
19.1
US Equity & Equity-Related (C1a) Goldman Sachs & Co
-0.2US IPOs (C6) JP MorganUS Convertibles (C9a)
EMEA Convertibles (C9d) ▲
5.4
▲
▲
9.7
14.39.9
3.2
▼12.8
15.1112
11
309
19,836.328,527.6
144.4
3571,482
59,742.1
74,698.4
86
1,660.0
▲
▲19.9%
20672,876.7
50271,383.0
284,326.6387,240.3
11,188.1
1,937
285
1,805
33957
▲▲
% Changein Proceeds
▲
290.7%
2.1%
1/1/2013 - 6/28/2013
Deals
1/1/2012 - 6/30/2012
US$mNo. No.
US$mProceeds
DealsProceeds
▲
79.9%
▲604
▲119.8%26
▲
31.5%19,549.9
379
7,104.08,895.9
▲35
1,649
61,049.1
Global Common Stock (C2)United States (C3)Asia Pacific ex Australia (C4a)0.4
2▲
Australia (C4b)0.394,284.9 358
89Japan (C4d)
164,367.619,549.9
21,163.7Global IPOs (C5)
EMEA - Europe, Middle East & Africa (C4c)
10,622.5United States (C6)
1273,273.2
94,761.6
711.91 EMEA - Europe, Middle East & Africa (C7c)
1
13,469.9
Asia-Pacific ex. Japan ex. Australia 9,276.7
JP Morgan
Asia-Pacific Common Stock (C4a)18.6
UBS 10.114.7
Europe, Middle East & Africa (EMEA)
Morgan Stanley
Bank of America Merrill LynchBank of America Merrill Lynch
EMEA IPOs (C7c)
EMEA Equity & Equity-Related (C1d)
6 539 3Asia Pacific ex Australia (C8c)
3.4
▲
▼
15.4
18.9JP Morgan
Current Qtr Market Share (%)
Morgan Stanley10.2
No. 1 Manager
Goldman Sachs & Co
11
▲
▲
Consecutive Quarters No. 1
9-0.27.8
Mkt. Share Chg. from Last Qtr (%)
EMEA Common Stock (C4c)
Asia-Pacific Convertibles (C9b) Bank of America Merrill Lynch
Japan
31.3
▲▲
Global Equity Capital MarketsFirst Half 2013 | Equity Capital Markets | Managing Underwriters
▲
Latin America (C8e)
16.8%1.9% ▲▲36.2%
100.0100.0 1,937
1.8% ▲
+132
26.4%
100.0 Industry Total
▲
387,240.3
2013 Rank
2012 Rank Proceeds
7.8
Change in Market
1,069 # of DealsBookrunner
+0.3+0.2
1.4
+0.2
1,709.9Share (%) Share Ch.
Proceeds per Bookrunner (US$m)
33.8
8,261.7
-0.324.9
0.80.4
68.9
▼▲
▼
+6
▲
0.4
▲ 116.2
▲ 32.7▲
0.70.5▲ 10
2,547.7
75.0-1+0.2
138 ▲
▲
1.019
+100.4
▲+130.7
+0.60.7▲▲+0.4
+0.6
0.0
1,315.4
▼1.0 3.0▼
58
24-0.2 1.7
3▲
-1 ▼
-0.0
▼ 938.1
896 -
Market
222,765.4 6.7JP Morgan 1 1 261,685.6Deutsche Bank 2
3 ▼204,546.0 0.0205,732.32 -0.76.2
6.1
Bank of America Merrill LynchGoldman Sachs & Co 5
795
▲Citi 4 4
6
Barclays
5 186,288.3+0.4
7 198,590.8 5.9+0.5
5.3▲5.6
+1.4
8.6▲ 861 +73 ▲
Morgan Stanley 7 +1316 177,684.3HSBC Holdings PLC 9 4.0 -0.2 ▼134,714.88 493.2Credit Suisse 8 6.5 ▲-0.6
3.13.7122,615.7
BNP Paribas SA 10 10 102,308.99 +86
-0.6 4.4▼ -33654
RBS 11 -2512 83,848.0 2.5 393 -0.6 3.9▼RBC Capital Markets 12 14 79,684.7 +0.2 ▲2.4
+14
4.5 +33
+47-1534.7
4.6
16 58,019.715 66,086.4 -0.1
1.7 +0.12.0
-1.3
27,541.3
4,305.5
451 652.7
0.0
+0.2
▼
7.2
▲
2.5
6.8
6.5
▲
Manager MarketShare (%)Fees
0.0▼ 321
+34+0.1 182 1.8
2.1209 3.2
9.0
- 321
462 -
▲
469
637 6.4
▼
1.5 ▲+38217 2.2
438
-0.1 ▼
▼
▲
Market
1,226.7
2013 Rank
0.8
8
22
5
13
14
12
3,203.9
-▲
6.1
5.4
18,272.3 63
Asia Pacific ex Australia (C9b)
15,521.3
49,599.5
0.9
+15
+152.6+3
298
▲
33
80,815.08,494.9
▼1.0
24
▲▲
8.2
7
46,936.2186 ▼-23.0%
8.5
9,855.1United States (C9a)
5,831.5
MarketShare (%)Share Ch.
+44
+0.2
270
8
Australia (C8b)
Global Convertible Offerings (C9) 146
4.3
4.6
+0.3
+0.7
4.1
▲ 4.5375.5
▲
203.2
9.8
+45
356.2
252.8
Change in
10.1▲▲
+7224,098.2
+0.5
-0.1
487.6▲
+0.8 ▲
5.5+1.2+1.4
1.7
335.6453.9 ▲
▲▲
1.1
0.369.7
▲▲
+0.4
▼-0.3
▲
+1.7
1.12.5
▼
▲+0.2
▼44.4 -0.1
▲
139.191.893.9 +0.8
0.0-0.3
0.5
▲
▲▲
▲
▲ -
4.5
+56
+9
+56▲
3.1
▲
6.7
8.1▲
Jan 1 - Jun 28
6.8
1,138.589.2%
Share Ch.
324.4%18
Imputed Fees (US$m)
▲
▲
72.2%25724
76.2%▲▲
1,080.310.7
51.143.3
7.3
# of
▲
+71+152
42.7
▲
-
24.1
+42992
+13+83
Jan 1 - Jun 28
Deals
8.0
0.0 -
1011
▲
13-0.3
Societe Generale
Daiwa Securities Group Inc
+0.3
▼
▲+167
207.5
0.6
▼-0.1
▼
1,437.7
▲ 2.2
0.8
▲
-0.30.7
354.91.7
0.9
631.6 3.1
175.2430.8
332.5
3.3
1716
445.6
-
▲ RBC Capital Markets2.1 +0.5
▼
0.0
3,949.015
48
▼
0.0
▲
▲
+34 ▲
▼
1.0 -0.1
▲-6.3%
37,696.8
▼
9,998
▲1.1
72.6
▲ 0.8% 16.6%▲2.7%
+82 20,110.5100.0
Mizuho Financial GroupTD Securities Inc
Industry Total
Industry % Change from Last Quarter*tie
Top Twenty Total34,343.3 2.3
▲3.20.0 +37228 ▲
▼8.7
6.99 9
73
▲ 13317,219.020,410.3
▼
50
1.0
+0.1
-1.4
▲
Mizuho Financial GroupJefferies LLC
HSBC Holdings PLC
22,415.0
5.02.1 +0.7
96
3,752.051
1.8
4,106.7
▲18
-0.4
▲
8,136.8
289,119.7
5.3
4,441.2
0.72,654.4
2,502.0
7,011.4
9.6-0.2
Wells Fargo & Co
+0.8
▼ +55
185
▼
Nomura
Deutsche Bank
Barclays10
▲
14 -0.2
▲▲
1.1+1.0
7 6
1.211
▼
7.3%
▼
+0.1
0.719
15▲
1142,828.7
Itau Unibanco
Industry % Change from Last Quarter
-
20Top Twenty Total
29Haitong Securities Co Ltd107
Industry % Change from Same Period Last Year
Credit Agricole CIB 18
70.5
+18
▲
714.8
Share (%)
30 99.6%
▲
12
▲80.1%
Fees
5.9
40.7%
+0.7+2.38.6
665.8
Share Ch.
+7410.4
▼
156
▲
# of
202
2,030.2
207
196
158
5,756.1
+86
+71
Manager# of Deals
# of Deals per Bookrunner
Share (%)
168
1.2
2.6
219
552.5+0.6
▲93.9%
+1.4
63
▲
Nomura 28.4
Wells Fargo & Co 14 13 74,682.5 2.2UBS 13 76,758.9 2.311
928.8
# of Deals per Bookrunner
+0.3
Imputed Fees (US$m)
9.9
Share (%)
+0.8731
▲▲
UniCredit
9.4 ▲5.8
Societe Generale 16
6.2▲
-0.3
Nomura
11.3
7.43
1-0.6
5 -0.7
4.7
-0.1
▼1.8
1,360.9
14,152.2148.5
-5.8%
112.2169.7
62.7%8
Market
+77Deals
▲
Market
▲
Citi
8.7
10.7
59
31
23
24
5,257.3
8,202.89 8
712.5
MarketBookrunner
+3.01 44,853.5 190Goldman Sachs & Co
2012 Rank
311.6
7.68.0
4 29,370.7
3,937.0Australia (C9c)
-0.2 ▼2
6,539.3
MarketProceeds
EMEA - Europe, Middle East & Africa (C9d)
Japan (C8d)1
Global Equity & Equity-Related (C1)
19,671.17,396.6
1,852.8
▲28.6
31
2
EMEA - Europe, Middle East & Africa (C8f)
10,273.2
4
2 30,806.8
28,522.5
Proceeds per Bookrunner (US$m)
Japan (C9e)
JP MorganMorgan Stanley
1.5
NomuraNomura 35.4
935
18 51,330.8
Japan Convertibles (C9e)
Japan
NomuraJapan Common Stock (C4d)Japan Equity & Equity-Related (C1e)
15
Market
▲
Japan IPOs (C7d)
Global Debt, Equity & Equity-Related (A1)
-14.0%
2,430,109.8
1750,726.6
2019 20
Industry % Change from Same Period Last Year
Credit Agricole CIB 18 17
21
3,340,584.4
26,289.9
+0.2 +51
6
Credit Suisse
+0.6 UBSBank of America Merrill Lynch
▲+1.5
-0.2
▼
▲
https://www.thomsonone.comVisit http://dmi.thomsonreuters.com to view archives and order custom League Tables
2
-10 879.2 100.0
▲ 4.1 0.5 -0.2 ▼
Industry Total 49,599.5 100.0
20 296.2 0.6 1.4 +1
146
RBS Morgans Ltd 20*
Change in
1FeesDeals
Market# of Deals per Bookrunner
MarketShare Ch.Share
▲
▲+5.54,122.3
Market
13.6
▲
Haitong Securities Co Ltd
1Deutsche Bank
3.26.3
+21
▲
+43
▲
3.8
▲
▲
▲
▲
41
+0.5
Proceeds per Bookrunner (US$m)
8.3
10.89.3
ManagerShare Share Ch.
Market
+5.34,608.4
+0.9
# of Deals per BookrunnerProceeds per Bookrunner (US$m) Imputed Fees (US$m)
31
47.821
Market
▲
▲
Morgan StanleyUBS
Barclays
4.9
▲
2.6
▲
▼
Credit Agricole CIB+0.1
52.66
1,608.8
63.6+10 ▲
15
BNP Paribas SA
# of# of Deals
Jan 1 - Jun 28
Change in FeesProceeds Deals Share
Market
+1.6
▲
+0.4
▲
▼
▲+0.8
+1.9
+1.1
Global Common Stock (C2)
4
Goldman Sachs & Co 5,336.32
Proceeds
8.8▲
Bookrunner2012 Rank
2013 Rank
Market # of
JP Morgan +2.9
Global Convertibles (C9)
6,765.22
3
Citi
Bank of America Merrill Lynch3
10Credit Suisse
75
9
4
67
2,641.2
-0.4 ▼▼
5
▲
▲
▲
Share
5.46.5
▲
▲7.2+4.2
-
▲
▼
21.2-1.1
19.9
-0.5 100.1▼
-1.329
# of Deals+25
Market
0.0
28.1 ▲
▲ 57.0▲
+4.0
+1.3
-1.5
6.09.1
▲
-0.4
+1.2
▲79.7
14.1
▲7.2
+21+926
Imputed Fees (US$m)
+14
11.4
-
Jan 1 - Jun 28
▼
Share
14
19
14
18
-
42
Market
11
17
10
9.9
▲▼ 1.3
14
▲
175
14
▼
141▲
177
▲-
+2
0
+43
▲
▲
▼▲
2.5
▲
▲+357.9
7.9
8.9 +56
+46
▲
+64
0.917
54▲▼
0.8
278.6
188.5235.9
▲+3
▲
▲
Macquarie Group
Societe Generale 16
Guotai Junan Securities 19
1517
14
12HSBC Holdings PLC 13
12Daiwa Securities Group Inc
14RBC Capital Markets
11112
Nomura 10+0.611Wells Fargo & Co
Barclays 99
▲Wells Fargo & Co
1.120
▲▲
▼
1.9+0.9
1.113
1.8▲▲ 84.7
1.7-0.13.0
▲
+8
48
1.21.2
▲
88
30
0.8
2114.4 +13
17 11.6 +914.4
-0.24.2
303.6 +0.4
+6
133.785.2
312.3
+10
+122.7
+15
111.6
Share Ch.Manager
3 1 25,881.32
24,041.7
UBS 6
Market
4
Goldman Sachs & Co
JP MorganCiti
7.1 -0.87.7
6.54
Credit Suisse
Bank of America Merrill Lynch
3
2012 Rank
2
77
Morgan Stanley
5
39,517.225,909.4
Share Share Ch.
7.7
Bookrunner1 +3.4
2013 Rank
159
▼-1.3
▲11.7▼
5
61428
18,250.4
▼21,931.6+0.3-0.8 178
+47 ▲▲
590.8
602.2
▲
439.8
416.0
9.99.9 472.8 6.4
169 9.44.15.6
178
8.3+1.4+0.7+0.28.0
6.0
+2.0612.48.2
44
-0.4
▲+58
+47+75
-0.6 9.8
7,541.4-0.1
17,806.6▼
5.9
5.35.4
19,975.9
▼▼
-0.2
3,017.1 0.9Jefferies LLC 15
-0.2
+1.11.2
Deutsche Bank 8
0.920
7313
14,127.8 4.22.2
4,109.53,783.2
6,331.1
0.8
1.13,715.93,031.8
+0.70.8
+0.2-0.2
-0.1
+0.5Itau Unibanco 18 99 2,547.7Mizuho Financial Group 48 2,671.8
0.613
20 2242
0.72,169.5 +0.3
232,049.6
+0.316
+11▲ 32.7
-0.133.21.5
0.90.5
+0.367.1
+0.145.120.9
0.4 +0.3
-0.20.30.6+1
5,067.1▲
68.8
▲
73.6+142100.0
-0.10.6Top Twenty TotalIndustry Total
248,410.5▼
337,640.9
▼
Daiwa Securities Group Inc
▲-1.4
20*▲
Nomura
Commonwealth Bank of Australia
Top Twenty Total
Societe Generale
Mediobanca
124.1▲▲ 63.217.8
3,461.4
+2.4
7.0
17.1
2.4- 1,202.3
8
+0.73,091.1 6.2
2,159.9
11
25
3.2 +3.2 1▼ 16-0.3▼8
4.338.011.00.7 +1-
5.3+11 ▲
▲
0.4▲▲
1.2▲
-0.3▼▼▲ 3.9
7.5▲ 2.2 +1.711 19.4+1112 ▲
▲
32.7▲
4
27-
595.4▲ 1.7+2
+0.810.4+1.6
5.58
2.1+0.81.3
+34 +3
14.8
▲ +1.211.2▲
4.1 -3 1.9
7.1
▼▲
+32.12.7 +4
-1.4 ▼6.5
-0.0
+0.81.1
▲4.9 0.617.0
▲▲
+0.6
9.2
-0.8
▲
▼
+0.8▲
▼-1.1
+0.54.1 0.50
0.832.7
4,358.3
0.6
587.1
+0.63
4.4
1.4
+1.0
1.6
1.2
798.9
1.0331.7 0.7500.0
1.41.5
680.4
+3
+2
734.9
296.2
1.26
+1.2
+0.1 ▲
▼ 2
▲+0.5-1.0
2▲
4▼HSBC Holdings PLC
▲2.10.7
89.244,203.3
323.5
-0.3738.7
▲- 0.7
84.11,791 7,382.5
Evans and Partners -12
Global Equity Capital MarketsFirst Half 2013 | Equity Capital Markets | Managing Underwriters
100.0
▲Industry % Change from Last Quarter ▼
0.2 +0.2 ▲▲ 1 0.3 +1 ▲ 4.1Plural Capital 20* - 636.9 1.0 +1.0
80.1%-24.1% ▼ -14.0%
69.1%▼-6.4%-29.9% ▼
6.0
▲
Share Ch.9.1 ▲
Share (%)
+2.49.1
▲
▲
*tie
+2.0▲▼
Credit Suisse
JP Morgan
5Deutsche BankCiti +9
Morgan Stanley▲
2 1 5,584.5Goldman Sachs & Co 1
▲3
▲
+3.3
-1.1
Market
▲
+0.438
Change in
42
6
34
Global Equity & Equity-Related Fees
Share (%)Market # ofMarket Market
Share Ch.2013 Rank
8.6%Industry % Change from Same Period Last Year
Bookrunner2012 Rank
▲
40▲
Deals
Imputed Fees (US$m)
# of DealsMarketManager
+1147
Fees
+8
+2415.2 206.713.6
+1.5
▲123.2146.8
146.7
5.4
6.5
3.6
+2.9
98.5 4.3 ▲+2.3
+3.7
# of Deals per Bookrunner
42
135.6
6.5
+1.0
▲
206.6239.8
▲
10.6
4.6
▲
80.7
▲+12 ▲
▲+8
+26
▲
+1.9
12.312.913.6
105.4
21.2%22.7%
5 6,194.2
4.2%
8.7+3.6
31.5% ▲
Proceeds
Jan 1 - Jun 28
Share (%)
4,792.64 4,635.3
7.5+0.77.2
+0.4
6 4,012.2
7.6%▲
▲
▲6.2
Proceeds per Bookrunner (US$m)
Industry % Change from Last Quarter
Global IPOs (C5)
2 6.9 ▼
9.6
4,430.2
-0.4
+0.5
33 10.7▼
16.26.1
505.8 +4.6 ▲ 19
Bank of America Merrill Lynch 8 7 2,924.07 17 3,753.8
+74.5 -1.2Nomura
▲▲4.1 9.7 +17
3.6 ▲ 29 9.4 +12▼ 30
UBS 10 11 2,307.3-0.1Barclays 9 8 2,638.9+0.6
1,277.2 2.02.0 +1.1HSBC Holdings PLC 11 1.2 +0.720 1,293.5 ▲ 10 ▲ 26.33.2 +6
+0.2 ▲1 0.3 +1 ▲ 4.2 0.2
Banco BTG Pactual SA 14 37 837.6Itau Unibanco
+2.0
1.3
Rabee Securities Co 12 - ▲13.113 1.6 +4130* 909.5 1.4 +1.3 ▲
▲ 40.6 +0.5
0.05 ▲
0.71.3 +2 ▲ 14.99 +0.12.9 +3 1.3
+0.9▲
Jefferies LLC 16 23 779.1 1.2▲ 28.6Wells Fargo & Co 15
+0.5 ▲24 792.0 1.2 +0.5 ▲
+13.2 +0.110 ▲ 23.4 1.0
+0.13+0.7 ▲ 0.5 +0.1
+1 9.4▲ 11.4
+1.0 1.4+41.6 31.3
1.2▲
5▲
+2+0.7
Banco Bradesco SA 17* 33 778.4 1.0Banco do Brasil SA 17*
31.030 778.4 1.2
Sumitomo Mitsui Finl Grp Inc 19 73 752.4 1.2Banco Votorantim 20* 130* 636.9 ▲1.0
77.8
+0.21 0.3 0 - 0.24.1+0.9
-80
▲
64,367.6
Industry % Change from Last Quarter 70.4% ▲
100.0
25.5%
309 2,272.1
0.4▲▲
▼ 8.6% ▲
100.01,656.7
▲
▲▲
-
▲
▲▲▲
▲
+1.1
▲ ▲▲
Industry % Change from Same Period Last Year▲
▲59.8%Industry % Change from Same Period Last Year 7.7% ▲ -20.6%
Industry Total73.250,108.0Top Twenty Total 0
200
400
600
800
1,000
1,200
1,400
1,600
$0
$1
$2
$3
$4
$5
$6
$7
$8
$9
$10
1 2 3 4 1 2 3 4 1 2 3 4 1 2 3 4 1 2 3 4 1 2 3 4 1 2
2007 2008 2009 2010 2011 2012 2013
# of
Issu
es
US
$Bil
Fees (US$bn) # of Issues
https://www.thomsonone.comVisit http://dmi.thomsonreuters.com to view archives and order custom League Tables3

Global Equity Capital Markets: Ten Years of RankingsFirst Half 2013 | Equity Capital Markets | Managing Underwriters
1
2
3
4
Goldman Sachs & Co
JP Morgan
Morgan Stanley
Citi
Rankings shown are as of the current quarter-end in each calendar year.
5
6
7
8
9
10
2004 2005 2006 2007 2008 2009 2010 2011 2012 2013
Ran
k
Bank of America Merrill Lynch
UBS
Deutsche Bank
Credit Suisse
Barclays
Nomura
Note: League Table positions reflect consolidation within the banking sector.
https://www.thomsonone.comVisit http://dmi.thomsonreuters.com to view archives and order custom League Tables4

nc
Real Estate, Energy & Power, and Healthcare led the market in the first half of2013, with 49.8% of total volume. $26.9 billion out of the $29.4 billion of RealEstate proceeds were from REITs issuance, which saw its highest first halfvolume on record.
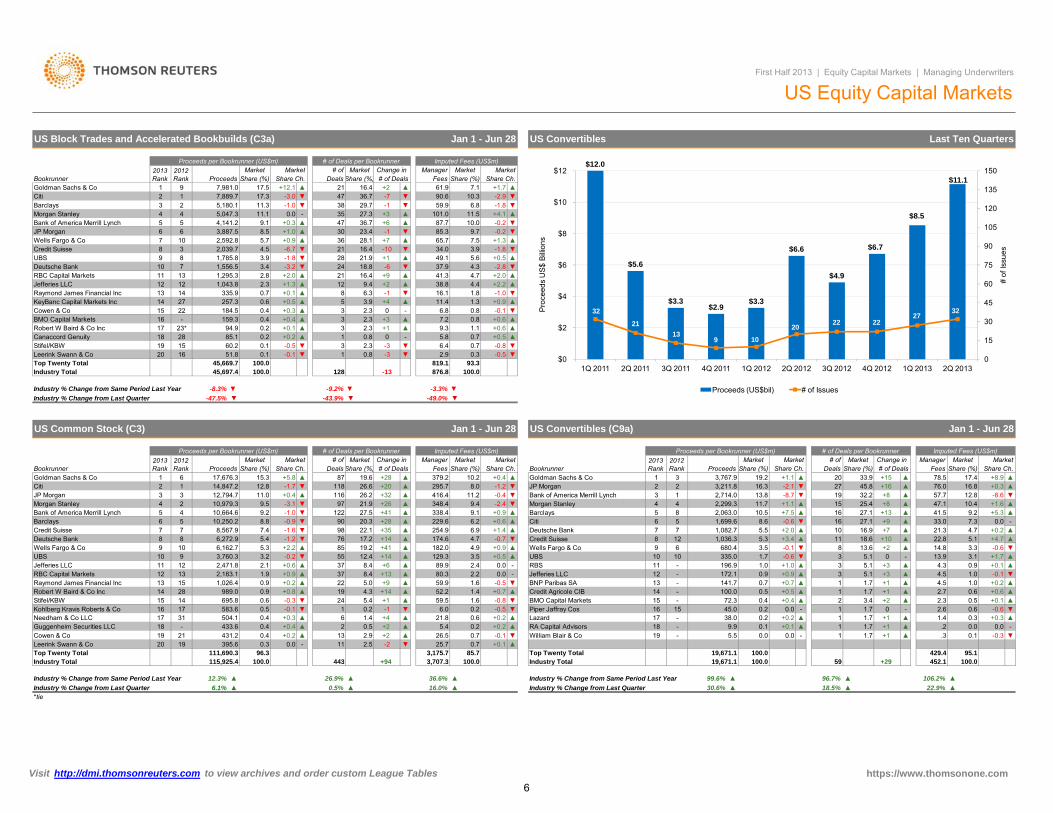
US Equity & Equity-Related proceeds totaled US$135.6 billion from 502 deals in thefirst half of 2013, a 19.9% increase in volume and 32.5% increase in deal countcompared to the first half of 2012. Total estimated fees were $4.2 billion, a 41.8%increase year over year, according to Thomson Reuters/Freeman Consulting.
US Deals Intelligence
US Equity & Equity Related Fees Up 42% l Highest First Half REITs Volume on Record l Convertibles Making a Comeback
1 3 ▲+0 60 7 19
1.6 +0.6 ▲ 37-0.7
+12 ▲7.422
▲▼0.8 -0.1▼
4.414 29 989 0 3 8 +14+0 6 52 2
+7▲Robert W Baird & Co Inc
▼ ▲ 60.0
3.494.480.9 2.0
2.3
Raymond James Financial Inc 13 14 1,026.4 1.4
2,643.9RBC Capital Markets 12 13 2,183.1
143.211 ▲ 40 8.0 +9
▼ 58 11.6 +1412
18.5
2.0 +0.6UBS 10 9 4,095.3 3.0 -0.3Jefferies LLC
▲-
6,843.0 +43 ▲5.1 +1.9 ▲ 93 4.7
-0.2
195.9▼ 86 +2117.1196.79 10
7,355.6 5.4 -0.9▼ 277.7▲
Deutsche Bank7.1
▲
-1.28 8 ▲
Wells Fargo & Co
Credit Suisse 7 7 9,604.1- 106
109Barclays 6 6 12,313.2 9.1 0.0
2 13,278.6 ▼ 1129.8 -2.66.5+41
22.321.121.7 +45
▲ 395.5 9.5
+0.5 ▲
▼
4.76.7
Bank of America Merrill Lynch 4 4 13,378.5 9.5 +0.328.1 +49 ▲ 396.1▲
▲ 271.1
-0.7
+34
0.0
▼▲
-2.1
▲ 328.628.5 +48
9.9 -1.4 ▼ 141492.4▲+0.5
21.315.812.2 -1.9
+5.626.7▼
143
▲5Share (%)
107 +43134 +292
MarketFees Share (%) Share Ch.
Manager Market
▲1 16,546.8
457.7 11.0▼-1.2
+1.3
▲
▲
11.87.9
+1.6
-0.2
▼
+1.0 ▲
+0.7
▲
# of Market Change in Deals
MarketShare Ch.
Market# of Deals
2013 Rank
2012 RankBookrunner Proceeds
3 3
21,444.2
JP MorganCiti
Morgan Stanley 5
1Goldman Sachs & Co
16,006.4 11.8
Share (%)
Jan 1 - Jun 28
Proceeds per Bookrunner (US$m) # of Deals per Bookrunner Imputed Fees (US$m)
US Eq & Eq Related Sector and Issue Type Breakdown (US$Bil)US Equity & Equity-Related (C1a) Jan 1 - Jun 28 2013
US Equity Capital MarketsFirst Half 2013 | Equity Capital Markets | Managing Underwriters
2013 saw the highest first half block trade volume on record, a total of US$26.3billion and a 38.4% increase from the same period in 2012, making up 27.8% ofall follow-on volume this half. The convertibles market continued its rebound; thisquarter saw the highest quarterly volume of the past 9 quarters.
$21.2 16%
$19.7 14%
$29.4 22%
$22.5 17% $15.6
11%
$12.1 9%
$12.0 9%
$11.3 8%
Real Estate
Energy and Power
Healthcare
Consumer Products and Services
Financials
*tie
+1.0
Market
Kohlberg Kravis Roberts & Co 16
Robert W Baird & Co Inc
Morgan Stanley
583.6
Bookrunner
Citi
6 8
21.9
27
17 32 504.1
US IPOs (C6)
Needham & Co LLC
Industry Total
11 2.2
170.40.4
Change in
+416 1.2
-1 ▼
20
2.3
Fees
26.7
▲
-1.0
6.0
Share (%)
48-
+1+2 5.40.4
-0.5
0.129.6
▲
+0.1
▲
0.7+0.3▲
▲-0.1 ▼ 0.2+0.3
▲
2.6
Deutsche Bank 7 1,871.9
Market
0.3
▼8.9
3
18
Goldman Sachs & Co
William Blair & Co
Stifel/KBW
9
1,884.2 23
13
Leerink Swann & Co
-0.8
Market
+0.4 ▲+0.1 ▲
▼▼
-0.7
Imputed Fees (US$m)
63.5 1.51.3
26.9 ▼
▲
-0.1
▲+0.6
0.1Stifel/KBW 15 15 695.8 ▲0.5 -0.3 24 4.8 +1▼
0.7 19▲14 29 989.0 3.8 +14+0.6 52.2▲Robert W Baird & Co Inc
Raymond James Financial Inc
Jefferies LLC
8.9
Top Twenty Total
0.5+10 ▲
Guggenheim Securities LLC455.1BMO Capital Markets 0.3
31.4 +9 ▲ 136.8 11.6
▲
1,030.6 87.421,163.7Industry Total
Barclays
9.3 +1.98.1
▲▲ ▼
▲
11.0
+0.7▼
Share Ch.
▼-3
4.8▼
Industry % Change from Last Quarter
2,429.2
9.3%
+0.2
▲
10.6
100.0
▲-0.5 ▼
# of Deals per Bookrunner
▲
Deals+0.6
Market# of DealsShare Ch.
50286.33,595.7
2
# of
▲+0.1
2.4%32.5%
-1.229.125
19
Proceeds per Bookrunner (US$m)
96.5
0.3433.6
3 6
▲
Market
Jan 1 - Jun 28
Manager
2 2
Industry % Change from Same Period Last Year
1Proceeds
2,238.3
2013 Rank
2012 Rank
▲
JP Morgan
Share (%)
26.729
2,068.7 23-0.9
11.5Share (%)
33.7Credit Suisse 5
Bank of America Merrill Lynch
54
9.69.8
10.3
2,030.44
2,175.6 ▲
+9
26 30.2
▼
▲▼
+0.3 110.1130.5
▲
+7
+12 ▲
+1
-1 95.2▲95.2
7.184.38.1
+3.1 ▲+0.9
8 1 1,734.3 8.2 -3.4 ▼7
1823.3 0 -0.6- 56.7
9.9 -8.020.9
-0.115.1 +6 ▲ 40.9 3.510.5
UBS 9 10 821.3 3.9 +2.4 ▲ +1.4▼
▲Wells Fargo & Co 10 12 792.0 3.7 +2.3 ▲ 28.6+3
20,378.0 96.686
+0.60.9
3
50.918
115.7
100.0
20 99.2 0.5 2
14
2321*
-
113.3
+17 1,181.1 100.0
44.2% ▲ 45.7% 47.5% ▲▲Industry % Change from Same Period Last Year -25.8% ▼ 24.6%
Industry % Change from Last Quarter
13 17
2.91.8
270.8
▲
-0.6 -
Zelman Partners LLCSandler O'Neill Partners
FBR Capital Markets CorpGuggenheim Securities LLC
19
▼
1
+1.5 7388.2
181.1
▲
▲604.6
1.3
181.3257.4 +1.2
+0.9
+0.40.6
113▲
▲
▲▲
+0.8
1.2
15
▲+0.6 1.2
12.8
5.85.8+0.6
8.1
+3
+1+3-2 ▼
1.23.5
▲
+1▲▼
15.7 ▼
0.3 +1.3
-0.5+0.31.213.7
▼▲
▲
▲
-0.8+0.1+0.7
▲
1.30.90.6 +1.1
▲+0.5+0.3
0+1+2
▲▲
0.5 +0.3▼
3.50.6
-0.8
0.8
1.3
1.6
26.1
9.1
▲
12
▲
1114
15 19-
16
13
Cowen & Co 20 22 431.2
19.9%
130,811.5Top Twenty Total135,596.5
120.51718
11
+123
+0.313
100.0
0.7
▲ 41.8% ▲
4,159.4
2.2
16.2
6.9
25.2%
3
+2
▲
3.5
18.63.9
10.4▲▲
▲▲
▲
16.7%
▲+1
▲
1.4
▲
15.3
116.4
2.4
US REITs Jan 1 - Jun 28
$94.8 70%
IPO Follow-On Converts
$10.8 8%
$21.9 16%
Industrials
High Technology
Others
$8.7 $7.2
$8.4
$17.0
$8.1
$16.2
$12.1
$23.9
$18.0
$26.9
61
36 38 48
32
53
55
77 59
84
-
10
20
30
40
50
60
70
80
90
$0
$5
$10
$15
$20
$25
$30
# of
Issu
es
Proceeds (US$bil) # of Issues
Pro
ceed
sU
S$
Billi
ons
https://www.thomsonone.comVisit http://dmi.thomsonreuters.com to view archives and order custom League Tables
5
Industry Total 45,697.4 100.0 128819.1
3.9 +4 1.3
93.3
▼
+2.2 ▲
▲ 11.46.8
-6 ▼ 4.3
▼
-13
4.44.7 ▲
+0.9
100.0876.8
9.4 ▲
+0.4
0.7+0.5+0.3
3
▲
0.1 -0.145,669.7 100.0
▲
-0.5
+0.1
0.1 ▼60.2
+0.112
8▲5
▲
+0.2
+2.0 ▲ 41.3+1.3 ▲ 38.8
21 16.4 +9 ▲
▲Deutsche Bank 10 7 1,556.5 37.93.4 -3.2 ▼UBSCredit Suisse
-2.849.1 5.6
24
3.9 -1.828 21.9 +19 8 1,785.8 3.9 -1.8
8 3 2,039.7+0.5
65.7 7.5 +1.3
▼▼
▲
28.1-10
▲4.5 -6.7
+7 ▲▼21 34.0 ▼16.4
10 2,592.8 5.7 +0.9 ▲ 36
-0.223.4 -1 ▼ 85.3 ▼-0.28.5 +1.0 ▲ 30 9.7
87.7 10.0+0.3 ▲ 47▲
36.7 +6 ▲▲+3
▼101.0 11.5 +4.1
9.1
▼4 4 5,047.3 11.1 0.0
11.3 -1.0
5
-3.0
- 356.8 -1.829.7 -1 ▼ 59.9
27.3
Market
-7 ▼
Change in
7.1
Manager
61.990.6
Imputed Fees (US$m)
Share (%)
10.336.7 -2.9 ▼
Market
+1.7Proceeds # of Deals
7,981.0 +12.117.5 ▲ 21 16.4 +2 ▲
0.4
1,043.8
7,889.7
Deals FeesShare Ch.
▼ 3847▼
0.2
17.3
Market
1,295.3
# of
3,887.5
2.82.3
0.6184.5
21
BookrunnerGoldman Sachs & Co
2013 Rank
Proceeds per Bookrunner (US$m)
1
Market2012 Rank
Bank of America Merrill Lynch
9Citi
5
159.3
JP Morgan
12RBC Capital Markets 13
Top Twenty Total
Morgan StanleyBarclays
Cowen & Co 15 2216
Share (%)
15
-
3
12
5,180.1
4,141.26
20
6
11
18
2
27 257.3
16 51.8
85.119
7
14
Jan 1 - Jun 28US Block Trades and Accelerated Bookbuilds (C3a)
Share (%)
Wells Fargo & Co
US Convertibles Last Ten Quarters
▲
▼
Jefferies LLC
Leerink Swann & Co
KeyBanc Capital Markets Inc
+2-1.0
+2.0
Share Ch.
Raymond James Financial Inc 13 14 335.9
▼3 2.3 0 -▲
-0.1
9.3 +0.60.830.8
▲ +0.6▲
7.2 ▲Robert W Baird & Co Inc 17 23* 94.9 0.2BMO Capital Markets ▲0.4
▲1 0.7-▲
0.8 -3 2.9
0.8 0 5.8
1 ▼ -0.5 ▼
▲▼
Market
28Canaccord Genuity
+3
6.3 -1
18.8
2.3 +12.3
+0.5
0.33 2.3 -3Stifel/KBW -0.8
▼ 16.1 1.8
# of Deals per Bookrunner
0.7
1.1
6.4 ▼
First Half 2013 | Equity Capital Markets | Managing Underwriters
US Equity Capital Markets
$12.0
$5.6
$3.3 $2.9
$3.3
$6.6
$4.9
$6.7
$8.5
$11.1
32
2113
9 10
20 22 2227
32
0
15
30
45
60
75
90
105
120
135
150
$0
$2
$4
$6
$8
$10
$12
1Q 2011 2Q 2011 3Q 2011 4Q 2011 1Q 2012 2Q 2012 3Q 2012 4Q 2012 1Q 2013 2Q 2013
# of
Issu
es
Pro
ceed
sU
S$
Billi
ons
-9.2%
US Common Stock (C3) Jan 1 - Jun 28
Change in Proceeds per Bookrunner (US$m) Imputed Fees (US$m)
▼
# of Deals per Bookrunner
▼ -49.0% ▼▼ -3.3%
295.7 8.0
2.2
+20 ▲
-2.411.2
▲
6.9
416.4
▲Share Ch.Share (%)
10.2 +0.4JP Morgan
379.2
0.0
Market
9.4-0.4
9.1
Market
-
-1.2 ▼26.6
# of Deals+28 ▲
*tie
Bookrunner87 19.6
Deals
+13
3 3 12,794.7
2013 Rank
Manager
Industry % Change from Last Quarter -47.5% ▼ -43.9%
# of MarketMarketMarket
Industry % Change from Same Period Last Year -8.3%
2012 Rank Share Ch. Share (%)
▼
FeesProceeds
1JP Morgan
2
10,664.6
Credit Suisse 7 7 8,567.9
Share (%)Goldman Sachs & Co 1 6
4
17,676.3Citi 12.8 -1.7 ▼ 118
15.3 +5.8 ▲
9.5 -3.1
14,847.2▼116 26.2 +32 ▲+0.4 ▲
▼+41 ▲
11.097 21.9 +26 ▲Morgan Stanley 2 10,979.3 348.4
122▼ 27.5 338.4-1.09.2▼
Bank of America Merrill Lynch 5 48.8 -0.9Barclays 6 5 10,250.2 90 20.3 +28 229.6▲
+0.9 ▲▲6.2 +0.6
7.4 -1.6 ▼ +1.4 ▲98 22.1 +35 ▲ 254.9Deutsche Bank 8 8 6,272.9 5.4 -1.2 ▼ 76 4.7 -0.717.2 +14 ▲ 174.6Wells Fargo & Co 9 10 6,162.7 ▲ +0.94.9UBS 10 9 3,760.3 3.2 -0.2 12.4 +14 ▲ 129.3
5.3 +2.2
▲ 0.0
182.0▼ 55 3.5
85 19.2 +41 ▲
Jefferies LLC 11 12 2,471.8 2.1 +0.6 -37 8.4 +6 ▲ 89.9 2.4RBC Capital Markets 12 13 2,183.1 1.9 +0.9 ▲ 80.38.4
ProceedsGoldman Sachs & CoBookrunner
Proceeds per Bookrunner (US$m)
US Convertibles (C9a)
2013 Rank
1
Credit Suisse
Citi
Bank of America Merrill Lynch
Barclays
Deutsche Bank
Morgan Stanley
7
10
Jefferies LLC 12
8
2012 Rank
3 1 2,714.02 3,211.83
1.422 5.0 +9 ▲
2
UBS+0.5 ▲▲
Jan 1 - Jun 28
Change in Manager# of Deals
+0.7 ▲
Share (%)Deals
4 4
16.3
▲8 2,063.0
▲ 26.9%▲
Industry % Change from Same Period Last Year 12.3%
3,175.7
Industry % Change from Last Quarter 6.1% ▲ 0.5% ▲ 16.0%
Top Twenty Total
▲ 36.6% ▲
443 100.0+94
0.796.3
Industry Total 115,925.4 100.0111,690.3 85.7
3,707.3
▲▼
Leerink Swann & Co 20 19 395.6 0.3 0.0 - -226.5 0.7 -0.1
11 2.52.9 +2
+0.1▼ 25.7
▲Cowen & Co 19 21 431.2 0.4 +0.2 ▲ 13 ▲
+0.22 0.5 +2 ▲ +0.25.4 0.2
0.6+4 ▲ 21.8 ▲Guggenheim Securities LLC 18 - 433.6 0.4 +0.4 ▲
▲ 6▼
0.4 +0.3-1 ▼ 6.0 0.2 -0.5
Needham & Co LLC 17 31 504.1 1.4▼ 1 0.2Kohlberg Kravis Roberts & Co 16 17 583.6 0.5 -0.1
-0.859.50.6 -0.3 ▼ 5.4 ▲ 1.6 ▼52.2
695.8 2419 4.3 +14 ▲14 28 989.0 0.9
+1+0.8 ▲
15 14
▼1.6
Share Ch.
Robert W Baird & Co Inc
▼▲+16
Raymond James Financial Inc 13 15 +0.21,026.4
Stifel/KBW
0.9 -0.5▲
13.8 -8.7
59.937
▼
▼5
Market# of Deals per Bookrunner
MarketFees
17.4 ▲▼ 27 16.8 +0.345.8
78.5▲ 76.0-2.1
12.825.4 +8
+8 ▲▼ 19 -8.610.4
57.7+1.6 ▲2,299.3 11.7 +1.1 ▲ 47.1
10.5 +7.5 ▲ +5.3 ▲16 27.1 +13 ▲ 41.5 9.227.1 33.08.6 -0.6
▲▼ 16 7.3 0.0
7 1,082.7 5.5 +2.06 5
12 1,036.3 5.3 +3.410
-+9 ▲
▲ 11▲
5.1▲
1,699.6
+4.721.3 4.7
18.6 +10 ▲ 22.8+0.2+716.9
▲Wells Fargo & Co 9 6 680.4 3.5 ▼ -0.6 ▼
10 335.014.8
1.7 -0.6 ▼13.6 3.3
5.1 0 - 13.9 3.1+2 ▲
+1.7 ▲RBS 11 - 196.9 1.0 +1.0 ▲ +0.1
- 172.1▲3 5.1 +3 ▲
0.9 +0.94.3 0.9
5.1 +3 ▲ 4.5 1.0 -0.1 ▼BNP Paribas SA 13 - 141.7 0.7 +0.2 ▲1 1.7 +1 ▲ 4.5 1.0
2.7Credit Agricole CIB 14 - 100.0 0.5 +0.5 ▲ 1 +1 0.6 +0.6 ▲
2.6- 1BMO Capital Markets 15 - 72.3 0.4Piper Jaffray Cos 16 15 45.0 0.2 0.0
+0.1 ▲2 3.4 +2 ▲ 2.3 0.50.6 -0.6 ▼
Lazard 17 - 38.0 0.2 ▲
William Blair & Co 19
+0.3 ▲1 1.7 +1 ▲
-
1.4 0.3RA Capital Advisors 18 - 9.9 0.1 +0.1
+0.20.0
5.5 0.0▲▲ 1 +1
+1 ▲1-
-0.3.3 ▼.2
# of
0.0-
▲Industry % Change from Last Quarter
99.6% ▲
100.0Industry Total
1.7
30.6% ▲Industry % Change from Same Period Last Year
▲18.5%
+15
106.2%
Market
95.1Top Twenty Total 19,671.1
▲
Market
3,767.9
Imputed Fees (US$m)
+1.119.2 +8.9Share Ch.Share (%)
▲Share (%)
20
15
+0.7 ▲▲ 3
38-0.1
0
Market
1.7
1.7
32.2
1.7
▲
-
429.4
0.1
452.1
▲22.9%96.7%
100.059
▲
19,671.1
▲ 33.9
100.0
+0.4
0.0
+29
Proceeds (US$bil) # of Issues
Visit http://dmi.thomsonreuters.com to view archives and order custom League Tables https://www.thomsonone.com6

Issuer Issue Date Proceeds Issue TypeThermo Fisher 6/6/2013 $2.5 FO JP Morgan
Valeant Pharmaceuticals 6/18/2013 $2.3 FO Goldman Sachs | Goldman Sachs Canada
Realogy Holdings 4/11/2013 $1.8 FO Goldman Sachs | JP Morgan | Barclays | Citigroup | Credit Suisse
GM 6/6/2013 $1.7 FO Citi | JP Morgan | Morgan Stanley
Health Care REIT 5/8/2013 $1.7 FO UBS Investment Bank | Deutsche Bank | Wells Fargo | Barclays | Citi | JP Morgan | RBC Capital Markets
Prologis 4/25/2013 $1.5 FO Morgan Stanley | JP Morgan | Goldman Sachs | Wells Fargo
ING US 5/1/2013 $1.5 IPO Morgan Stanley | Goldman Sachs | Citi | Bank of America Merrill Lynch | Credit Suisse | Deutsche Bank | JP Morgan
Nielsen 5/13/2013 $1.4 FO JP Morgan | Citi | Deutsche Bank | Goldman Sachs | Morgan Stanley | Credit Suisse | Guggenheim | Wells Fargo
Cobalt 5/7/2013 $1.3 FO Citi
Hertz 5/6/2013 $1.2 FO Goldman Sachs | JP Morgan
US Equity & Equity-Related Industry Composition for Top Bookrunners
Top Ten US Equity & Equity-Related Deals (US$bil)
US Equity Capital Markets
Jan 1 - Jun 28 2013
April 1 - Jun 28 2013
First Half 2013 | Equity Capital Markets | Managing Underwriters
$1.2
$1.3
$1.4
$1.5
$1.5
$1.7
$1.7
$1.8
$2.3
$2.5
$0.0 $0.5 $1.0 $1.5 $2.0 $2.5 $3.0
Hertz
Cobalt
Nielsen
ING US
Prologis
Health Care REIT
GM
Realogy Holdings
Valeant …
Thermo Fisher
14.1% 10.6% 11.5%7.5%
11.7% 10.9% 9.2%14.5% 14.7%
8.5%22.5%
15.8%19.2%
18.2%24.7%
15.6%
17.9%25.5%
38.2%
10.0%
9.0%
7.3% 9.2%10.6%
3.6%
11.7%
7.6%
4.5% 5.9%11.2%
8.2%
11.0% 8.3%8.2% 12.3%
9.0%7.9%
11.0%5.8%
9.1%7.5%
10.7% 5.9%11.0%
12.1%
8.2% 8.4%
6.1%7.9% 12.0%
7.6%
6.7% 9.2%4.7%
7.6%5.7%7.0%
5.3%
5.9%
6.3% 4.6%
3.4%
7.8%
3.3%
3.2%
3.2%
4.5%
3.8%
2.3%
6.3%
18.4%
23.2% 18.5% 26.8% 19.2% 19.4%
25.7%
21.2%
33.0%34.6%
7.1%
3.1%3.9%
3.5%4.4% 3.5% 4.9% 3.0% 3.2% 3.2%
0%
10%
20%
30%
40%
50%
60%
70%
80%
90%
100%
Goldman Sachs & Co Citi JP Morgan Bank of America Merrill Lynch
Morgan Stanley Barclays Credit Suisse Deutsche Bank Wells Fargo & Co UBS
% T
otal
Pro
ceed
s
Telecommunications
Consumer Staples
Retail
Real Estate
Media and Entertainment
Materials
Industrials
High Technology
Healthcare
Government and Agencies
Financials
Energy and Power
Consumer Products and Services
Visit http://dmi.thomsonreuters.com to view archives and order custom League Tables https://www.thomsonone.com7

EMEA Equity Capital MarketsEMEA Fees Reach US$1.4 billion l IPO Issuance Volume up 128% Year-on-Year l Koninklijke KPN NV - Largest EMEA Capital Raising of the First Half of 2013
First Half 2013 | Equity Capital Markets | Managing Underwriters
EMEA Equity & Equity-Related (C1d) Jan 1 - Jun 28
EMEA Equity & Equity-Related volume totalled US$109.8 billion for the First Half of2013 – marking a 79.9% year-on-year increase. Estimated regional fees totalledUS$1.4 billion – up 33.3% from the comparable period of 2012, according toestimates by Thomson Reuters/Freeman Consulting.
EMEA IPO volume reached US$13.5 billion from 60 offerings – with deal countup 3.4% year-on-year, but proceeds up 127.9%. Fees earned on EMEA IPOissuance totalled $346.9 million, with the top 20 bookrunners claiming 73.3% ofthe total wallet share.
▼
76UBS
▲
13▼
Credit Suisse 8 4
Societe Generale 8 3,725.4 3.4Barclays 9 3,977.3 3.6
-2.1 ▼
7,386.5 ▲+2.1
295,363.5
6.7 359 6,376.66
285.8
333 ▼
33
5 7,581.6 -1.5+2.7 ▲
416.97
Bank of America Merrill Lynch
JP Morgan
Deutsche Bank
Morgan Stanley
11.1439.7 0.08.58.3
+2▲ 130.0 +3.8
Citi
2 1 10,622.45 9,141.7
9.5 ▲10.4
▼
9.4+118.4 +1.4116.4▲
10.5▲+11
7.5
▲+4 6.9
62.2
-1.9▲▲ 95.5
65.0
90.5
▲
+1.1
▲
8.4 ▲
5.0 ▼▲+2.3
1.4 ▼
+1
-2+31.5
2 6
42.3▲
▲
46.6
6
40 4▼▲
+3+1 ▲
-4.7
+4.2 ▲6.5116.1 +0.5
0.0
0 3
4.57.2
8.5
+1.3-0.6
+4
9.0
3.4
+5
-0.6
68.9
-0.8▲▲ 3.0
11 +120.1
1 6+0.71.8
106UniCredit
1312
HSBC Holdings PLC
Credit Agricole CIB
0 9
2.3
1 801 81,924.2
1110
+2.01941 2,498.4
Goldman Sachs & Co
1817 4.4
4.9+1.5
MarketShare (%)
▼
Share (%)
▲▼-1.6
Proceeds per Bookrunner (US$m)
▲+0.9
# ofMarket2013 Rank
2012 Rank
# of Deals per Bookrunner
# of Deals
▲
37DealsBookrunner
Market
▲+1
Change in
-
▲
1.5
4.6
▲
+0.6
2 9
1Share Ch.
2 11,462.0
9,090.0+1.4
Proceeds
8.334
Imputed Fees (US$m)
Share Ch.MarketMarket
Share (%)Manager
Fees
24.0 1.7
EMEA Deals Intelligence
EMEA ECM Proceeds Raised by Industry (US$Bil) Jan 1 - Jun 28 2013
EMEA Equity-Related volume totalled US$15.5 billion - up 89.2% year-on-year,with the top 20 bookrunners capturing 96% of the market. The United Kingdomwas the leading exchange nation, with listed IPO issuance totalling US$4.6billion from 19 new listings.
$33.4 30%
$17.5 16%
$11.5 11%
$8.4 8%
$8.1 7%
Financials
Industrials
Energy and Power
Telecommunications
Materials
Real Estate
Media and Entertainment
Rabee Securities Co
18
-0.5
▲
EMEA IPOs by Nation of Primary Listing (US$m)
1819 0.9
1,020.9 0.9+0.41,016.4
▲1.1 1.8▼ 7- 6 1.5
0.6 -0.581.0
6
100.0 389
0.0
4.2+4
0.0+0.1+1
0.3
+1 ▲9
109,806.289,038.9
1,251.8
2.11.5
▲-1.3
1.11.2
+0.3
▼BNP Paribas SA 14 12 1,527.8 1.4 -1.0 ▼
8 0.011.5 0.8-1.3
▼
0.7
0.6
▼-0.7
Jan 1 - Jun 28 2013
+50
43.4%
1,021.4
Jan 1 - Jun 28 2013Top 10 EMEA Equity and Equity-Related Deals (US$Mil)
Industry % Change from Last Quarter*tie
Industry Total
Industry % Change from Same Period Last Year▲31.2% ▲ 12.0%
▲
1,389.2 100.0
▲
73.6
▲
-▲
0.3 +7
8.8+1 ▲
--2-
▼15.4
▲
▼-
16.8
33.3%
4.1 37.5▲
2.6
9.2
40.4▲ -0.3
1.2
11 +11.6 10
2.3
13
-39SEB Enskilda
HSBC Holdings PLC
1.2
20
+0.81,339.5
-0.91,801.8
+1.2 ▲Mediobanca
151,277.2
17
Top Twenty TotalNomura
14NordeaING 34
14.7%▲
79.9%
21
1
▼
▼
▲16
2.7
653.9
162.9
*tie
%$6.8 6%$6.5
6%$4.9 4%
$4.0 4%
$3.9 4%
$3.3 3%
$1.5 1%
High Technology
Retail
Consumer Staples
Consumer Products and Services
Healthcare
$3,957.3
$3,898.6
$3,272.1
$3,213.8
$3,020.1
$2,986.9
$2,946.9
$2,250.0
$1,902.5
$1,750.0
05/14/13
04/30/13
05/24/13
05/28/13
06/19/13
04/09/13
04/17/13
01/09/13
05/09/13
01/09/13
Koninklijke KPN NV
Deutsche Bank AG
Bank VTB
Commerzbank AG
Nordea Bank AB
EADS
EADS
ArcelorMittal SA
Snam SpA
ArcelorMittal SA
$4,601.8
$2,592.0
$1,586.5$1,277.2
$1,073.8
$498.4 $471.4 $427.6 $379.2
0
2
4
6
8
10
12
14
16
18
20
$0
$500
$1,000
$1,500
$2,000
$2,500
$3,000
$3,500
$4,000
$4,500
$5,000
United Kingdom
Germany United States of America
Iraq Belgium Russian Federation
Turkey Denmark Saudi Arabia
# of
Issu
es
Pro
ceed
s (U
S$m
)
Proceeds (US$m) # of Issues
https://www.thomsonone.comVisit http://dmi.thomsonreuters.com to view archives and order custom League Tables8

EMEA Equity Capital MarketsFirst Half 2013 | Equity Capital Markets | Managing Underwriters
21*+0.4
+0.5 ▲
▲ 1
-0.8
+1.514▲
184.0
1.5 +1+2
1.41.4
346.9
▼▲ 2.3
254.2-
6088.1 73.3
1718
100.0Top Seventeen Total 11,841.3
-0.119
13,469.91,187.6 +2Industry Total 100.0
▲+0.71 1.7 0.7+115 171.1 1.3 5
1.2163.1 +1.2 ▲8.3 +4 ▲ 6.9 2.0
2.2 +2.2 ▲1.4 +1.0
-0.6 ▼3
4.8▲▲ 7.7
195.3
5.0 +3+2+1.4
▲
-
- 174.5 1.3- 181.9
- 185.0
▲
▲
1.45.0
1.0
2 3.3 ▲
+0.3
3.3 +1 +0.4
1.7▼
▲▲
1.0▲3.3
+2 -0.2
▲1.422+1.4
1.5 +1.5 ▲
1.7 +1.70.3
3.42 3.3▲
+1 ▲▲ ▲1.7▲
1 +11 1.7
▲0.0 0.0 -1.6
.0+1.6
358
0.9
100.0
16
Jefferies LLC
BNP Paribas SA
20 37
▲
▼+1.6
75,193.3100.0
+1
1.0
595.7
+0.5
Handelsbanken Capital Markets 0.6
Industry Total79.7Top Twenty Total
0
1.7
3
+0.2-0.6 5 -1
4▲17
+0.1
664.719
1.1634.7
171.1
0.718
8.5
16 19
6.6
▼32 974.0
-1.2
1.4
-0.7
7
Morgan Stanley8.6
▼
+0.7
+2.5
56+1.4
▲1.41,339.5
+21.8
1,799.5
+1.2+1
2.0
▲
▼
Proceeds per Bookrunner (US$m) # of Deals per Bookrunner
▲
7.5▲ 2728
6
+0.7
9.2▲
▲
7.8
+5
▲
9▲
▲5.9
▲ -0.1
1
+1.5 ▲
2.5 +43.2
▲
7.8
+14
5.2
-1.054.8
-0.6
▲
+1
+2
1.5
+2.6
▲
-0.4
+3.1 ▲ 28+1.0 33
+16
80.2
4.6
-1.2
49.8 4.2
+0.1
6.8
40.531.1
▲8.9
-0.2
+93.9
25+11
▼7.0
2.03.6
94
▲ 1.4-2.2
2.5
+1.21.1
+18
Goldman Sachs & Co
Barclays 3.57.3
+11
+17
9
6.2-2.6
1
Deutsche Bank
Proceeds10,616.5
Share Ch.+2.61 ▲
# of
EMEA IPOs (C7c)
2012 RankDeals Share Ch.Deals
Jan 1 - Jun 28
Imputed Fees (US$m)Market
# of Deals per Bookrunner
32Share (%)
Manager MarketMarket2013 RankBookrunner
2012 Rank
Market Market
EMEA Common Stock (C4c)
Share (%)
2 7 8,131.8 8.611.3 ▲
Bookrunner8.9 +12.710.1
Share (%)+5.1119.6
FeesMarketMarketChange in
Share (%)Market
Share Ch.# of Deals+17
# of DealsProceeds Fees11▲15.42,075.9 +8
Change in Market
+7.8 ▲
Proceeds per Bookrunner (US$m)
▲ 44.2
Manager2013 Rank
MarketImputed Fees (US$m)
8.74
Deutsche Bank91.7
# ofShare (%)
18.3Share Ch.
14.59.5
Share (%)
Jan 1 - Jun 28
212.71Goldman Sachs & Co
9.3
101.7
▼1
1,175.9
1,956.2▲
-2.8
+4.5▲ 78.1 10
+0.9 ▲1,277.2 +1▲+9.5
+516.7
16.7
Credit Suisse 68 -1.7 61.4
10 3.2
4,699.1
-112▲
37.7 Rabee Securities Co
Societe Generale14
8 2,990.43,325.5 +2.8
▼
5.65,299.5
8,123.2
2
3
▲
8,048.2
+1026▼
▲▼
6,173.2
5.032 ▲
▲
▲▲
7.285.7 Bank of America Merrill Lynch▼
Morgan Stanley
-0.4
▲
+2.0▼▼
5.4
UBS
7.9
3.4
▲
+2.6JP Morgan 4
719
56
10
6+2.6
6.6
0.7
38.5▲
0.8
▼1.0
9.24.2
1.4
-
▲
+43
16.3
+1
▼0.7
▲
1.4
0.3
8.60.8
HSBC Holdings PLC 13 12 1,703.9
NordeaRabee Securities CoSEB Enskilda
15 -14
1,020.9
Mediobanca
12
ING
Credit Agricole CIB
1,277.2
1.9
94,284.9
13Nomura
+0.5835.6
10.9
▼
MainFirst Holding AG
-1.80.0
▲
Investec
Citi
RBC Capital Markets
+0.3
-
-1.4
▼
▲▲
14.5
11.911.2
▲ 0.4
20Nplus1 Singer Advisory LLP
1.20.9
70.4
▼+1.3
197.8
2.5
-
240.0336.4
12Nordea13
▲+1.2 ▲
▲▲
+0.61.2
32.34.2
35.7▲
+1
13.310.3+6
▲13.7+4.4
310.0
▼
+0.3
-1.8
213.8
▲
1.6+1.8
7 395.1▼
8▲
85.0
13.3
+4
+4.2 ▲▲+4.57.7
+1.8
▲4.6 +2.37▲
▲+1.12.33 ▲
16.1+5+511.7
-1.7▲ 5.5 +0.319.03.6
▼ 11.6▲▲
3.4▲
4.06▲ +6
▲26.8
▲5
Citi
4
9
4 35
Bank of America Merrill LynchUBS
JP Morgan 76 5,878.1
3811 22 1,897.7UniCredit
26
17.4 ▼ ANB Invest Co5 --113 2.6
11HSBC Holdings PLC
443.7 -7.5▲
1,061.3
8 2
Barclays
3.3481.7731.4
▲+2.5
2.9 -1.8Credit Suisse 9▼ 10 - +35.0
5.68.0
Nomura
15
▲
▲127.9% 3.4%51.6%
▲ ▲ 28.6% ▲▲ 59.0%
13.7%▲Industry % Change from Last Quarter
Industry % Change from Same Period Last Year▼ 115.8%-2.6%▲
104.3%▲
Market Change in Manager Market
35.7% ▲▲
▲+1
29.0▲+2.6
3.2 ▼
▼
▲+1Share Ch.
Market
Jan 1 - Jun 28
Imputed Fees (US$m)# of Deals per Bookrunner
Share (%)# of Deals
79.0
4.3
7.6
▲
+2.6
▲+0.9
1.4 +0.7
+3.3
2.2
▼▲
▲▲
3.9 +3.8
-1.1
3.2
Market
1.2
Market
7*
# of Deals per Bookrunner
▼
Proceeds per Bookrunner (US$m)
ShareChange in Market
Industry % Change from Same Period Last Year
4
▲
Industry % Change from Last Quarter
Market2013 Rank
2012 Rank
1-2.3
Share Ch.Market
▼Citi
▲
JP Morgan
Proceeds
2 1
78.4%Industry % Change from Last Quarter
12 2,606.9
EMEA Rights Offerings (C8fr)
Deals
Jan 1 - Jun 28
18.9%
# of Deals
Mitsubishi UFJ Financial Group
# of
▲
8.0
▲
▼▼
16.6 5+13.7Share Share Ch.
-0.3
10.2
4.2
0.9
▲
2.7 -2.7
-45.2%-36.4%
100.0
+2.62.6
▼
*tie
1.0 ▲ +2Top Twenty TotalIndustry Total
Industry % Change from Last Quarter36.8% 395.8%
+7.9
▲
▲
7.9
469.3%
235.5
HSBC Holdings PLC6.7
4.112.1Santander
Industry Total
20
2013 RankBookrunner
EMEA Convertibles (C9d)
Bookrunner
1,596.5Deutsche Bank
Top Twenty Total
13
▼
8
7.1 +6.17.8 +6.5
2012 Rank
+0.1
4.3
▲6
+6.4▲
JP Morgan
10
1,213.2
- 987.31,093.5
Imputed Fees (US$m)Manager
3
Deutsche Bank
+3.8
Proceeds per Bookrunner (US$m)
▲
2.1
30.4
▲
2.7▲
3.3
Credit SuisseBarclays
Citi12.711.6
-7.6
▲
-7.5+4.6
11.1
▲
96.0 184.3
70.3%
- +0.70.7 +0.7 1-
1▲
0.83.2
- 124.9 ▲▲
0.7101.0100.9
201.6
▲-20.6% ▼
100.0
Share Fees+1
-22.7
0 22.727.4▲+1
19
▲+12
1 2.24.4
02.2 ▲
- 5.5
748.238.1 ▲
▼2
1,268.2
9.5
7
4.8
▼▲7.6 +2.7
9.2
4.4 0
10.23 5 +2.4
15.6
+4.2-
4.42-0.5
+1Goldman Sachs & Co
▲31 438.4ING +3.5
715.2 4.6 ▲65 33*
+1.21.9
3.7
6.5▲+0.9+1.2
+1Rabobank NV
▲42 561.0 3.6+2.4
438.47* -
6.7
7*+2.8
RBS 2.8
Nordea 9 13 424.7 2.7 +0.4 ▲ 22.8 ▲ 1
04.4 3.3 -0.3-1 ▼ 13.2 4.4 -1.6
9.9Credit Suisse 10 3 403.8 2.6 3-4.7 ▼
-
▼ 8.5-1Sberbank CIB 12* 2.2
2.4Handelsbanken Capital Markets ▲11 24 379.0- 363.1
1 2.2+1.82.3 +2.3 ▲2.3 +2.3 ▲2.2
1+1
284.8
6.4▲+1
▲1.8
VTB Capital 12* - 363.1 ▲ 1
+1.8Bank of America Merrill Lynch 14 9 353.5Barclays 15 -
▲2.2 +1▲1.4
6.7 +1+24.4
2.3
211.7 -3
▲
2
32 ▲
-2.3 ▼
1Masraf Al Rayan 16 - 260.9 1.7 +1.7
Investec 18 2517 4
19 7*
UBS191.7 -
▼-5.3
▼165.11.2 +0.7
+1▲ 1 2.2
3
4.40
▼
4.4BNP Paribas SAJefferies LLC 20
6.71.1- 161.2
100.076.3
Industry % Change from Same Period Last Year
15,668.4
-16.6% ▼
11,935.4
Banca IMI (Intesa Sanpaolo)
Standard Bank Group Ltd
9.9
2.9 +2.4+2.1
+1.0 2-4.2
+2.3 4BNP Paribas SA 5
7
1
17
2
1
▲
14.74
▲
22.6▲▼
2▲ 7
2,499.2 16.1
142,282.2
Market # of
32.310Proceeds
MarketShare (%)Share (%)
▼
Share Ch. Deals Fees12.3
-0.4▲24.7
9
-2.87.6+5 15.3▲▲ 15.2
+7+6
15.1
▲ 14.7
7.530.4
6 19.49 +929.0
11.210.3
▲ 12.4+26.4
Goldman Sachs & CoMorgan Stanley 6 16.1▲958.2 6.2
▼ 5 16.15
+2 ▲
▲
+5.1
+0.7▼
3.8
5.15.6
7.7
▼
▲6.17.3 -1.0
+4.5 ▲
-1.2845.6 5.5
8-9.0+2.5
9 - 4.511* 734.9 4.7
698.9▲
4.2 +2.6▲ +0.13.7
-7.47.4
▼
▲+3+26.5
▲▲ 2
12.9▲ 4
3 +29.7-4.8 ▼+4.5
▲ 44 12.911 3 651.8
12 - 587.1
664.5
3.8
5
▲4.9
9.7 +2.6+112.9 +4
▲+2-1.8 ▼
3.06.1▲
4.3
2.4▲7 498.6
253.1
3.7-0.6 ▼10 263.6
7.4-0.4 ▼ 3- 3.11.7 6.5
3.2
-1.3 2.1
▲
1.63.2
03.2
1▼
-+2.1-0.41.5
▲1.1
▼12
-1 ▼▼2.5
136.4 ▲1716 15* 175.0 +0.1 ▲ -0.11.2
3.2 +1+1.3
1.9 0.9 -0.3▲+3▲ 9.7+0.8 3
0+0.9
▲
▼▲2.6 1.3
0.9 -0.60.2 +0.2.4+1▲
1.8
15,521.3 100.0 +73114,869.9 91.3
-45.0% ▼29.2%
▼▲▲89.2%
▼
-
▼
18
Bank of America Merrill Lynch
298.0
-34.8%
45
Industry % Change from Same Period Last Year
-24
15
UBS ▼
Credit Agricole CIB
Commerzbank AG
Societe Generale
ABG Sundal CollierLazard-Natixis
Mediobanca
14
0.9 1
-1.0
https://www.thomsonone.comVisit http://dmi.thomsonreuters.com to view archives and order custom League Tables9
Asia (ex-Japan, ex-Australia) Equity Capital MarketsFirst Half 2013 | Equity Capital Markets | Managing Underwriters
24.08.8▼
Asia Equity & Equity-Related, inc Chinese A-shares (C1b)
1.0
▼-2
-1
4.528
Jan 1 - Jun 28
6
14
6▼
2.92.3
10
18
▲
▲
+8
▼+13
4.141.9
-10+2
10 1.6 -1
▲
3.13.7 +10
+2
▲
▲
▲+5
4.7
50.5
47.3
3.1
3.433.9
31.336.7 3.6
2.5
15.418.9
20.9
24.9
2.424.1
▼0.9
+0.4
2.42.1
-5.71.91.5
+1.1
+0.6
+0.6+0.9
▲
+1.4▲+0.9
-0.8
▲
▲
▼
▲
▼▲
▲
+2.9
▲+2.4
▲
+1.7
75.3 7.5 +3.1 ▲
▲
-0.1
5.0-0.2
3.5
23
▼
▲
3.0 ▲+1.919
25
+0.1
0.0
▼
▲▲
▼
-3.0
-3.0
3.1
▼
▲
4.1
-2.03.2
+3.7
-
▼
+0.3
-0.3
▲
2013 Rank
10.8UBS 2Bookrunner Proceeds
Market2012 Rank
Proceeds per Bookrunner (US$m)Market
# of Deals per Bookrunner
+13
7,885.81Share (%)
21
6.5
+4
▲4.4
▲
▲▲▲
40
3.4+6+7
30
MarketShare (%) # of Deals
27
4.9 ▲
HSBC Holdings PLC
CITIC1,656.4
CIMB Group Sdn Bhd5
1.0
1.61,294.8
2.31,503.0
14 1.8
4.1
13 1,789.7 2.5
8+1.63.4+0.52,320.3
101112Woori Invest & Sec Co Ltd
5
Haitong Securities Co LtdDeutsche Bank
76
Guotai Junan SecuritiesBank of America Merrill LynchCredit Suisse
9
JP Morgan
Citi
5.0
2.1+1.7
2,982.04Morgan Stanley
74
2,502.0
216 2,224.1
3,646.0
2,169.5
2,546.2
3,651.9
14
Goldman Sachs & Co
Deals
8
37
5.0
Fees
6,564.6 9.0 +0.4
Share Ch.ManagerChange in # of
2 13
13
3
1215
Share (%) Share Ch.
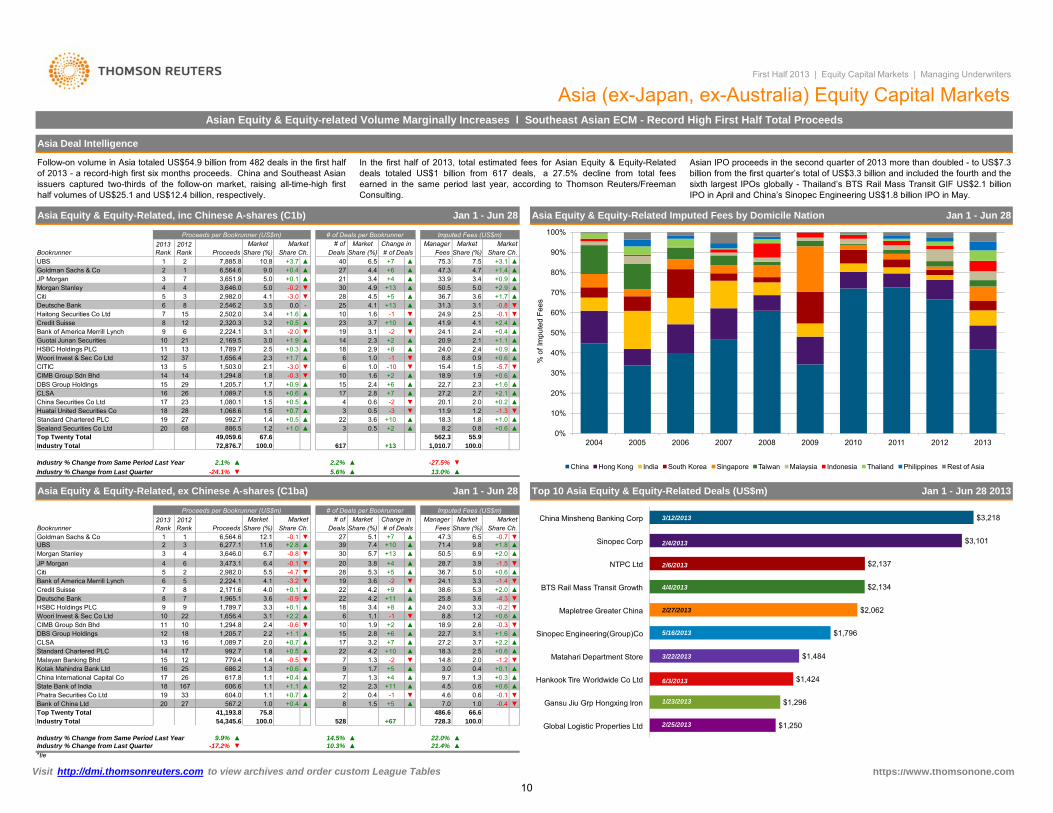
Asian Equity & Equity-related Volume Marginally Increases l Southeast Asian ECM - Record High First Half Total Proceeds
Asian IPO proceeds in the second quarter of 2013 more than doubled - to US$7.3billion from the first quarter’s total of US$3.3 billion and included the fourth and thesixth largest IPOs globally - Thailand’s BTS Rail Mass Transit GIF US$2.1 billionIPO in April and China’s Sinopec Engineering US$1.8 billion IPO in May.
MarketMarket
In the first half of 2013, total estimated fees for Asian Equity & Equity-Relateddeals totaled US$1 billion from 617 deals, a 27.5% decline from total feesearned in the same period last year, according to Thomson Reuters/FreemanConsulting.
Follow-on volume in Asia totaled US$54.9 billion from 482 deals in the first halfof 2013 - a record-high first six months proceeds. China and Southeast Asianissuers captured two-thirds of the follow-on market, raising all-time-high firsthalf volumes of US$25.1 and US$12.4 billion, respectively.
Imputed Fees (US$m)
Jan 1 - Jun 28Asia Equity & Equity-Related Imputed Fees by Domicile Nation
Asia Deal Intelligence
30%
40%
50%
60%
70%
80%
90%
100%
% o
f Im
pute
d Fe
es
617
# of Deals per Bookrunner
27.2
0.8
-27.5%
18.3 1.8
2.717 2.8
▼
8.2
▲
8.8▼
▲
▲
1,010.7
Jan 1 - Jun 28 2013
18.3
25.8
27.2
1.224.0
+0.3
1.0
+0.1
22.0%
0.41.39.7
+5
▲
4.2
▲
-3
0.5 ▲
▲+7 +2.1
1.2
22.7
11.92.020.1
+1.6
-1.3+0.2
2.3 ▲
▲▼▲
Market
▼
-0.7
6.9 ▲9.8
▼Share (%)
6.5
+2.0+1.8
-1.5
-1.4
71.4
-0.3+1.6
-4.3
36.7
3.6
24.1
0.6 ▲
Share Ch.
Top 10 Asia Equity & Equity-Related Deals (US$m)
Imputed Fees (US$m)
+2.0
5.03.9
+0.6 ▲
Jan 1 - Jun 28
▲
▲
▲2.5
+0.6
+0.6
▲
▲+1.0
28.7
47.3
▲
▲10.3%▼
1.0
9.9%
8
▲
Industry % Change from Last Quarter*tie
+51.31.7
+11-10.4
486.6
2.4
1.4
7
▲
3.0
2.3122
▲▲
▲
+1.1
▲
75.8
▼-0.51.3 ▲
▲
100.0
1.8
+0.4
779.4+0.6
1.1
CIMB Group Sdn Bhd
CLSA
Phatra Securities Co Ltd1.1
Standard Chartered PLC
▼
167
17 +0.5
3,473.1 20
3.6
22
2.2+0.7
15
▲4.1
▼ 50.5
3.322
# of
3.828
▲
5.7
5.3
55.9562.3
▲+13+10
+46.4
19
▼
+11
▲
+7
Market
13.0%
4.0
11.6
2,982.0
4.2-23.6▼
-4.7
+9
▼
+0.12,171.6
3.3 +8
▲▼
+5
22
-3.2
18▲
5.5
3.4
3,646.0
MarketShare (%)
Market Market
5.139
6.7
Share Ch.▼
22
▲
30-0.8+2.8
2.2%
▼
-24.1%
3
Change in
5.6%▲
+13
+2▲ 3.6
▼▲
+615
-2
▲+10
2.4
1,068.6+0.5
12.1Share (%)
886.567.6
▲
6,564.6
100.0
▲
▲
1.7
+1.0
+0.7
3
+0.5
20Top Twenty Total
27
1,089.7
0.50.61,080.1 ▲ 4
▲
▲15 1,205.7
171.51.51.5
Industry Total
Proceeds
68992.7
Asia Equity & Equity-Related, ex Chinese A-shares (C1ba)
2.1%
49,059.6
Industry % Change from Last Quarter
Bookrunner1
2012 Rank # of Deals
▲27
Deals2013 Rank
▲Goldman Sachs & Co
24
UBS1
3
Deutsche Bank
Morgan Stanley
5
JP Morgan4
7
CitiBank of America Merrill LynchCredit Suisse
6
6,277.1
8
5
97
3
8
6
1,965.1
2,224.1
DBS Group Holdings
9
Malayan Banking Bhd
State Bank of India
10 22
16Kotak Mahindra Bank Ltd
11
3319
25617.8China International Capital Co
1817
15992.7
101,205.71,294.8
12 181613
+4
-2
-11.1
1.3
10
17
97
27 567.2
+2.2
1214
1,656.4
2.0
+1.1
20
1,089.7
+0.4
▲21.4%
+67
14.5% ▲
-0.17.04.6
-0.466.6
100.0
▼▼
▲
▼▲
▲
-0.2
▲
5.3
2.0
▼
3.7
19
China Securities Co Ltd18
▲Woori Invest & Sec Co LtdHSBC Holdings PLC 1,789.7
2
3.3
▲+0.6
Sealand Securities Co LtdStandard Chartered PLC
Industry % Change from Same Period Last Year
6▼
38.6
72,876.7
Proceeds per Bookrunner (US$m)
7.4
-0.62.8
▲
▲
16
Huatai United Securities Co2326CLSA
28
DBS Group Holdings+0.6+0.9
606.6
686.2
3.1
1.2
-0.1
29
41,193.8
26
528
▲
0.6
Industry % Change from Same Period Last Year
Bank of China Ltd
Industry TotalTop Twenty Total
54,345.6
-17.2%
-0.9 ▼
▲
▼
▲
FeesManager
▼4.2
+6+21.9
+7
1.1604.0
+10
+0.1
1.4
4.5
▼
-0.1
▲+0.7
3.2
▼3.1
100.0
2.6
14.8
▼▲
1.5
+0.6
22.7
-1.2
+2.2
18.9
▲
728.3
$3,218
$3,101
$2,137
$2,134
$2,062
$1,796
$1,484
$1,424
$1,296
$1,250
China Minsheng Banking Corp
Sinopec Corp
NTPC Ltd
BTS Rail Mass Transit Growth
Mapletree Greater China
Sinopec Engineering(Group)Co
Matahari Department Store
Hankook Tire Worldwide Co Ltd
Gansu Jiu Grp Hongxing Iron
Global Logistic Properties Ltd
3/12/2013
2/4/2013
2/6/2013
4/4/2013
2/27/2013
5/16/2013
3/22/2013
6/3/2013
1/23/2013
2/25/2013
0%
10%
20%
2004 2005 2006 2007 2008 2009 2010 2011 2012 2013
China Hong Kong India South Korea Singapore Taiwan Malaysia Indonesia Thailand Philippines Rest of Asia
https://www.thomsonone.comVisit http://dmi.thomsonreuters.com to view archives and order custom League Tables10

1.6 +1.6 ▲▲ 3 2.7 +2 ▲ 3.5+1 1.8 +1.8 ▲
BNP Paribas SA 20 88 140.7 1.3 +1.2
Asia (ex-Japan, ex-Australia) Equity Capital MarketsFirst Half 2013 | Equity Capital Markets | Managing Underwriters
65.9100.0 100.0
73.5222.7
161.1 1.5 +1.3 ▲
696.12
217.6
522.2
-7.2
+2.6
1.6 -2.0
▼-1.9
2.1
3
+1.8
146.1
▼
▼
+0.2 ▼-7
▲ 3.9
▲
3.23.3
+1.9
3
112
31.9
32.2 3
▲
▲2.8
+2.8
+1.2+2.12.6
2.3
565.8
▲3+6.3
8.06.8
▲+5.8
662.3
31
-1.3
BookrunnerShare Ch.▲
Proceeds per Bookrunner (US$m)
850.4Proceeds
Imputed Fees (US$m)
2.8
17299.0
240.3
296.8
19270.9
-
341.4
42
60*
-112
1.92.7
3
▲+1.0
1.7▲
+0.7
1.1
▲▼
+1.4
10.11.8
0▲
1.7+3
3.71.8
3.7+2
▲+3.1
+0.8+4.5
▲2.7
▲
64Top Twenty TotalSealand Securities Co LtdHaitong Securities Co Ltd
China Securities Co Ltd
CITIC
Woori Invest & Sec Co Ltd
2535Standard Chartered PLC
CLSA
12 5
Huatai United Securities Co
Credit Suisse
2013 RankBookrunner
1
CIMB Group Sdn Bhd
JP Morgan
Deutsche Bank
11
33
2Morgan StanleyCiti
Goldman Sachs & Co
4UBS 2
4
2012 Rank Share (%)
# ofProceeds per Bookrunner (US$m)
Bank of China Ltd
Malayan Banking Bhd
2▲
1
4
5
▲
▲
▲
4
46
4.53.6 +15.4
3.6 +2
+2 3.1▲▲
+1 ▲
+5▲
3.16.9
2.7
3.6
2.7 -2 ▼
4.12.7 -
▲
-0.21.52.7 3.1
3.33
-2.0+0.1
▼
2.72.7 2.4
▼-4-1 4.2
+0.8
1.4
7.04.5
2.6
5.9
Share Ch.▲
18.510.4▲
Jan 1 - Jun 28
+4.0
MarketShare (%)
+3.2
-
Market
UBS▲
1
Market
5.4
Change in Market
3,646.0
Proceeds
+3.1
23
1.210.2
▲ 4.59.9
-
Market
6,223.0
5.6
Share Ch.9.5
6,051.50.0
9.21
Guotai Junan Securities
Bank of America Merrill Lynch
20
9
12
DBS Group Holdings
HSBC Holdings PLC
Deals
▲+0.2
+5
Share (%)2013 Rank
+2621.34.5
+2.203.9
Citi
2012 Rank
Asia IPOs, inc Chinese A-shares (C7a)
+1.0 ▲6.2
# of Deals per Bookrunner
Share (%)# ofMarket
Deals
# of Deals per Bookrunner
Share (%)
6.3
Share Ch.
40 5.48
720.3+4.7 6
Share (%)10+2
Fees
▲18
64.4
Manager
42.2
+33.0
+13
616
100.0
▼
▼
54.3
Bank of Communications Co Ltd
10
-0.12.32.0
1,068.6
19
Siam Commercial Bank PLC12
JP Morgan
132.0
▼
Bank of America Merrill Lynch
CITIC
8.8
4.2▲2.8
▼0.9-
▲ 25.8
1.9 0.0+11
▲ 20.9 2.3
235.2
+0.6
7
-
DBS Group Holdings
2
169.5
+3.4
▲
Deutsche Bank 8
17
10
15
Credit Suisse
▲
▲▼
11
18
16
14
China Construction Bank
HSBC Holdings PLC
▲Phatra Securities Co Ltd
9China International Capital Co
▲
Market# of Deals
5.1
ManagerImputed Fees (US$m)
Fees+8.0
8.3
9.6+4.7
▲11.4
▲7 +6.74.2
▲+1.5
# of Deals
-0.2
▲
38.8-1.2
17.4
6
+1.9
20.9 ▲▲
Market
+0.7
+0.7
-7.6 ▼▼▲
4 3.6 +3
0.9▲
0▲
4.7
4.6▲
▲▲
▲+4.2+4.2
+1.0
74 638.5
512.5 +4.233*345.7
+3+3
5.3
▲6.0
+4.7
6.2 +5.0 5.4▲
4
▲
▼20.4▲▲
-0.2
Morgan Stanley 6.6
2.26
▲
▼
6.9
4.8
18
4
+1.2 6Goldman Sachs & Co
30-2.5
-24
4.1
5.1
52,743.1
533.6
37
1.7
▼ 2.5+0.8
-3.2
3.2
▼3.3
-0.8
3.7
1.0
3.7
14
▼
▲ 22
▼
+9
-10
0-3
-3-2
+6
+2+12
20.1
0.98.221.0
2.6▲Haitong Securities Co Ltd
Top Twenty Total
+1.9
Industry Total7,791.1
196.7
230.3
10,622.5
-1.3+1.4
5+0.3
19
15
662.3
1.3
▼
▼11.9
▲▲ 18.3
7
+3 ▲▲
▲
+0.8
2.0+13
18.9▲21.5
+6
▲
14
22
992.71716
4
-2
2.4
24.3
0.7
-5.9▲
15.42.31.7
2.32.2
▼
2.4
2.5 ▲2.6
▲3.3
+1.915
1.0
226
2,061.17 ▼
+2.1
8-0.2
19 2,169.58
MarketMarket
2.7
5.450.5▲
Change in
0.5
▲
+0.4
+0.7
+1.4 14
2.70.0 -
▲
34
▼
1.5
3.716
1.71.6
223
▲
1,564.1
1.4
1.713
26
Industry Total
18
886.564.9
1.4 +1.29
▼14
1,294.8
1,080.1
1.51.4
▼
+0.615
2,153.5
1,503.0
52
11
13
▲893.3 -0.6
2.4
-2.5
42,411.3
1,656.4
+0.9▲
▲10
3
930.1503.3
594
▲+20.5
65,480.1 100.0 +53
2,676.94.0 +8
▲▲
934.9
▲
1,673.4
3.6 +2.17
6
1,138.9
Jan 1 - Jun 28Asia Common Stock, inc Chinese A-shares (C4a)
-407,396.6
▲
94.3-
76.0100.0
Industry % Change from Same Period Last YearIndustry % Change from Last Quarter -68.0% ▼
4.3+0.6▲
0.6
▲
2 +2.7+0.7
-35.7% ▼ -45.0%-63.5%
.9+10.8
▲▲.6▲
+0.7
-4.3%
1.1
▼▼
▲+1
+2 ▲+1.4 ▲▲ 1.4
1.5 ▲+1▼
▲ 2.2
1.2-3.7+1.5
1.5
2.7+1
▲+1
4.4
▲4.34.3
1
1.1
▼▲1
1
▼
4.3
14.3
▲
4.34.3
▲
3
+1
4.3
24.8
-8.0 ▼
+2.5
17.43.5
13.0
Share Ch.
# of Deals per Bookrunner
1▲
+4.6
Deals▲
4
▲
+24.3+21.821.8
7.55.3
+3.3
Fees# of
15*-
-
2.2
66.866.857.6
1.0
1.8
- 0.9
117.673.3
- 132.5
4.6
-
2
-
163.9
3.2
▲+4+1
+1.6
+0.9
+1.0
+1
+3.1
▲
-6.0
-1
▲
▲
8.7 +2
▼17.4
4.3
550.8
-
2-
2.1
341.6
3.1+2.2
7
1
1▲ 1▲
2
▲4.3 +1
+1.8+2.1
▲
3
4
34 ▲
16.86.7
MarketShare (%)
10.9▲13.0
13.0
+2
MarketChange in Market
▲Share Ch.
▼
13.5
98.1%7.4%-72.2%-50.0% ▼
1259.2238.9
▲
▲
▲
▼
+8.5
392.7
-2.2
5
Industry % Change from Last Quarter
1
Morgan Stanley 3
2012 Rank
52
4
2013 Rank
Industry % Change from Same Period Last Year
Manager# of DealsShare (%)
3.9
▲
5.4 6.7 ▲5.1
4.8
+4.48.3
▲▲
▲
0.01
Haitong Securities Co Ltd
Market
Industry % Change from Last Quarter
6
+2
567
20
Bookrunner
2
1.4
▲3.91.5
2.1 +3
6
▲
46.4
-10.3
+0.8
▲
3.9▲
+6.4
+13.2
17.4+1
8Citi7Credit Suisse6
▼Goldman Sachs & CoDeutsche Bank
Bookrunner
▼-4.0
Nomura
Industry % Change from Same Period Last Year
▼2
Proceeds per Bookrunner (US$m)
+3
▲
237,377.4
40.7% ▼
99.980.6 100.0
54.4707.4
39.2%
+0.7
▲
0.8
DBS Group Holdings-1.6▲+1.8
Industry Total
▲Minsheng Securities Co Ltd 17▲
12▲
▼BNP Paribas SA
CIMB Securities (Singapore) Pt
13Daewoo Securities Co Ltd
+0.7
100.0
2.2
2.0
HSBC Holdings PLC▲
▲+1.9+1.7
▼+0.8
154.8CLSA-1.8
▲
▼Daiwa Securities Group Inc
14
- 225.6
+4.4
0.9
▲▲
+1.6
910
▲
+111
Emperor International Holdings+1.1
-315*
3.6+2.4
▲1.6
+0.33
1.90.32.4
1.2.3
18 - 50.5
▲
+0.8
+23.7
-4.4
6.5
3.1 ▼
+6.33.8
-3 ▼3.1
3.8
2.9 +3.7
+3.8
▼
▲▲
+4.0+13.0
Imputed Fees (US$m)
13.6▲
Jan 1 - Jun 28
▲ 5.23.1
8.7
-1,834.4
122.4%
Asia Convertibles, inc Chinese A-shares (C9b)
975.0 13.2
Share (%)Proceeds
1,608.8
18.9
6.1+1.2 ▲-3.4
4.52.4
43.1
-3.8
1.1▲
-
1.9
-4.22.70.0
1.7
+2.0
2.3
0.6
2.9▲+0.4
+93.222.3
▼▲
+519.1 2.7 +2.117.0
13
1 28
-1.1▲
JP Morgan
UBS
4Bank of America Merrill Lynch3
▲
2012 Rank
2013 Rank
MarketMarket
-46.4% ▼
Market
-17.2%
Goldman Sachs & Co
Proceeds per Bookrunner (US$m)
Asia Secondary Offerings, inc Chinese A-shares (C8c)
▼-1.0%
Share Ch.10.2
1811
UBS
6Guotai Junan Securities
Credit Suisse
5,201.1
JP Morgan
▲ 3.5 +11
▲+2
3
3
17
3 ▼
+2.0 ▲
CLSA
825.3
1.6Standard Chartered PLC 25 859.718
1.6
▲
0.6
0.6+11
▲
3
1.57
-3 ▼
2,446.5
-
759.0
901.8
2,022.82,079.521
3.0
1.6
50
-0.72,949.8 5.4
4.5
▼
9.5
ProceedsMarket
9.8%
Share (%)
20.2%
# of Deals per Bookrunner
Jan 1 - Jun 28
Market Change in # of Deals
▲7.7%▲
Manager
▲
Imputed Fees (US$m)# of
4.6▼3.9 32.3
-29.0%
6.45,584.5
2331
-1.0
-3.0 19
15▲
▼+104.8
-1
▲
▼
▼3.1
1,762.19 1,807.8
-
▲3.8-5.7 ▼+2.8
3.73CitiDeutsche Bank
16+2.5-0.2
9 38 1,616.5Woori Invest & Sec Co Ltd
+0.2
Bank of America Merrill Lynch 10 4 2.6 2.5▲
3.383.3
-1.6
▼
1,433.011 7
1,156.81,285.5
2.1
8 3.2
CITIC15
-4.3 ▼
CIMB Group Sdn Bhd▼2.3▲+0.812
China Securities Co Ltd 13 35 1,080.1 0.8
16 18
0.64
2.0Huatai United Securities Co 14HSBC Holdings PLC 15 10
1,068.6
19
Sealand Securities Co Ltd 17
Guosen Securities Co Ltd KB Financial Group Inc0.7
47 886.5+0.7 ▲
+2.1+2.0
45.7▲▲
114.4
-41 4.3RBC Capital Markets
Top Twenty Total▲+0.220.9 1 0
12
▲
0.32019
▲
19
▲
8.7
MarketShare Ch.Deals Fees
▼
Share (%) Share (%)
+6
13.7
+5
▼
3.7 +6
31.9▲
▲
-1
+3
-3
▲ 28.7
2.2
4.17.8
12.315.5
2.8+1.5
1.6
1014
1.2+1.3
-1.3
▲
2.0
▲
+1.4
15.3+1.4
▼
0.6
23.1+6
+3383.8
20.1
2.517.7
8.2 1.2
11.91.5
▲
3.3
36,620.0
10.51.7
▲
66.9
▲
▲+5
+165
3
893.1
-
▲
482
▲▲
100.0
52.1%7.7% ▲
*tieIndustry % Change from Last Quarter 3.5%
Guangzhou Securities Co Ltd
▲
Industry Total 54,857.6Top Twenty Total
-31.4% ▼Industry % Change from Same Period Last Year 18.5%
https://www.thomsonone.comVisit http://dmi.thomsonreuters.com to view archives and order custom League Tables11
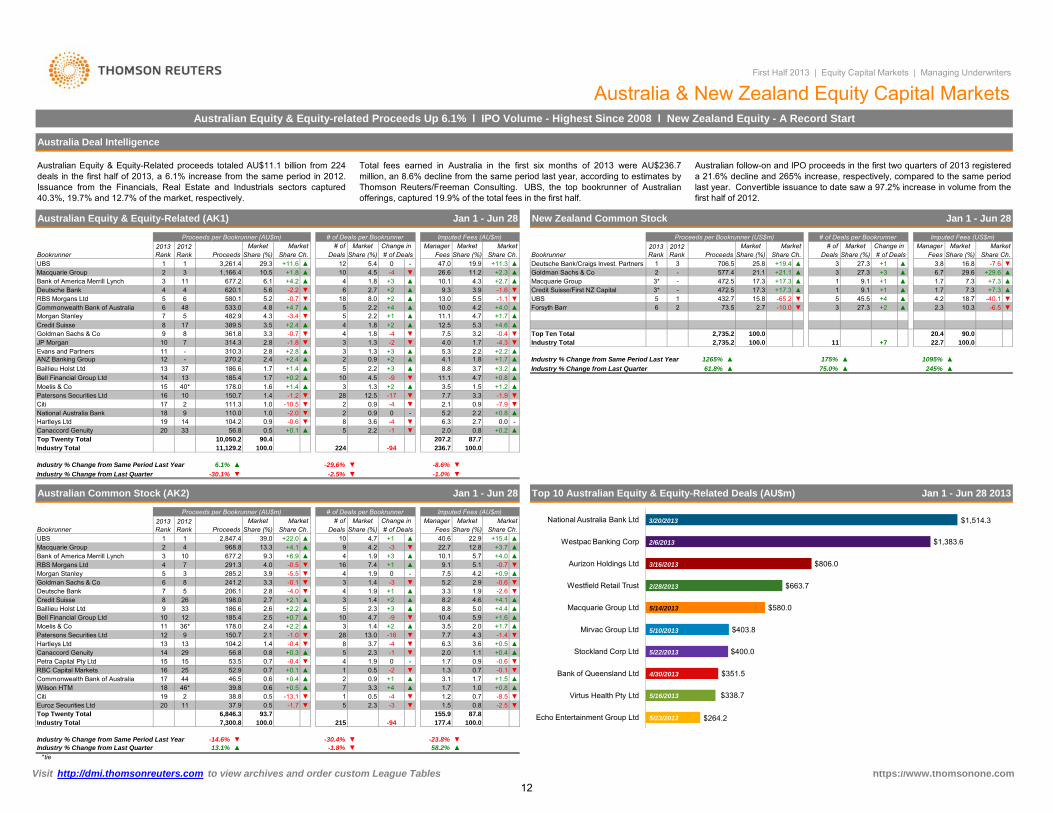
Australia & New Zealand Equity Capital MarketsFirst Half 2013 | Equity Capital Markets | Managing Underwriters
100.0
▲Industry % Change from Last Quarter 61.8% ▲ 75.0% ▲ 245%Industry % Change from Same Period Last Year 1265% ▲ 175% ▲ 1095%
100.0 11 22.7+790.020.4
3 27.3 ▼2.3 10.318.7▲ 4.2▼ 45.5 +4
+2 -6.5▼
Forsyth Barr 6 2 73.5 2.7 -10.0 ▼ ▲
+7.39.1UBS 5 1 432.7 15.8 -65.2 -40.15
▲▲
Credit Suisse/First NZ Capital 3* - 472.5 17.3 +17.3 ▲ 1 +1 ▲7.3
-7.6
+7.3+29.6
+1 ▲1.7 7.3
Macquarie Group 3* - 472.5 17.3Goldman Sachs & Co 2 - 577.4 21.1
1.727.3▲ 3+21.1
9.1+17.3 ▲ 1
Share Ch.3
▲ 6.7 29.6+3 ▲+1Deutsche Bank/Craigs Invest. Partners 1 3 706.5 25.8 +19.4
Manager Market Market# of Deals
▲ 3.8 16.8Fees Share (%)
▼Proceeds Share (%) Share Ch. Deals Share (%)
▲ 27.3
Imputed Fees (US$m)2013 Rank
2012 Rank
Market Market # of Market Change in Proceeds per Bookrunner (US$m) # of Deals per Bookrunner
Total fees earned in Australia in the first six months of 2013 were AU$236.7million, an 8.6% decline from the same period last year, according to estimates byThomson Reuters/Freeman Consulting. UBS, the top bookrunner of Australianofferings, captured 19.9% of the total fees in the first half.
2.24.5
2.4 0.95
▼1.8 -41.3
▲ 8.8▲
▲+2.8 3-1.8
3.3 -0.72.8
▼
3 +4.2620.1
11 6.1
482.9
-2.25.6
6-3.4 ▼+4.7
8.0-0.7 18▼
55
▼
17
4
2013 Rank Proceeds
+2.49
1
Market
Australian Equity & Equity-Related (AK1)
12
RBS Morgans Ltd 6▲
580.1
1011
270.2
4.8
3.57 4.3
2.8314.3
Baillieu Holst Ltd
310.3ANZ Banking Group
Deutsche Bank
1,166.4
Proceeds per Bookrunner (AU$m)
+2.3+1.8▲677.2
▲
4
29.3 +11.6
▲+4▲
▼
6+2
Australian Equity & Equity-Related proceeds totaled AU$11.1 billion from 224deals in the first half of 2013, a 6.1% increase from the same period in 2012.Issuance from the Financials, Real Estate and Industrials sectors captured40.3%, 19.7% and 12.7% of the market, respectively.
1.8
+3
2.2
-41.8
# of Deals per Bookrunner
▲
+3 ▲1.7
+2.22.2
+3+2
▼
+1.73.7
Top Ten Total 2,735.2 100.0Industry Total 2,735.2
▲
▼
▲
4.5
▼
Share (%)
-23.27.5
4.01.3
Deals
4 5.3
-9▲+1.4
▼
1.8 ▲
▲
▲
-1.1▲
4.3
▼
+2
+2
5.5
▲
10.011.1
11.1 4.7
4.7
+0.8
-4.3
4.1
12.5
5.3
Imputed Fees (AU$m)Manager Market
-1.63.99.3
+4.0
0 -
Australian Equity & Equity-related Proceeds Up 6.1% l IPO Volume - Highest Since 2008 l New Zealand Equity - A Record Start
# ofShare (%) Bookrunner
Jan 1 - Jun 28
Australian follow-on and IPO proceeds in the first two quarters of 2013 registereda 21.6% decline and 265% increase, respectively, compared to the same periodlast year. Convertible issuance to date saw a 97.2% increase in volume from thefirst half of 2012.
▲
4.2
19.9
2
-0.4
▲+2.4
10▲+0.213
13 1.71.737
185.4
▲+1.7+4.6
+3.2
▲
▼
26.647.0
+2.7 ▲11.2
+11.3
Goldman Sachs & Co 361.8
5Morgan Stanley389.5Credit Suisse
5.4
2.74
Commonwealth Bank of Australia 533.05.2
3,261.4▲
Share Ch.Bookrunner Share (%)
-
2012 Rank
7-
3 10.5
▲
Bank of America Merrill Lynch
Share Ch.
Macquarie Group
Jan 1 - Jun 28
MarketChange in
10
43
Market
2.2
▼
+1
10.1▲
12
14
JP MorganEvans and Partners
UBS
8
186.6Bell Financial Group Ltd
# of Deals Fees
13.0
Market
▲8
▲
12
48
Australia Deal Intelligence
5
New Zealand Common Stock
Hartleys Ltd 199
▲90.4
104.2145
2
33-4
21.0
0.5
▼-2.00.91.0
+0.1
110.0▼
-0.656.8
▼
1.31.41.6 ▲
Industry % Change from Last Quarter 13.1% ▲ -1.8%
-94
Industry % Change from Same Period Last Year -14.6% ▼
Industry Total 7,300.8
▼
100.093.7
-30.4%
215
▼ 50.5Citi 19Euroz Securities Ltd 37.9Top Twenty Total
38.839.8
6,846.320
-13.10.518
▼▲0.7
0.7
+0.4
▼0.6 ▲+0.5
0.917 4425
▲52.9
0.6
3178.0 +2.2
+0.1
2.1
1556.8
104.2150.7
0.81.4
Canaccord Genuity-0.4
▲
2.4
13
15
-0.4
53.5+0.3
▼▼ 28-1.0
1.411 36*12 9
8
2.512186.6 2.6
▲
+2.2 ▲+0.7
5
-4.0
9 33
291.3 4.0-5.5-0.5
+2.1
-0.1Deutsche BankGoldman Sachs & Co
526
RBS Morgans Ltd
198.0
285.24
36
+22.0 ▲
+6.93 677.2
1
9.3+4.1
3.32.8
3
7.416▼3.9
-3+3
4.2
34
+21.9
Bookrunner
11,129.2
Industry % Change from Last Quarter
Share (%)
Industry % Change from Same Period Last Year ▲
224
Market
-2.5%▼
Australian Common Stock (AK2)
▲+15.4
12.810
# of Deals
▲
22.9
+4.04
+1
Industry Total
-8.6%
Top Twenty Total
6.1%
100.0 -94
0.9
-1
-1.2 ▼
8
-400.9
0.8
2.1-17
+1.4
3.6
12.5283
-10.5 0.9
2.7
▼
▼ 6.3- 5.2 2.2
Credit Suisse 8
Patersons Securities Ltd
Petra Capital Pty LtdRBC Capital Markets
46.50.5
2
2013 Rank
Proceeds per Bookrunner (AU$m)
UBS
29
7
1 2,847.4
Bank of America Merrill Lynch
5
78 241.2
10
2
Moelis & Co
46*
11
Hartleys Ltd 13
Wilson HTM
16
178.0
Canaccord Genuity10,050.2
-30.1%
18
20
National Australia Bank
10.1+3.7
-16▼
2.03.513.0
0.7
4.2
▼
5.2
7.73.6
+1.7
1.1
▲
100.0
2.3 -1
+2
236.7
+0.22.287.7
-3
+0.4
-1.0%
Imputed Fees (AU$m)
2.0
▲
▲
▼
8.8
177.4
7
1.9
3.7
1
100.0
+1.5+1
4.3
155.90.8
1.71.0
3.1
0.71.5
4.7
0.5 ▼ -8.5
-
12.3
▲-2
1.21.73.3
▼
▲
10
1.7 -0.6
6.3 +0.5
-4+4
1.3
-4
-0.1
Jan 1 - Jun 28
-29.6% ▼
▲
9
▲
▲+3
Market
5.7
# of Deals per Bookrunner
4
Change in
5
▼
▼
0▼
-9
▼
207.2
▲
▼ 2.0
▼3.3
▼
3.5 1.57.7
+2 ▲
Top 10 Australian Equity & Equity-Related Deals (AU$m)
▼▼
-2.587.8
+0.8
-1.4
▲
▲
▲
-0.6▲
▲
▼
Morgan Stanley
Deals# of
10
▼
10.4▲
▲ 1.4
Share (%)
0.9
1.9
-23.8%58.2%
▼
*tie
2.7
-1.7
185.4
16
▼
14
Baillieu Holst LtdBell Financial Group Ltd
5.1
▼
2.3
Commonwealth Bank of Australia
206.1
40*15
Market
13.3
9.14
Proceeds
-0
▼
1.9
Manager
▼ ▲+1
Share (%)
▲
-3
+1
4.7
1.4
▲
7.5
-
4
2012 Rank
Macquarie Group
Share Ch.
968.82
Market
39.0
3.34.61.92.9
+4.18.25.0
Share Ch.
-0.7
▲
-1.9
+4.4
+0.9
▼
▼-2.6
5.9 +1.6
▲
▲
▼▼
▼
▲▼
▲▲
▼▲
▲
Fees40.622.7
+1.2
▼
0.0
Market
-7.9+0.8
Patersons Securities Ltd 150.7Moelis & Co
p
10111.317 2
Jan 1 - Jun 28 2013
Citi
$1,514.3
$1,383.6
$806.0
$663.7
$580.0
$403.8
$400.0
$351.5
$338.7
$264.2
National Australia Bank Ltd
Westpac Banking Corp
Aurizon Holdings Ltd
Westfield Retail Trust
Macquarie Group Ltd
Mirvac Group Ltd
Stockland Corp Ltd
Bank of Queensland Ltd
Virtus Health Pty Ltd
Echo Entertainment Group Ltd
3/20/2013
2/6/2013
3/16/2013
2/28/2013
5/14/2013
5/10/2013
5/22/2013
4/30/2013
5/16/2013
5/23/2013
https://www.thomsonone.comVisit http://dmi.thomsonreuters.com to view archives and order custom League Tables12
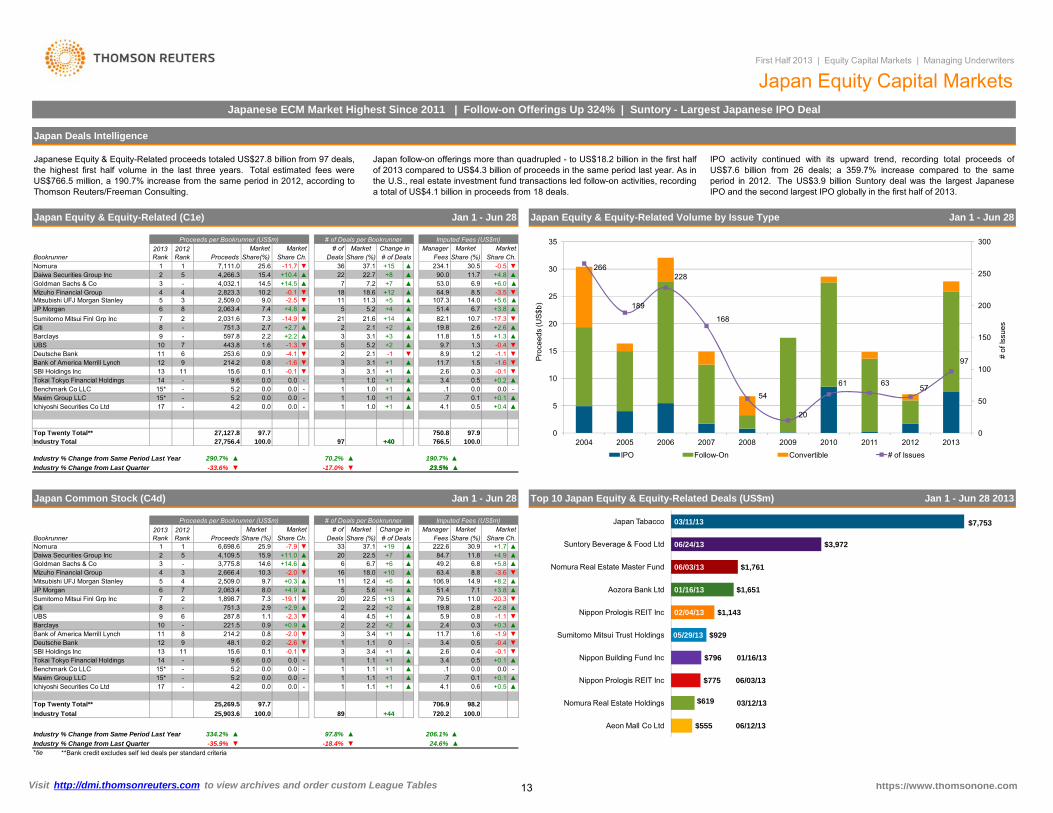
Japanese ECM Market Highest Since 2011 | Follow-on Offerings Up 324% | Suntory - Largest Japanese IPO Deal
Jan 1 - Jun 28 Jan 1 - Jun 28
+13
1+1
3.13.1 ▲
0 0 1 0▼▼
▲▼
3 43
+12.6
1.38.9
0 5
-1.1
+0 2-0.1
+2▲
▼
▲
▲ -1.61.5
▲
11.70.3
▲1.5 +1.3▲
1.2
11.89.7 ▼-0.4
▼
▼+2
2
▼
▲21.6
-1
+2.62.21.6
3 +32.6▲ 19.8
82.1▲
Share (%)
+12
21
11
▼ 10.7
11.35
▲
▲
▼30.5
14.0▼-3.5
+5.6
▲
▲
6.9
▲
-0.5234.1
▲ 107.38.5
11.7
64.9
▲+6.0
2.1-1.6
-1.3
▼
▼2-4.1
5.25
+4.8
-17.351.4 6.7 +3.8
▲
+4+14
18▼▼▲
2
-2.5
-14.9+4.8
3
214.29
7.32,031.6
253.6
2.7
8
-
10.22,509.0
7.4
597.8
2,063.4
▲
-0.19.0
+2.7+2.2
0 0
0.9
751.3
0.10.8
-
67 443.8
3.1
Mitsubishi UFJ Morgan Stanley 5
CitiSumitomo Mitsui Finl Grp Inc
Barclays
7
9
6JP Morgan
8
UBS
2.1
14 9 611 15.6
Bank of America Merrill LynchDeutsche Bank
12
Tokai Tokyo Financial Holdings
Nomura
Mizuho Financial Group
Daiwa Securities Group Inc7,111.0
Goldman Sachs & Co -4
2 5
4+77
1011
2,823.34,032.1 ▲
22.7 +87.23
4,266.3
Japan Equity & Equity-Related (C1e)
2012 Rank
Imputed Fees (US$m)Manager
# of Deals per Bookrunner
Japan Deals Intelligence
Fees
Japan Equity & Equity-Related Volume by Issue Type
Proceeds per Bookrunner (US$m)2013 Rank Share(%) Share Ch. Share Ch.Share (%) # of Deals
Market MarketBookrunner
Change in
1 1 +15▼
Market
5.2
18.6+5
SBI Holdings Inc 13
▲-11.7+10.4
14.5
-0.1
# ofDeals
22
Proceeds25.615.4
MarketMarket
+14.5 53.090.0
Japan Equity Capital Markets
▲36▲
37.1
Japan follow-on offerings more than quadrupled - to US$18.2 billion in the first halfof 2013 compared to US$4.3 billion of proceeds in the same period last year. As inthe U.S., real estate investment fund transactions led follow-on activities, recordinga total of US$4.1 billion in proceeds from 18 deals.
Japanese Equity & Equity-Related proceeds totaled US$27.8 billion from 97 deals,the highest first half volume in the last three years. Total estimated fees wereUS$766.5 million, a 190.7% increase from the same period in 2012, according toThomson Reuters/Freeman Consulting.
First Half 2013 | Equity Capital Markets | Managing Underwriters
IPO activity continued with its upward trend, recording total proceeds ofUS$7.6 billion from 26 deals; a 359.7% increase compared to the sameperiod in 2012. The US$3.9 billion Suntory deal was the largest JapaneseIPO and the second largest IPO globally in the first half of 2013.
266
189
228
168
61 63
97100
150
200
250
300
10
15
20
25
30
35
# of
Issu
es
Pro
ceed
s (U
S$b
)
**Bank credit excludes self led deals per standard criteria
1.0
▲20
2.2
3▼
▲
▲+1▲+1
-1
+0.5.7
0.0
0.0
2.9
1.1
2
1
1.1
0.0
4.1 0.6
766.5
0.0Maxim Group LLC 15*Ichiyoshi Securities Co Ltd 17 - 4.2 0.0 -
▲
5.2 0.0 0.0 - 1.1
3
12.4
0.8
15.6
4.1 0.5
70.2%
▲
▲ 190.7%
97.9
0.0 +0.4 ▲
Benchmark Co LLC 15* - 5.2 0.0
▲
5
15* - 5.2 0.0 0.0Ichiyoshi Securities Co Ltd 17 - 4.2 0.0
-
Industry Total
.7
27,756.4
Maxim Group LLC 0.1 +0.1 ▲
1 1.1
▼1.1
1-0.0
1
11
214.2- ▲
+4.92,063.42
221.5 0.9
▼6
8.0+0.3
1.1
169.7
10.3 -2.0▲
4
5
2013 Rank
3,775.84,109.52
Proceeds6,698.61
-
-17.0%
3320
Market
▼▲
Share Ch. Deals
Jan 1 - Jun 28
.1
+40+4097.7
97
1 1.0 +1
11.0
- 1
0.0 -0.0
1.0▲▲
+1
▲- 1 +1
3.4+1-
0.50.0 0.0
+0.2 ▲0.00.0
2,666.414.6
27,127.8
25.9
Proceeds per Bookrunner (US$m)
Share (%)1
-35.9% ▼Industry % Change from Same Period Last Year
Bank of America Merrill Lynch
Tokai Tokyo Financial Holdings 14
8
-
6JP Morgan
Deutsche Bank 1211
89
Citi
Barclays 10UBS
25,903.6
48.19
751.3
▲
-2.3
2,509.0
1,898.7Sumitomo Mitsui Finl Grp Inc 77
5Mitsubishi UFJ Morgan Stanley
SBI Holdings Inc-2.6
89
13
100.0
334.2%Industry % Change from Last Quarter*tie
Industry Total
11
3.4
0.09.6
▼0.1 -0.1
25,269.5 97.7
▲
287.82.2
▼
-18.4%
+6
-
▲
▼
Top Twenty Total**100.0
24.6%
706.9
▲▲206.1%
98.2
+1▲
97.8%
+1
+44 720.2
.10.1
▲
▲▲
+1
▲+1
▲- 0.5
▲ 79.5+13▲
+2
2.6
+2+1
0
5.92 2.8
4.54▲
0.3-1.9
▲
-3.6
Market
▼
+5.863.4
+6 ▲▲
+19Share (%)
Goldman Sachs & Co 3
Nomura22.5
2012 Rank
▲Share Ch.
+7
Share (%)
▲+4.9
30.9Fees
+2.8
1.6▲
▲▼
2.4 +0.3
5.2
+0.9-2.0
Jan 1 - Jun 28 2013
Imputed Fees (US$m)
+1.7# of Deals
-1.10.8
+3.8
▲+10
19.8
+8.2
-20.3+4 7.1
▲
# of
84.7
Japan Common Stock (C4d)
37.1
▲
# of Deals per BookrunnerMarket
6.718.0
Bookrunner
Industry % Change from Last Quarter
100.0
Industry % Change from Same Period Last Year
-14 9.6-15*
Manager
23.5%23.5%
Benchmark Co LLC
Top Twenty Total**
-33.6%
Change in
▼
▲
14.9
750.8
Market
222.6
49.2
100.0
11.86.8
51.4106.9
-
▲0.5
▼
11.0▲
-0.10.4
8.8▲▼
22.55.6
3.43.4
3.4 ▼
▼
11.7
+14.63
+11.0
+2.9
Daiwa Securities Group Inc
4
7.3
15.9
6
Mizuho Financial Group
Tokai Tokyo Financial Holdings
290.7%
▲
+0.1
-0.4▼
+0.1
▲
-
-19.1
0.2
-7.9
▼
Market
Top 10 Japan Equity & Equity-Related Deals (US$m)
$7,753
$3,972
$1,761
$1,651
$1,143
$929
$796
$775
$619
$555
03/11/13
06/24/13
06/03/13
01/16/13
02/04/13
05/29/13
01/16/13
06/03/13
03/12/13
06/12/13
Japan Tabacco
Suntory Beverage & Food Ltd
Nomura Real Estate Master Fund
Aozora Bank Ltd
Nippon Prologis REIT Inc
Sumitomo Mitsui Trust Holdings
Nippon Building Fund Inc
Nippon Prologis REIT Inc
Nomura Real Estate Holdings
Aeon Mall Co Ltd
54
20
61 63 57
0
50
0
5
10
2004 2005 2006 2007 2008 2009 2010 2011 2012 2013IPO Follow-On Convertible # of Issues
https://www.thomsonone.comVisit http://dmi.thomsonreuters.com to view archives and order custom League Tables 13
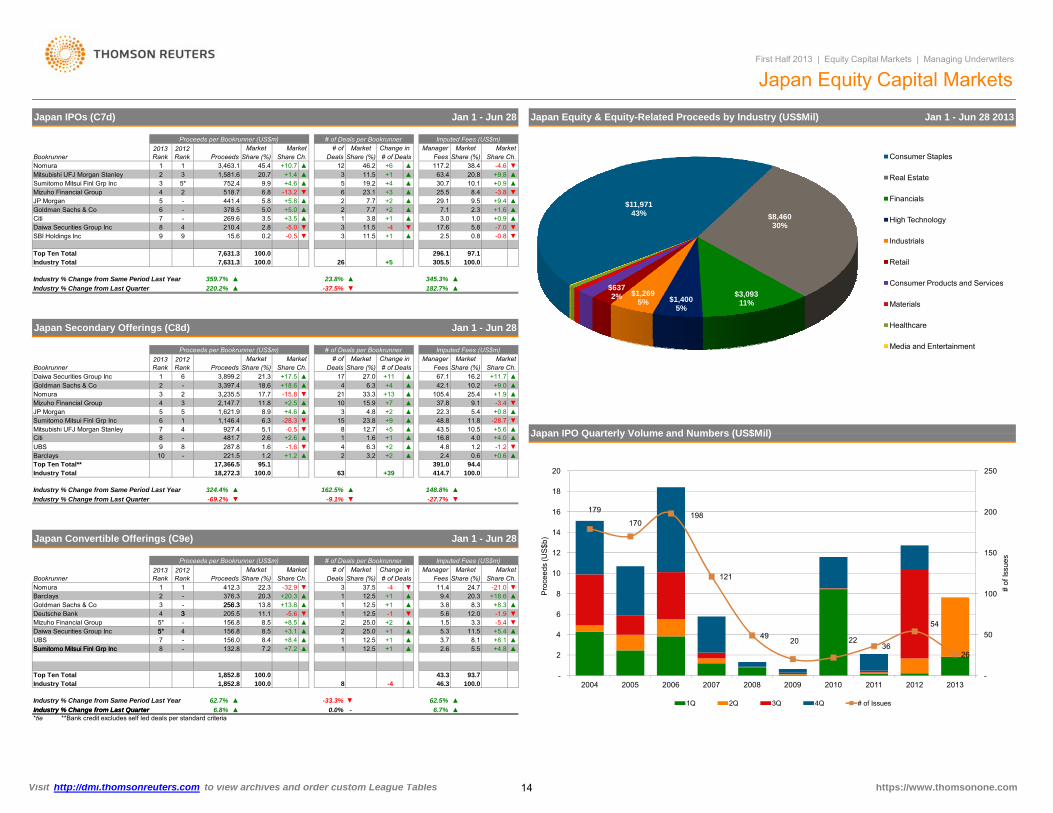
-0.8▼-7.0
97.1
345.3%
Market
▼23.8%
# of
17
# of Deals per BookrunnerMarket
Share (%)+11.7
Share (%)+11# of Deals
Change in Share Ch.
▲
Jan 1 - Jun 28
-37.5%
+5
+117.6
2.5-4
▲
26
+1.6
▲
▲▼
7.1
182.7%
100.0305.5
3.83
+0.91 +1 ▲ 3.05.81.0
2 7.7▲ ▲2
+2+9.4
▼+3 ▲+2 29.1
8.4▲
+9.8-4.638.4117.2
7.7
▲+0.9
23.19.5 ▲
19.2
FeesShare (%)
▲
46.263.4
▲11.5
▲
100.0
9 15.6
359.7%Industry % Change from Last Quarter
-0.5
7,631.3
378.5
210.49
23,463.1
2012 Rank
12
Proceeds per Bookrunner (US$m)# of
3
JP Morgan518.7
Market Market
1 45.4# of Deals
Japan IPOs (C7d)
3
Bookrunner
Mitsubishi UFJ Morgan Stanley +1.41,581.6 20.7+4.6
3.5
5* 752.4 9.9
269.6- +5.0
+5.8- 5.8
2.8-
441.45.0
+3.5
Share (%) Deals
Mizuho Financial Group 4
2013 Rank
1Proceeds
2 6.8 -13.2
Nomura
Citi
Sumitomo Mitsui Finl Grp Inc
8Daiwa Securities Group Inc 4
5
Proceeds per Bookrunner (US$m)
0.2
Market
100.0
Japan Secondary Offerings (C8d)
▲
SBI Holdings Inc
220.2%
# of Deals per Bookrunner
6
Top Ten Total
67
▲Share (%)
Market2013 Rank
▲27.0
Market
16.2Fees
Manager
67.1▲+17.521.33,899.2
296.1
▼0.8
2012 Rank
Industry Total
Bookrunner Share Ch. Deals
Share Ch.
+1 ▲
▲
Imputed Fees (US$m)
25.5 -3.8
▲2.3▲
+10.7
▲▲
5
▲
▲▼
3
Change in
▼▼
11.511.5-5.0
3
20.8
Market
10.1+4
Share (%)+6
▲30.7
Share Ch.▼
ManagerImputed Fees (US$m)
Jan 1 - Jun 28
MarketMarket
61Daiwa Securities Group Inc
Goldman Sachs & Co
Proceeds
7,631.3
Japan Equity & Equity-Related Proceeds by Industry (US$Mil)
Industry % Change from Same Period Last Year
Jan 1 - Jun 28 2013
Japan Equity Capital MarketsFirst Half 2013 | Equity Capital Markets | Managing Underwriters
$11,97143% $8,460
30%
$3,09311%$1,400
5%
$1,2695%
$6372%
$5082%$212
1%
$1621%
$460%
Consumer Staples
Real Estate
Financials
High Technology
Industrials
Retail
Consumer Products and Services
Materials
Healthcare
Media and Entertainment
**Bank credit excludes self led deals per standard criteria
▲
*tie
8
6.8% ▲62.7%
1,852.8
▼
46.3 100.0
Industry % Change from Last Quarter
93.7
Barclays
UBS -
▲62.5%
-443.3
▲▲
- 6.7%0.0%-33.3%
100.0100.0
1,852.8
8 ▲ 12.5+8.4
1 5.5+1 ▲ 3.7 8.1
8.5▲
+3.1 5.31 12.52 25.0 +1 ▲ 11.5
+1 2.6▲▲
+5.4 ▲
+4.8+8.1
7.2 +7.2
3.3▲ 1.55.6
8.5 +8.511.1 ▼
▲▼
8.33.8 ▲
25.02 +2 ▼-5.4
▲
1 -1
1 12.5+8.3
12.0 -1.9
9.411.4 24.73 37.5
20.3
12.5
▲
▼Fees
1▲ ▲+112.5
-4 ▼
3
-21.0
Manager MarketShare (%) Share Ch.Deals
▲ +18.6+1
132.8-
Japan Convertible Offerings (C9e)
Sumitomo Mitsui Finl Grp Inc
1
47
2
Daiwa Securities Group Inc
100.017,366.518,272.3
Industry % Change from Same Period Last Year
Industry % Change from Same Period Last Year
+39
Sumitomo Mitsui Finl Grp Inc
Proceeds per Bookrunner (US$m)Market
-9.1%Industry % Change from Last Quarter -69.2%
414.7391.0
100.094.4
▼
63
-27.7%▲ ▲148.8%▼
2.4
▲+2
▲ 0.6
10.5
4.8+1
▲+2
▲+5
-1.216.8
1.2
11.8+9
8.4
5*Mizuho Financial Group
-
Nomura
-
156.0
4156.8
+13.8205.5
120.3
▼
-32.9▲▼
256.33
156.8
-5.6
412.3
MarketChange in Imputed Fees (US$m)
▲
+20.3
+0.6
+4.043.5
# of Deals
# of Deals per Bookrunner
42.1
3
6.3
48.8
2012 Rank
15.9
Jan 1 - Jun 28
+2 ▲
33.3+7
105.4▲▲
9.125.4
+4
+0.8▼▲ 37.8 -3.4
5.4
+1.9
22.323.815
▼
JP Morgan
2
556.3
3,235.52
4
▲
12.7
4
+4.6-28.3
1
▼4.8
-15.8+18.6
21
5*
+2.6 ▲
95.1
▲+2.5
1,146.4
Share Ch.
▲
▲▲
+9.0+13
4 ▲
10
Share (%)
-28.7▲
Goldman Sachs & CoDeutsche Bank
▼
376.3-
5*
Bookrunner
10.2
+1.2
▼
▼
Proceeds
▲
▲
2.6
324.4%
221.5
84
1.6
Market# of
26.3
8
162.5%
1.6
11.8
1.2287.8
17.718.6
8.9
▲
Citi+5.6
4.05.1 -0.5
UBS3.2
▲-
Industry Total
Industry TotalTop Ten Total
Industry % Change from Last Quarter
2013 Rank
▼
Share (%)Market
16
481.7
-Barclays
Mizuho Financial Group1,621.92,147.7
3,397.43Nomura
-
Mitsubishi UFJ Morgan Stanley
Top Ten Total**
7
10
Sumitomo Mitsui Finl Grp Inc
Goldman Sachs & Co
3
9
927.4
8 -1.6
▼
3
256.3 13.8
22.3
Japan IPO Quarterly Volume and Numbers (US$Mil)
179
170 198
121
49 20 22
36
54
26
-
50
100
150
200
250
-
2
4
6
8
10
12
14
16
18
20
2004 2005 2006 2007 2008 2009 2010 2011 2012 2013
# of
Issu
es
Pro
ceed
s (U
S$b
)
1Q 2Q 3Q 4Q # of Issues
Visit http://dmi.thomsonreuters.com to view archives and order custom League Tables https://www.thomsonone.com14

-
-
-
-
-
-
-
Mark Moss
First Half 2013 | Equity Capital Markets | Managing Underwriters
Ranking Criteria Summary
Tel: +1 646.223.8416Ranie GuoAmericas
If you would like to participate in the submission process, receive quarterly press releases, or have questions about our full league table criteria please contact:
E-mail: [email protected]
All league tables are based on deal proceeds (total issue amount or number of shares multiplied by the issue price) unless otherwise stated. All data for the periods shown are as reflected in Thomson Reuters databases as of 9:00am EDT on June 28, 2013. Full credit is given to the bookrunner, equal if joint books. In cases of underwriter consolidation, credit is given to the surviving/parent firm.
Transactions must be received within 5 business days of pricing. (Rule 144a transactions sold exclusively in the US market, MBS, ABS transactions in all markets and all Federal Credit Agency transactions must be received within 5 business days of settlement.) Transactions not received by the applicable deadline are entered into the database but classified as rank ineligible and are not included in league tables for the current calendar year.
Database coverage includes domestic and international placements of equity offerings in addition to domestic and international equity-related transactions. This includes IPOs, follow-on offerings, accelerated bookbuilds and block trades (with certain restrictions) and convertible bonds.
Imputed fees are calculated using the Freeman Consulting proprietary algorithm where spreads or fees are not disclosed. Deal fees are on a gross basis before all expenses. Each underwriter or advisor isallocated its share of deal fees using the Freeman Consulting allocation methodology, based on the number of underwriters or advisors on the deal and their role. No fees are allocated to syndicated members.
League table volumes for Mitsubishi UFJ Financial Group and Morgan Stanley, included herein, reflect changes after the commencement of their jointly established securities firms in Japan: (1) Mitsubishi UFJ Morgan Stanley Securities and (2) Morgan Stanley MUFG Securities. Credit for the newly established joint ventures rolls up to Morgan Stanley. For Japanese involvement league tables Morgan Stanley will be represented as "Mitsubishi UFJ Morgan Stanley.
Convertible Bonds with a minimum life of less than 360 days are excluded. Minimum life defined as the difference between the settlement date and the earliest maturity date or first call/put option.
Non-US dollar denominated transactions are converted to the US dollar equivalent at the time of pricing.
Tel: +44.207.542.4631
EMEA
E-mail: [email protected]: +813.6441.1120
E-mail: [email protected]
Aki Sato
Michelle Abuzo
Japan
Tel: +632.858.7201
Asia-Pacific
E-mail: [email protected]
h // h
While Thomson Reuters has used reasonable endeavors to ensure that the information provided in this document is accurate and up to date as at the time of issue, neither Thomson Reuters nor its third party content providers shall be liable for any errors,inaccuracies or delays in the information, nor for any actions taken in reliance thereon, nor does it endorse any views or opinions of any third party content provider. Thomson Reuters disclaims all warranties, express or implied, as to the accuracy orcompleteness of any of the content provided, or as to the fitness of the content for any purpose to the extent permitted by law. The content herein is not appropriate for the purposes of making a decision to carry out a transaction or trade and does not provideany form of advice (investment, tax, legal) amounting to investment advice, nor make any recommendations or solicitations regarding particular financial instruments, investments or products, including the buying or selling of securities. Thomson Reuters hasnot undertaken any liability or obligation relating to the purchase or sale of securities for or by any person in connection with this document.
© 2013 Thomson Reuters. All rights reserved.
Thomson Reuters and the Thomson Reuters logo are registered trademarks and trademarks of Thomson Reuters and its affiliated companies. Any third party name or mark herein belongs to the relevant third party.
https://www.thomsonone.com
15

Thomson Reuters Solutions for the Deal Making Community
FOR INVESTMENT BANKERS
Thomson Reuters Advanced Analytics for deal making improves efficiency at every step, from screening and targeting, to comparables analysis, building league tables, valuing a company and developing a client pitch book. This set of analytical and presentation tools enables you to undertake all these key tasks without having to leave Microsoft Office®. You can also access our key content sets easily to support your analysis.
ThomsonONE.com Investment Banking is our flagship desktop solution that combines real-time market data and Reuters news with our world class reference data. It includes access to Recent Deals, Active Acquirers and M&A New Issues terms and conditions.
FOR JUNIOR BANKERS
SOLUTION FOR• Managing Client Relationships• Deal Origination• New Issues Pre-Marketing / Roadshows
• Financial Modeling• Customized League Tables • Simple Deals screening • Valuation analysis and comparable deal screening • Full integration into Microsoft Office® for on-brand pitch book creation
SOLUTION FOR
FOR INFORMATION PROFESSIONALS, MARKET DATA, RESEARCHSDC Platinum is the world’s foremost financial transactions database, covering new issues, M&A, syndicated loans, private equity, project finance, poison pills, and more.
• Market Analysis & Trends (Geography, Sector, Asset Class, Deal Type, Deal Size, etc.)• Deal Origination (Debt Maturity Analysis, Company Lifecycle including Private Equity)• Pitch Creation (Firm Credentials, Representative Acquirors)• M&A Targeting (Active Strategic/Sponsor Acquirors, Target Company Screener)• Negotiation (T&C Benchmarking)
Microsoft, Office, Word, Excel and PowerPoint are either registered trademarks or trademarks of Microsoft Corporation in the United States and/or other countries. Copyright 2013 Thomson Reuters. All rights reserved.
SOLUTION FOR
Access unique analysis for free anytime using Thomson ReutersDeals Intelligence website and receive regular updates,delivered direct to your inbox.Go to online.thomsonreuters.com/dealsintelligence
SOLUTION FOR
FOR STRATEGY AND PLANNING TEAMS
To purchase individual Thomson Reuters Deals or League Table reports,please contact our Thomson Reuters On Demand group:Web: http://financial.thomsonreuters.com/ondemandEmail: [email protected]
Send us a sales enquiry at: financial.thomsonreuters.com/salesRead more about our products at: financial.thomsonreuters.com/products
Thomson Reuters Deals Business Intelligence enables you to slice and dice our renowned Deals and Fees data to create ad hoc reports, analyze market trends, benchmark your performance and identify opportunities – all within a tool built into your workflow in Excel®, saving you valuable time and giving you a competitive edge.
• Conducting market analysis and identifying trends• Benchmarking your performance and monitoring competitors• Targeting clients by wallet size and banking relationship• Allocating resources more effectively by evaluating and analyzing lost deals
16