Global epidemiology of hepatitis B and hepatitis C in people who inject drugs: results of systematic...
15
Articles www.thelancet.com Published online July 28, 2011 DOI:10.1016/S0140-6736(11)61097-0 1 Published Online July 28, 2011 DOI:10.1016/S0140- 6736(11)61097-0 See Online/Comment DOI:10.1016/S0140- 6736(11)61132-X National Drug and Alcohol Research Centre, University of New South Wales, Sydney, NSW, Australia (P K Nelson MHSc, B M Mathers MBChB); Victorian Infectious Diseases Reference Laboratory, North Melbourne, VIC, Australia (B Cowie PhD); College of Nursing, New York University, New York, NY, USA (H Hagan PhD); Beth Israel Medical Center, New York, NY, USA (Prof D Des Jarlais PhD); Centre for Population Health, Burnet Institute, Melbourne, VIC, Australia (D Horyniak BBioMedSci, Prof L Degenhardt PhD); and Centre for Health Policy, Programs and Economics, School of Population Health, University of Melbourne, Melbourne, VIC, Australia (L Degenhardt) Correspondence to: Prof Louisa Degenhardt, Centre for Population Health, Burnet Institute, 85 Commercial Road, Melbourne, VIC 3004, Australia [email protected] Global epidemiology o hepatitis B and hepatitis C in people who inject drugs: results o systematic reviews Paul K Nelson, Bradley M Mathers, Benjamin Cowie, Holly Hagan, Don Des Jarlais, Danielle Horyniak, Louisa Degenhardt Summary Background Injecting drug use is an important risk actor or transmission o viral hepatitis, but detailed, transparent estimates o the scale o the issue do not exist. We estimated national, regional, and global prevalence and population size or hepatitis C virus (HCV) and hepatitis B virus (HBV) in injecting drug users (IDUs). Methods We systematically searched or data or HBV and HCV in IDUs in peer-reviewed databases (Medline, Embase, and PsycINFO), grey literature, conerence abstracts, and online resources, and made a widely distributed call or additional data. From 4386 peer-reviewed and 1019 grey literature sources, we reviewed 1125 sources in ull. We extracted studies into a customised database and graded them according to their methods. We included sero logical reports o HCV antibodies (anti-HCV), HBV antibodies (anti-HBc), or HBV surace antigen (HBsAg) in studies o IDUs with more than 40 participants (<100% HIV-positive) and sampling rames that did not exclude participants on the basis o age or sex. With endorsed decision rules, we calculated prevalence estimates with anti-HCV and a nti-HBc as proxies or exposure and HBsAg as proxy or current inection. We combined these estimates with IDU population sizes to calculate the number o IDUs with positive HBV or HCV statuses. Findings We located eligible reports with data or prevalence o anti-HCV in IDUs or 77 countries; midpoint prevalence estimates suggested 60–80% o IDUs had anti-HCV in 25 countries and more than 80% o IDUs did so in 12 countries. About 10·0 million (range 6·0–15·2) IDUs worldwide might be anti-HCV positive. China (1·6 million), USA (1·5 million), and Russia (1·3 million) had the largest such populations. We identied eligible HBsAg reports or 59 countries, with midpoint prevalence estimates o 5–10% in 21 countries and more than 10% in ten countries. Worldwide, we estimate 6·4 million IDUs are anti-HBc positive (2·3–9·7 million), and 1·2 million (0·3–2·7 million) are HBsAg positive. Interpretation More IDUs have anti-HCV than HIV inection, and viral hepatitis poses a key challenge to public health. Variation in the coverage and quality o existing research creates uncertainty around estimates. Improved and more complete data and reporting are needed to estimate the scale o the issue, which will inorm eforts to prevent and treat HCV and HBV in IDUs. Funding WHO and US National Institutes o Health (NIDA R01 DA018609). Introduction Injecting drug use is an important public health issue around the world: 16 million people injected drugs in 2007 (range 11–21 million). 1 Much o the estimated burden o disease attributable to the use o illicit drugs is probably due to blood-borne viral inections through unsae drug injection. 2 Hepatitis B and C viruses (HBV and HCV, respectively) are even more eciently spread by this practice than is HIV. 3 About 80% o individuals exposed to HCV develop chronic inection, 4 and 3–11% o people with chronic HCV inection will develop liver cirrhosis within 20 years, 5 with associated risks o liver ailure and hepatocellular carcinoma. 6 Transmission o HCV increasingly occurs through injecting drug use, 7 but in many developing countries unsae medical injections and transusions are predominant sources o inection. The emergence o injecting drug use is an additional threat in settings where the prevalence o HCV is high (eg, Arica, the Middle East, and southeast Asia). HBV is highly contagious through parenteral, sexual, and vertical (perinatal t ransmission) routes. About 5% o adults exposed to HBV develop chronic HBV inection; 4 most o the 350 million chronically inected people worldwide were inected in childhood. 8 Cirrhosis and death because o hepatocellular carcinoma are important sequelae o chronic HBV inection. 9 Despite the higher prevalence and transmissibility o viral hepatitis, the disease has received ar less global attention than has HIV. WHO called prevention and control eorts “successul but ragmented...[with no] comprehensive strategy or viral hepatitis”. 10 At WHO’s 63rd World Health Assembly in May, 2010, a resolution was passed to establish “goals and strategies or disease control, increasing education and promoting screening and treatment” 10 o people inected with HBV and HCV. WHO argues that injecting drug users (IDUs) are a key group that need to be specically targeted or prevention and treatment o viral hepatitis. 10 For such eorts to be appropriately scaled and targeted, policy makers and health-care proessionals need accurate and detailed data or the size o the population at risk, as exist or HIV. 1 There have been no global systematic reviews o HBV prevalence in IDUs. 11 Previous reviews o HCV in this
Transcript of Global epidemiology of hepatitis B and hepatitis C in people who inject drugs: results of systematic...

8/6/2019 Global epidemiology of hepatitis B and hepatitis C in people who inject drugs: results of systematic reviews
http://slidepdf.com/reader/full/global-epidemiology-of-hepatitis-b-and-hepatitis-c-in-people-who-inject-drugs 1/15
Articles
www.thelancet.com Published online July 28, 2011 DOI:10.1016/S0140-6736(11)61097-0 1
Published Online
July 28, 2011
DOI:10.1016/S0140-
6736(11)61097-0
See Online/Comment
DOI:10.1016/S0140-
6736(11)61132-X
National Drug and
Alcohol Research Centre,
University of New SouthWales, Sydney, NSW,
Australia (P K Nelson MHSc,
B M Mathers MBChB); Victorian
Infectious Diseases Reference
Laboratory, North Melbourne,
VIC, Australia (B Cowie PhD);
College of Nursing, New York
University, New York, NY, USA
(H Hagan PhD); Beth Israel
Medical Center, New York, NY,
USA (Prof D Des Jarlais PhD);
Centre for Population Health,
Burnet Institute,
Melbourne, VIC, Australia
(D Horyniak BBioMedSci,
Prof L Degenhardt PhD); and
Centre for Health Policy,Programs and Economics,
School of Population Health,
University of Melbourne,
Melbourne, VIC, Australia
(L Degenhardt)
Correspondence to:
Prof Louisa Degenhardt, Centre
for Population Health, Burnet
Institute, 85 Commercial Road,
Melbourne, VIC 3004, Australia
Global epidemiology o hepatitis B and hepatitis C in people
who inject drugs: results o systematic reviewsPaul K Nelson, Bradley M Mathers, Benjamin Cowie, Holly Hagan, Don Des Jarlais, Danielle Horyniak, Louisa Degenhardt
SummaryBackground Injecting drug use is an important risk actor or transmission o viral hepatitis, but detailed, transparentestimates o the scale o the issue do not exist. We estimated national, regional, and global prevalence and populationsize or hepatitis C virus (HCV) and hepatitis B virus (HBV) in injecting drug users (IDUs).
Methods We systematically searched or data or HBV and HCV in IDUs in peer-reviewed databases (Medline,Embase, and PsycINFO), grey literature, conerence abstracts, and online resources, and made a widely distributedcall or additional data. From 4386 peer-reviewed and 1019 grey literature sources, we reviewed 1125 sources in ull. We extracted studies into a customised database and graded them according to their methods. We included serological
reports o HCV antibodies (anti-HCV), HBV antibodies (anti-HBc), or HBV surace antigen (HBsAg) in studies o IDUs with more than 40 participants (<100% HIV-positive) and sampling rames that did not exclude participants onthe basis o age or sex. With endorsed decision rules, we calculated prevalence estimates with anti-HCV and anti-HBcas proxies or exposure and HBsAg as proxy or current inection. We combined these estimates with IDU populationsizes to calculate the number o IDUs with positive HBV or HCV statuses.
Findings We located eligible reports with data or prevalence o anti-HCV in IDUs or 77 countries; midpoint prevalenceestimates suggested 60–80% o IDUs had anti-HCV in 25 countries and more than 80% o IDUs did so in 12 countries.About 10·0 million (range 6·0–15·2) IDUs worldwide might be anti-HCV positive. China (1·6 million), USA (1·5 million),and Russia (1·3 million) had the largest such populations. We identied eligible HBsAg reports or 59 countries, withmidpoint prevalence estimates o 5–10% in 21 countries and more than 10% in ten countries. Worldwide, we estimate6·4 million IDUs are anti-HBc positive (2·3–9·7 million), and 1·2 million (0·3–2·7 million) are HBsAg positive.
InterpretationMore IDUs have anti-HCV than HIV inection, and viral hepatitis poses a key challenge to publichealth. Variation in the coverage and quality o existing research creates uncertainty around estimates. Improved and
more complete data and reporting are needed to estimate the scale o the issue, which will inorm eforts to preventand treat HCV and HBV in IDUs.
Funding WHO and US National Institutes o Health (NIDA R01 DA018609).
Introduction Injecting drug use is an important public health issuearound the world: 16 million people injected drugs in2007 (range 11–21 million).1 Much o the estimatedburden o disease attributable to the use o illicit drugs isprobably due to blood-borne viral inections throughunsae drug injection.2 Hepatitis B and C viruses (HBV
and HCV, respectively) are even more eciently spreadby this practice than is HIV.3
About 80% o individuals exposed to HCV developchronic inection,4 and 3–11% o people with chronicHCV inection will develop liver cirrhosis within20 years,5 with associated risks o liver ailure andhepatocellular carcinoma.6 Transmission o HCVincreasingly occurs through injecting drug use,7 but inmany developing countries unsae medical injectionsand transusions are predominant sources o inection.The emergence o injecting drug use is an additionalthreat in settings where the prevalence o HCV is high(eg, Arica, the Middle East, and southeast Asia).
HBV is highly contagious through parenteral, sexual,and vertical (perinatal transmission) routes. About 5% o
adults exposed to HBV develop chronic HBV inection; 4 most o the 350 million chronically inected peopleworldwide were inected in childhood.8 Cirrhosis anddeath because o hepatocellular carcinoma are importantsequelae o chronic HBV inection.9
Despite the higher prevalence and transmissibility o viral hepatitis, the disease has received ar less global
attention than has HIV. WHO called prevention andcontrol eorts “successul but ragmented...[with no]comprehensive strategy or viral hepatitis”.10 At WHO’s63rd World Health Assembly in May, 2010, a resolutionwas passed to establish “goals and strategies or diseasecontrol, increasing education and promoting screeningand treatment”10 o people inected with HBV and HCV.WHO argues that injecting drug users (IDUs) are a keygroup that need to be specically targeted or preventionand treatment o viral hepatitis.10 For such eorts to beappropriately scaled and targeted, policy makers andhealth-care proessionals need accurate and detailed dataor the size o the population at risk, as exist or HIV.1
There have been no global systematic reviews o HBVprevalence in IDUs.11 Previous reviews o HCV in this

8/6/2019 Global epidemiology of hepatitis B and hepatitis C in people who inject drugs: results of systematic reviews
http://slidepdf.com/reader/full/global-epidemiology-of-hepatitis-b-and-hepatitis-c-in-people-who-inject-drugs 2/15

8/6/2019 Global epidemiology of hepatitis B and hepatitis C in people who inject drugs: results of systematic reviews
http://slidepdf.com/reader/full/global-epidemiology-of-hepatitis-b-and-hepatitis-c-in-people-who-inject-drugs 3/15
Articles
www.thelancet.com Published online July 28, 2011 DOI:10.1016/S0140-6736(11)61097-0 3
that were reported here. Data were received, andclarication sought, until June, 2011.
Data extraction and selection We catalogued documents with Endnote X4. Figure 1shows the search process and fow chart. Two authors(PKN and DH) systematically screened search results.Studies in the HCV Synthesis Project18 database wereautomatically included. Other reerences were reviewed i the title or abstract suggested that the document hadrelevant inormation about the prevalence o HCV or HBVin IDUs. We reviewed 1125 documents (peer-reviewed andgrey literature) in ull. Data were regarded as eligible whenthe number or prevalence o hepatitis-inected IDUs in acountry or subnational area were mentioned.
We extracted inormation about study methods
(specimen type, eligibility criteria, recruitment andenrolment dates, and recruitment methods and locations),participant characteristics (age range and sex), and hepatitisreports (number o participants tested, number andproportion o patients who tested positive or anti-HCV,anti-HBc, and HBsAg, and reports broken down by ageand sex). Detailed methodological inormation was used tograde and select studies or inclusion because such studyinormation is thought to strongly infuence descriptivemethods.18 Extracted inormation was initially reviewed bytwo authors (PKN and DH), and valid reports wereincluded in a Microsot Access database and reviewed byanother author (LD). We graded data as shown in panel 1.
For this analysis, we selected the highest and lowestreports o every seromarker or every country in
accordance with the decision rules described in panel 2.These were entered into Microsot Excel by one author(LD) and independently reviewed by two others (PKNand BMM). Provisional reports were circulated to allauthors or review and comment. External checks weremade with specic requests to experts in countries i additional data or clarication were needed.
Data or prevalence o viral hepatitisExisting reports about HCV prevalence in IDUs are basedpredominantly on serological testing or anti-HCV. A
Panel 1: Classication system or assessment o
study designs
Grade A
Multisite seroprevalence study with multiple sample types
(eg, injecting drug users in outpatient drug-treatment
centres and in prisons)
Grade B
B1: Seroprevalence study, one sample type and multiple sites
B2: Seroprevalence study, multiple sample types and one site
Grade C
Seroprevalence study, one sample type
Grade D
Registration or notication o cases o hepatitis inection
Grade E
Prevalence study using sel-reported hepatitis status, saliva,
or RNA testing only
Ungraded
Report with other or unknown design
No hierarchical relationship was assumed between B1 and B2. Grades D and E and
ungraded data were not included in the estimates made in our report.
Panel 2: Decision rules or data selection and extraction processes
Selection, grading, and clarication o hepatitis reports
• HepatitisreportswererestrictedtoserologicaltestresultsforhepatitisCantibodies
(anti-HCV), hepatitis B core antibodies (anti-HBc), and hepatitis B surace
antigens (HBsAg)
• HepatitisBreportsthatdidnotspecifyaspecicserologicalmarkerwerereviewed
by BC (an inectious diseases physician) and assigned a serological marker or
excluded, as appropriate
• Ifhepatitisreportswereavailablefromthesamesample(s)andsamesite(s)inseveral
years, only the most recent report was selected
• Hepatitisreportsfromonecitywereassumedtobefromonesiteunlessotherwisestated
• Hepatitisreportswereassumedtobefromonesiteandonesampletypeunless
otherwise stated
• Ifcalculationortypographicalerrorsweredetectedinsourcedocuments,reportswere
recalculated and claried with authors when possible
Grade and date-based selection o reports
• IfgradeA(seepanel1)reportswereavailable,weselectedtherangeoftheseanddid
not select lower-graded reports; i recent reports (2000 onwards) were available, older
(beore 2000) reports were not selected
• IfgradeAreportswereunavailable,weselectedtherangeofrecentreportsofthenext
highest grade; older reports were selected i no recent reports were available
• RecentgradeBreportswereselectedinpreferencetooldergradeBreports;recent
grade C reports were selected in preerence to older grade B reports; older grade C
reports were selected i no grade B reports were available
• Reportsfrombefore1990wereselectedonlyifmorerecentreports
were unavailable
Exclusion criteria• Reportsfromcasenotications(gradeD),self-reportstudies(gradeE),orunspecied
methodologies (ungraded)
• Reportsofgeneticorsalivatesting,ortestingofresiduefromsyringes
• Reportsof100%HIVpositivesamplesfrominjectingdrugusers(IDUs)
• StudiesrestrictedtoyoungIDUs,andbaselinedescriptionsofstudiesofprimarily
hepatitis C virus (HCV)-negative or hepatitis B virus (HBV)-negative IDUs (some
seroincidence studies)
• ReportsfromstudiesexcludingIDUsofeithersexifmixedsexreportswereavailable
• ReportsofanyhepatitismarkerinIDUsthatwerelowerthanthegeneralpopulation
prevalence or that marker
• Reportsbasedontestresultsoffewerthan40IDUs
IDU prevalence reports and estimates
• Mathersandcolleagues1
detail the selection o IDU prevalence reports and generationo IDU estimates

8/6/2019 Global epidemiology of hepatitis B and hepatitis C in people who inject drugs: results of systematic reviews
http://slidepdf.com/reader/full/global-epidemiology-of-hepatitis-b-and-hepatitis-c-in-people-who-inject-drugs 4/15
Articles
4 www.thelancet.com Published online July 28, 2011 DOI:10.1016/S0140-6736(11)61097-0
Figure 2: Prevalence o hepatitis C antibodies in injecting drug users
No evidence of injecting drug useNo eligible report (74 countries)<40% (16 countries)40–<60% (24 countries)60–<80% (25 countries)≥80% (12 countries)
Prevalence o anti-HCV in injecting drug users (%) Prevalence o anti-HBc in injecting drug users (%) Prevalence o HBsAg in injecting drug users (%)
Report year Lower Mid Upper Grade Report year Lower Mid Upper Grade Report year Lower Mid Upper Grade
Eastern Europe
Armenia ·· ·· NK ·· ·· ·· ·· NK ·· ·· ·· ·· NK ·· ··
Azerbaijan ·· ·· NK ·· ·· ·· ·· NK ·· ·· ·· ·· NK ·· ··
Belarus ·· ·· NK ·· ·· ·· ·· NK ·· ·· ·· ·· NK ·· ··
Bosnia and
Herzegovina
·· ·· NK ·· ·· ·· ·· NK ·· ·· ·· ·· NK ·· ··
Bulgaria 2006, 2008 17·9 37·7 57·5 B1, B2 2003 ·· 6·0 ·· B2 2008, 2006 5·5 8·6 11·6 B2, B1
Croatia 2008, 2007 27·1 36·6 46 A 2008, 2007 7·5 13·8 20 A 2008, 2007 0·0 0·4 0·8 A
Czech Republic 2001*, 2002–03 20·8 25·3 29·7 A ·· ·· NK ·· ·· 2010 ·· 15·1 ·· C
Estonia 2002 ·· 90·5 ·· C 2004, 2007 76·8 81·0 85·1 C 2004 ·· 21·3 ·· C
Georgia 1997–98 ·· 58·2 ·· B1 1997–98 ·· 51·3 ·· A 2002–03 ·· 7·2 ·· A
Hungary 2008 ·· 22·6 ·· A ·· ·· NK ·· ·· 2008 ·· 0·5 ·· A
Latvia 2007 ·· 74·4 ·· C 2007 ·· 55·8 ·· C ·· ·· NK ·· ··
Lithuania 2005 85 89·4 93·7 B1, B2 ·· ·· NK ·· ·· 2005 9·5 11·2 12·9 B2, B1
Moldova 2007 ·· 42·7 ·· B1 ·· ·· NK ·· ·· ·· ·· NK ·· ··Poland 2005 43·7 53·9 64·0 A 2005 24·4 40·1 55·7 A 2005 1·2 4·9 8·5 A
Romania 2007, 2009 65·6 74·3 83 B2, B1 ·· ·· NK ·· ·· 2009, 2006 5 6·9 8·8 B1
Russia 2008 49 72·5 96 B1 2002 ·· 38·0 ·· C 2002 ·· 9·0 ·· C
Slovakia 2002 ·· 32·5 ·· C 2002 ·· 6·3 ·· C ·· ·· NK ·· ··
Ukraine 2005 60·9 67·0 73 C 2005 ·· 46·7 ·· C 2005 ·· 6·7 ·· C
Western Europe
Albania ·· ·· NK ·· ·· ·· ·· NK ·· ·· ·· ·· NK ·· ··
Andorra ·· ·· NK ·· ·· ·· ·· NK ·· ·· ·· ·· NK ·· ··
Austria 2008 ·· 47·1 ·· A 2008 ·· 19·0 ·· A ·· ·· NK ·· ··
Belgium 2008 27 55·0 82·7 B1, B2 2004, 2008 16·7 37·0 57·3 C 2008 1·9 3·0 4·0 B1
Denmark 1996 ·· 85·0 ·· B2 2007 ·· 65·0 ·· C 2007 ·· 1·3 ·· C
Finland 2007 20·7 21·1 21·4 B1 ·· ·· NK ·· ·· ·· ·· NK ·· ··
(Continues on next page)

8/6/2019 Global epidemiology of hepatitis B and hepatitis C in people who inject drugs: results of systematic reviews
http://slidepdf.com/reader/full/global-epidemiology-of-hepatitis-b-and-hepatitis-c-in-people-who-inject-drugs 5/15
Articles
www.thelancet.com Published online July 28, 2011 DOI:10.1016/S0140-6736(11)61097-0 5
positive anti-HCV test result can show acute, chronic, orresolved HCV inection. A PCR test is used to test orHCV viraemia, showing present inection; however, PCRtest results are rarely reported in epidemiological studies.Our review ocuses exclusively on reports o prevalenceo anti-HCV.
We included studies o HBV i they reportedserological testing or HBsAg or anti-HBc. HBsAgtesting shows active (either acute or chronic) inection,but about 95% o adults with acute HBV inection will
clear the virus, lose HBsAg and develop anti-HBc andhepatitis B surace antibodies (anti-HBs). However,clearance rates or HBV might be lower or IDUs thanthey are or the general population because more IDUsmight become chronically inected; this eect couldrelate to repeated exposure or lower immunity due toworse health and other viral inections.21 The presenceo anti-HBc shows previous exposure and is a moredurable marker than is presence o HBsAg. To clearlyestablish whether HBV inection was resolved orresulted in immunity, or to establish vaccination-relatedimmunity, the results o more than one test incombination would need to be assessed; however, thisduplicity is rarely available in population-scale or otherlarge epidemiological studies.
Data or prevalence o injecting drug useWe obtained prevalence data or injecting drug use andHIV rom a previously published systematic review by theReerence Group to the United Nations on HIV andInjecting Drug Use (herein termed the Reerence Groupreview),1 adhering to international guidelines or systematicreviews,22 with decision rules and estimates approved by allReerence Group members. During the course o asubsequent review o HIV prevention, treatment, and careor IDUs, updated prevalence data or some countries were
submitted to the Reerence Group.23 These data wereincluded in our analysis, together with more recent dataor injecting drug use and HIV prevalence reported byEMCDDA and Joint United Nations Programme onHIV/AIDS (UNAIDS). Overall, we included updatedestimates o IDU population size or Belarus, Brazil,Croatia, Cyprus, Czech Republic, Greece, Nepal,Philippines, and Ukraine and updated estimates o HIVprevalence or Croatia, Cyprus, Mauritius, Moldova,Norway, Pakistan, Portugal, Sierra Leone, Somalia,Swaziland, Togo, Ukraine, UK, and Zimbabwe.
Statistical analysis We used MapIno 10.0 to generate maps o prevalenceestimates or injecting drug use and hepatitis in IDUs.
Prevalence o anti-HCV in injecting drug users (%) Prevalence o anti-HBc in injecting drug users (%) Prevalence o HBsAg in injecting drug users (%)
Report year Lower Mid Upper Grade Report year Lower Mid Upper Grade Report year Lower Mid Upper Grade
(Continued rom previous page)
France 2006 ·· 73·8 ·· A 1995 26·9 41·6 56·2 C 1995, 1992 3·4 4·8 6·2 C
Germany 2001–03 ·· 75·0 ·· C 2001–03 ·· 53·0 ·· C 1994, 1992–93 6 7·2 8·4 B2
Greece 2008 44·9 50·2 55·5 A 2008 14·6 20·5 26·3 B1 2008 2·3 2·5 2·7 B2
Iceland 1990–93 ·· 63·0 ·· C ·· ·· NK ·· ·· ·· ·· NK ·· ··
Ireland 2003, 2001 72·3 74·6 76·9 C 2003 ·· 17·5 ·· B1 2003 ·· 0·0 ·· C
Italy 2000, 2005–07 72·9 81·1 89·3 B1 2000, 2005 39·8 55·1 70·4 B1 1992–93, 1990–91 0·9 5·1 9·3 C
Luxembourg 2005 ·· 81·3 ·· A 2005 ·· 24·7 ·· A 2005 ·· 3·9 ·· A
Macedonia ·· ·· NK ·· ·· ·· ·· NK ·· ·· ·· ·· NK ·· ··
Malta 2006 ·· 33·1 ·· B2 ·· ·· NK ·· ·· ·· ·· NK ·· ··
Monaco ·· ·· NK ·· ·· ·· ·· NK ·· ·· ·· ·· NK ·· ··
Montenegro 2008, 2005 22 37·8 53·6 C ·· ·· NK ·· ·· 2008 ·· 0 ·· C
Netherlands 2008 ·· 86·2 ·· A 1999 ·· 67·5 ·· A 2000 ·· 3·0 ·· A
Norway 2008 68·4 71·3 74·1 A 2008 ·· 41·0 ·· A 2008 ·· 1·2 ·· A
Portugal 2009 ·· 83·1 ·· B1 2000 ·· 53·7 ·· C 2009 ·· 2·9 ·· B1
San Marino ·· ·· NK ·· ·· ·· ·· NK ·· ·· ·· ·· NK ·· ··
Serbia 2008 45 57·0 69 C ·· ·· NK ·· ·· ·· ·· NK ·· ··
Slovenia 2002, 2008 21·0 21·7 22·3 B1 2008 ·· 4·2 ·· B1 2002 ·· 3·4 ·· B1
Spain 2003, 1999–2001 73·3 79·6 85·9 B1 2003 ·· 22·5 B1 2006 1·8 3·6 5·3 C
Sweden 2007 62·0 75·1 88·2 A 2006 ·· 52·1 ·· C 2006 ·· 2·3 ·· C
Switzerland 2002 ·· 78·3 ·· B1 2000–02 ·· 83·3 ·· C 1996 ·· 4 ·· C
UK 2004, 2009 47 50·5 54 A 2003–05 ·· 32 ·· A 1996–2000 0† 8·9 17·8 C
We identied no reports o injecting drug use or Liechtenstein. Estimates received or Scotland and Wales are not reported separately. Source documents or all gures listed in tables are shown in webappendix
pp 9–16. When more than one year or grade is shown, these are listed in order o the report they reer to (ie, lowest report rst. NK=although injecting drug use has been identied or injecting drug use prevalence
estimated,noeligiblereportofHCVorHBVininjectingdruguserswerelocated.HCV=hepatitisCvirus.HBV=hepatitisBvirus.*Publicationyearminus3(yearofestimatenotstated).†100%hepatitisAviruspositive.
Table 1: Prevalence o hepatitis C antibodies (anti-HCV), hepatitis B core antibodies (anti-HBc), and hepatitis B surace antigen (HBsAg) in injecting drug users in Europe

8/6/2019 Global epidemiology of hepatitis B and hepatitis C in people who inject drugs: results of systematic reviews
http://slidepdf.com/reader/full/global-epidemiology-of-hepatitis-b-and-hepatitis-c-in-people-who-inject-drugs 6/15
Articles
6 www.thelancet.com Published online July 28, 2011 DOI:10.1016/S0140-6736(11)61097-0
Ater collation o country-specic estimates, we derivedregional and global estimates or 2010. All authors reviewedthe estimates, and regional or country-specic querieswere made to experts when clarication was needed.Prevalence o injecting drug use was assumed to be thesame in 2010 as it was in the year o the estimate. We usedUN Population Division estimates to establish populationsizes o people aged 15–64 years in 2010.24 Regionalestimates were derived through estimation o region-specic, weighted estimates o the prevalence o injectingdrug use and hepatitis inection and uncertainty bounds,with methods previously endorsed by the Reerence Group1
(webappendix pp 6–8). We grouped regions on the basis o previous UNAIDS categories to ease comparisons with theReerence Group HIV review.1 We used Microsot Excel tocalculate prevalence estimates.
Role o the unding source The US National Institutes o Health supported the worko the HCV Synthesis Project, and the HIV department o WHO (Geneva, Switzerland) provided some unds tosupport our report. Sta rom WHO assisted with datacollection by circulating requests or data to WHO andother UN agency sta, and helped obtain access to reports
Prevalence o anti-HCV in injecting drug users (%) Prevalence o anti-HBc in injecting drug users (%) Prevalence o HBsAg in injecting drug users (%)
Report year Lower Mid Upper Grade Report year Lower Mid Upper Grade Report year Lower Mid Upper Grade
East and southeast Asia
Brunei ·· ·· NK ·· ·· ·· ·· NK ·· ·· ·· ·· NK ·· ··
Burma 2009 ·· 79·2 ·· B1 ·· ·· NK ·· ·· 2009 ·· 9·1 ·· B1
Cambodia ·· ·· NK ·· ·· ·· ·· NK ·· ·· ·· ·· NK ·· ··
China* 2010 60·9 67·0 73·1 B1 2002–03 ·· 36·5 ·· C 1999–2000 3·8 9·6 15·4 C
Indonesia 2007–09 ·· 77·3 ·· C 2007–09 ·· 57·6 ·· C 2007–09 ·· 2·9 ·· C
Japan 1993–94, 1993 55·0 64·8 74·5 C ·· ·· NK ·· ·· 1993–94, 1993 2·0 3·2 4·3 C
Laos ·· ·· NK ·· ·· ·· NK ·· ·· ·· ·· NK ·· ··
Malaysia 2006–07 ·· 67·1 ·· B1 ·· ·· NK ·· ·· ·· ·· NK ·· ··
Mongolia ·· ·· NK ·· ·· ·· NK ·· ·· ·· ·· NK ·· ··
Philippines 2002 ·· 70 ·· C ·· ·· NK ·· ·· ·· ·· NK ·· ··
Singapore 2005–06 ·· 42·5 ·· C ·· ·· NK ·· ·· 2005–06 ·· 8·5 ·· C
South Korea 2005 ·· 57 ·· C 2005 ·· 51 ·· C 1994–95 ·· 4·0 ·· C
Taiwan 2001 ·· 41 ·· B2 1984, 1986 11·3 50·7 90 C 2005 ·· 16·7 ·· C
Thailand 2000 ·· 89·8 ·· B2 1996 ·· 76·5 ·· C ·· ·· NK ·· ··
Timor Leste ·· ·· NK ·· ·· ·· NK ·· ·· ·· ·· NK ·· ··
Vietnam 2003 ·· 74·1 ·· B1 ·· ·· NK ·· ·· 1993 ·· 19·5 ·· B1
South Asia
Aghanistan 2008 ·· 36·0 ·· A ·· ·· NK ·· ·· 2008 ·· 5·8 ·· A
Bangladesh 1999–2005 ·· 48·2 ·· A 1996–97 ·· 31·8 ·· C 2002 ·· 9·4 ·· C
Bhutan ·· ·· NK ·· ·· ·· ·· NK ·· ·· ·· ·· NK ·· ··
India 2006 ·· 41·0 ·· B1 ·· ·· NK ·· ·· 2006 2·7 10·2 17·8 C
Iran 2007, 2001 34·5 50·2 65·9 B2 2001–02 ·· 61·2 ·· B2 2001, 2006–07 3·7 17·3 30·9 B2
Maldives ·· ·· NK ·· ·· ·· ·· NK ·· ·· ·· ·· NK ·· ··
Nepal 1997–2002, 1997 80·5 87·3 94·0 C 1993† ·· 82·0 ·· C 1996–97 5·5 5·8 6·0 C
Pakistan 2003–04 75·0 84·0 92·9 B1 ·· ·· NK ·· ·· 2004, 2003 6·0 6·8 7·5 C
Sri Lanka ·· ·· NK ·· ·· ·· ·· NK ·· ·· ·· ·· NK ·· ··
Central Asia
Kazakhstan 2005 ·· 58·8 ·· C 2002 ·· 79·5 ·· A 2002 ·· 7·9 ·· A
Kyrgyzstan ·· ·· NK ·· ·· ·· ·· NK ·· ·· ·· ·· NK ·· ··
Tajikistan 2004 ·· 61·3 ·· C ·· ·· NK ·· ·· ·· ·· NK ·· ··
Turkmenistan ·· ·· NK ·· ·· ·· ·· NK ·· ·· ·· ·· NK ·· ··
Uzbekistan 2001 ·· 51·7 ·· A ·· ·· NK ·· ·· ·· ·· NK ·· ··
We identied no reports o injecting drug use or North Korea. Source documents or all gures listed in tables are shown in webappendix pp 9–16. When more than one year or grade is shown, these are listed
in order o the report they reer to (ie, lowest report rst). NK=although injecting drug use has been identied or i njecting drug use prevalence estimated, no eligible report o HCV or HBV in i njecting drug users
were located. HCV=hepatitis C virus. HBV=hepatitis B vir us. *A systematic review and meta-analysis by Xia and colleagues45 was not included here as the source documents were in Chinese and could not be
veried.Inthatreview,thepooledprevalencewas61·4%(IQR55·7–67·2)across53ChineseandtwoEnglishlanguagemultiregionstudiesofHCVininjectingdrugusersinChina.†Publicationyearminus3
(year o estimate not stated).
Table 2: Prevalence o hepatitis C antibodies (anti-HCV), hepatitis B core antibodies (anti-HBc), and hepatitis B surace antigen (HBsAg) among injecting drug users in Asia

8/6/2019 Global epidemiology of hepatitis B and hepatitis C in people who inject drugs: results of systematic reviews
http://slidepdf.com/reader/full/global-epidemiology-of-hepatitis-b-and-hepatitis-c-in-people-who-inject-drugs 7/15
Articles
www.thelancet.com Published online July 28, 2011 DOI:10.1016/S0140-6736(11)61097-0 7
that might have had data o use or this report. Thesponsors o the study had no role in study design, data
analysis, data interpretation, or writing o the report. Allauthors made decisions on analysis, write up,interpretation o results, and submission o themanuscript or publication.
Results We identied eligible reports on anti-HCV in IDUs or77 o the 152 countries or territories where injecting druguse has been reported (gure 2, tables 1–5, webappendixpp 9–16); these 77 countries hold 82% o the world’sestimated population o IDUs. Anti-HCV prevalencevaried greatly: midpoint reports ranged rom 9·8% to97·4% (tables 1–5).19,20 Anti-HCV prevalence was 60–80%in IDUs in 25 countries, and 80% or higher in aurther 12. The countries with the largest estimated
populations o IDUs were China (midpoint estimate67·0%), Russia (72·5%), and the USA (73·4%; tables 1–3).
No studies were located or Caribbean countries orPacic Island states and territories (table 3 and table 4).
HBV exposure (anti-HBc positive) was measured in43 countries, accounting or 65% o the world’s populationo IDUs (webappendix p 17). Rates varied widely betweencountries, rom 4·2% in Slovenia to 85·0% in Mexico(tables 1–5). Prevalence o HBsAg was measured in59 countries, accounting or 73% o the world’s populationo IDUs (gure 3, tables 1–5). The highest rates o HBsAgwere in countries (mostly in Asia) that have endemicHBV in the general population. HBsAg prevalencereports in IDUs varied substantially within countries; orexample, prevalence reports o HBsAg ranged rom 3·5%to 20·0% in the USA and 3·7% to 30·9% in Iran (table 3and table 4).
Prevalence o anti-HCV in injecting drug users (%) Prevalence o anti-HBc in injecting drug users (%) Prevalence o HBsAg in injecting drug users (%)
Report year Lower Mid Upper Grade Report year Lower Mid Upper Grade Report year Lower Mid Upper Grade
Caribbean*
Bahamas ·· ·· NK ·· ·· ·· ·· NK ·· ·· ·· ·· NK ·· ··
Bermuda ·· ·· NK ·· ·· ·· ·· NK ·· ·· ·· ·· NK ·· ··
Dominican
Republic
·· ·· NK ·· ·· ·· ·· NK ·· ·· ·· ·· NK ·· ··
Haiti ·· ·· NK ·· ·· ·· ·· NK ·· ·· ·· ·· NK ·· ··
Jamaica ·· ·· NK ·· ·· ·· ·· NK ·· ·· ·· ·· NK ·· ··
Latin America
Argentina 2000–01 ·· 54·6 ·· B1 ·· ·· NK ·· ·· 2000–01 ·· 8·6 ·· B1
Bolivia ·· ·· NK ·· ·· ·· ·· NK ·· ·· ·· ·· NK ·· ··
Brazil 2000–01 ·· 63·9 ·· B1 1994–96 ·· 55·8 ·· B2 2000 ·· 2·3 ·· C
Chile ·· ·· NK ·· ·· ·· ·· NK ·· ·· ·· ·· NK ·· ··
Colombia ·· ·· NK ·· ·· ·· ·· NK ·· ·· ·· ·· NK ·· ··
Costa Rica ·· ·· NK ·· ·· ·· ·· NK ·· ·· ·· ·· NK ·· ··
Ecuador ·· ·· NK ·· ·· ·· ·· NK ·· ·· ·· ·· NK ·· ··
El Salvador ·· ·· NK ·· ·· ·· ·· NK ·· ·· ·· ·· NK ·· ··
Guatemala ·· ·· NK ·· ·· ·· ·· NK ·· ·· ·· ·· NK ·· ··
Honduras ·· ·· NK ·· ·· ·· ·· NK ·· ·· ·· ·· NK ·· ··
Mexico 2005 96 97·4 98·7 B1 2005 ·· 85·0 ·· B1 ·· ·· NK ·· ··
Nicaragua ·· ·· NK ·· ·· ·· ·· NK ·· ·· ·· ·· NK ·· ··
Panama ·· ·· NK ·· ·· ·· ·· NK ·· ·· ·· ·· NK ·· ··
Paraguay 2006 ·· 9·8 ·· C ·· ·· NK ·· ·· ·· ·· NK ·· ··
Peru ·· ·· NK ·· ·· ·· ·· NK ·· ·· ·· ·· NK ·· ··
Suriname ·· ·· NK ·· ·· ·· ·· NK ·· ·· ·· ·· NK ·· ··
Uruguay 2003 ·· 21·9 ·· C 2003 ·· 19·6 ·· C 2003 ·· 4·5 ·· C
Venezuela ·· ·· NK ·· ·· ·· ·· NK ·· ·· ·· ·· NK ·· ··North America
Canada 2005–08 51 64 77 A ·· ·· NK ·· ·· ·· ·· NK ·· ··
USA 2002–04, 2001 69·7 73·4 77 B2 2002–04 ·· 22·6 ·· A 1992 3·5 11·8 20 B1, B2
We identied no reports o injecting drug use or Anguilla, Antigua and Barbuda, Aruba, Barbados, British Virgin Islands, Cayman Islands, Cuba, Dominica, Grenada, Guadaloupe, Martinique, Montserrat,
Netherlands Antilles, Saint Kitts and Nevis, Saint Lucia, Saint Vincent and Grenadines, Trinidad and Tobago, and Turks and Caicos Islands in the Caribbean, and Belize, Falkland Islands, and Guyana in Latin
America. Source documents or all gures listed in tables are shown in webappendix pp 9–16. When more than one year or grade is shown, these are listed in order o the report they reer to (ie, lowest report
rst. NK=although injecting drug use has been identied or injecting drug use prevalence estimated, no eligible report o HCV or HBV in injecting drug users were located. HCV=hepatitis C virus. HBV=hepatitis B
virus.*AstudyinSanJuan,PuertoRicoreported89%HCVprevalence.46
Table 3: Prevalence o hepatitis C antibodies (anti-HCV), hepatitis B core antibodies (anti-HBc), and hepatitis B surace antigen (HBsAg) in injecting drug users in the Americas
8/6/2019 Global epidemiology of hepatitis B and hepatitis C in people who inject drugs: results of systematic reviews
http://slidepdf.com/reader/full/global-epidemiology-of-hepatitis-b-and-hepatitis-c-in-people-who-inject-drugs 8/15
Articles
8 www.thelancet.com Published online July 28, 2011 DOI:10.1016/S0140-6736(11)61097-0
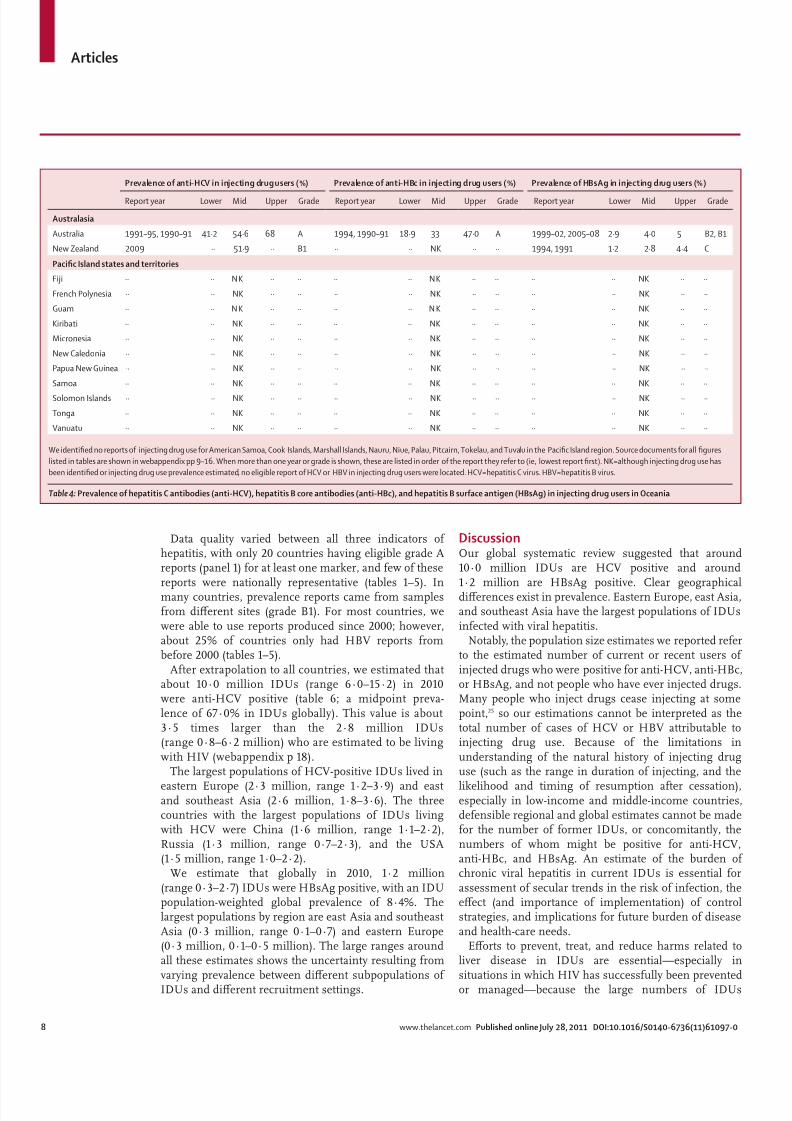
Data quality varied between all three indicators o hepatitis, with only 20 countries having eligible grade Areports (panel 1) or at least one marker, and ew o thesereports were nationally representative (tables 1–5). Inmany countries, prevalence reports came rom samplesrom dierent sites (grade B1). For most countries, wewere able to use reports produced since 2000; however,about 25% o countries only had HBV reports rombeore 2000 (tables 1–5).
Ater extrapolation to all countries, we estimated thatabout 10·0 million IDUs (range 6·0–15·2) in 2010were anti-HCV positive (table 6; a midpoint preva-lence o 67·0% in IDUs globally). This value is about3·5 times larger than the 2·8 million IDUs(range 0·8–6·2 million) who are estimated to be livingwith HIV (webappendix p 18).
The largest populations o HCV-positive IDUs lived in
eastern Europe (2·3 million, range 1·2–3·9) and eastand southeast Asia (2·6 million, 1·8–3·6). The threecountries with the largest populations o IDUs livingwith HCV were China (1·6 million, range 1·1–2·2),Russia (1·3 million, range 0·7–2·3), and the USA(1·5 million, range 1·0–2·2).
We estimate that globally in 2010, 1·2 million(range 0·3–2·7) IDUs were HBsAg positive, with an IDUpopulation-weighted global prevalence o 8·4%. Thelargest populations by region are east Asia and southeastAsia (0·3 million, range 0·1–0·7) and eastern Europe(0·3 million, 0·1–0·5 million). The large ranges aroundall these estimates shows the uncertainty resulting romvarying prevalence between dierent subpopulations o IDUs and dierent recruitment settings.
Discussion Our global systematic review suggested that around10·0 million IDUs are HCV positive and around1·2 million are HBsAg positive. Clear geographicaldierences exist in prevalence. Eastern Europe, east Asia,and southeast Asia have the largest populations o IDUsinected with viral hepatitis.
Notably, the population size estimates we reported reerto the estimated number o current or recent users o injected drugs who were positive or anti-HCV, anti-HBc,or HBsAg, and not people who have ever injected drugs.Many people who inject drugs cease injecting at somepoint,25 so our estimations cannot be interpreted as thetotal number o cases o HCV or HBV attributable toinjecting drug use. Because o the limitations inunderstanding o the natural history o injecting druguse (such as the range in duration o injecting, and the
likelihood and timing o resumption ater cessation),especially in low-income and middle-income countries,deensible regional and global estimates cannot be madeor the number o ormer IDUs, or concomitantly, thenumbers o whom might be positive or anti-HCV,anti-HBc, and HBsAg. An estimate o the burden o chronic viral hepatitis in current IDUs is essential orassessment o secular trends in the risk o inection, theeect (and importance o implementation) o controlstrategies, and implications or uture burden o diseaseand health-care needs.
Eorts to prevent, treat, and reduce harms related toliver disease in IDUs are essential—especially insituations in which HIV has successully been preventedor managed—because the large numbers o IDUs
Prevalence o anti-HCV in injecting drug users (%) Prevalence o anti-HBc in injecting drug users (%) Prevalence o HBsAg in injecting drug users (%)
Report year Lower Mid Upper Grade Report year Lower Mid Upper Grade Report year Lower Mid Upper Grade
Australasia
Australia 1991–95, 1990–91 41·2 54·6 68 A 1994, 1990–91 18·9 33 47·0 A 1999–02, 2005–08 2·9 4·0 5 B2, B1
New Zealand 2009 ·· 51·9 ·· B1 ·· ·· NK ·· ·· 1994, 1991 1·2 2·8 4·4 C
Pacic Island states and territories
Fiji ·· ·· NK ·· ·· ·· ·· NK ·· ·· ·· ·· NK ·· ··
French Polynesia ·· ·· NK ·· ·· ·· ·· NK ·· ·· ·· ·· NK ·· ··
Guam ·· ·· N K ·· ·· ·· ·· N K ·· ·· ·· ·· NK ·· ··
Kiribati ·· ·· NK ·· ·· ·· ·· NK ·· ·· ·· ·· NK ·· ··
Micronesia ·· ·· NK ·· ·· ·· ·· NK ·· ·· ·· ·· NK ·· ··
New Caledonia ·· ·· NK ·· ·· ·· ·· NK ·· ·· ·· ·· NK ·· ··
Papua New Guinea ·· ·· NK ·· ·· ·· ·· NK ·· ·· ·· ·· NK ·· ··
Samoa ·· ·· NK ·· ·· ·· ·· NK ·· ·· ·· ·· NK ·· ··
Solomon Islands ·· ·· NK ·· ·· ·· ·· NK ·· ·· ·· ·· NK ·· ··
Tonga ·· ·· NK ·· ·· ·· ·· NK ·· ·· ·· ·· NK ·· ··
Vanuatu ·· ·· NK ·· ·· ·· ·· NK ·· ·· ·· ·· NK ·· ··
We identied no reports o injecting drug use or American Samoa, Cook Islands, Marshall Islands, Nauru, Niue, Palau, Pitcairn, Tokelau, and Tuvalu in the Pacic Island region. Source documents or all gures
listed in tables are shown in webappendix pp 9–16. When more than one year or grade is shown, these are listed in order o the report they reer to (ie, lowest report rst). NK=although injecting drug use has
been identied or injecting drug use prevalence estimated, no eligible report o HCV or HBV in injecting drug users were located. HCV=hepatitis C virus. HBV=hepatitis B virus.
Table 4: Prevalence o hepatitis C antibodies (anti-HCV), hepatitis B core antibodies (anti-HBc), and hepatitis B surace antigen (HBsAg) in injecting drug users in Oceania

8/6/2019 Global epidemiology of hepatitis B and hepatitis C in people who inject drugs: results of systematic reviews
http://slidepdf.com/reader/full/global-epidemiology-of-hepatitis-b-and-hepatitis-c-in-people-who-inject-drugs 9/15
Articles
www.thelancet.com Published online July 28, 2011 DOI:10.1016/S0140-6736(11)61097-0 9
inected with HCV and signicant morbidity resultingrom this inection mean that the health and economiccosts o HCV transmitted by injecting drug use might beas high as (or higher than) those o HIV. Nonetheless,HCV treatment is underused.10 Part o the reason or this
neglect is the high cost, which will remain a substantialbarrier to increasing o treatment coverage in low-resource settings until costs are reduced. There isincreasing attention on this issue among internationalgroups who are advocating or cost reductions, generic
Prevalence o anti-HCV in injecting drug users (%) Prevalence o anti-HBc in injecting drug users (%) Prevalence o HBsAg in injecting drug users (%)
Report year Lower Mid Upper Grade Report year Lower Mid Upper Grade Report year Lower Mid Upper Grade
Middle East and North Arica
Algeria ·· ·· NK ·· ·· ·· ·· NK ·· ·· ·· ·· NK ·· ··
Bahrain ·· ·· NK ·· ·· ·· ·· NK ·· ·· ·· ·· NK ·· ··
Cyprus 2008 29·2 39·6 50·0 C ·· ·· NK ·· ·· 2008 ·· 0·0 ·· C
Egypt 1989–91, 1995 35·8 49·4 63·0 C 1989–91, 1995 53·6 57·8 62·0 C 1989–91, 1995 10·9 13·5 16·0 C
Iraq ·· ·· NK ·· ·· ·· ·· NK ·· ·· ·· ·· NK ·· ··
Israel 2001–03* ·· 67·6 ·· C 1988–89, 1986 26·0 39·0 52·0 C 1988–89, 1986 0·0 2·8 5·5 C
Jordan ·· ·· NK ·· ·· ·· ·· NK ·· ·· ·· ·· NK ·· ··
Kuwait ·· ·· NK ·· ·· ·· ·· NK ·· ·· ·· ·· NK ·· ··
Lebanon 2000–02, 2007–08 5·0 28·9 52·8 C ·· ·· NK ·· ·· 2000–02, 2007–08 0 2·5 5 C
Libya ·· ·· NK ·· ·· ·· ·· NK ·· ·· ·· ·· NK ·· ··
Morocco ·· ·· NK ·· ·· ·· ·· NK ·· ·· ·· ·· NK ·· ··
Palestine 2007* ·· 45·3 ·· C ·· ·· NK ·· ·· 2007* ·· 6·4 ·· C
Oman ·· ·· NK ·· ·· ·· ·· NK ·· ·· ·· ·· NK ·· ··
Qatar ·· ·· NK ·· ·· ·· ·· NK ·· ·· ·· ·· NK ·· ··
Saudi Arabia 2002, 2003–06 14·1 49·8 85·4 C ·· ·· NK ·· ·· 1992–93 ·· 18·5 ·· C
Sudan ·· ·· NK ·· ·· ·· ·· NK ·· ·· ·· ·· NK ·· ··
Syria 1999* ·· 60·5 ·· C 1999* ·· 28·9 ·· C ·· ·· NK ·· ··
Tunisia ·· ·· NK ·· ·· ·· ·· NK ·· ·· ·· ·· NK ·· ··
Turkey 2009 ·· 28·9 ·· B1 ·· ·· NK ·· ·· 2009 ·· 5·2 ·· B1
UAE ·· ·· NK ·· ·· ·· ·· NK ·· ·· ·· ·· NK ·· ··
Yemen ·· ·· NK ·· ·· ·· ·· NK ·· ·· ·· ·· NK ·· ··
Sub-Saharan Arica
Côte d'Ivoire ·· ·· NK ·· ·· ·· ·· NK ·· ·· ·· ·· NK ·· ··
Djibouti ·· ·· NK ·· ·· ·· ·· NK ·· ·· ·· ·· NK ·· ··
Gabon ·· ·· NK ·· ·· ·· ·· NK ·· ·· ·· ·· NK ·· ··
Ghana 2004–05 ·· 40·1 ·· B1 ·· ·· NK ·· ·· ·· ·· NK ·· ··
Kenya 2000 42·2 51·4 60·6 B1, B2 ·· ·· NK ·· ·· 2000 ·· 6·4 ·· B2
Malawi ·· ·· NK ·· ·· ·· ·· NK ·· ·· ·· ·· NK ·· ··
Mauritius 2009 ·· 97·3 ·· B1 ·· ·· NK ·· ·· 2009 ·· 9·0 ·· B1
Nigeria ·· ·· NK ·· ·· ·· ·· NK ·· ·· ·· ·· NK ·· ··
Senegal ·· ·· NK ·· ·· ·· ·· NK ·· ·· ·· ·· NK ·· ··
Sierra Leone ·· ·· NK ·· ·· ·· ·· NK ·· ·· ·· ·· NK ·· ··
South Arica ·· ·· NK ·· ·· ·· ·· NK ·· ·· ·· ·· NK ·· ··
Swaziland ·· ·· NK ·· ·· ·· ·· NK ·· ·· ·· ·· NK ·· ··
Tanzania 2007 ·· 22·2 ·· C ·· ·· NK ·· ·· 2007 ·· 3·8 ·· C
Togo ·· ·· NK ·· ·· ·· ·· NK ·· ·· ·· ·· NK ·· ··
Uganda ·· ·· NK ·· ·· ·· ·· NK ·· ·· ·· ·· NK ·· ··
Zambia ·· ·· NK ·· ·· ·· ·· NK ·· ·· ·· ·· NK ·· ··
Zimbabwe ·· ·· NK ·· ·· ·· ·· NK ·· ·· ·· ·· NK ·· ··
We identied no reports o injecting drug use or Angola, Benin, Botswana, Burkina Faso, Burundi, Cameroon, Cape Verde, Central Arican Republic, Chad, Comoros, Democratic Republic o Congo, Equatorial
Guinea, Eritrea, Ethiopia, The Gambia, Guinea, Guinea-Bissau, Lesotho, Liberia, Madagascar, Mali, Mauritania, Mozambique, Namibia, Niger, Republic o the Co ngo, Rwanda, São Tomé and Príncipe, Seychelles,
and Somalia. Source documents or all gures listed in tables are shown in webappendix pp 9–16. When more than one year or grade is shown, these are listed in order o the report they reer to (ie, lowest
report rst). NK=although injecting drug use has been identied or injecting drug use prevalence estimated, no eligible report o HCV or HBV in injecting drug users were located. HCV=hepatitis C virus.
HBV=hepatitis B virus. UAE=United Arab Emirates. *Publication year minus 3 (year o estimate not stated).
Table 5: Prevalence o hepatitis C antibodies (anti-HCV), hepatitis B core antibodies (anti-HBc), and hepatitis B surace antigen (HBsAg) in injecting drug users in the Middle East and Arica

8/6/2019 Global epidemiology of hepatitis B and hepatitis C in people who inject drugs: results of systematic reviews
http://slidepdf.com/reader/full/global-epidemiology-of-hepatitis-b-and-hepatitis-c-in-people-who-inject-drugs 10/15
Articles
10 www.thelancet.com Published online July 28, 2011 DOI:10.1016/S0140-6736(11)61097-0
manuacturing, and changes to licensing conditions.10,26 Not long ago, the high cost o HIV antiretroviralssimilarly prevented access in high prevalence, low-income countries: in recognition o this barrier, there aregrowing eorts to bring viral hepatitis treatments intothe same (lower cost) access ramework as HIV anti-retrovirals.10 Nonetheless, another barrier is the toxiceects o HCV treatment, although a large number o new HCV drugs are in development that will revolutioniseHCV treatment in the next ew years.27
More attention needs to be paid to reduction o theeect o other causes o progression o liver disease inpeople who are chronically inected with viral hepatitis.This attention includes addressing problems o alcoholuse, and provision o HAV and HBV vaccination,particularly because liver-related disease will become a
main cause o mortality as IDUs get older.28
Evidence about the eect o needle and syringeprogrammes29 and provision o other injection equipmenton prevention o HCV inection is scarce, but reductiono risk is paramount, particularly during the period o initiation to injecting when incidence o HCV ishighest.6,14 The potential or HCV treatment to reduceHCV prevalence in IDU populations and thereorereduce the orce o inection acting on susceptiblemembers o these populations has been supported bymathematical modelling.30 This potential role o HCVtreatment in the prevention o HCV transmission in IDUpopulations warrants urther investigation.
Although we noted substantial variability in HBsAgprevalence reports, prevalence typically mirrored the
dierences in the rate o HBV inection in the generalpopulation. In countries with a low-intermediate rate,the prevalence o HBsAg in IDUs was typically lessthan 10%, whereas in countries with a high rate o HBVinection, prevalence o HBsAg in IDUs was around10–20% (eg, east Asia and southeast Asia). Because o the high rate o chronic HCV inection in IDUs, HBVinection is particularly likely to show HBV and HCV co-inection, which is associated with more rapid pro-gression o liver disease and attendant mortality;31 thisoutcome is similarly the case or co-inection betweenHIV and viral hepatitis.32
Eective treatments or chronic HBV inection areavailable, which reduce progression o liver disease andcomplications such as hepatocellular carcinoma.33 How-ever, antiviral therapy or chronic HBV inection is oten
o indenite duration, and access to modern, potentdrugs with high resistance barriers is restricted in manyhigh-prevalence, low-resource settings. Barriers to acces-sing treatment and care or chronic HBV inection resultin poor outcomes or those aected, and ongoingtransmission to susceptible contacts.
Vaccination against HBV must be prioritised or allsusceptible IDUs, especially those already inected withHCV. However, selective vaccination programmes againstHBV in this group have oten been characterised bylow uptake and diculty reaching the most at-riskindividuals.34 A substantial reduction in the burden o HBV inection in IDUs is expected in countries withuniversal inant vaccination programmes, once theseindividuals reach the age at which acquisition o HBV
Figure 3: Prevalence o hepatitis B surace antigen in injecting drug users
No evidence of injecting drug use
No eligible report (92 countries)<2% (7 countries)2–<5% (21 countries)5–<10% (21 countries)≥10% (10 countries)
8/6/2019 Global epidemiology of hepatitis B and hepatitis C in people who inject drugs: results of systematic reviews
http://slidepdf.com/reader/full/global-epidemiology-of-hepatitis-b-and-hepatitis-c-in-people-who-inject-drugs 11/15
Articles
www.thelancet.com Published online July 28, 2011 DOI:10.1016/S0140-6736(11)61097-0 11
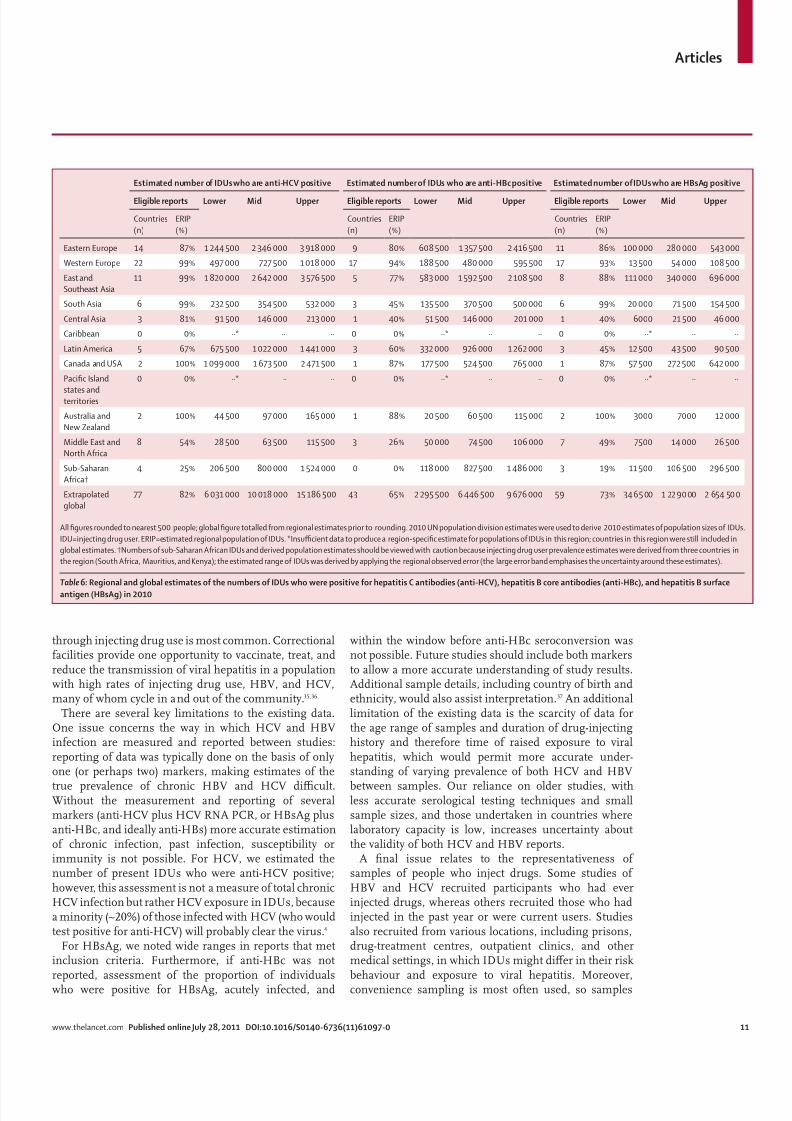
through injecting drug use is most common. Correctionalacilities provide one opportunity to vaccinate, treat, andreduce the transmission o viral hepatitis in a populationwith high rates o injecting drug use, HBV, and HCV,many o whom cycle in and out o the community.35,36
There are several key limitations to the existing data.One issue concerns the way in which HCV and HBVinection are measured and reported between studies:reporting o data was typically done on the basis o onlyone (or perhaps two) markers, making estimates o the
true prevalence o chronic HBV and HCV dicult.Without the measurement and reporting o severalmarkers (anti-HCV plus HCV RNA PCR, or HBsAg plusanti-HBc, and ideally anti-HBs) more accurate estimationo chronic inection, past inection, susceptibility orimmunity is not possible. For HCV, we estimated thenumber o present IDUs who were anti-HCV positive;however, this assessment is not a measure o total chronicHCV inection but rather HCV exposure in IDUs, becausea minority (~20%) o those inected with HCV (who wouldtest positive or anti-HCV) will probably clear the virus.4
For HBsAg, we noted wide ranges in reports that metinclusion criteria. Furthermore, i anti-HBc was notreported, assessment o the proportion o individualswho were positive or HBsAg, acutely inected, and
within the window beore anti-HBc seroconversion wasnot possible. Future studies should include both markersto allow a more accurate understanding o study results.Additional sample details, including country o birth andethnicity, would also assist interpretation.37 An additionallimitation o the existing data is the scarcity o data orthe age range o samples and duration o drug-injectinghistory and thereore time o raised exposure to viralhepatitis, which would permit more accurate under-standing o varying prevalence o both HCV and HBV
between samples. Our reliance on older studies, withless accurate serological testing techniques and smallsample sizes, and those undertaken in countries wherelaboratory capacity is low, increases uncertainty aboutthe validity o both HCV and HBV reports.
A nal issue relates to the representativeness o samples o people who inject drugs. Some studies o HBV and HCV recruited participants who had everinjected drugs, whereas others recruited those who hadinjected in the past year or were current users. Studiesalso recruited rom various locations, including prisons,drug-treatment centres, outpatient clinics, and othermedical settings, in which IDUs might dier in their riskbehaviour and exposure to viral hepatitis. Moreover,convenience sampling is most oten used, so samples
Estimated number o IDUs who are anti-HCV positive Estimated number o IDUs who are anti-HBc positive Estimated number o IDUs who are HBsAg positive
Eligible reports Lower Mid Upper Eligible reports Lower Mid Upper Eligible reports Lower Mid Upper
Countries
(n)
ERIP
(%)
Countries
(n)
ERIP
(%)
Countries
(n)
ERIP
(%)
Eastern Europe 14 87% 1 244 500 2 346 000 3 918 000 9 80% 608 500 1 357 500 2 416 500 11 86% 100 000 280 000 543 000
Western Europe 22 99% 497 000 727 500 1 018 000 17 94% 188 500 480 000 595 500 17 93% 13 500 54 000 108 500
East and
Southeast Asia
11 99% 1 820 000 2 642 000 3 576 500 5 77% 583 000 1 592 500 2 108 500 8 88% 111 000 340 000 696 000
South Asia 6 99% 232 500 354 500 532 000 3 45% 135 500 370 500 500 000 6 99% 20 000 71 500 154 500
Central Asia 3 81% 91 500 146 000 213 000 1 40% 51 500 146 000 201 000 1 40% 6000 21 500 46 000
Caribbean 0 0% ··* ·· ·· 0 0% ··* ·· ·· 0 0% ··* ·· ··
Latin America 5 67% 675 500 1 022 000 1 441 000 3 60% 332 000 926 000 1 262 000 3 45% 12 500 43 500 90 500
Canada and USA 2 100% 1 099 000 1 673 500 2 471 500 1 87% 177 500 524 500 765 000 1 87% 57 500 272 500 642 000
Pacic Island
states andterritories
0 0% ··* ·· ·· 0 0% ··* ·· ·· 0 0% ··* ·· ··
Australia and
New Zealand
2 100% 44 500 97 000 165 000 1 88% 20 500 60 500 115 000 2 100% 3000 7000 12 000
Middle East and
North Arica
8 54% 28 500 63 500 115 500 3 26% 50 000 74 500 106 000 7 49% 7500 14 000 26 500
Sub-Saharan
Arica†
4 25% 206 500 800 000 1 524 000 0 0% 118 000 827 500 1 486 000 3 19% 11 500 106 500 296 500
Extrapolated
global
77 82% 6 031 000 10 018 000 15 186 500 43 65% 2 295 500 6 446 500 9 676 000 59 73% 346 5 00 1 22 9 0 00 2 654 50 0
All gures rounded to nearest 500 people; global gure totalled rom regional estimates prior to rounding. 2010 UN population division estimates were used to derive 2010 estimates o population sizes o IDUs.
IDU=injecting drug user. ERIP=estimated regional population o IDUs. *Insufcient data to produce a region-specic estimate or populations o IDUs in this region; countries in this region were still included in
global estimates. †Numbers o sub-Saharan Arican IDUs and derived population estimates should be viewed with caution because injecting drug user prevalence estimates were derived rom three countries in
the region (South Arica, Mauritius, and Kenya); the estimated range o IDUs was derived by applying the regional observed error (the large error band emphasises the uncertainty around these estimates).
Table 6: Regional and global estimates o the numbers o IDUs who were positive or hepatitis C antibodies (anti-HCV), hepatitis B core antibodies (anti-HBc), and hepatitis B surace
antigen (HBsAg) in 2010

8/6/2019 Global epidemiology of hepatitis B and hepatitis C in people who inject drugs: results of systematic reviews
http://slidepdf.com/reader/full/global-epidemiology-of-hepatitis-b-and-hepatitis-c-in-people-who-inject-drugs 12/15
Articles
12 www.thelancet.com Published online July 28, 2011 DOI:10.1016/S0140-6736(11)61097-0
possibly do not represent the IDU population rom which
they are drawn. Data were also typically subnational androm a small number o locations that might or mightnot be representative o the epidemic nationally,particularly in larger countries where there might bemuch geographical variation, potentially restrictingnational representativeness.
We have used the same methods as in our previousreports.1 As in these previous investigations, limitationso this report included the concentration o peer-revieweddata rom high-income countries, the small team whoundertook the analysis, and the potential or papers inlanguages other than English to be overlooked. Weattempted to address these limitations by consultingwidely with experts and stakeholders, seeking unpub-
lished reports and veriying the data rom reportsincluded, and enlisting the support o UN and otheragencies, who helped gain access to data and contact withrelevant in-country personnel.
The public-health response to blood-borne virustransmission in IDUs has mainly centred on HIV.Maintenance and strengthening o the response to HIVin IDUs remains crucial, but the signicance o viralhepatitis needs to receive greater attention than it does atpresent. Investment in, and development o, compre-hensive and eective strategies to prevent the trans-mission o viral hepatitis and reduce resultant morbidityand mortality in IDUs are urgently required. The viralhepatitis resolution o the 63rd World Health Assembly10 requested that the Director General o WHO collaboratewith all relevant stakeholders in supporting surveillance,prevention, and treatment goals, especially in developingcountries. Policies and strategies or viral hepatitis needto include IDUs, who are at increased risk and oten havepoorer access to services than do the general population.Our report provides estimates o the scale o this problemat country, regional, and global scales, and the ndingsshould inorm eorts to accurately scale and appropriatelytarget the response.
Contributors
PKN and LD developed the overall method or use in the report. HH andDDJ developed the methodology and oversaw data extraction or the
HCV Synthesis Project, and provided these data or use in this report.DH maintained the customised database. PKN and DH did the literaturesearches, extracted data, and provisionally selected reports or use ingeneration o estimates. PKN and LD decided on the nal set o reports,with advice rom BC, which were reviewed by HH, DDJ, DH, and BMM.BMM developed the analysis technique and generated regional andglobal estimates, which were reviewed by PKN and LD. PKN and LD ledthe writing o the manuscript; HH, DDJ, DH, BC, and BMMcommented and contributed text. PKN generated the maps.
Conficts o interest
LD and BMM have received grant money and have acted as independentconsultants to WHO, the Joint United Nations Programme on HIV/AIDS(UNAIDS) and the United Nations Oce on Drugs and Crime (UNODC).DDJ has been unded by and consulted or WHO. LD received an untiededucational grant (2006–08) rom Reckitt Benckiser in Australia to do apostmarketing surveillance study o buprenorphine-naloxone or thetreatment o heroin dependence in Australia.
For the Secretariat for the
Reference Group see http://
www.idurefgroup.unsw.edu.au//
IDURGWeb.nsf/page/Secretariat
Acknowledgments
This report received unding support rom WHO’s HIV department
and the Australian National Drug and Alcohol Research Centre, whichreceives unding rom the Australian Department o Health andAgeing. The HCV Synthesis Project was unded by US NationalInstitute on Drug Abuse Grant R01 DA018609. DDJ is supported byUS National Institutes o Health grant DA003574. LD is supported byan Australian National Health and Medical Research Council SeniorResearch Fellowship. PKN and DH are supported by AustralianPostgraduate Awards. This study was completed as part o the work o the 2010 Global Burden o Disease (GBD) Illicit Drugs expert group.The work o the Reerence Group to the UN on HIV and InjectingDrug Use in 2007 was undertaken by the Secretariat, based at theNational Drug and Alcohol Research Centre (NDARC) at theUniversity o New South Wales (UNSW; Sydney, Australia). We thankthe GBD team rom the NDARC (Bianca Calabria, Chiara Bucello, andAnna Roberts, who contributed to earlier phases o the work andMary Kumvaj and Eva Congreve who assisted with the compilation o the literature); Paul McElwee (Burnet Institute, Melbourne, VIC,
Australia) or assistance with data extraction; Benjamin Phillips(NDARC) or his work on the systematic review o HIV and injectingdrug use and his assistance with generation o maps; the many localand international experts who assisted with compilation o data,provided urther data, commented on estimates, or provided supportduring the data collection process; the European Monitoring Centre onDrugs and Drug Addiction (EMCDDA) or the data published online,submitted by their network o Focal Points across the EU;Maria Elena Medina-Mora (National Institute on Psychiatry Ramón dela Fuente Muñiz, Mexico) or sourcing and translation eorts;Khayriyyah Mohd Hanaah (Johns Hopkins Bloomberg School o Public Health, Baltimore, MD, USA); Steven Wiersma (WHO, Geneva,Switzerland) or advice on hepatitis epidemiology and early resultsrom the GBD hepatitis expert group; and Annette Verster (WHO,Geneva, Switzerland) or nancial support o part o this review.Contributors o data and advice on this review are listed ully at http://www.gbd.unsw.edu.au/gbdweb.ns/page/Contribution%20o %20Data.
Reerences 1 Mathers BM, Degenhardt L, Phillips B, et al. Global epidemiology
o injecting drug use and HIV among people who inject drugs:a systematic review. Lancet 2008; 372: 1733–45.
2 Degenhardt L, Hall W. The extent o illicit drug use, dependence, andtheir contribution to the global burden o disease. Lancet (in press).
3 Donoghoe M, Wodak A. Health and social consequences o injecting drug use. In: Stimson G, Des Jarlais D, Ball A, eds. Druginjecting and HIV inection: global dimensions and local responses.London, UK: UCL Press, 1998: 42–57.
4 Te HS, Jensen DM. Epidemiology o hepatitis B and C virus:a global overview. Clin Liver Dis 2010; 14: 1–21.
5 Dore GJ, Freeman AJ, Law M, Kaldor JM. Is severe liver diseasea common outcome or people with chronic hepatitis C? J Gastroenterol Hepatol 2002; 17: 423–30.
6 Limberg W. Natural history, treatment and prevention o hepatitis Cin injecting drug users: an overview. In: Jager J, L imburg W,
Kretzschmar M, Postma M, Wiessing L, eds. Hepatitis C andinjecting drug user: impact, costs and policy options. Lisbon,Portugal: European Monitoring Centre or Drugs and DrugAddiction, 2004: 21–38.
7 Alter MJ. Epidemiology o hepatitis C virus inection.World J Gastroenterol 2007; 13: 2436.
8 Perz JF, Armstrong GL, Farrington LA, Hutin YJF, Bell BP. Thecontributions o hepatitis B virus and hepatitis C virus inectionsto cirrhosis and primary liver cancer worldwide. J Hepatol 2006;45: 529–38.
9 Lavanchy D. Hepatitis B virus epidemiology, disease burden,treatment, and current and emerging prevention and controlmeasures. J Viral Hepatitis 2004; 11: 97–107.
10 World Health Organization. Resolution A63/15: Viral hepatitis.63rd World Health Assembly. http://apps.who.int/gb/ebwha/pd_les/WHA63/A63_15-en.pd (accessed May 24, 2011).

8/6/2019 Global epidemiology of hepatitis B and hepatitis C in people who inject drugs: results of systematic reviews
http://slidepdf.com/reader/full/global-epidemiology-of-hepatitis-b-and-hepatitis-c-in-people-who-inject-drugs 13/15
Articles
www.thelancet.com Published online July 28, 2011 DOI:10.1016/S0140-6736(11)61097-0 13
11 Levine OS, Vlahov D, Nelson KE. Epidemiology o hepatitis B virusinections among injecting drug users: seroprevalence, risk actors,
and viral interactions. Epidemiol Rev 1994; 16: 418–36.12 Walsh N, Verster A, Doupe A, Vitoria M, Lo Y-R, Wiersma ST.
The silent epidemic: responding to viral hepatitis among peoplewho inject drugs. In: Cook C, ed. The global state o harm reduction2010: key issues or broadening the response. London, UK:International Harm Reduction Association, 2010: 71–80.
13 Aceijas C, Rhodes T. Global estimates o prevalence o HCVinection among injecting drug users. Int J Drug Policy 2007;18: 352–58.
14 Hagan H, Pouget ER, Des Jarlais DC, Lelutiu-Weinberger C.Meta-regression o hepatitis C virus inection in relation to timesince onset o illicit drug injection: the infuence o time and place.Am J Epidemiol 2008; 168: 1099–109.
15 Jacobsen KH, Wiersma ST. Hepatitis A virus seroprevalence by ageand world region, 1990 and 2005. Vaccine 2010; 28: 6653–57.
16 Hughes SA, Wedemeyer H, Harrison PM. Hepatitis delta virus. Lancet 2011; 378: 73–85.
17 Moher D, Liberati A, Tetzla J, Altman DG. Preerred reportingitems or systematic reviews and meta-analyses: the PRISMAstatement. Ann Intern Med 2009; 151: 264–69.
18 Stern R, Hagan H, Lelutiu-Weinberger C, et al. The HCV synthesisproject: scope, methodology and preliminary results.BMC Med Res Methodol 2008; 18: 341–51.
19 Ali H, Calabria B, Phillips B, et al. Searching the grey literature toaccess inormation on drug, alcohol and HIV/AIDS research: anupdate. NDARC Technical Report No. 314. http://ndarc.med.unsw.edu.au/NDARCWeb.ns/resources/TR313–317/$le/TR+314.pd (accessed May 27, 2011).
20 Degenhardt L, Bucello C, Calabria B, et al. What data are availableon the extent o illicit drug use and dependence globally? Results o our systematic reviews. Drug Alcohol Depend 2011; published onlineMarch 4. DOI:10.1016/j.drugalcdep.2010.11.032.
21 Matthews G, Dore GJ. The epidemiology o HIV and viralhepatitis coinection. In: Dore GJ, Sasadeusz J, eds. Coinection—HIV and viral hepatitis: a guide or clinical management.
http://www.hep.org.au/documents/Coinection-680KB.pd (accessed May 27, 2011).
22 von Elm E, Altman DG, Egger M, et al. The Strengthening theReporting o Observational Studies in Epidemiology (STROBE)statement: guidelines or reporting observational studies. Lancet 2007; 370: 1453–57.
23 Mathers BM, Degenhardt L, Ali H, et al. HIV prevention,treatment and care or people who inject drugs: a systematicreview o global, regional and country level coverage. Lancet 2010; 375: 1014–28.
24 UN Population Division. World population prospects: the 2008revision. New York, USA: United Nations, 2009.
25 Kimber J, Copeland L, Hickman M, et al. Survival and cessation ininjecting drug users: prospective observational study o outcomesand eect o opiate substitution treatment. BMJ 2010; 341: c3172.
26 International Harm Reduction Association. Poor access to HCVtreatment is undermining Universal Access. A brieng note tothe UNITAID board. http://www.ihra.net/les/2010/06/17/HCVBriengPaperEnglish.pd (accessed May 14, 2011).
27 Swan T. The hepatitis C treatment pipeline report. http://www.treatmentactiongroup.org/uploadedFiles/About/Publications/TAG_Publications/2011/HCV%20pipeline%202011%20nal.pd (accessedJune 18, 2011).
28 Gibson A, Randall D, Degenhardt L. The increasing mortalityburden o liver disease among opioid dependent people: cohortstudy. Addiction (in press).
29 Palmateer N, Kimber J, Hickman M, Hutchinson S, Rhodes T,Goldberg D. Evidence or the eectiveness o sterile injectingequipment provision in preventing hepatitis C and humanimmunodeciency virus transmission among injecting drug users:a review o reviews. Addiction 2010; 105: 844–59.
30 Martin NK, Vickerman P, Hickman M. Mathematical modellingo hepatitis C treatment or injecting drug users. J Theor Biol 2011;274: 58–66.
31 Amin J, Law MG, Bartlett M, Kaldor JM, Dore GJ. Causes o deathater diagnosis o hepatitis B or hepatitis C inection: a largecommunity-based linkage study. Lancet 2006; 368: 938–45.
32 Alter MJ. Epidemiology o viral hepatitis and HIV co-inection. J Hepatol 2006; 44: S6–S9.
33 Papatheodoridis GV, Lampertico P, Manolakopoulos S, Lok A.Incidence o hepatocellular carcinoma in chronic hepatitis Bpatients receiving nucleos(t)ide therapy: a systematic review. J Hepatol 53: 348–56.
34 Mast EE, Margolis HS, Fiore AE, et al. A comprehensiveimmunization strategy to eliminate transmission o hepatitis Bvirus inection in the United States. MMWR Recomm Rep 2005;54: 1–25.
35 Hunt DR, Saab S. Viral hepatitis in incarcerated adults: a medicaland public health concern. Am J Gastroenterol 2009; 104: 1024–31.
36 Kenny DT, Nelson PK. Young oenders on community orders:health, welare and criminogenic needs. http://hdl.handle.net/2123/2282 (accessed June 18, 2011).
37 Cowie B. The linguistic demography o Australians living withchronic hepatitis B. Aust N Z J Public Health 2011; 35: 12–15.

8/6/2019 Global epidemiology of hepatitis B and hepatitis C in people who inject drugs: results of systematic reviews
http://slidepdf.com/reader/full/global-epidemiology-of-hepatitis-b-and-hepatitis-c-in-people-who-inject-drugs 14/15
Comment
www.thelancet.com Published online July 28, 2011 DOI:10.1016/S0140-6736(11)61132-X 1
Hepatitis in drug users: time for attention, time for action
In place o saints’ days or public holidays, public health
practitioners celebrate disease days: World Cancer Day
in February,1 Stroke Day in October,2 and World AIDS
Day on Dec 1.3 The main reason or these days is to raise
awareness, a key part o which is the presentation o
descriptive statistics: without intervention, 84 million
people will die o cancer between 2005 and 2015;1
every 6 s someone will die rom stroke;2 and 33 million
people are living with HIV.3
In The Lancet, Paul Nelson and colleagues4 review
4386 peer-reviewed sources and 1019 grey literaturesources to estimate—at national, regional, and global
scales—prevalence and population estimates or
hepatitis B and C in injecting drug users (IDUs). The
investigators provide the requisite bold statistics:
10 million IDUs might be positive or hepatitis C
antibodies and more than 80% o IDUs in 12 countries
are estimated to be inected. More than 6 million IDUs
might be positive or hepatitis B core antibodies. The
investigators do not estimate the burden o death
and disease rom these inections, but it is likely to
be substantial: more than 1·5 million deaths occurevery year rom acute hepatitis B and C inections,
hepatocellular carcinoma, and cirrhosis.5
July 28 is World Hepatitis Day, and the article by
Nelson and colleagues4 orms part o the eorts to raise
awareness about this disease. While ocusing attention
on hepatitis is a challenge generally, mobilisation
o action to address the disease in drug users is even
more dicult.
Drug users around the world ace stigma,
discrimination, mistreatment, and the systematic
violation o their human rights.6 Harm-reduction
strategies that, in addition to prevention o HIV
inection, could help to reduce hepatitis B and C
transmission are widely underunded or blocked by local
or national governments altogether. In June, 2011,
the United Nations General Assembly eebly called
on nations to give “consideration, as appropriate” to
implementation and expansion o harm-reduction
programmes.7 Not surprisingly, countries that do not
nd drug users worthy o consideration oten nd harm
reduction inappropriate.8
Through country-by-country estimates, Nelson
and colleagues provide an opportunity to examine
striking disparities in rates o hepatitis B and C. Why
is the prevalence o hepatitis C antibodies in IDUs in
Hungary 23%, whereas it is about 90% in Estonia or
Lithuania and 73% in Russia? Why do 85% o IDUs in
Mexico have hepatitis B core antibodies compared
with 20% o IDUs in Uruguay? These dierences could
be due to the limitations o the data: despite thousands
o studies reviewed, grade A reports (ie, a multisite
seroprevalence study with several sample types or at
least one hepatitis marker) were only available or 20 o
the 77 countries or which any data were available, andew studies provided truly national estimates.4
However, the dierences may also show trends and
patterns o drug use, or important dierences in state
policies and investment in harm reduction. Large
between-country variations emphasise how high rates
o hepatitis B, hepatitis C, or HIV inection in drug users
are not inevitable.9 Moreover, the estimates provide a
powerul means or health and human rights advocates
to question government ocials in countries with high
prevalences, and to caution governments in countries
with low prevalences about the potential costs (humanand economic) o ailing to put in place, or sustain,
eective, rights-based policies.
Nelson and colleagues4 conclude that improved recog-
nition o hepatitis in IDUs and development o compre-
hensive and eective strategies are needed. No doubt
this is true, to some extent. However, the history o
HIV in IDUs shows that much more than awareness
Published Online
July 28, 2011
DOI:10.1016/S0140-
6736(11)61132-X
See Online/Articles
DOI:10.1016/S0140-
6736(11)61097-0
R e u
t e r s

8/6/2019 Global epidemiology of hepatitis B and hepatitis C in people who inject drugs: results of systematic reviews
http://slidepdf.com/reader/full/global-epidemiology-of-hepatitis-b-and-hepatitis-c-in-people-who-inject-drugs 15/15