Global Energy Scenarios: Perspectives for Energy Efficiency
12
Global Energy Scenarios: Perspectives for Energy Efficiency Improvements in Manufacturing Fridtjof Unander, Fatih Birol, and Laura Cozzi, International Energy Agency John A. “Skip” Laitner, U.S. Environmental Protection Agency ABSTRACT The International Energy Agency’s World Energy Outlook (WEO) 2004 includes a World Alternative Policy Scenario with analyses, policies and measures that countries are considering, or might reasonably be expected to adopt, to improve energy efficiency and reduce carbon dioxide (CO 2 ) emissions. As a result of these policies and measures, global industrial energy demand in the Alternative Policy Scenario is almost 9% lower, or close to 300 million tons of oil equivalent (300 Mtoe, or about 12 quadrillion Btus) less than in the WEO Reference Scenario in the year 2030. Reduced electricity consumption contributes the most to the total efficiency savings, 30% or 90 Mtoe, followed by oil with 76 Mtoe savings (26%), coal with 65 Mtoe (22%) and natural gas at 47 Mtoe (16%) savings. More than half of the global savings are in Developing Countries while OECD countries account for only a third and transition economies the rest. With typical efficiency investments averaging a payback period of 3-5 years, efficiency gains average 7% in OECD countries, 10% in developing regions and 11% in transition economies. Global CO 2 emissions from the global manufacturing sectors are down 10% in 2030 as a result of the policies assessed in the Alternative Policy Scenario. This reduction corresponds roughly to today’s total emission level in Japan. The paper discusses the methodology that was applied to the World Alternative Policy Scenario to assess policy impacts in the industrial sector and presents the main results of the Scenario. Introduction Manufacturing industries today account for about a third of global carbon dioxide (CO 2 ) emissions, making it the sector with the highest emissions. Within those countries that are members of the Organization for Economic Co-operation and Development (OECD), manufacturing emissions constitute 28% of total emissions, which is down from almost 40% in 1973. The manufacturing share of OECD total final energy consumption (TFC) 1 has fallen by a similar magnitude as CO 2 emissions. In fact, OECD manufacturing energy use today is around the same level as in the early 1970s, despite a more than doubling of manufacturing output over the same time period. Hence OECD industries now use only about half of the energy to produce the same output as they did three decades ago. This significant decline in aggregate manufacturing energy intensity can be explained by two factors; one factor represents structural shifts away from the production of energy-intensive products, and the other represents improvements in equipment and process efficiencies (Unander et al. 2001). The improvements in manufacturing energy efficiency led to significant energy savings. However, recent analysis by the International Energy Agency (IEA 2004a) shows that the rate of 1 TFC represents the energy delivered to and consumed in all end-use sectors, i.e. industry, residential, service/commercial and transport.
Transcript of Global Energy Scenarios: Perspectives for Energy Efficiency
Global Energy Scenarios: Perspectives for Energy Efficiency Improvements in Manufacturing
Fridtjof Unander, Fatih Birol, and Laura Cozzi, International Energy Agency
John A. “Skip” Laitner, U.S. Environmental Protection Agency ABSTRACT
The International Energy Agency’s World Energy Outlook (WEO) 2004 includes a
World Alternative Policy Scenario with analyses, policies and measures that countries are considering, or might reasonably be expected to adopt, to improve energy efficiency and reduce carbon dioxide (CO2) emissions. As a result of these policies and measures, global industrial energy demand in the Alternative Policy Scenario is almost 9% lower, or close to 300 million tons of oil equivalent (300 Mtoe, or about 12 quadrillion Btus) less than in the WEO Reference Scenario in the year 2030.
Reduced electricity consumption contributes the most to the total efficiency savings, 30% or 90 Mtoe, followed by oil with 76 Mtoe savings (26%), coal with 65 Mtoe (22%) and natural gas at 47 Mtoe (16%) savings. More than half of the global savings are in Developing Countries while OECD countries account for only a third and transition economies the rest. With typical efficiency investments averaging a payback period of 3-5 years, efficiency gains average 7% in OECD countries, 10% in developing regions and 11% in transition economies.
Global CO2 emissions from the global manufacturing sectors are down 10% in 2030 as a result of the policies assessed in the Alternative Policy Scenario. This reduction corresponds roughly to today’s total emission level in Japan. The paper discusses the methodology that was applied to the World Alternative Policy Scenario to assess policy impacts in the industrial sector and presents the main results of the Scenario.
Introduction
Manufacturing industries today account for about a third of global carbon dioxide (CO2) emissions, making it the sector with the highest emissions. Within those countries that are members of the Organization for Economic Co-operation and Development (OECD), manufacturing emissions constitute 28% of total emissions, which is down from almost 40% in 1973. The manufacturing share of OECD total final energy consumption (TFC)1 has fallen by a similar magnitude as CO2 emissions. In fact, OECD manufacturing energy use today is around the same level as in the early 1970s, despite a more than doubling of manufacturing output over the same time period. Hence OECD industries now use only about half of the energy to produce the same output as they did three decades ago. This significant decline in aggregate manufacturing energy intensity can be explained by two factors; one factor represents structural shifts away from the production of energy-intensive products, and the other represents improvements in equipment and process efficiencies (Unander et al. 2001).
The improvements in manufacturing energy efficiency led to significant energy savings. However, recent analysis by the International Energy Agency (IEA 2004a) shows that the rate of 1 TFC represents the energy delivered to and consumed in all end-use sectors, i.e. industry, residential, service/commercial and transport.
these savings has slowed markedly since the late 1980s. In fact, while manufacturing sub-sectoral intensities declined on average by 3.2% annually between 1973 and 1986, the average decline was down to 0.5% per year for the next 12 years. The trend of slowing intensity reductions can be seen both across countries and across sub-sectors.
Examining fuel price and consumption data shows that this slowdown came after a significant reduction in energy’s share in manufacturing production costs. This results from both the successful reduction in intensities throughout the 1970s and early 1980s and the fall in energy prices after 1986. It is thus tempting to conclude that today the lower share of energy costs – which results from both successful energy efficiency improvements and lower energy prices – has made investments in energy efficiency less attractive than investing in ways to reduce other production costs compared to a couple of decades ago.
The significant improvement within the manufacturing sectors does not mean that industrial energy efficiency has become a victim of its own success, or that OECD economies have exhausted the potential for further improvements. Indeed, a large number of studies point to an ongoing process of continual improvements in technology which expand cost-effective opportunities for new efficiency rather than eliminate them (see, for example, IWG 2000; Martin et al. 2000; Hanson et al. 2004; Laitner and Brown 2005). Given these emerging opportunities, the IEA has analysed a wide range of measures that can further improve energy efficiency in manufacturing and other sectors over the next three decades. These measures were assessed as part of the Alternative Policy Scenario of the World Energy Outlook 2004 (IEA 2004b).
This paper presents the main findings from the analysis of manufacturing energy use included in the Alternative Policy Scenario, with focus on the energy and CO2 savings achieved relative to the Reference Scenario of World Energy Outlook (WEO) 2004. The paper starts out discussing the approach that has been used to address industrial energy policies in the WEO 2004, before turning to the key results of the Reference Scenario and Alternative Policy Scenario, respectively. In this regard the paper also highlights the magnitude of investment and the level of cost-effectiveness associated with the manufacturing energy efficiency improvements. Finally, it concludes with a discussion of impacts on CO2 emissions. Manufacturing Energy Demand in the WEO The General Approach
In the WEO, the manufacturing sector for OECD regions is split into six industrial sectors: iron and steel, non-metallic minerals, chemicals, paper and pulp, food and beverages, and “other industry.” For the non-OECD regions the breakdown varies by region, but is typically based on four instead of six sub-sectors due to lack of good quality data.
In the Reference Scenario, the energy intensities (energy use per unit of each sub-sector’s output) are projected on an econometric basis. The output level of each sub-sector is modelled separately and is combined with projections of its fuel intensities to derive the consumption of each fuel by sub-sector. The fuel intensities in the Reference Scenario are developed from the assumption that there will be no additional policies implemented beyond those already in place.
Many of the policies considered in the Alternative Policy Scenario have effects that operate at a very micro-level in the economy and their impacts cannot be modelled without having a similarly detailed model. For example, the impact of mandatory efficiency standards cannot be estimated from past patterns of energy use since standards impose a new technical
standard on the energy system. To meet this challenge, detailed “bottom-up” capital stock turn-over sub-models were developed, allowing for analysing in detail the impact of policies or different choices of technology. This modelling framework also allows energy prices to adjust to the new energy supply and demand balance which result from the policies on the Alternative Policy Scenario.
Policy Assessment in the Alternative Policy Scenario
While the Reference Scenario for WEO 2004 takes into account already implemented industrial energy policies, the Alternative Policy Scenario analyses additional policies and measures that countries are considering or might reasonably be expected to adopt, to reduce energy use and CO2 emissions.
Estimating the impact of industrial energy policies is a difficult task due to data limitations and the heterogeneity of the numerous processes and technologies in use. Adding to the challenge is the very often capital intensive nature of industrial equipment which seldom are replaced unless strong financial incentives are provided. Finally, the sector is exposed to fierce international competition, especially in the production of energy intensive raw materials, and ambitious national policies could thus reduce competitiveness for these industries, (although many measures may be cost-effective and could thus increase the competitiveness). The Alternative Policy Scenario looks at how “bundles” of policies can contribute to the development of more efficient technologies and their increased use in industry. The approach used for the policy analysis differs somewhat between OECD and non-OECD regions and they are thus discussed separately below. OECD regions. The Alternative Scenario investigates the impact on energy use from strengthening and broadening policies designed to improve energy efficiency in the main end-uses of industrial energy demand, namely: • Process heat, including steam production. • Motive power. • Building energy uses. • Other energy uses, including feedstocks (for which no policies have been considered).
These end-uses rely on very different types of technology. Steam generation and process heat are the most important industrial end-uses in terms of energy use (EIA 2005). Policies affecting these end-uses can, therefore, be expected to have the greatest overall impact on industrial energy consumption. Motive power is predominately based on electricity, and policies directed towards this end-use are thus important to reduce the need for power generation.
Instead of modelling a “one-to-one” relationship between a concrete policy and its impact, the Alternative Scenario assesses how a bundle of policies together can contribute to the development of more efficient technologies and to increase the deployment of these technologies. Table 1 summarises four broad groups of policies that are analysed for OECD regions in the Alternative Policy Scenario. The main policy groups analysed include standards and certification for new motor systems; voluntary programs aimed at improving the efficiency of new technologies and at accelerating the deployment of theses technologies for all industrial end-uses; investment programs aimed at accelerating the deployment of new boilers; machine
drives and process heat equipment; and research and development (R&D) programs leading to improved efficiency of new equipment entering the market after 2015.
Table 1. Policies Considered in the Alternative Policy Scenario
for the OECD Industry Sector Policy Category End-Uses Impacted Technology Impact Regulations Standards and certification for new motor systems.
Motive power
Improved efficiency of new motor systems
Voluntary programs Expansion of existing programmes and establishment of new programmes, including: - Information and assistance aimed at
retrofitting, replacing and operating process equipment.
- Energy auditing, target setting and monitoring.
Process steam Process heat Motive power Buildings
Improved efficiency of new technologies and accelerated deployment Improved efficiency of energy use in buildings (building shell and appliances).
Investment enabling programs Tax incentives and low interest loans for investment in new efficient technologies
Process steam Process heat Motive power
Accelerated deployment rates for new boilers, machine drives, and process heat equipment.
R&D programs Increased funding to R&D and demonstration programmes.
Process steam Process heat Motive power
Improved efficiency of new equipment entering the market after 2010-2015
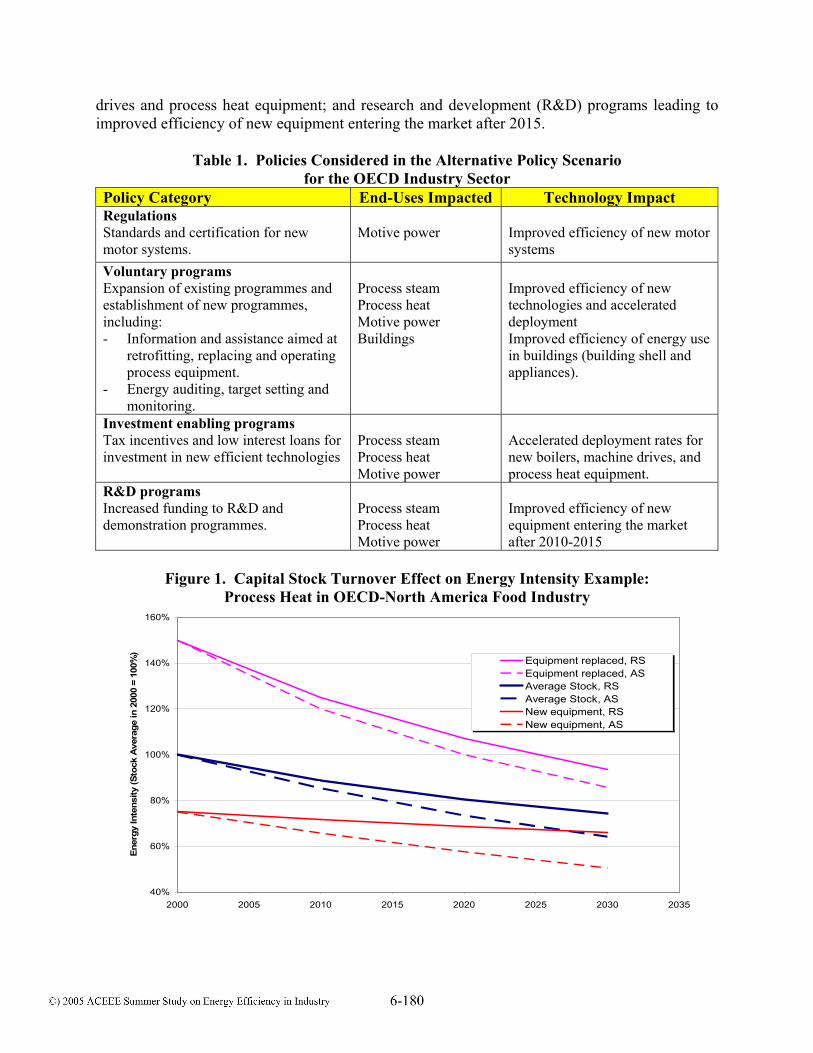
Figure 1. Capital Stock Turnover Effect on Energy Intensity Example:
Process Heat in OECD-North America Food Industry
40%
60%
80%
100%
120%
140%
160%
2000 2005 2010 2015 2020 2025 2030 2035
Ener
gy In
tens
ity (S
tock
Ave
rage
in 2
000
= 10
0%)
Equipment replaced, RSEquipment replaced, ASAverage Stock, RSAverage Stock, ASNew equipment, RSNew equipment, AS
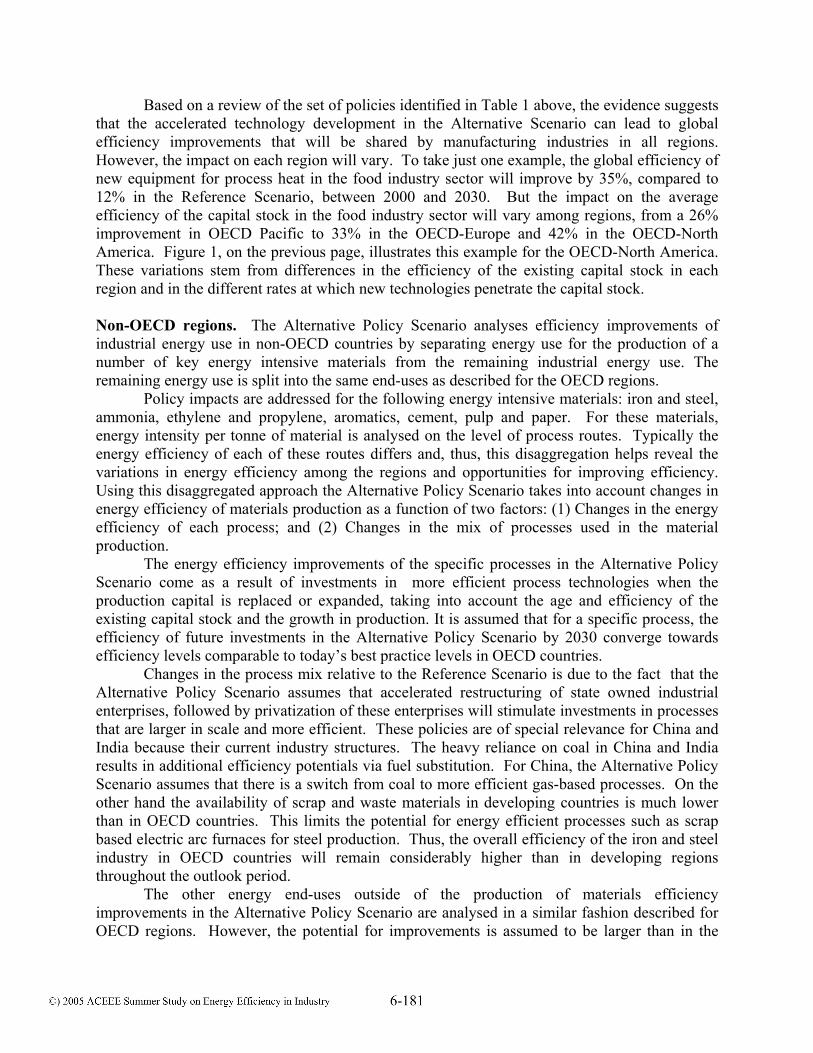
Based on a review of the set of policies identified in Table 1 above, the evidence suggests that the accelerated technology development in the Alternative Scenario can lead to global efficiency improvements that will be shared by manufacturing industries in all regions. However, the impact on each region will vary. To take just one example, the global efficiency of new equipment for process heat in the food industry sector will improve by 35%, compared to 12% in the Reference Scenario, between 2000 and 2030. But the impact on the average efficiency of the capital stock in the food industry sector will vary among regions, from a 26% improvement in OECD Pacific to 33% in the OECD-Europe and 42% in the OECD-North America. Figure 1, on the previous page, illustrates this example for the OECD-North America. These variations stem from differences in the efficiency of the existing capital stock in each region and in the different rates at which new technologies penetrate the capital stock. Non-OECD regions. The Alternative Policy Scenario analyses efficiency improvements of industrial energy use in non-OECD countries by separating energy use for the production of a number of key energy intensive materials from the remaining industrial energy use. The remaining energy use is split into the same end-uses as described for the OECD regions.
Policy impacts are addressed for the following energy intensive materials: iron and steel, ammonia, ethylene and propylene, aromatics, cement, pulp and paper. For these materials, energy intensity per tonne of material is analysed on the level of process routes. Typically the energy efficiency of each of these routes differs and, thus, this disaggregation helps reveal the variations in energy efficiency among the regions and opportunities for improving efficiency. Using this disaggregated approach the Alternative Policy Scenario takes into account changes in energy efficiency of materials production as a function of two factors: (1) Changes in the energy efficiency of each process; and (2) Changes in the mix of processes used in the material production.
The energy efficiency improvements of the specific processes in the Alternative Policy Scenario come as a result of investments in more efficient process technologies when the production capital is replaced or expanded, taking into account the age and efficiency of the existing capital stock and the growth in production. It is assumed that for a specific process, the efficiency of future investments in the Alternative Policy Scenario by 2030 converge towards efficiency levels comparable to today’s best practice levels in OECD countries.
Changes in the process mix relative to the Reference Scenario is due to the fact that the Alternative Policy Scenario assumes that accelerated restructuring of state owned industrial enterprises, followed by privatization of these enterprises will stimulate investments in processes that are larger in scale and more efficient. These policies are of special relevance for China and India because their current industry structures. The heavy reliance on coal in China and India results in additional efficiency potentials via fuel substitution. For China, the Alternative Policy Scenario assumes that there is a switch from coal to more efficient gas-based processes. On the other hand the availability of scrap and waste materials in developing countries is much lower than in OECD countries. This limits the potential for energy efficient processes such as scrap based electric arc furnaces for steel production. Thus, the overall efficiency of the iron and steel industry in OECD countries will remain considerably higher than in developing regions throughout the outlook period. The other energy end-uses outside of the production of materials efficiency improvements in the Alternative Policy Scenario are analysed in a similar fashion described for OECD regions. However, the potential for improvements is assumed to be larger than in the
OECD regions. For example, washing of low quality coal provides a significant opportunity for improved steam generation practices in countries like China and India.
In the Alternative Policy Scenario, policies to stimulate switching of fuels for industrial energy use have only been included for China. There are already policies in place in major cities such as Beijing and Shanghai to replace coal by gas to reduce local air pollution from small-scale industrial boilers. The Alternative Policy Scenario assumes that these policy efforts will be even further strengthened.
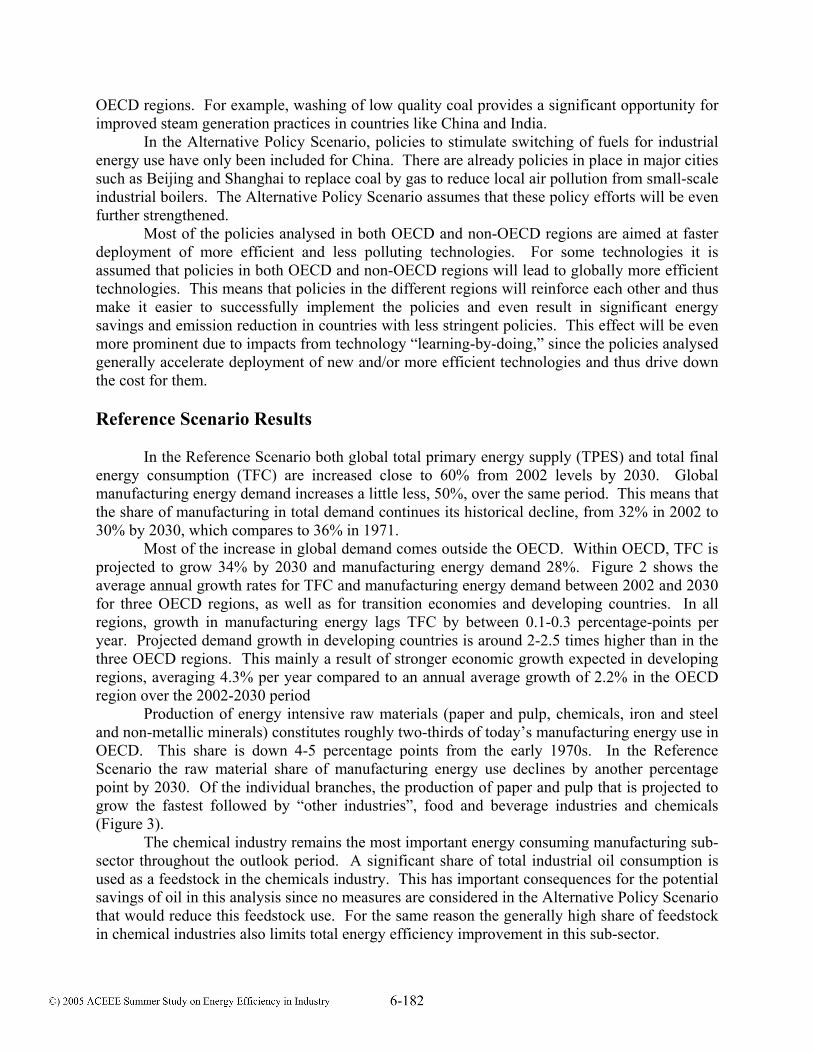
Most of the policies analysed in both OECD and non-OECD regions are aimed at faster deployment of more efficient and less polluting technologies. For some technologies it is assumed that policies in both OECD and non-OECD regions will lead to globally more efficient technologies. This means that policies in the different regions will reinforce each other and thus make it easier to successfully implement the policies and even result in significant energy savings and emission reduction in countries with less stringent policies. This effect will be even more prominent due to impacts from technology “learning-by-doing,” since the policies analysed generally accelerate deployment of new and/or more efficient technologies and thus drive down the cost for them. Reference Scenario Results In the Reference Scenario both global total primary energy supply (TPES) and total final energy consumption (TFC) are increased close to 60% from 2002 levels by 2030. Global manufacturing energy demand increases a little less, 50%, over the same period. This means that the share of manufacturing in total demand continues its historical decline, from 32% in 2002 to 30% by 2030, which compares to 36% in 1971. Most of the increase in global demand comes outside the OECD. Within OECD, TFC is projected to grow 34% by 2030 and manufacturing energy demand 28%. Figure 2 shows the average annual growth rates for TFC and manufacturing energy demand between 2002 and 2030 for three OECD regions, as well as for transition economies and developing countries. In all regions, growth in manufacturing energy lags TFC by between 0.1-0.3 percentage-points per year. Projected demand growth in developing countries is around 2-2.5 times higher than in the three OECD regions. This mainly a result of stronger economic growth expected in developing regions, averaging 4.3% per year compared to an annual average growth of 2.2% in the OECD region over the 2002-2030 period
Production of energy intensive raw materials (paper and pulp, chemicals, iron and steel and non-metallic minerals) constitutes roughly two-thirds of today’s manufacturing energy use in OECD. This share is down 4-5 percentage points from the early 1970s. In the Reference Scenario the raw material share of manufacturing energy use declines by another percentage point by 2030. Of the individual branches, the production of paper and pulp that is projected to grow the fastest followed by “other industries”, food and beverage industries and chemicals (Figure 3).
The chemical industry remains the most important energy consuming manufacturing sub-sector throughout the outlook period. A significant share of total industrial oil consumption is used as a feedstock in the chemicals industry. This has important consequences for the potential savings of oil in this analysis since no measures are considered in the Alternative Policy Scenario that would reduce this feedstock use. For the same reason the generally high share of feedstock in chemical industries also limits total energy efficiency improvement in this sub-sector.
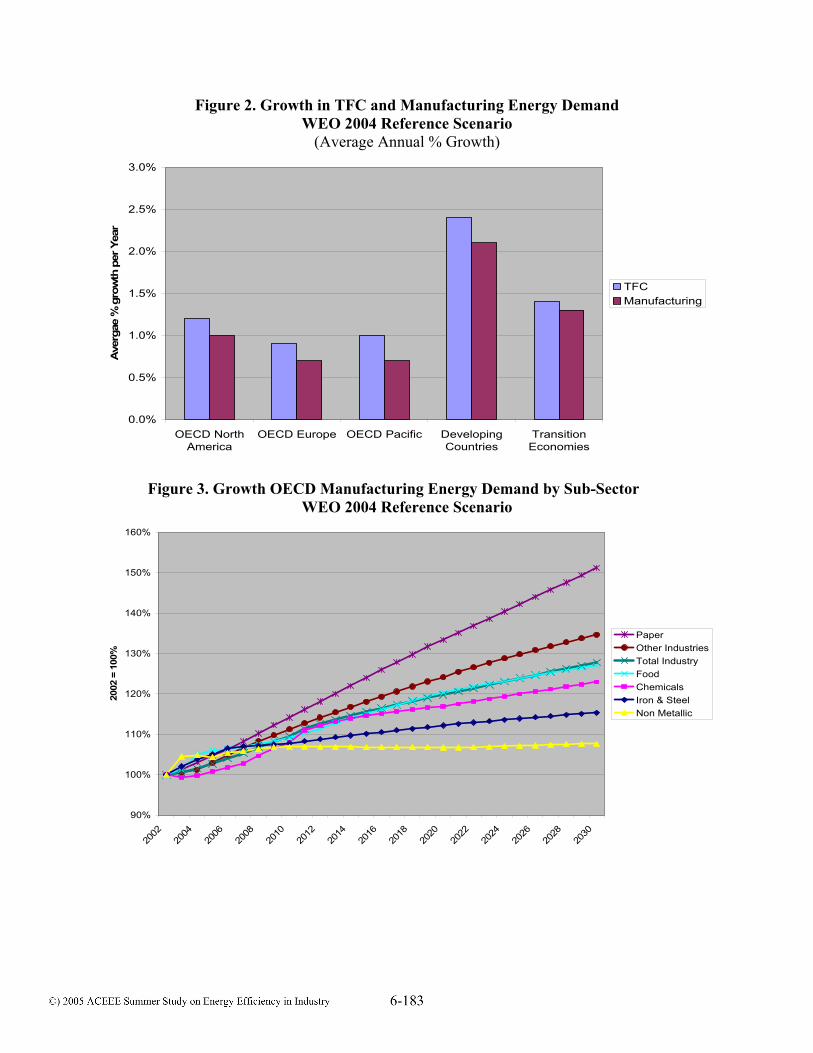
Figure 2. Growth in TFC and Manufacturing Energy Demand WEO 2004 Reference Scenario
(Average Annual % Growth)
0.0%
0.5%
1.0%
1.5%
2.0%
2.5%
3.0%
OECD NorthAmerica
OECD Europe OECD Pacific DevelopingCountries
TransitionEconomies
Ave
rgae
% g
row
th p
er Y
ear
TFCManufacturing
Figure 3. Growth OECD Manufacturing Energy Demand by Sub-Sector
WEO 2004 Reference Scenario
90%
100%
110%
120%
130%
140%
150%
160%
2002
2004
2006
2008
2010
2012
2014
2016
2018
2020
2022
2024
2026
2028
2030
2002
= 1
00%
Paper Other IndustriesTotal IndustryFood Chemicals Iron & Steel Non Metallic
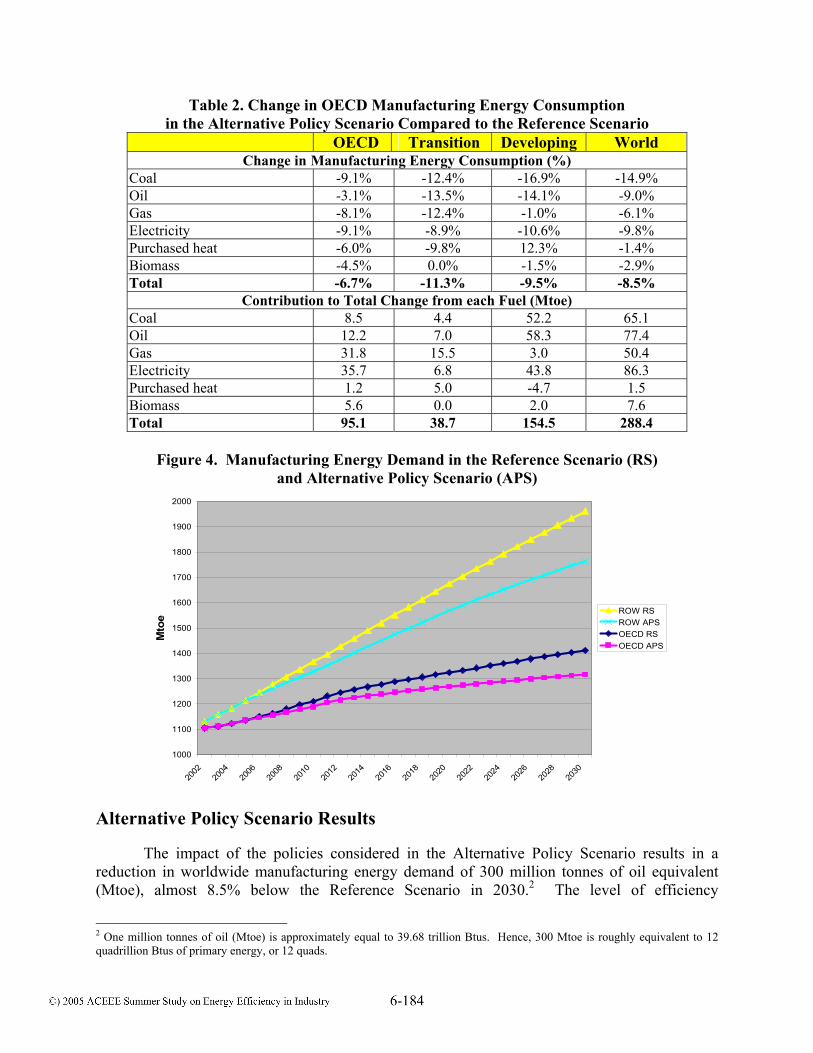
Table 2. Change in OECD Manufacturing Energy Consumption in the Alternative Policy Scenario Compared to the Reference Scenario
OECD Transition Developing World Change in Manufacturing Energy Consumption (%)
Coal -9.1% -12.4% -16.9% -14.9% Oil -3.1% -13.5% -14.1% -9.0% Gas -8.1% -12.4% -1.0% -6.1% Electricity -9.1% -8.9% -10.6% -9.8% Purchased heat -6.0% -9.8% 12.3% -1.4% Biomass -4.5% 0.0% -1.5% -2.9% Total -6.7% -11.3% -9.5% -8.5%
Contribution to Total Change from each Fuel (Mtoe) Coal 8.5 4.4 52.2 65.1 Oil 12.2 7.0 58.3 77.4 Gas 31.8 15.5 3.0 50.4 Electricity 35.7 6.8 43.8 86.3 Purchased heat 1.2 5.0 -4.7 1.5 Biomass 5.6 0.0 2.0 7.6 Total 95.1 38.7 154.5 288.4
Figure 4. Manufacturing Energy Demand in the Reference Scenario (RS)
and Alternative Policy Scenario (APS)
1000
1100
1200
1300
1400
1500
1600
1700
1800
1900
2000
2002
2004
2006
2008
2010
2012
2014
2016
2018
2020
2022
2024
2026
2028
2030
Mto
e
ROW RSROW APSOECD RSOECD APS
Alternative Policy Scenario Results
The impact of the policies considered in the Alternative Policy Scenario results in a reduction in worldwide manufacturing energy demand of 300 million tonnes of oil equivalent (Mtoe), almost 8.5% below the Reference Scenario in 2030.2 The level of efficiency
2 One million tonnes of oil (Mtoe) is approximately equal to 39.68 trillion Btus. Hence, 300 Mtoe is roughly equivalent to 12 quadrillion Btus of primary energy, or 12 quads.
improvements vary from 6.7% in OCED to 9.5% in developing regions and 11.3% in transition economies (Table 2 and Figure 4). The OECD region contributes a third to the total savings by 2030, while developing and transition economies contribute 55% and 13%, respectively.
Globally, electricity accounts for the highest share of the total energy savings in 2030, 86 Mtoe or 30% of the total savings. Savings of oil, coal and gas are also substantial contributing 27%, 23%, and 17% of the total savings, respectively.
A significant part of the 52 Mtoe reduction of coal use in developing countries is a result of substituting coal by gas in China. This also explains why the reduction in gas use for developing countries in Table 2 is so low. In China there is also assumed increased use of heat from centralised CHP plants which results in 4.7 Mtoe higher heat consumption in 2030 for developing regions in the Alternative Policy Scenario relative to the Reference Scenario.
The share of gas in industrial energy use is projected to be high in transition economies throughout the outlook period. Efficiency improvements of processes and end-uses involving gas thus result in significant savings, 15.5 Mtoe, which is more than 40% of the total industrial savings by 2030 in transition economies.
In the OECD region electricity contributes the most to the total savings, 38%, primarily a result of policies aimed at improving the efficiency of motor systems. Although OECD coal use will drop by the same percentage below the Reference Scenario as electricity, the savings are a modest 8.5 Mtoe or 9% of total OECD savings, because of coal’s low share in the industrial energy mix. OECD gas savings are most prominent in OECD North America. Gas accounts for about a third of total OECD savings. Oil savings are most important in OECD Pacific driven by improvements in process heat and boiler efficiencies. In OECD North America oil savings are modest because a large share of the oil in industry is used as a feedstock in the chemicals industry, and, as mentioned above, no policies are considered in the Alternative Policy Scenario that would reduce this feedstock use. Consideration of such policies would increase the energy efficiency potentials.
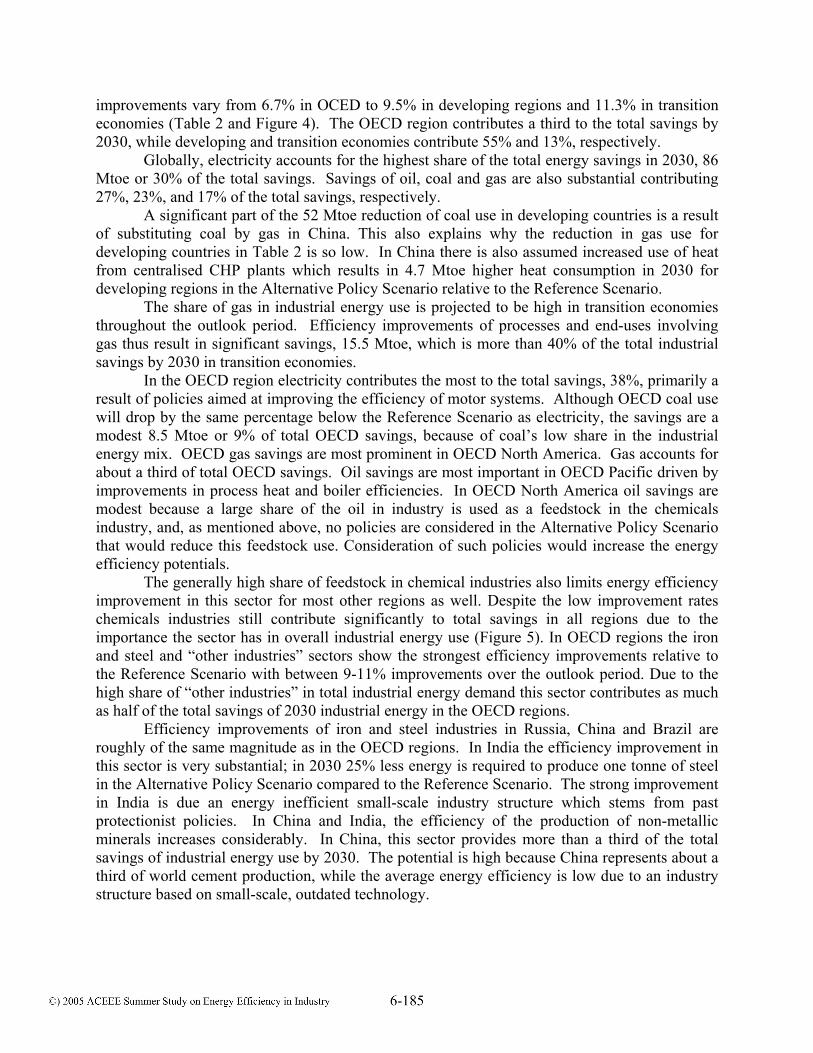
The generally high share of feedstock in chemical industries also limits energy efficiency improvement in this sector for most other regions as well. Despite the low improvement rates chemicals industries still contribute significantly to total savings in all regions due to the importance the sector has in overall industrial energy use (Figure 5). In OECD regions the iron and steel and “other industries” sectors show the strongest efficiency improvements relative to the Reference Scenario with between 9-11% improvements over the outlook period. Due to the high share of “other industries” in total industrial energy demand this sector contributes as much as half of the total savings of 2030 industrial energy in the OECD regions.
Efficiency improvements of iron and steel industries in Russia, China and Brazil are roughly of the same magnitude as in the OECD regions. In India the efficiency improvement in this sector is very substantial; in 2030 25% less energy is required to produce one tonne of steel in the Alternative Policy Scenario compared to the Reference Scenario. The strong improvement in India is due an energy inefficient small-scale industry structure which stems from past protectionist policies. In China and India, the efficiency of the production of non-metallic minerals increases considerably. In China, this sector provides more than a third of the total savings of industrial energy use by 2030. The potential is high because China represents about a third of world cement production, while the average energy efficiency is low due to an industry structure based on small-scale, outdated technology.
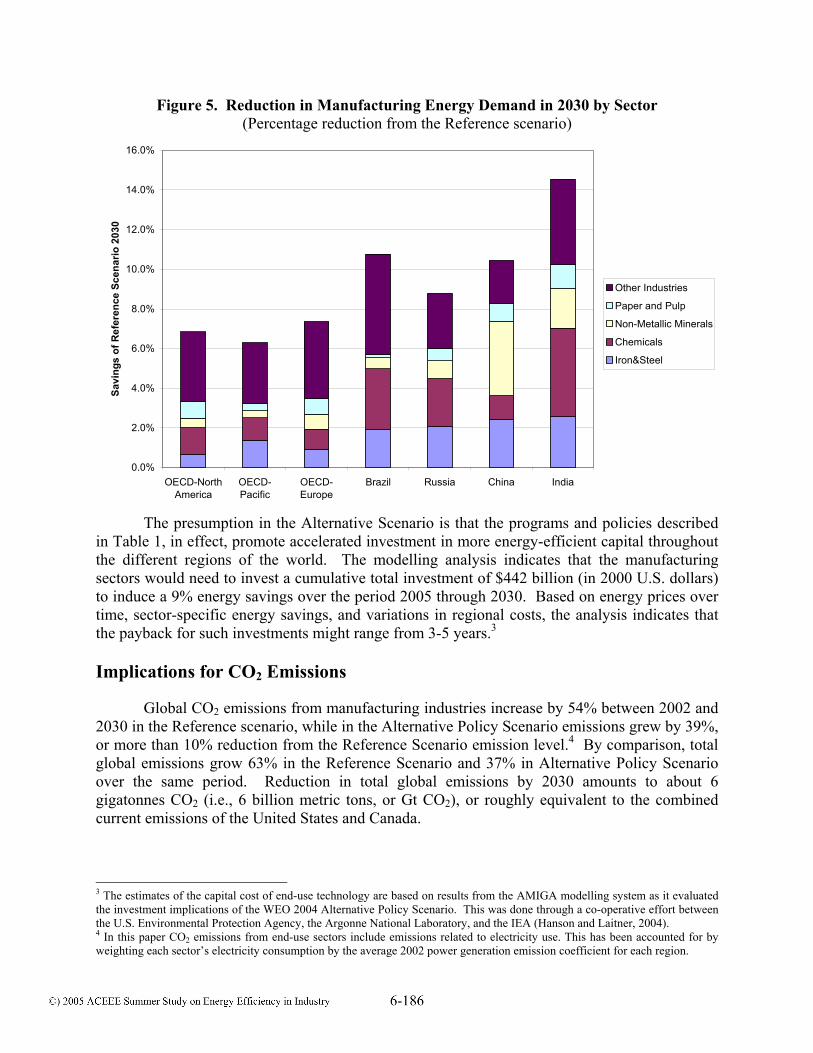
Figure 5. Reduction in Manufacturing Energy Demand in 2030 by Sector (Percentage reduction from the Reference scenario)
0.0%
2.0%
4.0%
6.0%
8.0%
10.0%
12.0%
14.0%
16.0%
OECD-NorthAmerica
OECD-Pacific
OECD-Europe
Brazil Russia China India
Savi
ngs
of R
efer
ence
Sce
nario
203
0
Other Industries
Paper and Pulp
Non-Metallic Minerals
Chemicals
Iron&Steel
The presumption in the Alternative Scenario is that the programs and policies described in Table 1, in effect, promote accelerated investment in more energy-efficient capital throughout the different regions of the world. The modelling analysis indicates that the manufacturing sectors would need to invest a cumulative total investment of $442 billion (in 2000 U.S. dollars) to induce a 9% energy savings over the period 2005 through 2030. Based on energy prices over time, sector-specific energy savings, and variations in regional costs, the analysis indicates that the payback for such investments might range from 3-5 years.3 Implications for CO2 Emissions
Global CO2 emissions from manufacturing industries increase by 54% between 2002 and 2030 in the Reference scenario, while in the Alternative Policy Scenario emissions grew by 39%, or more than 10% reduction from the Reference Scenario emission level.4 By comparison, total global emissions grow 63% in the Reference Scenario and 37% in Alternative Policy Scenario over the same period. Reduction in total global emissions by 2030 amounts to about 6 gigatonnes CO2 (i.e., 6 billion metric tons, or Gt CO2), or roughly equivalent to the combined current emissions of the United States and Canada.
3 The estimates of the capital cost of end-use technology are based on results from the AMIGA modelling system as it evaluated the investment implications of the WEO 2004 Alternative Policy Scenario. This was done through a co-operative effort between the U.S. Environmental Protection Agency, the Argonne National Laboratory, and the IEA (Hanson and Laitner, 2004). 4 In this paper CO2 emissions from end-use sectors include emissions related to electricity use. This has been accounted for by weighting each sector’s electricity consumption by the average 2002 power generation emission coefficient for each region.
The growth in OECD regions is more modest, in the Reference Scenario both total emissions and manufacturing emissions are up 27% over the 2002-2030 period, while in the Alternative Policy Scenario, total emissions increase only 7% and manufacturing emissions 17%.
The reduction in the rate of growth in total CO2 emissions in the Alternative Policy Scenario (as compared with the Reference Scenario) is summarized in Figure 6. Measures to improve end-use efficiency in transport, buildings and industry explain almost 60% of the difference worldwide. In the transition economies, the role played by energy-efficiency measures is particularly large, reflecting the significant potential for efficiency improvements. Those measures contribute 70% of the total emissions reduction in the Alternative Policy Scenario. The other big contributor to lower emissions is the increased share of renewables in the power generation fuel mix, accounting for 20% of the global emissions reduction. The larger role of nuclear power accounts for an additional 10%.
Figure 6. Reduction in Energy Related CO2 Emissions in the Alternative Policy Scenario (Compared to Reference Scenario) by Contributory Factor
0%
20%
40%
60%
80%
100%
49%
10%
8%
12%
21%
OECD
49%
10%
8%
12%
21%
OECD
63%
1%
21%
15%
Transition economies
63%
1%
21%
15%
63%
1%
21%
15%
Transition economies
67%
7%
17%
4%5%
Developing countries
67%
7%
17%
4%5%
Developing countries
58%
World
End-use efficiency gains
58%
World
End-use efficiency gains
7%
Fuel switching in end uses
7%
Fuel switching in end uses
5%
Changes in the fossil-fuel mix in power generation
5%
Changes in the fossil-fuel mix in power generation
10%
Increased nuclear in power generation
10%
Increased nuclear in power generation
20%
Increased renewables in power generation
20%
Increased renewables in power generation
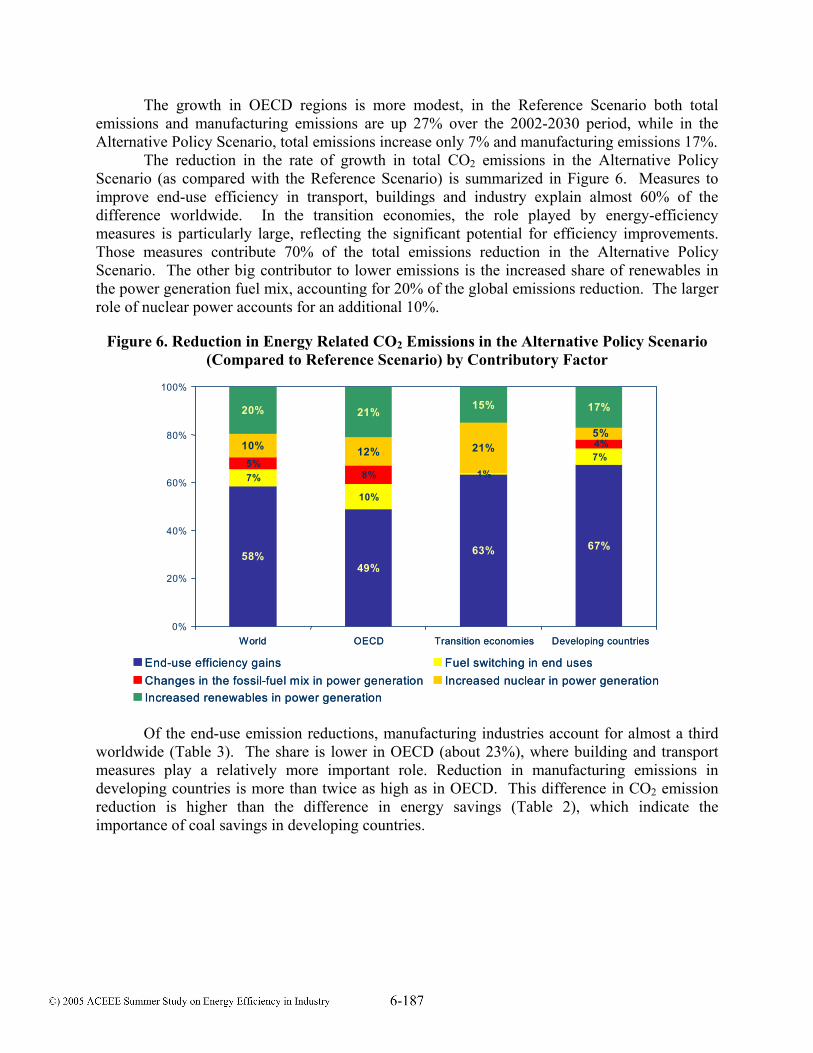
Of the end-use emission reductions, manufacturing industries account for almost a third worldwide (Table 3). The share is lower in OECD (about 23%), where building and transport measures play a relatively more important role. Reduction in manufacturing emissions in developing countries is more than twice as high as in OECD. This difference in CO2 emission reduction is higher than the difference in energy savings (Table 2), which indicate the importance of coal savings in developing countries.
Table 3. Reduction in CO2 Emissions in the WEO Alternative Policy Scenario by End-Use Sector (Million tonnes per year)
Sector
World
OECD
Transition Economies
Developing Countries
Manufacturing 1276 (30%) 363 (23%) 137 (37%) 776 (35%) Buildings 1935 (46%) 682 (43%) 175 (47%) 1078 (48%) Transport 984 (23%) 545 (34%) 59 (16%) 380 (17%) Total end-use 4195 1590 371 2234
References [EIA 2005] US Energy Information Administration, 2005. Manufacturing Energy Consumption
Survey (MECS), http://www.eia.doe.gov/industrial.html [Hanson and Laitner 2004] Hanson, Donald A and John A. “Skip” Laitner. “Estimating Energy
Efficiency Investments in the AMIGA Modeling System,” Argonne, Ill.: Argonne National Laboratory.
[Hanson et al. 2004] Hanson, Donald A.; Mintzer, Irving; Laitner, John A. “Skip” and Leonard,
J. Amber. 2004. “Engines of Growth: Energy Challenges, Opportunities, and Uncertainties in the 21st Century,” Argonne, Ill.: Argonne National Laboratory.
[IEA 2004a] International Energy Agency. 2004a. Oil Crises and Climate Challenges: 30 Years
of Energy Use in IEA Countries. Paris. IEA/OECD. [IEA 2004b] International Energy Agency. 2004b. World Energy Outlook 2004. Paris.
IEA/OECD. [IWG 2000] Interlaboratory Working Group on Energy-Efficient and Clean Energy
Technologies, 2000. Scenarios for a Clean Energy Future. Oak Ridge, TN: Office of Scientific and Technical Information.
[Laitner and Brown 2005] Laitner, John A. "Skip" and Marilyn Brown. 2005. “Emerging
Industrial Innovations to Create New Energy Efficient Technologies.” Proceedings of the 2005 ACEEE Summer Studies on Energy Efficiency in Industry, American Council for an Energy-Efficient Economy, Washington, DC.
[Martin et al. 2000] Martin, N., E. Worrell, M. Ruth, L. Price, R.N. Elliott, A.M. Shipley, J.
Thorne, 2000. “Emerging Energy-Efficient Industrial Technologies,” Lawrence Berkeley National Laboratory/American Council for an Energy-Efficient Economy, Berkeley, CA/Washington, DC (LBNL-46990).
[Unander et al. 2000] Unander, Fridtjof, Sohbet Karbuz, Lee Schipper, Marta Khrushch and
Mike Ting. 2000, “Manufacturing Energy Use in OECD Countries: Decomposition of Long-term Trends”. Energy Policy 27 (13): 769-778.