
Diamonds in the Rough: A Review of Tiffany v. Costco and a ...
Upload
mines-and-moneyCategory
view
2.447download
1
Private and confidential
Global Diversified Mining
Diamonds in the rough
Source: Lucara Diamond finds 1,111 ct stone, the second largest since the Cullinan diamond (3207 cts) in 1905
Tim Clark
+27 11 415 4295
11Diamonds in the rough
2013-14 was a strong period for diamonds, with prices +12%, though volumes declined
marginally. There was great hope that this was early signs of industry prosperity.
Rising debt pressures (financing, bankruptcies) and slower demand pushed polished
inventories into surplus in late 2014. Since then, miners first cut prices (-7% in 1H15), then
volumes (De Beers sold 3m cts in 3Q15, versus a run rate of 7.5m cts per quarter).
Polished prices recently ticked up, and we believe that inventories are clearing. The US
selling season (Thanksgiving to New Year) will determine if markets recover in 2016 or 2017.
We foresee a 2Q16 recovery.
We estimate that De Beers will increase diamond stocks from 3 to 7 months (mostly in
Debswana) by FY15e, and that Alrosa (Not covered) will increase from 5 to 10 months. If the
US selling season is good, inventories are likely to be drawn down through 2016e; if the
season is weak, we would expect a 30-50% production guidance decline in the short term.
Diamond markets are
highly consolidated
and the product is
relatively scarce
(limited long term
growth potential).
A series of factors has
resulted in high
polished inventories.
As a result prices fell
7% in 1H15, now
volumes have been
held back by the
miners. This is one of
the few markets with
producers exercising
supply constraint.
The US selling season
will set the scene for
2016.
Key points

22
Diamonds were formed 990-3.2bn years ago, 100-200kms below the earth’s
surface at 900-1300 degrees Celsius and at pressures of 45-60 kilobars
Udachnaya
Yubileynaya
Mir
Kokchetav
Western Gneiss
Region
AkluilãkLac de Gras
Snap Lake
Erzgebirge
Guaniamo
Kankan
C.A.R.
(Carbonado)
Dabie
Sulawesi
North Qaidam
Majhgawan
Wajrakarur
Junia
(São Luiz)
Poxoréu
(Carbonado)São
Francisco
Orapa
Jwaneng
Venetia
Monastery
Kimberley
Koffiefontein
Jagersfontein
Premier
Argyle
Orrorroo
New South
WalesArchon
Proton
Tecton
Source for all charts: Geological Survey of India; SBG Securities analysis

33Rough and polished market update
De Beers cut
prices 7% in
1H15, volumes
are now being
‘deferred’
Rough prices
remain above
polished and the
pipeline is in a
tough place. The
miners would
prefer to starve
inventory and
stem a polished
recovery. The
traders are
happy with a
rough price
rebase.
There is some
evidence of
polished prices
ticking up
recently.
Rough and polished pricesDe Beers prices and volumesKey points
Sample of rough diamond prices2015, sample of rough diamond prices
Source for all charts: Bloomberg, Datastream, company data, SBG Securities analysis & estimates
-50%
-40%
-30%
-20%
-10%
0%
10%
20%
30%
40%
50%
Price change (est) Production/ sales (where known)
0
50
100
150
200
250
300
Rough Polished
70
80
90
100
110
120
130
140
150
Diamonds-1 Carat G VS2 Diamonds-0.3 Carat G VS2
Diamonds-3 Carat D Flawless Diamonds-0.5 Carat G VS2
Average
0
50
100
150
200
250
300
350
400
450
Diamonds-1 Carat G VS2 Diamonds-0.3 Carat G VS2
Diamonds-3 Carat D Flawless Diamonds-1 Carat H VS2
Diamonds-0.5 Carat G VS2 Average

44Themes that have led to the current conditions
Debt
Governance
requirements
Certification delays
Bankruptcies in
India, released
inventories
Chinese anti-
corruption
campaign
Low oil prices
affecting mid East /
Russian demand
Lack of advertising
to millennials
Inventories are
building
Oil prices, 1980 to present, real and nominalCertification timing has increased fourfoldKey points
De Beers and Alrosa, inventories (theoretic for
De Beers), production and sales
Millennials views on life goals
importance
Source for all charts: www.whitehouse.gov, Bain & Company, Datastream, company data, SBG Securities analysis
Certification times
0
40
80
120
160
US$
/bbl
Real prices derived using the US CPI rebased (1980- 1981 = 0)
Nominal Brent Price Real Brent Price
Alrosa m cts notes De Beers m cts notes
01 Mar 15 15 31 Dec 15 8 3 months sales
2Q15 production 10 1H15 production 16
2Q15 sales -9 1H15 sales -14
3Q15 production 12 3Q15 production 6
3Q15 sales -5 SBGSe 3Q15 sales -3
4Q15e production 12 based on 3Q15 4Q15e production 7 based on guidance
4Q15e sales -5 based on 3Q15 4Q15e sales -3 base on sights
31 Dec 15 29 31 Dec 15 17
Months production 9.7 Months production 7.0
55Companies exposure to diamonds
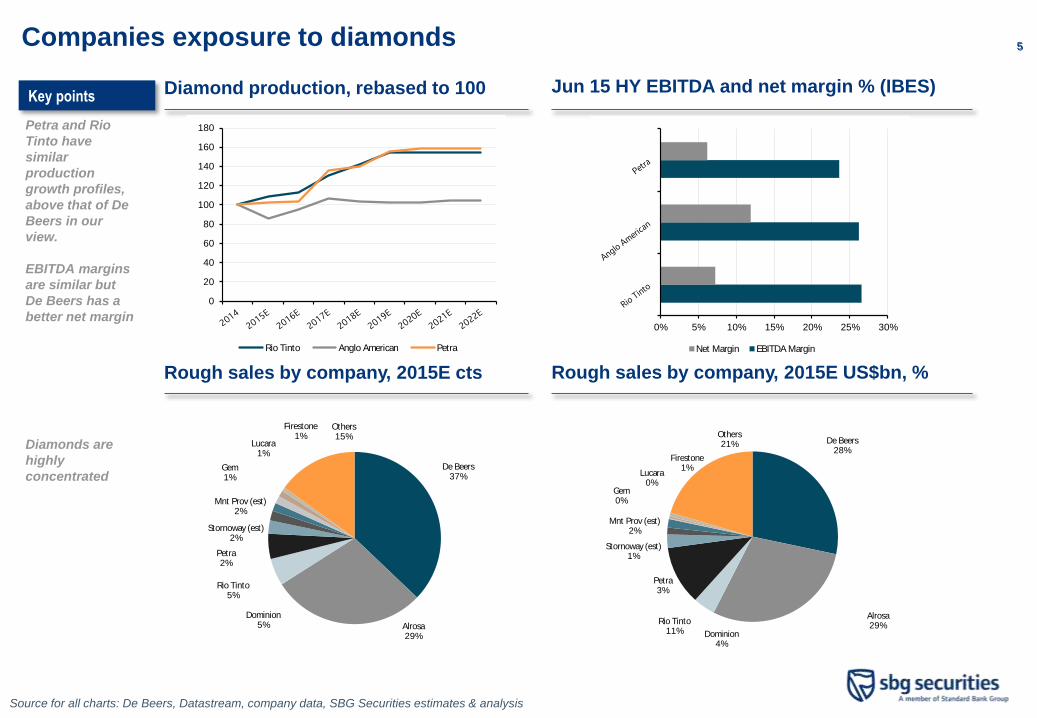
Petra and Rio
Tinto have
similar
production
growth profiles,
above that of De
Beers in our
view.
EBITDA margins
are similar but
De Beers has a
better net margin
Diamonds are
highly
concentrated
Jun 15 HY EBITDA and net margin % (IBES)Diamond production, rebased to 100Key points
Rough sales by company, 2015E US$bn, %Rough sales by company, 2015E cts
Source for all charts: De Beers, Datastream, company data, SBG Securities estimates & analysis
0
20
40
60
80
100
120
140
160
180
Rio Tinto Anglo American Petra
0% 5% 10% 15% 20% 25% 30%
Net Margin EBITDA Margin
De Beers37%
Alrosa29%
Dominion5%
Rio Tinto5%
Petra2%
Stornoway (est)2%
Mnt Prov (est)2%
Gem1%
Lucara1%
Firestone1%
Others15% De Beers
28%
Alrosa29%
Dominion4%
Rio Tinto11%
Petra3%
Stornoway (est)1%
Mnt Prov (est)2%
Gem0%
Lucara0%
Firestone1%
Others21%
66The Investment case for diamonds
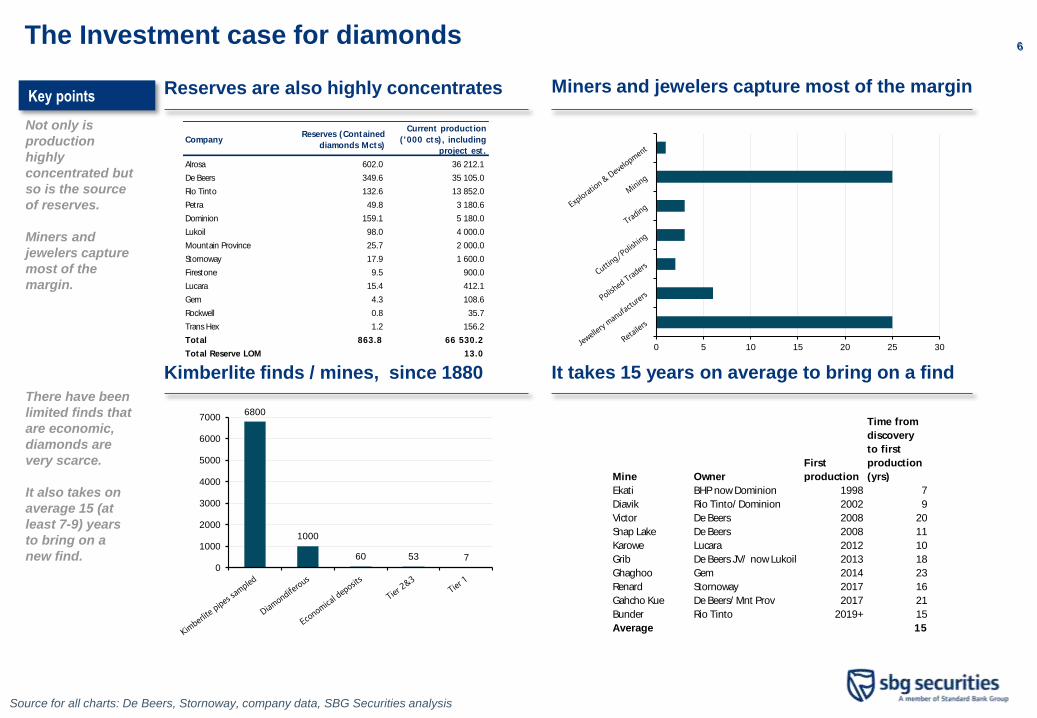
Not only is
production
highly
concentrated but
so is the source
of reserves.
Miners and
jewelers capture
most of the
margin.
There have been
limited finds that
are economic,
diamonds are
very scarce.
It also takes on
average 15 (at
least 7-9) years
to bring on a
new find.
Miners and jewelers capture most of the marginReserves are also highly concentratesKey points
It takes 15 years on average to bring on a findKimberlite finds / mines, since 1880
Source for all charts: De Beers, Stornoway, company data, SBG Securities analysis
Company Reserves (Contained
diamonds Mcts)
Current product ion
( '000 cts) , including
project est .
Alrosa 602.0 36 212.1
De Beers 349.6 35 105.0
Rio Tinto 132.6 13 852.0
Petra 49.8 3 180.6
Dominion 159.1 5 180.0
Lukoil 98.0 4 000.0
Mountain Province 25.7 2 000.0
Stornoway 17.9 1 600.0
Firestone 9.5 900.0
Lucara 15.4 412.1
Gem 4.3 108.6
Rockwell 0.8 35.7
Trans Hex 1.2 156.2
Total 863.8 66 530.2
Total Reserve LOM 13.0 0 5 10 15 20 25 30
6800
1000
60 53 70
1000
2000
3000
4000
5000
6000
7000
Mine Owner
First
production
Time from
discovery
to first
production
(yrs)
Ekati BHP now Dominion 1998 7
Diavik Rio Tinto/ Dominion 2002 9
Victor De Beers 2008 20
Snap Lake De Beers 2008 11
Karowe Lucara 2012 10
Grib De Beers JV/ now Lukoil 2013 18
Ghaghoo Gem 2014 23
Renard Stornoway 2017 16
Gahcho Kue De Beers/ Mnt Prov 2017 21
Bunder Rio Tinto 2019+ 15
Average 15

77The Investment case for diamonds
Diamond
producers are
more disciplined
because of the
concentration and
scarcity noted
previously.
The price/volume
balance tends to
be solved with
volume, where
other commodities
solve with price
De Beers sight values De Beers sight values Key points
Price variation for the precious metals and diamonds
Source for all charts: Datastream, company data, SBG Securities analysis
-60%
-40%
-20%
0%
20%
40%
60%
80%
100%
Rough Diamonds Gold Platinum Copper Silver Iron ore
0
100
200
300
400
500
600
700
800
900
1000
2011 2012 2013
2014 2015 Average
0
100
200
300
400
500
600
700
800
900
1000

88Demand has held up reasonably
Polished demand
has been fairly
resilient. De Beers
estimates 7%
growth in the US in
2014, with Japan
and China slower
but positive.
We think that the
issues in diamonds
is over-supply /
release of
inventories more
than consumer
demand.
We remain
conservative given
thrifting into
synthetics and
other gems and re-
cycling on our
demand outlook, at
3% nominal.
Monthly US Jewellery sales (yoy%)Jewellery demand splitKey points
Japanese polished diamond imports (US$bn)
Chinese retail sales; gold, silver and
jewellery sales, CNY (Bn)
Source for all charts: Datastream, company data, SBG Securities analysis
US40%
China (incl HK, Macau)16%
India8%
Japan6%
Gulf8%
RoW22%
6.8%
-2.6%
3.9%
14.5%
1.2%
-0.9%
3.3%
1.7%
-1.4%
8.7%
5.3%
-4.3%
6.1%
3.2%
0.7%
2.1%
4.9%
2.0%
6.4%
3.7%
0.9%
-3.3%
-6.0% -5.9%-5.3%
-2.2%
5.2%
2.8%
-0.6%
-10%
-5%
0%
5%
10%
15%
0%
24%
40%
50%
42%
52%
28%23%
20%21%19%
0%
11%
-3%
-31%
-12%
2%
-10%
7%11%12%
5%6%0%
-4%
16%
8%11%
2%5%
2%
-1%
-40%
-20%
0%
20%
40%
60%
80% 1.45
1.05
1.291.2
0.97 0.94 0.97
1.18
1.051.01
0.88
0.77
0.620.69
0.810.9 0.87 0.89
0
0.2
0.4
0.6
0.8
1
1.2
1.4
1.6
US$
(b)
Japan's Polished Diamnonds Imports, (US$ b)

99Diamond demand is from middle and upper incomes
Demand for
diamonds is an
emotional and a
luxury purchase.
Diamonds are
unique and are not
thus a commodity.
Demand has been
created through
advertising and is
very middle/upper
income focused.
Recently branded
jewelry has become
ore prevalent.
Chinese income development over timeHistory of creating demand - De BeersKey points
Branded jewellery sales increasing over time
Source for all charts: G Securities analysis, McKinsey & Company, De Beers

101024m cts of growth are expected, excluding latent capacity
We have
reviewed the
project pipeline
and outline the
known projects
in detail.
Diamond projectsKey points
Source for all charts: Company reports, Bain & Company, McKinsey & Company, De Beers; SBG
Securities analysis
Notes 2015E
2016E
2017E
2018E
2019E
2020E
2021E
Tota
l
Alrosa Group Various projects to expand production 1.0 1.0 1.0 1.0 1.0 1.0 6.0
Bunder (Rio Tinto) Rio Tinto project in India with potential production of
2.5m cts pa
1.0 1.5 2.5
Gaghoo (Gem) Ghagoo is Botswana's first UG diamond mine. Gem
Diamonds is developing Ghaghoo in a phased approach.
0.1 0.1 0.2
Gahcho Kue (De Beers 51/ Mnt Prov 49) Gahcho Kue is a new mine in Canada, with an 11-13 year
life and producing 4-5.5m cts pa.
- 0.2 3.5 1.2 0.6 5.5
Grib (Lukoil) Lukoil has constructed the mine which has 98m cts of
reserves and will gorw incrementally towards 4.5m cts pa
production
1.0 2.0 0.5 3.5
Krone Endora Venetia alluvials (Diamcor) This is an alluvial deposit previously owned by De Beers
and adjacent to the Venetia diamond mine.
0.2 0.2
Lace (DiamondCorp) Lace is the restart of an old mine near Kroonstad in South
Africa, with potential production of 300k cts
0.3 0.3
Lerala (Kimberley Diamonds) The Lerala Mine, situated in north-east Botswana,
comprises a cluster of five diamondiferous kimberlite
pipes totalling 6.7 hectares in size, together with a 230
tonnes per hour processing and recovery facility. Lerala
will target a production rate of approximately 400 k ct pa.
0.2 0.2 0.4
Merlin (Merlin Diamonds Limited) Merlin Diamonds is an Australian kimberlite developer 0.1 0.2 0.3
Petra various Various projects to extend caves to new levels and
construct a new plant at Cullinan
0.1 0.0 1.0 0.1 0.5 0.1 1.8
Renard (Stornoway) Storoway project for the first diamond mine in Quebec,
production est of 1.6mcts pa from 2H16
- 0.3 0.9 0.4 1.6
Star Orion South (Shore Gold) Kimberlite near Saskatchewan, Canada, FS indicates 34mc
reserve, 20yr LOM, $1.9bn investment
0.8 0.9 1.7
Total 1.7 3.6 7.6 2.7 3.1 3.4 1.9 24.0
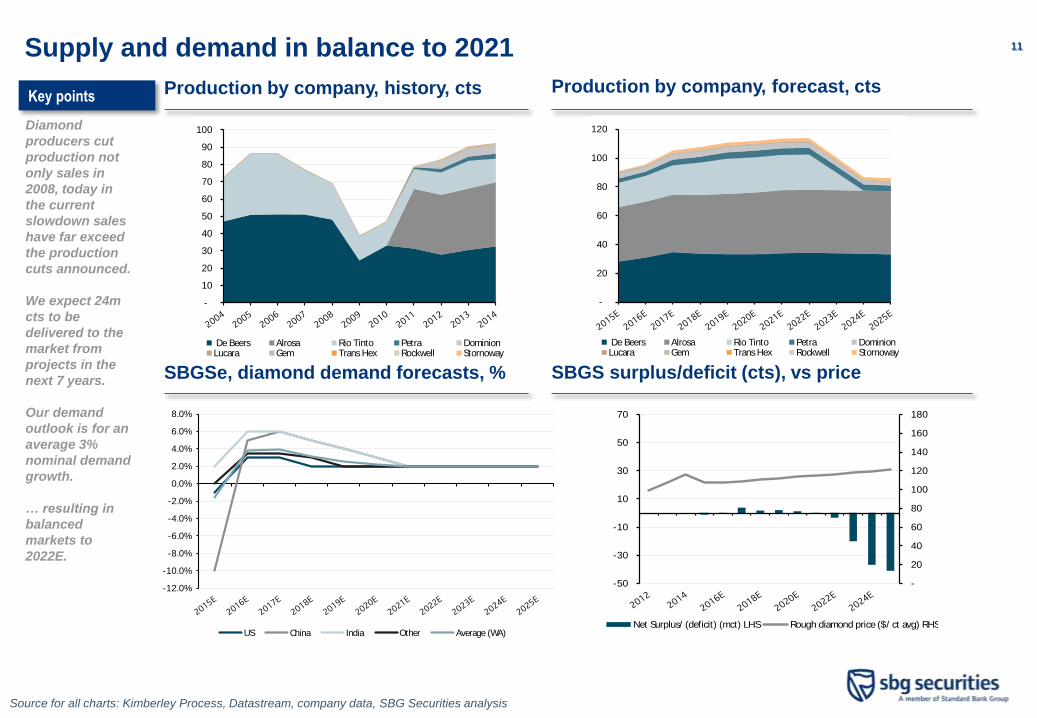
1111Supply and demand in balance to 2021
Diamond
producers cut
production not
only sales in
2008, today in
the current
slowdown sales
have far exceed
the production
cuts announced.
We expect 24m
cts to be
delivered to the
market from
projects in the
next 7 years.
Our demand
outlook is for an
average 3%
nominal demand
growth.
… resulting in
balanced
markets to
2022E.
Production by company, forecast, ctsProduction by company, history, ctsKey points
SBGS surplus/deficit (cts), vs priceSBGSe, diamond demand forecasts, %
Source for all charts: Kimberley Process, Datastream, company data, SBG Securities analysis
-
10
20
30
40
50
60
70
80
90
100
De Beers Alrosa Rio Tinto Petra DominionLucara Gem Trans Hex Rockwell Stornoway
-
20
40
60
80
100
120
De Beers Alrosa Rio Tinto Petra DominionLucara Gem Trans Hex Rockwell Stornoway
-12.0%
-10.0%
-8.0%
-6.0%
-4.0%
-2.0%
0.0%
2.0%
4.0%
6.0%
8.0%
US China India Other Average (WA)
-
20
40
60
80
100
120
140
160
180
-50
-30
-10
10
30
50
70
Net Surplus/ (deficit) (mct) LHS Rough diamond price ($/ ct avg) RHS

1212
The diamond pipeline, it
takes 6-9 months to
restock
Phase
Dia
mon
d ty
pe
Nat
ure
Value
(US$
bn SB
GSe
)
Cash
mar
gin (SB
GSe
)
Finan
cing
Note
s
Ro
ug
h
EXPLORATION
&
DISCOVERY
So urce: B o tswana D iamo nds
Fragmented, 100s of participants 1.0 na Equity
De Beers and Alrosa remain the main
exploration companies. Rio Tinto continues
developing Bunder. There are numerous
exploration companies, mostly listed on the
TSX.
MINING
So urce: D o minio n D iamo nds
Highly concentrated. De Beers and
Alrosa have a combined 70% share of
the market in terms of volume and 85%
in terms of value (SBGSe). 10s
15.0 20-30% Equity and senior LT debt
Largest mining companies include:
• De Beers
• Alrosa
• Rio Tinto
• Petra
• Dominion
• Endiama (Angola state)
TRADING
So urce: Lucara D iamo nds
Moderately concentrated, 120 known
buyers for the five major producers,
100s
15.0 1-5%
Historically 90% financed,
now 50-70% as a result of
the lower profuitability of
trading, the increased
capital regulation on banks
and bankruptcies in recnt
years.
Please refer to the table of traders and
sightholders for the 5 of the largest mining
companies. More recently there is pressure
for the traders to provide IFRS accounts,
comply with liquidity levels and to have
audited accounts.
CUTTERS
&
POLISHERS
So urce: D e B eers Insight
Highly fragmented, in India in particular.
1000s17.0 1-5%
Similar to trading, with
smaller cutters in cash on a
rolling basis, with limited
inventory
We estimate that there are arouns 200-250
polishers in SA, 1000 in Botswana, 800,000
In India
POLISHED TRADERS
So urce: GIA
Well fragmented, though not as highly
as cutting, 100s18.0 1-3% Similar to trading
Diamonds are acquired from smaller cutting
centres and sold by polished traders where
the producer and consumer are not vertically
integrated.
JEWELLERY
MANUFACTURERS
So urce: F o revermark
Very fragmented, 10,000s 35.0 5-12% Corporate debt and equity
Manufacturers include:
• Contracted specialists
• Luxury brands (LVMH, Richemont etc.)
• Independent designers
RETAILERS
So urce: R apapo rt news
Extremely fragmented. 250,000s 60.0 10-100% Corporate debt and equity
Channels include:
• Catalogue/ TV (QVC)
• Internet (Blue Nile)
• Department Stores (Macys)
• Discounters (Walmart)
• Jewellery Chains (Tiffany’s)
• Independent Jewellers (De Beers)
CONSUMERS
So urce: D e B eers Insight
Co
nsu
mers
Middle to upper income earners globally.
1,000,000s
Bain & Company estimate what Chinese
middel class households will increase
from 116m in 2013 to 282m by 2024E, a
CAGR increase of 8.4%. Indian middel class
households will increase from 39m in 2013
to 109m by 2024E, a CAGR increase of 9.9%.
Ro
ug
hP
oli
sh
ed
Jew
ell
ers
Lucara finds a 1,111 carat stone,
the second-largest ever after the
3107ct Cullinan Diamond was
found in 1905
Source for all charts: SBG Securities analysis, Lucara, Bain &
Company, Mckinsey & Company

1313Conclusion
Source for all charts: SBG Securities analysis
Diamond markets are among the most consolidated, the material is most scarce and the market
participants are the most rational
A number of events has caused excess polished inventories, including: large sales levels in 1H14,
financing constraints, cutting/polishing bankruptcies, oil price declines, China’s anti-corruption campaign
and a lack of advertising to millennials. Most of these events are pipeline issues not long term demand.
… the miners have reacted. Supply has been withheld, destocking is taking effect. There are two ways to
solve the puzzle, hold back supply and drive polished prices or cut rough prices. The miners have chosen
the former, rational given margin levels
We think that diamonds have fallen deeper and faster than other commodities but will recover
sooner.

Private and confidential
Disclosures
15Disclosures
SBG Securities (Pty) Limited is the name provided to the Institutional Stock broking entity of The Standard Bank of South
Africa Limited. The following analyst/s: Heidi Sternberg, Tim Clark certify, with respect to the companies or securities under
analysis, that (1) the views expressed in this report accurately reflect their personal views about all of the subject companies
and securities and (2) no part of their compensation was, is or will be directly or indirectly related to the specific
recommendations or views expressed in this report. SBG Securities (Pty) Limited Research Analyst receive compensation
that is based, in part, on the overall firm revenues, which include investment banking revenues.
Disclosure Appendix
Important Global Disclosures
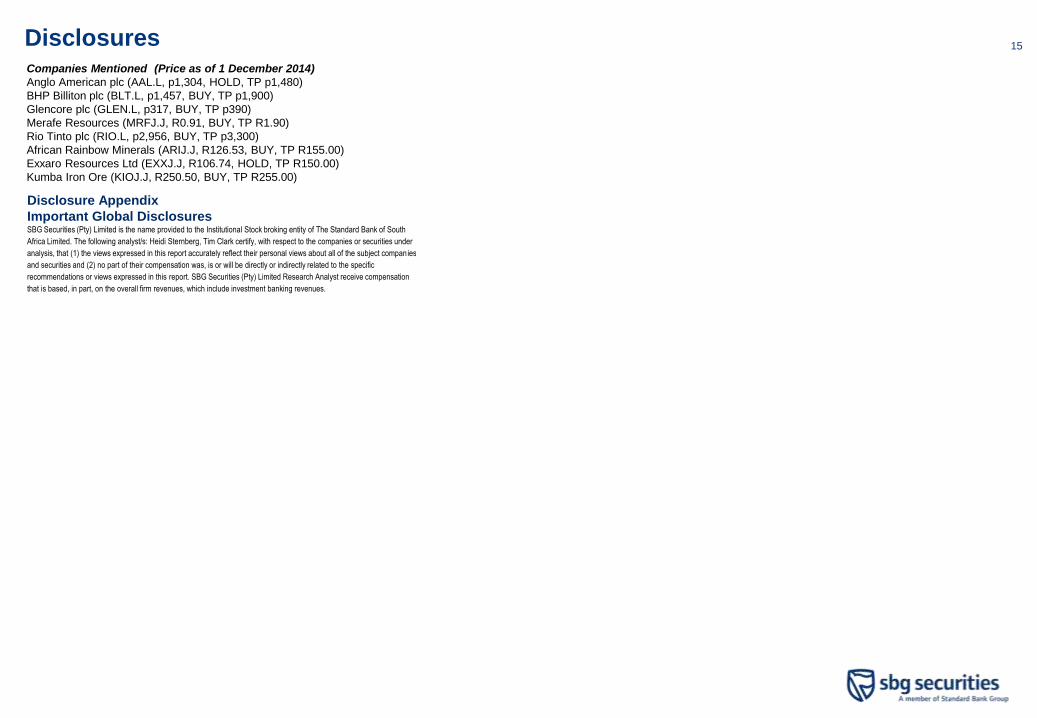
Companies Mentioned (Price as of 1 December 2014)
Anglo American plc (AAL.L, p1,304, HOLD, TP p1,480)
BHP Billiton plc (BLT.L, p1,457, BUY, TP p1,900)
Glencore plc (GLEN.L, p317, BUY, TP p390)
Merafe Resources (MRFJ.J, R0.91, BUY, TP R1.90)
Rio Tinto plc (RIO.L, p2,956, BUY, TP p3,300)
African Rainbow Minerals (ARIJ.J, R126.53, BUY, TP R155.00)
Exxaro Resources Ltd (EXXJ.J, R106.74, HOLD, TP R150.00)
Kumba Iron Ore (KIOJ.J, R250.50, BUY, TP R255.00)

16Disclosures
SBG Securities’ distribution of stock ratings is:
SBG Securities (Pty) Limited is the name provided to the Institutional Stock broking entity of The Standard Bank of South Africa Limited. The following analyst/s: Heidi Sternberg, Tim Clark certify, with respect to the companies or securities under analysis, that (1) the views expressed in
this report accurately reflect their personal views about all of the subject companies and securities and (2) no part of their compensation was, is or will be directly or indirectly related to the specific recommendations or views expressed in this report. SBG Securities (Pty) Limited Research
Analyst receive compensation that is based, in part, on the overall firm revenues, which include investment banking revenues.
For purposes of the NYSE and NASD ratings distribution disclosure requirements, our stock ratings of BUY, HOLD, and SELL most closely correspond to Buy, Hold, and Sell, respectively; however, the meanings are not the same, as our stock
ratings are determined on a relative basis. (Please refer to definitions above.) An investor's decision to buy or sell a security should be based on investment objectives, current holdings, and other individual factors.
SBG Securities’ policy is to update research reports as it deems appropriate, based on developments with the subject company, the sector or the market that may have a material impact on the research views or opinions stated herein.
SBG Securities’ policy is only to publish investment research that is impartial, independent, clear, fair and not misleading. For more detail please contact the Legal and Compliance Division of SBG Securities’ and request their Policies for Managing
Conflicts of Interest in connection with Investment Research.
SBG Securities does not provide any tax advice. Any statement herein regarding any US federal tax is not intended or written to be used, and cannot be used, by any taxpayer for the purposes of avoiding any penalties.
Price Target: (12 months) for (AAL.L)
Methods: We value Anglo using a DCF valuation for operating assets, and over the life of mine, assuming a USD WACC of 9.5% (equity risk premium (ERP) 4.5%, Beta 1.25, long bond 5.0%, cost of equity 10.6%, and long-term gearing (excluding
marketing short-term debt) of 20% debt/equity %). We value non-core assets at a market price (PE and EV/EBITDA blend) and the listed holding in Exxaro at current market value. We DCF our cash flows on a 12-month forward rolling basis and include
the dividend yield in our one-year forward target price.
Risks: Risks to our target price, valuation and earnings include higher or lower commodity prices and exchange rates than we are forecasting. Risks also include delivery of ongoing production where unforeseen mining, logistics and labour issues may
impact our estimates. Project delivery and capex is a risk in the sector with projects coming in over budget and late at times in the cycle or if underestimated by management.
Price Target: (12 months) for (BLT.L)
Methods: We value BHP using a DCF valuation for operating assets over the LoM and assuming a USD WACC of 9.5% (equity risk premium (ERP) 4.5%, Beta 1.25, long bond 5.0%, cost of equity 10.6%, and long-term gearing of 20% debt/debt+equity).
We value petroleum exploration at the cost incurred given historical successes. We DCF our cash flows on a 12-month forward rolling basis and include the dividend yield in our one-year forward target price.
Risks: Risks to our target price, valuation and earnings include higher or lower commodity prices and exchange rates than we are forecasting. Risks also include delivery of ongoing production where unforeseen mining, logistics and labour issues may
impact our estimates. Project delivery and capex is a risk in the sector with projects coming in over budget and late at times in the cycle or if underestimated by management.
Price Target: (12 months) for (GLEN.L)
Methods: We value Glencore using a DCF valuation for operating assets and marketing activities over the LoM and assuming a USD WACC of 9.5% (equity risk premium (ERP) 4.5%, Beta 1.25, long bond 5.0%, cost of equity 10.6%, and long-term
gearing (excluding marketing short-term debt) of 20% debt/equity%). We value the unlisted assets at market value. We DCF our cash flows on a 12-month rolling forward basis, and include the dividend yield in our one-year forward target price.
Risks: Risks to our target price, valuation and earnings include higher or lower commodity prices and exchange rates than we are forecasting. Risks also include delivery of ongoing production where unforeseen mining, logistics and labour issues may
impact our estimates. Project delivery and capex is a risk in the sector with projects coming in over budget and late at times in the cycle or if underestimated by management.
Price Target: (12 months) for (MRFJ.J)
Methods: We value Merafe using a DCF valuation for operating assets over the life of mine and assuming a ZAR WACC of 12.5% (Equity Risk Premium (ERP) 4.5%, Beta 1.25, Long bond 8.5%, Cost of Equity 14.1%, and long-term gearing (excluding
marketing short term debt) of 30% Debt/Debt+Equity). We DCF our cash flows on a 12-month forward rolling basis and include the dividend yield in our one-year forward price target.
Risks: Risks to our target price, valuation and earnings include higher or lower commodity prices and exchange rates than we are forecasting. Risks also include delivery of ongoing production where unforeseen mining, logistics and labour issues may
impact our estimates. Project delivery and capex is a risk in the sector with projects coming in over budget and late at times in the cycle or if underestimated by management.
Price Target: (12 months) for (RIO.L)
Methods: We value Rio Tinto using a DCF valuation for operating assets over the life of mine and assuming a USD WACC of 9.5% (equity risk premium (ERP) 4.5%, Beta 1.25, long bond 5.0%, cost of equity 10.6% and long-term gearing of 20%
debt/debt+equity). We DCF our cash flows on a 12-month forward rolling basis and include the dividend yield in our one-year forward target price.
Risks: Risks to our target price, valuation and earnings include higher or lower commodity prices and exchange rates than we are forecasting. Risks also include delivery of ongoing production where unforeseen mining, logistics and labour issues may
impact our estimates. Project delivery and capex is a risk in the sector with projects coming in over budget and late at times in the cycle or if underestimated by management.
See the Companies Mentioned section for full company names.

17Disclosures
Important Standard Bank DisclosuresPotential Conflicts
A: The analyst is an officer, board member, or director of the Company
B: The company beneficially owns 5% or more of the equity shares of Standard Bank Group as at Jan 2012
C: Standard CIB beneficially owns 1% or more of the equity shares of the company
D: Standard CIB may beneficially hold a significant financial interest of the debt of this company where the aggregate of this debt is more than US$ 15 million
E: The Company is a client of Standard CIB
F: Standard CIB has lead managed or co-lead managed a public offering of the securities of the company in the last 12 months
G: Standard CIB has received compensation for investment banking services from the company within the last 12 months
H: Standard CIB expects to receive, or intends to seek, compensation for investment banking services from the company during the next 3 months
I: SBG Securities (Pty) Ltd has sent extracts of this research report to the subject company prior to publication for the purpose of verifying factual accuracy. Based on information provided by the subject company, factual changes have been
made as a result.
J: Analyst or a member of their household holds long or short personal positions in a class of common equity securities of this company
K: Standard CIB is a market maker or liquidity provider in the financial instruments of the relevant issuer
* Disclosures are correct as of 13 October 2014
For purposes of the NYSE and NASD, in connection to the distribution of SBG Securities research, Standard Bank Group must disclose certain material conflicts of interest. Standard Bank Group
expects to receive or intends to seek investment banking related compensation from the subject company Resources Strategy within the next 3 months.
This report may include references to Standard Bank Group Limited’s research recommendations. For further information and for published Standard Bank reports in their entirety, please visit the website at www.standardbank.co.za/research.
For SBG Securities’ disclosure information on other companies mentioned in this report, please visit the website at www.SBG Securities-sa.com/researchdisclosures.
Disclaimers continue on next page
.
Company Disclosure
Anglo American plc D J
BHP Billiton plc D F G J
Glencore plc D
Merafe Resources D G
Rio Tinto plc D
This report covers Metals and Mining. All other companies were used for illustrative purposes only. We are not commenting on the investment merit of the securities of these companies
Singapore recipients should contact a Singapore financial adviser for any matters arising from this research report.
The analyst(s) involved in the preparation of this report have not visited the material operations of the subject company () within the past 12 months. Restrictions on certain Canadian securities are indicated by the following abbreviations: NVS--Non-Voting
shares; RVS--Restricted Voting Shares; SVS--Subordinate Voting Shares. Individuals receiving this report from a Canadian investment dealer that is n ot affiliated with SBG Securities (Proprietary) Limited ( “ SBG Securities”) should be advised that this
report may not contain regulatory disclosures the non-affiliated Canadian investment dealer would be required to make if this were its own report.
As of the date of this report, SBG Securities does not act as a market maker or liquidity provider in the equities securities that are the subject of this report.
Principal is not guaranteed in the case of equities because equity prices are variable.
Commission is the commission rate or the amount agreed with a customer when setting up an account or at any time after that.
Taiwanese Disclosures: This research report is for reference only. Investors should carefully consider their own investment risk. Investment results are the responsibility of the individual investor. Reports may not be reprinted without permission of SBG
Securities. Reports written by Taiwan-based analysts on non-Taiwan listed companies are not considered recommendations to buy or sell securities under
Taiwan Stock Exchange Operational Regulations Governing Securities Firms Recommending Trades in Securities to Customers. To the extent this is a report authored in whole or in part by a non-U.S. analyst and is made available in the U.S., the following
are important disclosures regarding any non-U.S. analyst contributors:
The non-U.S. research analysts listed below (if any) are not registered/qualified as research analysts with FINRA. The non-U.S. research analysts listed below may not be associated persons of SNYS and therefore may not be subject to the NASD Rule
2711 and NYSE Rule 472 restrictions on communications with a subject company, public appearances and trading securities held by a research analyst account.
Heidi Sternberg, Tim Clark, Non-U.S. Analyst(s) is a (are) research analyst(s) employed by SBG Securities.(Proprietary) Limited (“SBG Securities”).
Important Regional Disclosures
18DisclaimerSBG Securities (Proprietary) Limited (“SBG Sec”) is the name of the Equities Trading Division of the Standard Bank Group (“SB”) operating under its Corporate and Investment banking Division (“CIB”).
This report is not directed to, or intended for distribution to or use by, any person or entity who is a citizen or resident of or located in any locality, state, country or other jurisdiction where such distribution, publication, availability or use would be contrary
to law or regulation or which would subject SBG Sec to any registration or licensing requirement within such jurisdiction. All material presented in this report, unless specifically indicated otherwise, is under copyright to SBG Sec. None of the material, nor
its content, nor any copy of it, may be altered in any way, transmitted to, copied or distributed to any other party, without the prior express written permission of SBG Sec. All trademarks, service marks and logos used in this report are trademarks or
service marks or registered trademarks or service marks of SBG Sec or its affiliates.
The information, tools and material presented in this report are provided to you for information purposes only and are not to be used or considered as an offer or the solicitation of an offer to sell or to buy or subscribe for securities or other financial
instruments. SBG Sec may not have taken any steps to ensure that the securities referred to in this report are suitable for any particular investor. SBG Sec will not treat recipients as its customers by virtue of their receiving the report. The investments or
services contained or referred to in this report may not be suitable for you and it is recommended that you consult an independent investment advisor if you are in doubt about such investments or investment services. Nothing in this report constitutes
investment, legal, accounting or tax advice or a representation that any investment or strategy is suitable or appropriate to your individual circumstances or otherwise constitutes a personal recommendation to you. SBG Sec does not offer advice on the
tax consequences of investment and you are advised to contact an independent tax adviser. Please note in particular that the bases and levels of taxation may change.
SBG Sec believes the information and opinions in the Disclosure Appendix of this report are accurate and complete. Information and opinions presented in the other sections of the report were obtained or derived from sources SBG Sec believes are
reliable, but SBG Sec makes no representations as to their accuracy or completeness. Additional information is available upon request. SBG Sec accepts no liability for loss arising from the use of the material presented in this report, except that this
exclusion of liability does not apply to the extent that liability arises under specific statutes or regulations applicable to SBG Sec. This report is not to be relied upon in substitution for the exercise of independent judgment. SBG Sec may have issued, and
may in the future issue, a trading call regarding this security. In addition, SBG Sec may have issued, and may in the future issue, other reports that are inconsistent with, and reach different conclusions from, the information presented in this report. Those
reports reflect the different assumptions, views and analytical methods of the analysts who prepared them and SBG Sec is under no obligation to ensure that such other reports are brought to the attention of any recipient of this report. SBG Sec is
involved in many businesses that relate to companies mentioned in this report.
Past performance should not be taken as an indication or guarantee of future performance, and no representation or warranty, express or implied, is made regarding future performance. Information, opinions and estimates contained in this report reflect
a judgement at its original date of publication by SBG Sec and are subject to change without notice. The price, value of and income from any of the securities or financial instruments mentioned in this report can fall as well as rise. The value of securities
and financial instruments is subject to exchange rate fluctuation that may have a positive or adverse effect on the price or income of such securities or financial instruments. Investors in securities such as ADRs, the values of which are influenced by
currency volatility, effectively assume this risk.
Structured securities are complex instruments, typically involve a high degree of risk and are intended for sale only to sophisticated investors who are capable of understanding and assuming the risks involved. The market value of any structured security
may be affected by changes in economic, financial and political factors (including, but not limited to, spot and forward interest and exchange rates), time to maturity, market conditions and volatility, and the credit quality of any issuer or reference issuer.
Any investor interested in purchasing a structured product should conduct their own investigation and analysis of the product and consult with their own professional advisers as to the risks involved in making such a purchase.
Some investments discussed in this report have a high level of volatility. High volatility investments may experience sudden and large falls in their value causing losses when that investment is realised. Those losses may equal your original investment.
Indeed, in the case of some investments the potential losses may exceed the amount of initial investment, in such circumstances you may be required to pay more money to support those losses. Income yields from investments may fluctuate and, in
consequence, initial capital paid to make the investment may be used as part of that income yield. Some investments may not be readily realisable and it may be difficult to sell or realise those investments, similarly it may prove difficult for you to obtain
reliable information about the value, or risks, to which such an investment is exposed.
SBG Sec maintains information barriers between its Research Analysts and the rest of its and its shareholders business divisions, more specifically the Investment Banking business. SBG Sec’ analysts’, strategists’ and economists’ compensation is not
linked to Investment Banking or Capital Markets transactions performed by SBG Sec or its shareholders. Facts and views presented in SBG Sec’ research have not been reviewed by, and may not reflect information known to, professionals in other SBG
Sec or Standard Bank business areas, including investment banking personnel.This report may provide the addresses of, or contain hyperlinks to, websites. Except to the extent to which the report refers to website material of SBG Sec and SB, SBG Sec
has not reviewed the linked site and takes no responsibility for the content contained therein. Such address or hyperlink (including addresses or hyperlinks to SBG Sec or SB’s own website material) is provided solely for your convenience and
information and the content of the linked site does not in any way form part of this document. Accessing such website or following such link through this report shall be at your own risk.
This report is issued and distributed in Europe Standard Bank PLC. 20 Gresham Street, London EC2V 7JE which is authorised by the Prudential Regulation Authority (“PRA”) and regulated by the Prudential Regulation Authority (PRA “) and the
Financial Conduct Authority (“FCA”) This report is being distributed in the United States by Standard New York Securities (USA) LLC; in Kenya by CfC Stanbic Bank Limited; in Nigeria by Stanbic IBTC; in Angola by Standard Bank de Angola S.A.; in
Brazil by Banco Standard de Investimentos S.A.; in China by Standard Resources (China) Limited; in Botswana by Stanbic Bank Botswana Limited; in Democratic Republic of Congo by Stanbic Bank Congo s.a.r.l.; in Ghana by Stanbic Bank Ghana
Limited; in Isle of Man by Standard Bank Isle of Man Limited; in Jersey by Standard Bank Jersey Limited; in Madagascar by Union Commercial Bank S.A.; in Mozambique by Standard Bank s.a.r.l.; in Malawi by Standard Bank Limited; in Namibia by
Standard Bank Namibia Limited; in Mauritius by Standard Bank (Mauritius) Limited; in Taiwan by The Standard Bank of South Africa; in Tanzania by Stanbic Bank Tanzania Limited; in Singapore by Standard Merchant Bank (Asia) Limited; in Swaziland
by Standard Bank Swaziland Limited; in Zambia by Stanbic Bank Zambia Limited; in Zimbabwe by Stanbic Bank Zimbabwe Limited; in UAE by Standard Bank Plc – Dubai branch
In jurisdictions where SBG Sec is not already registered or licensed to trade in securities, transactions will only be effected in accordance with applicable securities legislation, which will vary from jurisdiction to jurisdiction and may require that the trade
be made in accordance with applicable exemptions from registration or licensing requirements.
All rights reserved. Any unauthorized use, duplication, redistribution or disclosure of this report (the “Product”), including, but not limited to, redistribution of the Product by electronic mail, posting of the Product on a website or page, and/or providing to a
third party a link to the Product, is prohibited by law and will result in prosecution. The information contained in the Product is intended solely for the recipient and may not be further distributed by the recipient to any third party. Where included in this
report, MSCI sourced information is the exclusive property of Morgan Stanley Capital International Inc. (MSCI). Without prior written permission of MSCI, this information and any other MSCI intellectual property may not be reproduced, redisseminated
or used to create any financial products, including any indices. This information is provided on an "as is" basis. The user assumes the entire risk of any use made of this information. MSCI, its affiliates and any third party involved in, or related to,
computing or compiling the information hereby expressly disclaim all warranties of originality, accuracy, completeness, merchantability or fitness for a particular purpose with respect to any of this information. Without limiting any of the foregoing, in no
event shall MSCI, any of its affiliates or any third party involved in, or related to, computing or compiling the information have any liability for any damages of any kind. MSCI, Morgan Stanley Capital International and the MSCI indexes are services marks
of MSCI and its affiliates. SBG Securities Proprietary Limited (“SBG Sec”) accepts no liability whatsoever for the actions of third parties. The document may provide the addresses of, or contain hyperlinks to, websites. Except to the extent to which the
document refers to website material of SBG Sec, SBG Sec has not reviewed the linked site. Equally, except to the extent to which the document refers to website material of SBG Sec, SBG Sec takes no responsibility for, and makes no representations
or warranties whatsoever as to, the data and information contained therein. Such address or hyperlink (including addresses or hyperlinks to website material of SBG Sec) is provided solely for your convenience and information and the content of the
linked site does not in anyway form part of this document. Accessing such website or following such link through the document or the website of SBG Sec shall be at your own risk and SBG Sec shall have no liability arising out of, or in connection with,
any such referenced website.
Please note that this report was originally prepared by SBG Sec for distribution to SBG Sec and SB market professionals and institutional investor customers. Recipients who are not market professionals or institutional investor customers of these firms
should seek the advice of their independent financial advisor prior to taking any investment decision based on this report or for any necessary explanation of its contents. This research may relate to investments or services of a person outside of the UK
or to other matters which are not regulated by the PRA or in respect of which the protections of the PRA for private customers and/or the UK compensation scheme may not be available, and further details as to where this may be the case are available
upon request in respect of this report.
Additional information is available upon request.
SBG Sec is a member of the JSE Limited.
Copyright 2014 SBG Sec. All rights reserved..


