Global dairy market outlook - DairyNZ - DairyNZ · 12.40 12.40 6.80 5.80 0.80 1.20 7.80 8.80 9.00...
27
Recovery and lessons Global dairy market outlook Tim Hunt General Manager Rabobank Food & Agribusiness Research 17 th May 2016
-
Upload
nguyenthien -
Category
Documents
-
view
219 -
download
2
Transcript of Global dairy market outlook - DairyNZ - DairyNZ · 12.40 12.40 6.80 5.80 0.80 1.20 7.80 8.80 9.00...
12.40
6.80
5.80
0.80
1.20
7.80
8.80
9.00
0.20
0.20
12.40 7.90
7.50
Guides for gutter
8.40
Recovery and lessons
Global dairy market outlook
Tim Hunt General Manager Rabobank Food & Agribusiness Research 17th May 2016

2
Food & Agribusiness Research and Advisory
Rabobank’s unique global team of 87 analysts – supporting knowledge based banking
3
Why has this gone on so long?
When might things improve?
Section 1
Section 2
Section 3
Section 4
Is the medium term still attractive?
Lessons from the cycle

4
Dairy commodities remain depressed
Source: USDA, MDC, Rabobank analysis
1,000
2,000
3,000
4,000
5,000
6,000
USD
/tonne F
OB
WMP (fob Oceania)
13 months
4 months
21 months +
Months spent below USD 3000/t

5
Recapping the problem: a predictable downward cycle exacerbated by short term stocks

6
Milk supply taps have proved hard to turn off
-4%
-2%
0%
2%
4%
6%
8%
2008
2009
2010
2011
2012
2013
2014
2015
2016
Production growth in key export regions
Period average
Month
ly Y
OY
7
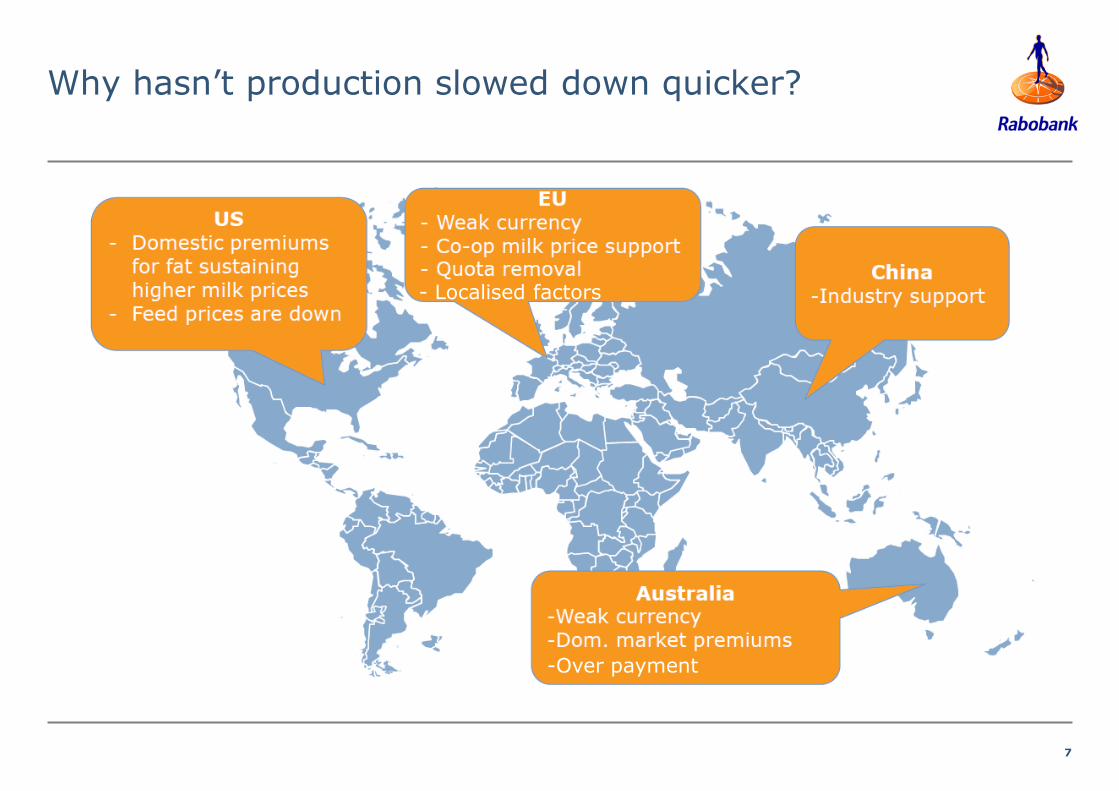
Why hasn’t production slowed down quicker?
-Over payment
- Localised factors

8
Beneath the surface…. things are changing

9
China has rebalanced
1. Milk production has stagnated
2. Consumption is slowly rising
3. Stocks are significantly reduced
4. Imports are stable/rising
10
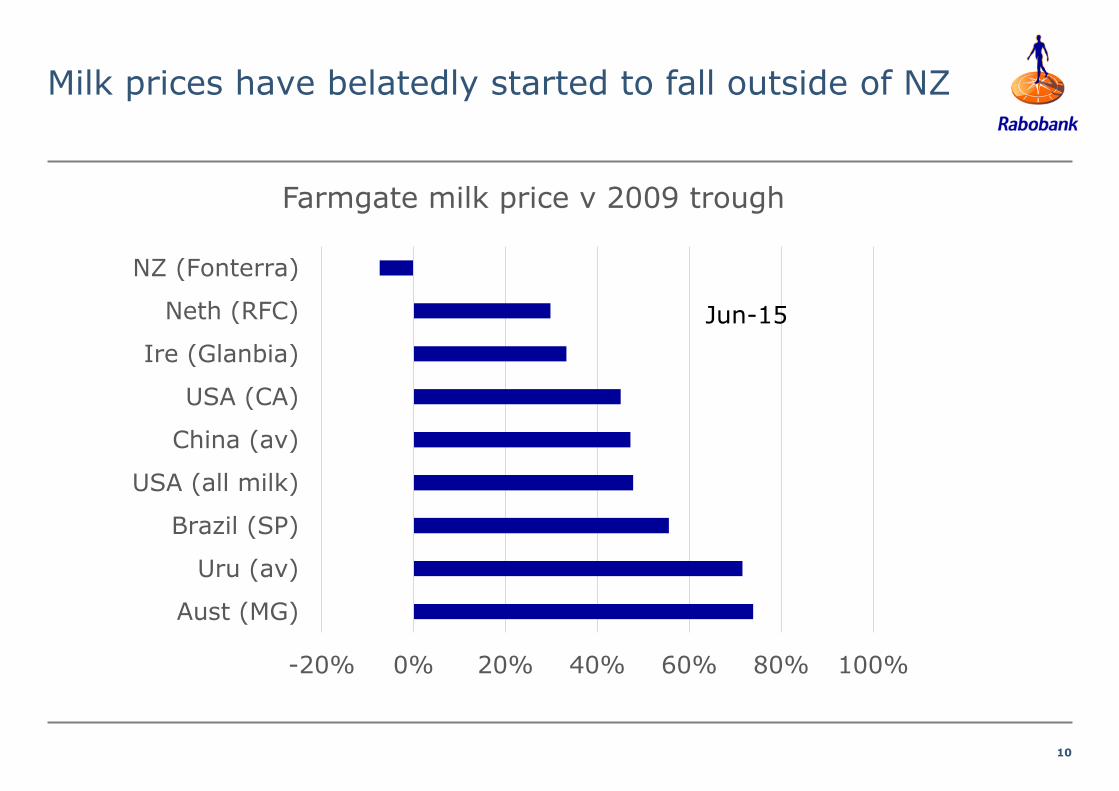
Milk prices have belatedly started to fall outside of NZ
-20% 0% 20% 40% 60% 80% 100%
Aust (MG)
Uru (av)
Brazil (SP)
USA (all milk)
China (av)
USA (CA)
Ire (Glanbia)
Neth (RFC)
NZ (Fonterra)
Farmgate milk price v 2009 trough
Jun-15
11
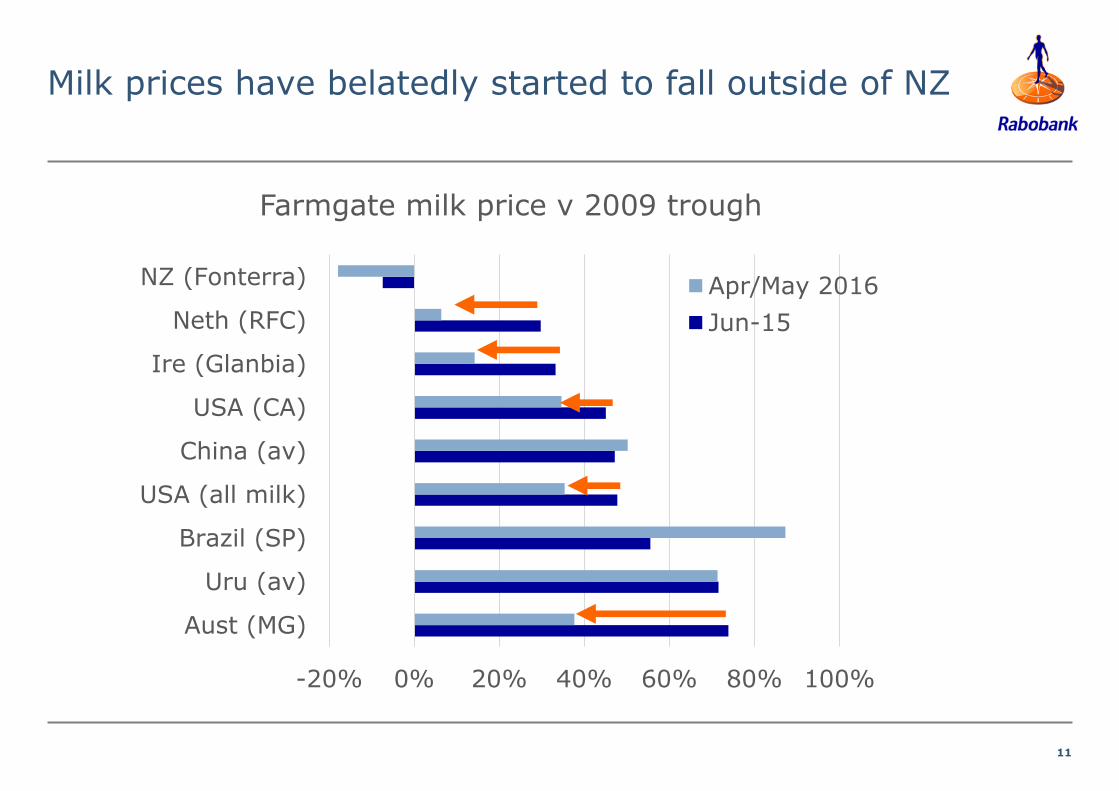
Milk prices have belatedly started to fall outside of NZ
-20% 0% 20% 40% 60% 80% 100%
Aust (MG)
Uru (av)
Brazil (SP)
USA (all milk)
China (av)
USA (CA)
Ire (Glanbia)
Neth (RFC)
NZ (Fonterra)
Farmgate milk price v 2009 trough
Apr/May 2016
Jun-15

12
Pain is now being shared
13
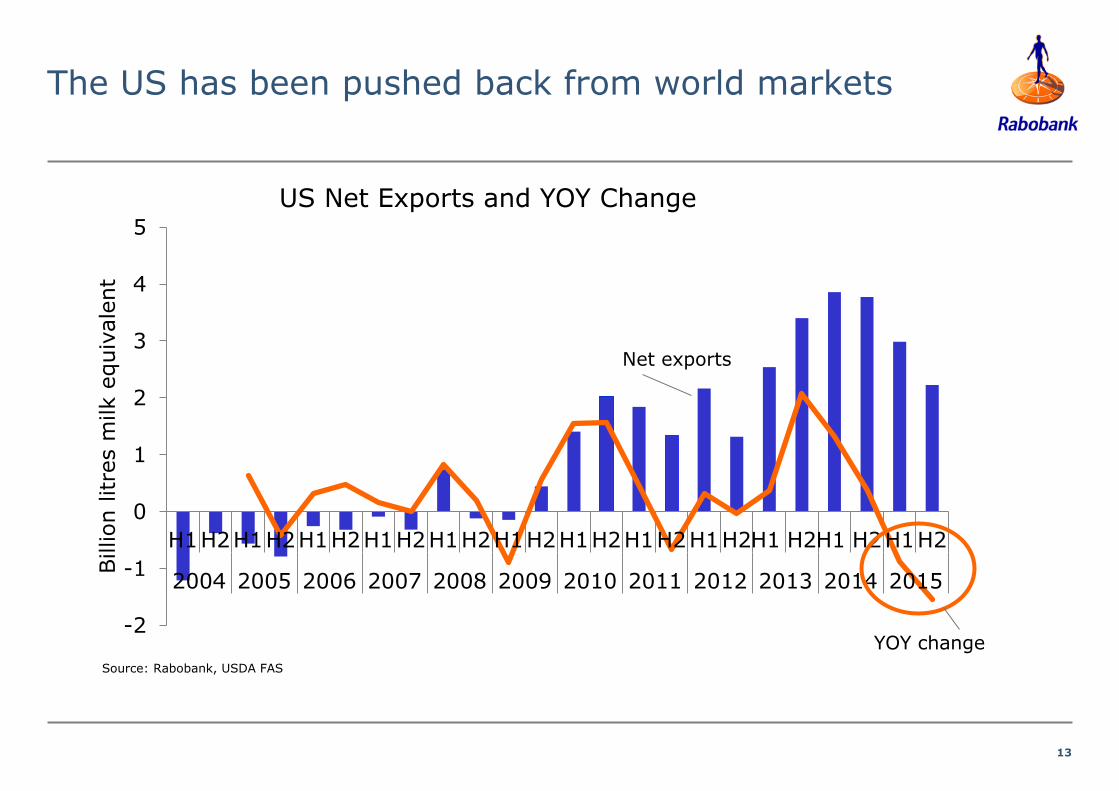
The US has been pushed back from world markets
-2
-1
0
1
2
3
4
5
H1H2H1H2H1H2H1H2H1H2H1H2H1H2H1H2H1H2H1 H2H1 H2H1H2
2004 2005 2006 2007 2008 2009 2010 2011 2012 2013 2014 2015
Billion litre
s m
ilk e
quiv
ale
nt
US Net Exports and YOY Change
Source: Rabobank, USDA FAS
Net exports
YOY change

14
Why has this gone on so long?
When might things improve?
Section 1
Section 2
Section 3
Section 4
Is the medium term still attractive?
Lessons from the cycle
15
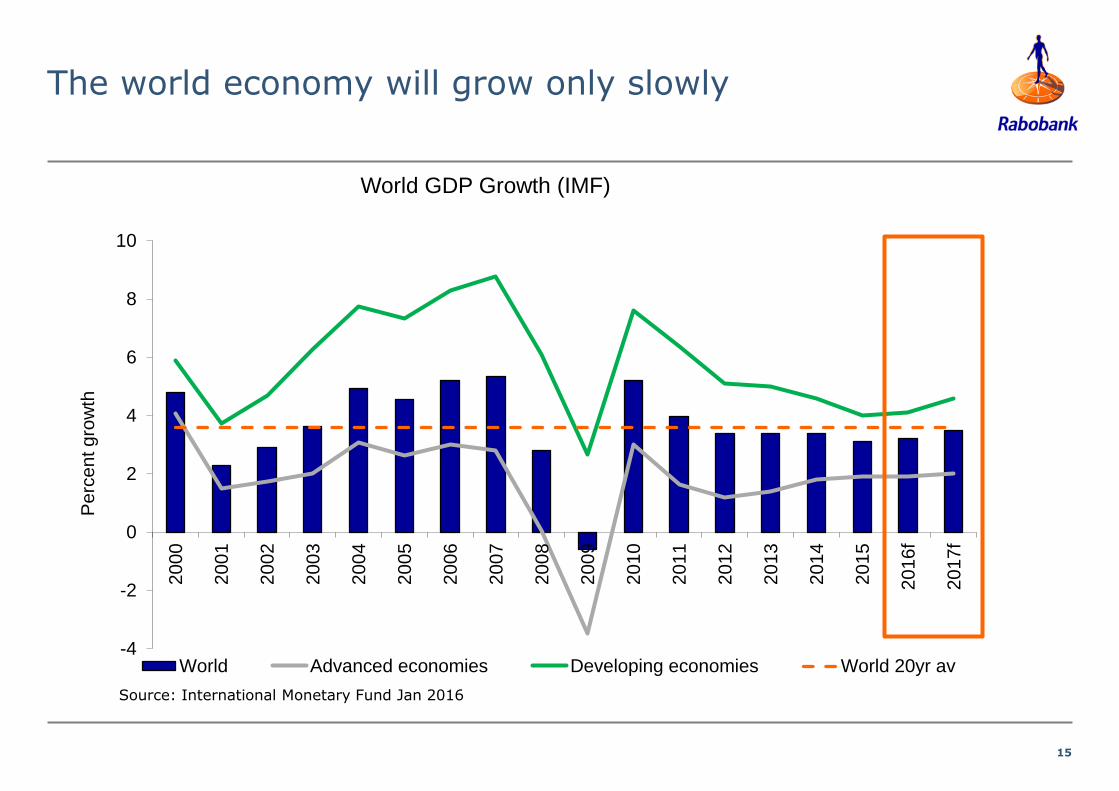
The world economy will grow only slowly
-4
-2
0
2
4
6
8
10
20
00
20
01
20
02
20
03
20
04
20
05
20
06
20
07
20
08
20
09
20
10
20
11
20
12
20
13
20
14
20
15
2016f
2017f
Pe
rce
nt g
row
th
World GDP Growth (IMF)
World Advanced economies Developing economies World 20yr av
Source: International Monetary Fund Jan 2016

16
Commodity feed will remain cheap

17
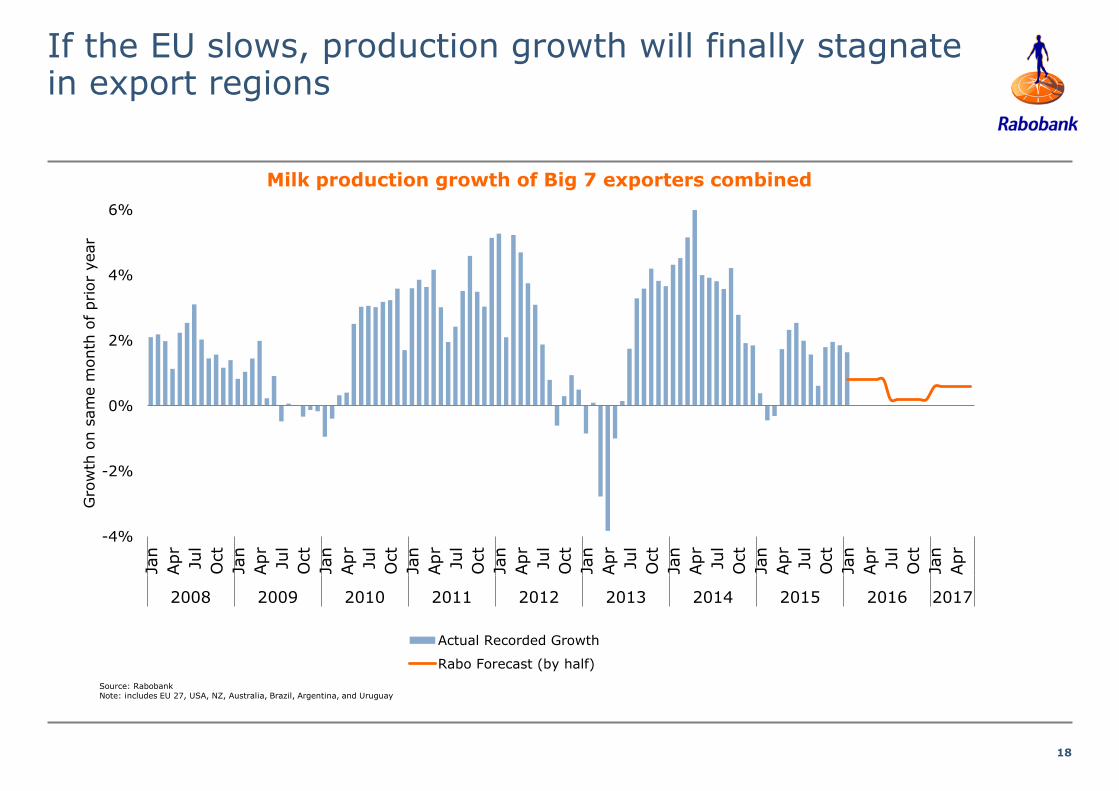
EU production will likely slow
From May we start to overlap the post quota period
Milk prices have now fallen below cash costs in many regions
Dutch no longer face a ‘phosphate incentive’ to hold cows
Ireland will remain an exception
18
-4%
-2%
0%
2%
4%
6%
Jan
Apr
Jul
Oct
Jan
Apr
Jul
Oct
Jan
Apr
Jul
Oct
Jan
Apr
Jul
Oct
Jan
Apr
Jul
Oct
Jan
Apr
Jul
Oct
Jan
Apr
Jul
Oct
Jan
Apr
Jul
Oct
Jan
Apr
Jul
Oct
Jan
Apr
2008 2009 2010 2011 2012 2013 2014 2015 2016 2017
Gro
wth
on s
am
e m
onth
of prior
year
Actual Recorded Growth
Rabo Forecast (by half)
If the EU slows, production growth will finally stagnate in export regions
Milk production growth of Big 7 exporters combined
Source: Rabobank Note: includes EU 27, USA, NZ, Australia, Brazil, Argentina, and Uruguay
19
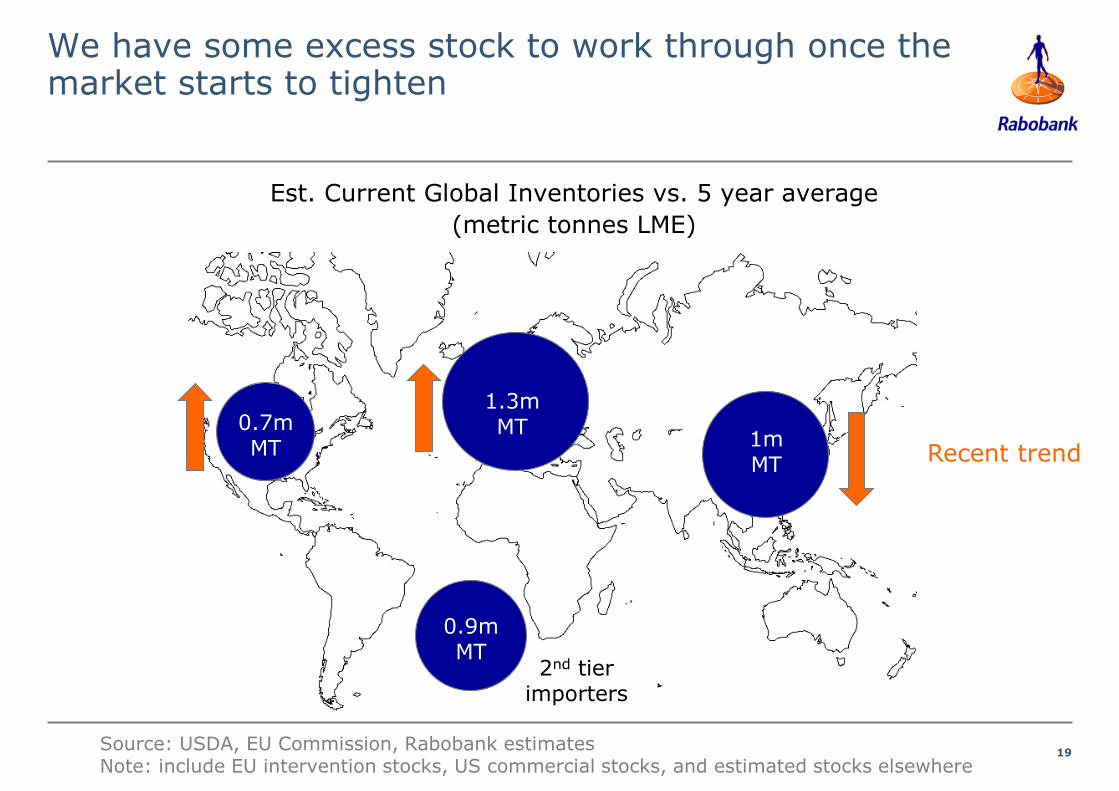
We have some excess stock to work through once the market starts to tighten
Source: USDA, EU Commission, Rabobank estimates Note: include EU intervention stocks, US commercial stocks, and estimated stocks elsewhere
0.9m MT
2nd tier importers
Est. Current Global Inventories vs. 5 year average
(metric tonnes LME)
0.7m MT
1.3m MT
1m MT
Recent trend
20
-
1,000
2,000
3,000
4,000
5,000
6,000Ja
n 2
006
Aug 2
006
Mar
2007
Oct
2007
May 2
008
Dec 2
008
Jul 2009
Feb 2
010
Sep 2
010
Apr
2011
Nov 2
011
Jun 2
012
Jan 2
013
Aug 2
013
Mar
2014
Oct
2014
May 2
015
Dec 2
015
Jul 2016
Feb 2
017
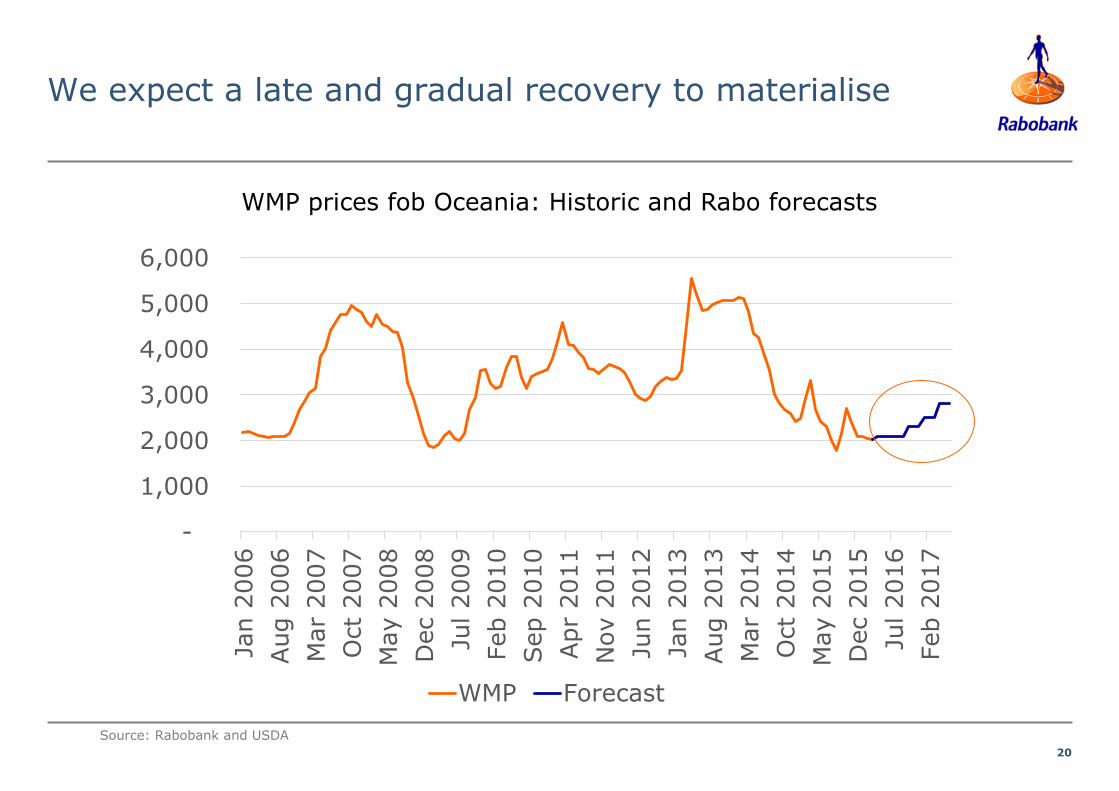
WMP Forecast
We expect a late and gradual recovery to materialise
Source: Rabobank and USDA
WMP prices fob Oceania: Historic and Rabo forecasts

21
Upside and downside dairy price risks exist
Russia reentering the market
Weather/disease
Further EU growth
USD appreciation
Upside Risk
Downside Risk
22
Why has this gone on so long?
When might things improve?
Section 1
Section 2
Section 3
Section 4
Is the medium term still attractive?
Lessons from the cycle
23
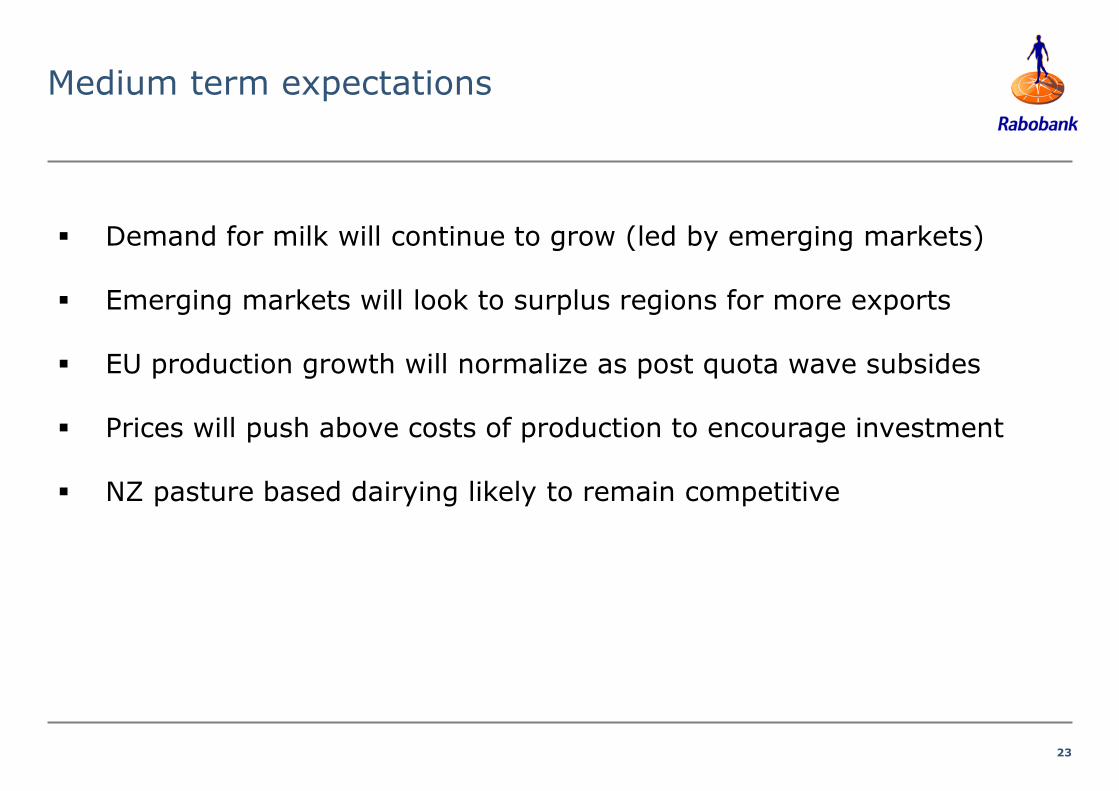
Medium term expectations
Demand for milk will continue to grow (led by emerging markets)
Emerging markets will look to surplus regions for more exports
EU production growth will normalize as post quota wave subsides
Prices will push above costs of production to encourage investment
NZ pasture based dairying likely to remain competitive
24
Why has this gone on so long?
When might things improve?
Section 1
Section 2
Section 3
Section 4
Is the medium term still attractive?
Lessons from the cycle
25
What have we learned from this latest downturn?
1. Economics are not everything in the short term
2. FTAs can only do so much
3. Sometimes its not enough to be the lowest cost producer
4. We probably carried too much debt/costs into this downturn (again)
26
Conclusions
We amidst a distressing ‘super cycle’: EU production now main concern
The protracted downturn looks likely to extend into 2016/17 season
Pricing will get substantially better in the medium term
This is our third major downturn since 2008: we will see them again
Its important we all learn what we can from this one
27
Contact details
Tim Hunt General Manager Food & Agribusiness Research and Advisory Australia and New Zealand [email protected]
“The financial link in the
global food chain”™