GLOBAL CURRENCY REPORT 2017 · 2017-09-30 · CURRENCY MATTERS 2017 RESIDENTIAL RESEARCH 5 GLOBAL...
6
GLOBAL CURRENCY MONITOR IMPLICATIONS OF A STRONG USD RESIDENTIAL RESEARCH GLOBAL CURRENCY REPORT 2017 ANALYSING THE IMPACT OF CURRENCY MOVEMENTS ON PRIME RESIDENTIAL MARKETS AROUND THE WORLD OPPORTUNITIES
Transcript of GLOBAL CURRENCY REPORT 2017 · 2017-09-30 · CURRENCY MATTERS 2017 RESIDENTIAL RESEARCH 5 GLOBAL...

GLOBAL CURRENCY MONITOR
IMPLICATIONS OF A STRONG USD
RESIDENTIAL RESEARCH
GLOBAL CURRENCY REPORT 2017ANALYSING THE IMPACT OF CURRENCY MOVEMENTS ON PRIME RESIDENTIAL MARKETS AROUND THE WORLD
OPPORTUNITIES
2
FIGURE 1
Strength of the US dollar Nominal broad effective exchange rate index The US dollar’s performance against key currencies
Source: Knight Frank Research, JP Morgan
90
95
100
105
110
115
120
125
130
‘05 ‘06 ‘07 ‘08 ‘09 ‘10 ‘11 ‘12 ‘13 ‘14 ‘15 ‘16 ‘17
21%Appreciation
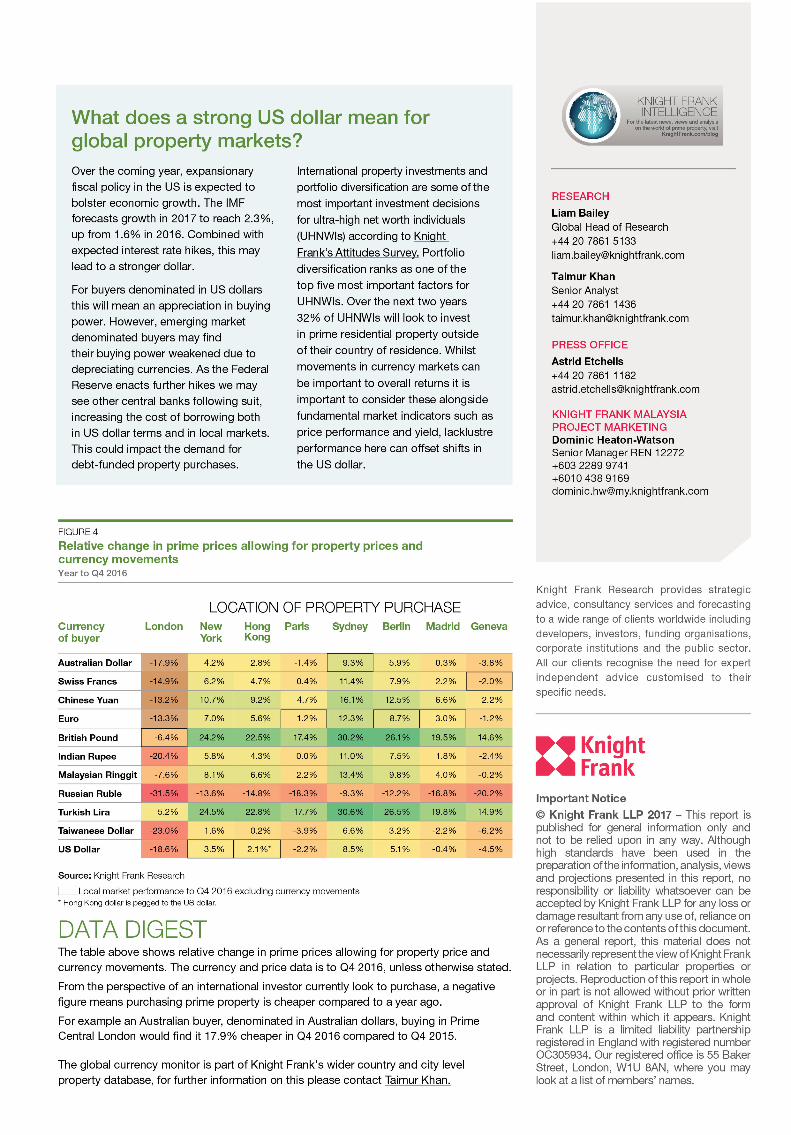
Currency market movements can have a significant impact on the flow of international capital into property markets
International buyers following a wait-and-see strategy in relation to the UK market ahead of Brexit are adopting a high risk strategy
British and Turkish investors saw the opportunity to realise the best returns in key global cities in the year to Q1 2017
In Q1 2017 Ruble-denominated buyers found it 28% cheaper to purchase in prime central London compared to a year earlier.
Currency movements are important to consider alongside fundamental market indicators such as price performance and yield
SUMMARY
TAIMUR KHAN Senior Analyst
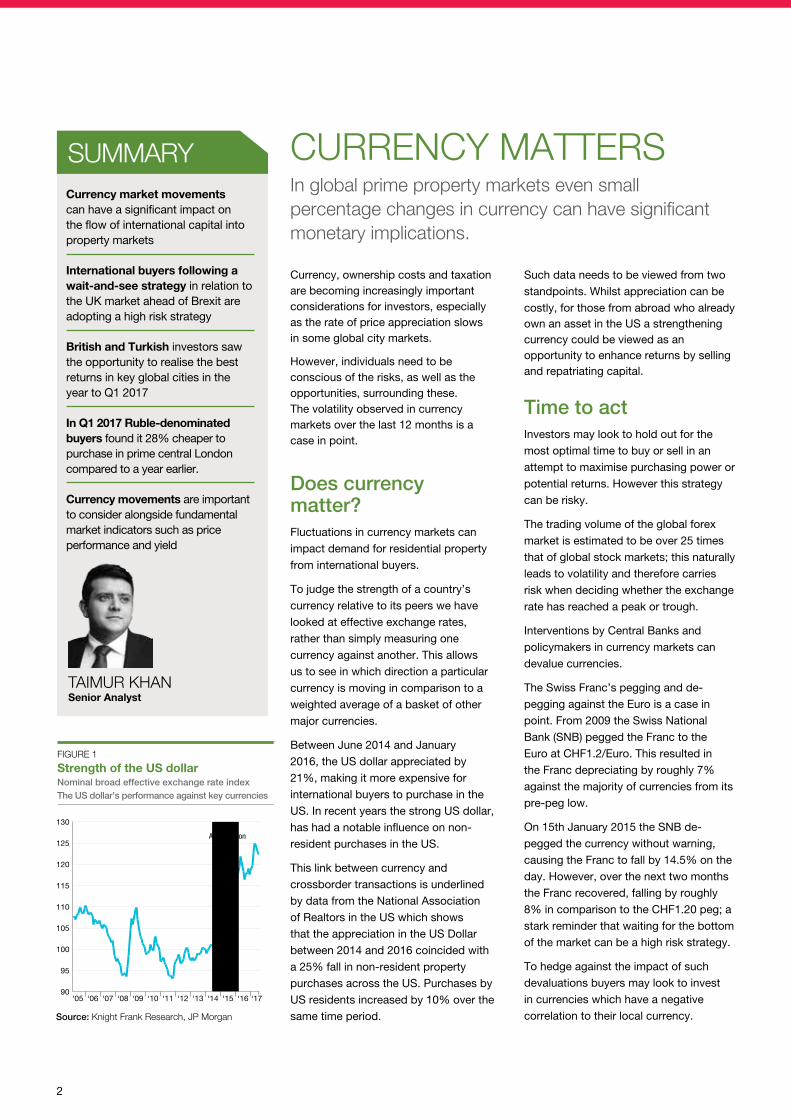
Currency, ownership costs and taxation are becoming increasingly important considerations for investors, especially as the rate of price appreciation slows in some global city markets.
However, individuals need to be conscious of the risks, as well as the opportunities, surrounding these. The volatility observed in currency markets over the last 12 months is a case in point.
Does currency matter?Fluctuations in currency markets can
impact demand for residential property
from international buyers.
To judge the strength of a country’s
currency relative to its peers we have
looked at effective exchange rates,
rather than simply measuring one
currency against another. This allows
us to see in which direction a particular
currency is moving in comparison to a
weighted average of a basket of other
major currencies.
Between June 2014 and January
2016, the US dollar appreciated by
21%, making it more expensive for
international buyers to purchase in the
US. In recent years the strong US dollar,
has had a notable influence on non-
resident purchases in the US.
This link between currency and
crossborder transactions is underlined
by data from the National Association
of Realtors in the US which shows
that the appreciation in the US Dollar
between 2014 and 2016 coincided with
a 25% fall in non-resident property
purchases across the US. Purchases by
US residents increased by 10% over the
same time period.
Such data needs to be viewed from two
standpoints. Whilst appreciation can be
costly, for those from abroad who already own an asset in the US a strengthening currency could be viewed as an opportunity to enhance returns by selling and repatriating capital.
Time to act Investors may look to hold out for the
most optimal time to buy or sell in an
attempt to maximise purchasing power or
potential returns. However this strategy
can be risky.
The trading volume of the global forex
market is estimated to be over 25 times
that of global stock markets; this naturally
leads to volatility and therefore carries
risk when deciding whether the exchange
rate has reached a peak or trough.
Interventions by Central Banks and
policymakers in currency markets can
devalue currencies.
The Swiss Franc’s pegging and de-
pegging against the Euro is a case in
point. From 2009 the Swiss National
Bank (SNB) pegged the Franc to the
Euro at CHF1.2/Euro. This resulted in
the Franc depreciating by roughly 7%
against the majority of currencies from its
pre-peg low.
On 15th January 2015 the SNB de-
pegged the currency without warning,
causing the Franc to fall by 14.5% on the
day. However, over the next two months
the Franc recovered, falling by roughly
8% in comparison to the CHF1.20 peg; a
stark reminder that waiting for the bottom
of the market can be a high risk strategy.
To hedge against the impact of such
devaluations buyers may look to invest
in currencies which have a negative
correlation to their local currency.
CURRENCY MATTERSIn global prime property markets even small percentage changes in currency can have significant monetary implications.

3
“ Whilst currency shifts can be significant, it is important to keep in mind the fundamentals which underpin the property market.”
Source: Knight Frank Research
0
20
40
60
80
100
120
140
160
140%135%
78% 78%
61% 58% 55%
40% 39% 37%
26%
USD
CHF
CNY
SGD
EUR
GBP
INR
MYR
AUD
TRY
RUB
5 Ye
ar %
cha
nge
Buyer-denominated currency
FIGURE 2
Which nationality has seen the strongest return from a property in Berlin in the last five years? Based on prime price and currency movements in five years to Dec 2016
GLOBAL CURRENCY MONITORKnight Frank’s Global Currency Monitor calculates real investment returns for international investors by combining changes in prime prices with currency shifts.
Whilst currency shifts can be significant, it is important to keep in mind the fundamentals which underpin property markets, these can be the most significant drivers of performance.
Taking Berlin’s five year returns as an example, of the six currencies that have outperformed the local market over the last five years, all have experienced sudden political or economic upheaval. The imposition of sanctions on Russia and the recovery in the price of oil has influenced the Ruble. Uncertainty underpinned by political instability (Malaysia and Turkey) and referendums (Turkey and the UK) have led to depreciations in these countries’ currencies.
After these sharp depreciations, buyers denominated in these currencies have been subject to a material fall in their buying power. On the other hand, existing investors who are looking to repatriate
their capital could use these deprecations as a method to enhance their returns.
The data digest on the back page provides additional city analysis on returns across key markets taking into account both currency and property market performance.
Currency shifts in markets are underpinned by several factors, the most significant being economic fundamentals, political and geopolitical risks and future expectations. From a stuttering global economic recovery to elections and referendums, 2016 provided numerous events of influence.
Annual returnsFrom the perspective of an investor looking to exit a market, British and Turkish homeowners abroad have seen the most significant returns over the last year, as a result of currency movements.
Sterling-denominated buyers who bought a prime property in Berlin in Q4 2015 and sold in Q4 2016 would have seen a 26% return and Turkish Lira-denominated buyers a 27% return. A Euro-denominated buyer would have realised a 9% return over the same time period.
GENEVA
UNITED STATES (USD)
-11.6%CHINA (CNY)
-5.8%
INDIA (INR)
-14.1%
AUSTRALIA (AUD)
-11.7%
TURKEY (TRY)
16.0%RUSSIA (RUB)
-28.3%
BRAZIL (BRL)
-20.2%
RUSSIA (RUB)
-24.9%
EUROPE (EUR)
-5.6%
CHINA (CNY)
5.1%
EUROPE (EUR)
1.6%
UK (GBP)
11.4%
TAIWAN (TWD)
-8.6%
TURKEY (TRY)
31.1% RUSSIA (RUB)
-22.7%
RUSSIA (RUB)
-19.1%
UAE (AED)
-4.6%
DUBAI
INDIA (INR)
-2.9%
UK (GBP)
13.1% UK (GBP)
7.8%
MALAYSIA (MYR)
13.2%
SWEDEN (SEK)
5.4%
EUROPE (EUR)
6.7% EUROPE (EUR)
1.7%
EUROPE (EUR)
6.7%
EUROPE (EUR)
6.5%
SOUTH AFRICA (ZAR)
-7.7%
NORWAY (NOK)
-1.8%
PAKISTAN (PKR)
0.0%
HONGKONG SYDNEY
UK (GBP)
13.3%
UK (GBP)
12.9%
SINGAPORE (SGD)
3.5%
SINGAPORE (SGD)
3.1%
HONG KONG (HKD)
0.4%
UNITED STATES (USD)
0.2%
AUSTRALIA (AUD)
-0.4%
SOUTH KOREA (KRW)
-1.8%
% Discount from Q1 2016 to Q1 2017 % Premium from Q1 2016 to Q1 2017
DENMARK (DKK)
1.7%
CHINA (CNY)
6.3%
LONDON NEW YORK
DUBAIGENEVA
HONG KONG SYDNEY
Source: Knight Frank Research
4
CURRENCY MATTERS 2017 RESIDENTIAL RESEARCH
GENEVA
UNITED STATES (USD)
-11.6%CHINA (CNY)
-5.8%
INDIA (INR)
-14.1%
AUSTRALIA (AUD)
-11.7%
TURKEY (TRY)
16.0%RUSSIA (RUB)
-28.3%
BRAZIL (BRL)
-20.2%
RUSSIA (RUB)
-24.9%
EUROPE (EUR)
-5.6%
CHINA (CNY)
5.1%
EUROPE (EUR)
1.6%
UK (GBP)
11.4%
TAIWAN (TWD)
-8.6%
TURKEY (TRY)
31.1% RUSSIA (RUB)
-22.7%
RUSSIA (RUB)
-19.1%
UAE (AED)
-4.6%
DUBAI
INDIA (INR)
-2.9%
UK (GBP)
13.1% UK (GBP)
7.8%
MALAYSIA (MYR)
13.2%
SWEDEN (SEK)
5.4%
EUROPE (EUR)
6.7% EUROPE (EUR)
1.7%
EUROPE (EUR)
6.7%
EUROPE (EUR)
6.5%
SOUTH AFRICA (ZAR)
-7.7%
NORWAY (NOK)
-1.8%
PAKISTAN (PKR)
0.0%
HONGKONG
SYDNEY
UK (GBP)
13.3%
UK (GBP)
12.9%
SINGAPORE (SGD)
3.5%
SINGAPORE (SGD)
3.1%
HONG KONG (HKD)
0.4%
UNITED STATES (USD)
0.2%
AUSTRALIA (AUD)
-0.4%
SOUTH KOREA (KRW)
-1.8%
% Discount from Q1 2016 to Q1 2017 % Premium rom Q1 2016 to Q1 2017
DENMARK (DKK)
1.7%
CHINA (CNY)
6.3%
LONDON NEW YORK
DUBAI GENEVA
HONG KONG SYDNEY
FIGURE 3
Global Currency Monitor
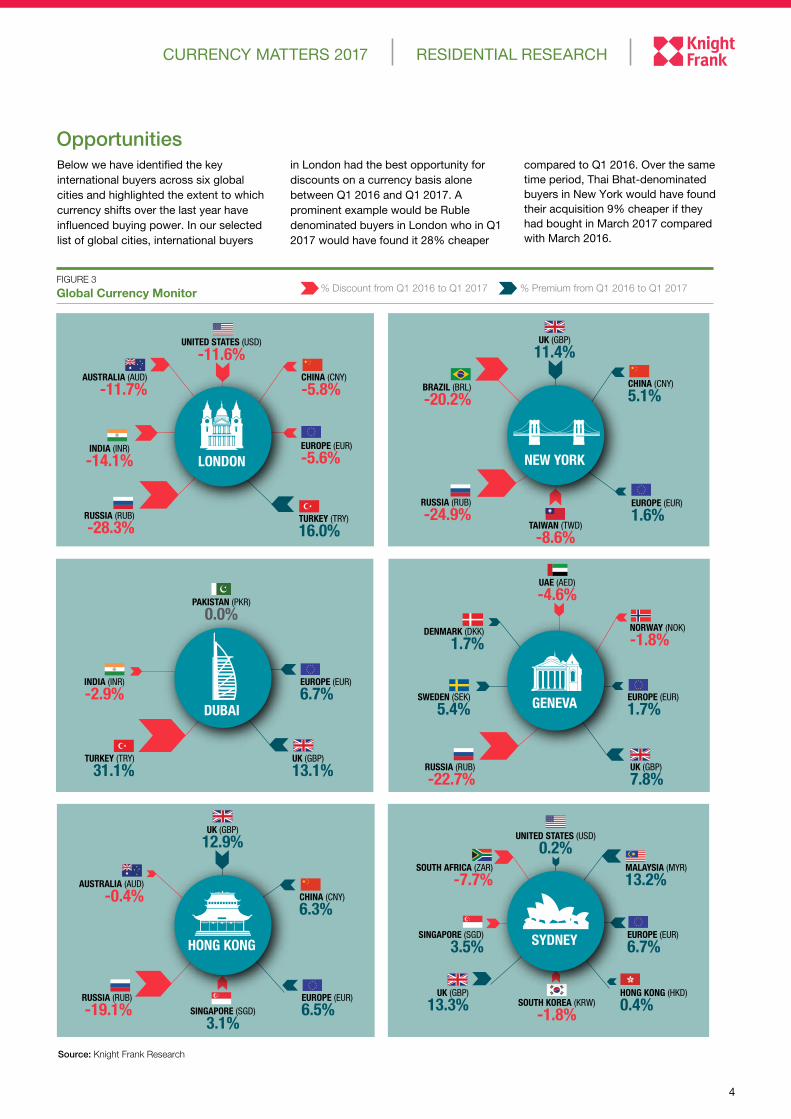
Below we have identified the key international buyers across six global cities and highlighted the extent to which currency shifts over the last year have influenced buying power. In our selected list of global cities, international buyers
Opportunitiesin London had the best opportunity for discounts on a currency basis alone between Q1 2016 and Q1 2017. A prominent example would be Ruble denominated buyers in London who in Q1 2017 would have found it 28% cheaper
compared to Q1 2016. Over the same time period, Thai Bhat-denominated buyers in New York would have found their acquisition 9% cheaper if they had bought in March 2017 compared with March 2016.

CURRENCY MATTERS 2017 RESIDENTIAL RESEARCH
5
GLOBAL ECONOMIC GROWTH
Slower than expected economic growth
Positive economic data from the US, Eurozone and Asia has surpassed expectations so far in 2017. However, there are several factors which will underpin the stability of this recovery. The pace of rate hikes, due to increasing inflationary pressure, may increase the cost of borrowing. Countercyclical fiscal policies could lead to a slowdown in employment and wages and influencing demand for prime residential property. This may slow lending, although higher rates may mean financial institutions are more willing to expand lending levels.
2 5 7
POLITICAL RISK
French, UK and German National Elections
Populist movements across Europe are contributing to uncertainty on a national level and in the EU. However this threat has subsided given recent election results in the Netherlands and France. Any loss of medium-term confidence and divestment as investors look to de-risk, could impact on housing market activity.
However, positive economic data in the EU and more stringent views on immigration by incumbent parties has reduced this risk to some degree and forced recoveries in currencies such as the Euro in recent times.
2 5 7
PROTECTIONISM Increased regulation of the property market and greater capital controls
In an effort to cool property markets policymakers have increasingly turned to regulation. The effectiveness of these regulations has always been a matter of debate; recently Vancouver and Singapore have softened previously introduced property regulations. Such political interventions in property markets can severely influence investment.
3 3 6
GEO-POLITICAL FACTORS
Increased political instability in Russia, the Syrian crisis and North Korea
Global tensions have continued to develop since the start of the year. Russia’s growing involvement in Syria and North Korea’s increased military rhetoric are moving up investors’ agendas. These factors are important to global trade and resulting sanctions can have a knock-on effect on trade routes, these could be detrimental to global economic growth and sentiment. 2 3 5
SCENARIO IMPACTRISK
Risk Monitor
Ones to watch
LIKE
LIHO
OD
IMPA
CT
RISK
SCO
RE
GLOBAL
The Risk Monitor provides our latest assessment of key risks to global residential markets. Our risk score, out of a maximum of 10, is based on two assessments, firstly our view of the likelihood of the described scenario occurring, and secondly the potential market impact. Both these elements are scored from one (low) to five (high), collectively contributing to our combined Risk Score.
HIGHEST RISK
LOWEST RISK37
7
7
10 6
5
9 5
6
8 4 2 1
Rising oil prices and therecovery of the Russian
economy has underpinned the strength of the Ruble. Loosening of sanctions imposed on Russia may lead to further appreciation of the Ruble.
Monetary easing, fiscal stimulusand structural reforms, dubbed
“Abenomics”, have been enacted to manoeuvre the economy out of two decades of stagnation. These policies have weakened the Yen substantially over the last five years.
Outcomes from the Dutch andFrench elections have stabilised the
Euro as results provide long-term certainty for the Eurozone. Improving economic indicators in Southern European countries have also supported the Euro.
OUTLOOKNumerous factors can affect a currency’s performance, below we outline some of the key risks and their potential impact.
The weak pound has attractedforeign investment into the UK
and in 2016 this was further buoyed by better than expected GDP growth which has led to an improved long-run outlook.
Interest rate hikes by the FederalReserve have contributed to a
stronger US dollar over the last year. President Trump’s proposed fiscal stimulus and tax cuts may further strengthen the US dollar.
In 2016 the Yuan joined the US dollar, the Euro, the yen and the
British pound in the IMF’s special drawing rights (SDR) basket, which determines currencies that countries can receive as part of IMF loans, seen as a major milestone.