Global Compensation Practices€¦ · Compensation plays an important role in global, complex...
23
Survey of WorldatWork Members • September 2004 Conducted by WorldatWork and Watson Wyatt Worldwide A WorldatWork Survey Brief Global Compensation Practices
Transcript of Global Compensation Practices€¦ · Compensation plays an important role in global, complex...
Survey of WorldatWork Members • September 2004Conducted by WorldatWork and Watson Wyatt Worldwide
A WorldatWork Survey Brief
Global CompensationPractices

About WorldatWork and WorldatWork Membership Surveys
WorldatWork is the world’s leading not-for-profit professional association dedicatedto knowledge leadership in compensation, benefits and total rewards. Founded in1955, WorldatWork focuses on disciplines associated with attracting, retaining andmotivating employees. In addition to providing professional affiliation,WorldatWork offers highly acclaimed certification (CCP®, CBPTM and GRP®) andeducation programs, the monthly workspan® magazine, online informationresources, surveys, publications, conferences, research and networking opportunities.
WorldatWork regularly surveys its membership of compensation, benefits and total rewards practitioners regarding currentissues and topics, best practices and common professional practices. The majority of WorldatWork members are at the man-ager responsibility level or higher, have more than 10 years of experience in the human resources profession, and work inthe corporate headquarters of a company based in North America with more than 1,000 employees. The association rou-tinely receives a voluntary response rate from members in the 15 percent to 20 percent range, a response rate that generallyensures the respondents are representative of the WorldatWork membership as a whole.
WorldatWork14040 N. Northsight Blvd.Scottsdale, Arizona 85260-3601480/922-2020Toll free: 877/951-9191Fax: 480/483-8352Toll-free fax: 866/816-2962www.worldatwork.org
About Watson Wyatt Worldwide Watson Wyatt is a global consulting firm focused on human capital andfinancial management. We specialize in three areas: employee benefits,human capital strategies and related technology solutions.
We combine human capital and financial expertise to deliver businesssolutions that drive shareholder value. Our consulting is grounded in the most extensive research in the busi-ness. This translates into unique perspectives and forward-thinking solutions.
Watson Wyatt has more than 6,000 associates in 30 countries. Corporate offices are in Reigate, England, andWashington, D.C., USA.
Copyright ©2004 WorldatWork. This content is licensed for use by purchasers solely for their own use and notfor resale or redistribution. No part of this article may be reproduced, excerpted or redistributed in any formwithout express written permission of WorldatWork and appropriate attribution.

2004 Global Compensation Practices Survey
WorldatWork and Watson Wyatt Worldwide, 2004
p. 1
Global Compensation PracticesSurvey Brief – September 2004
Survey of WorldatWork members by WorldatWork and Watson Wyatt Worldwide
Introduction
Compensation plays an important role in global, complex organizations. Whether compensation
is used to differentiate an organization from its competitors, to underscore internal consistency
from country-to-country, or to drive performance of the organization during economic
downturns, compensation’s role will continue to evolve and expand.
To that end, WorldatWork and Watson Wyatt Worldwide conducted a global compensation
survey to establish a benchmark for U.S. multinationals in three key areas: global compensation
structure and strategy, global tools and systems, and global compensation targets and vehicles.
While the survey report results confirm several long-held assumptions about global
compensation practices, it also reveals some emerging trends and areas for investigation.
Methodology
This report summarizes the results of a March 2004 survey conducted jointly by WorldatWork
and Watson Wyatt Worldwide. Surveys were sent electronically to a random sample of
WorldatWork members and Watson Wyatt clients. A total of 360 responses were received during
a two-week period. Sixty-five percent of responding organizations (n=230) reported having
operations outside of the U.S. and thus were able to complete the survey.
The demographic profile of the survey respondents is similar to that of the WorldatWork
membership as a whole. The typical WorldatWork member works at the managerial level or
higher in the headquarters of a large company in North America. Ninety-five percent of the
Fortune 1000 companies have at least one employee who is a member of WorldatWork.
2004 Global Compensation Practices Survey
WorldatWork and Watson Wyatt Worldwide, 2004
p. 2
Executive Summary
Global Compensation Structure and Strategy
The results of the Global Compensation Practices survey reveal that companies are evenly split
between a centralized and decentralized approach to their companies’ global compensation
structure. However, both groups expect to see a growing trend toward greater centralization in
the near term.
Specific findings include the following:
• For those respondents with a centralized compensation structure, the primary objectives
for having this type of structure are: 1) to have a consistent link between rewards and
results, and 2) to have a consistent position vis a vis market and internal equity.
• Those with a centralized global compensation structure reported much higher levels of
satisfaction and effectiveness than organizations with a decentralized structure. While a
combined 58 percent of companies with a centralized structure rated it as either “very” or
“mostly” effective, only a combined 36 percent of decentralized organizations rated the
effectiveness of their structure similarly.
• Half of survey respondents believe their organization will change its global compensation
management structure in the near future. Among those who already have a centralized
compensation management structure, nearly a quarter say they will become even more
centralized in the near future. Among those with currently decentralized structures, well
over one-half expect their organization to move toward more centralization in the next
two years.
• The vast majority of organizations with a centralized global compensation structure also
have a global compensation strategy. However, only about one-third of those
organizations have communicated the strategy to all line managers.
• Three quarters of survey respondents have operations in 11 or more countries around the
world. And over half of respondents reported that, regionally, Asia presents the most
challenges in developing a global compensation system.
Global Compensation Tools and Systems
Companies with a centralized approach to their global compensation practices are more likely
than others to have uniform systems, use global grades and global bands, and have designated
benchmark companies.
• Seventy-one percent of centralized organizations have a global human resource
information system (HRIS), while only 39 percent of organizations with a decentralized
global compensation structure have a global HRIS.

2004 Global Compensation Practices Survey
WorldatWork and Watson Wyatt Worldwide, 2004
p. 3
• Organizations with a centralized global compensation management structure are 12
percent more likely to use global grades and twice as likely as those with a decentralized
structure to have global bands (36 percent versus 18 percent).
• Among all respondents, 30 percent report having designated global benchmark
companies. Centralized organizations are twice as likely as decentralized organizations to
have global benchmark companies (40 percent versus 20 percent).
Global Compensation Targets and Vehicles
The survey results also reveal that most organizations are standardizing compensation strategy,
job leveling, target base salary and total compensation, as well as stock options.
• A strong majority of respondents use the 50th
percentile as the global target base salary
(73 percent) and the global target total cash compensation (58 percent) for employees.
The next most common answer to both questions was “varies by market.”
• Among surveyed organizations with equity vehicles, stock options are the equity tool
most commonly implemented globally, with 90 percent overall responding in the
affirmative. The second most common (at 55 percent overall) is employee stock purchase
plans, followed by restricted stock. And only 38 percent of organizations have
implemented performance share plans globally.
• The majority of survey respondents have a uniform, global approach to both short- and
long-term incentives and bonuses for executives and management, while less than one-
half have a uniform global approach for professional class employees. Those with
centralized organizational structures are more likely to push these vehicles down further
into the organization.
Other Global Compensation Issues
• Overall, two-thirds of survey respondents do not have a global approach to sales
compensation. However, organizations with a centralized global compensation approach
are twice as likely to have a global approach to sales compensation as organizations that
are decentralized in their compensation management structure (44 percent versus 22
percent).
• Nearly three-quarters of all survey respondents have a performance management system
in their organization that pervades all of their global operations. But organizations with
centralized compensation management are significantly more likely to also have a global
approach to performance management (87 percent versus 60 percent).

2004 Global Compensation Practices Survey
WorldatWork and Watson Wyatt Worldwide, 2004
p. 4
Detailed Survey Results
Geographic Reach of Survey Respondents
To gain insight on how truly “global” the survey respondents were, the instrument first asked
about the number of countries and regions in which respondents operate. It also asked about any
regions of the globe that are perceived as unique challenges from a compensation perspective.
The vast majority of surveyed companies (combined nearly three-quarters) have operations in 11
or more countries. The single largest category includes the respondents who have operations in
anywhere from 11 to 24 countries (26 percent).
Figure 1: “In how many countries does your organization currently have operations? (Please include
partially owned subsidiaries or partnerships.)” (n=227)
1 to 3
8%
50 or more
24%
25 to 49
24%
4 to 10
18%
11 to 24
26%
In addition to operating in many different countries, most of the survey respondents operate in
many different regions of the world. More than 85 percent have operations in Western Europe,
Asia and North America (excluding the U.S.). Sixty percent of respondents also have locations in
Australia/New Zealand, South America and Eastern Europe.
Figure 2: “Please indicate all regions in which your organization currently has operations.”
(multiple response, n=230)
Western Europe 90%
Asia 90%
North America (not including U.S.) 86%
Australia/New Zealand 68%
South America 67%
Eastern Europe 60%
Central America 56%
Middle East 47%
Africa 40%
2004 Global Compensation Practices Survey
WorldatWork and Watson Wyatt Worldwide, 2004
p. 5
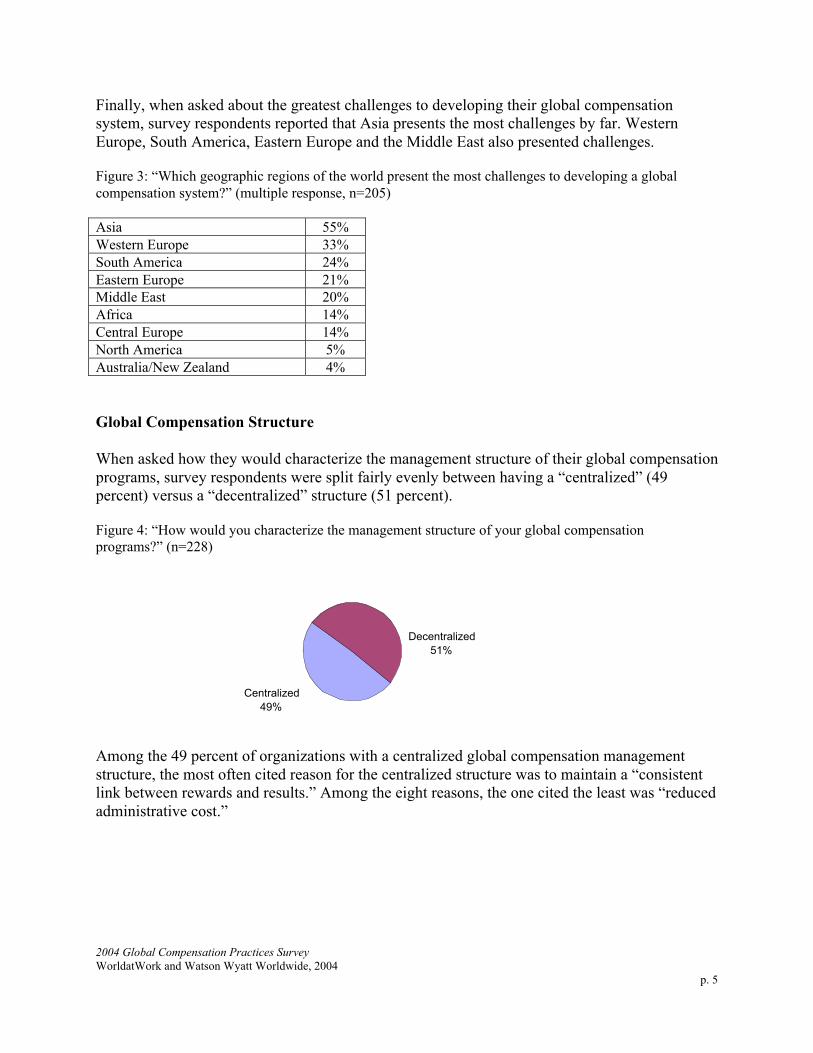
Finally, when asked about the greatest challenges to developing their global compensation
system, survey respondents reported that Asia presents the most challenges by far. Western
Europe, South America, Eastern Europe and the Middle East also presented challenges.
Figure 3: “Which geographic regions of the world present the most challenges to developing a global
compensation system?” (multiple response, n=205)
Asia 55%
Western Europe 33%
South America 24%
Eastern Europe 21%
Middle East 20%
Africa 14%
Central Europe 14%
North America 5%
Australia/New Zealand 4%
Global Compensation Structure
When asked how they would characterize the management structure of their global compensation
programs, survey respondents were split fairly evenly between having a “centralized” (49
percent) versus a “decentralized” structure (51 percent).
Figure 4: “How would you characterize the management structure of your global compensation
programs?” (n=228)
Centralized
49%
Decentralized
51%
Among the 49 percent of organizations with a centralized global compensation management
structure, the most often cited reason for the centralized structure was to maintain a “consistent
link between rewards and results.” Among the eight reasons, the one cited the least was “reduced
administrative cost.”

2004 Global Compensation Practices Survey
WorldatWork and Watson Wyatt Worldwide, 2004
p. 6
Figure 5: “What are the primary objectives of your centralized global compensation structure? (Please
rate on a scale of one to seven, with seven being most important.)”
Objective n Mean
Consistent link between rewards and results 122 5.75
Consistent position vs. market 122 5.66
Internal equity (comparability of opportunity) 120 5.58
Consistent link between rewards and behavior 122 5.41
Improved governance of rewards (stronger oversight) 123 5.03
Common culture 120 4.97
Talent mobility 121 4.30
Reduced administrative costs 120 3.97
Instead of being queried about the primary objectives of their structure, the organizations with a
decentralized global compensation management structure were asked about how their global
compensation programs are managed. The results reveal a significant variety of ways in which
organizations manage compensation when it is not managed from headquarters. While a
combined 56 percent manage global compensation at a geographic level (either country, region
or local), the single most common answer (30 percent) was that global compensation is managed
at a combination of geographic and business unit levels.
Figure 6: “If a decentralized global compensation structure exists, what is the unit of organization upon
which compensation management most often occurs?” (n=124)
Unit of Organization
Combination of geographic and business unit 30%
Geographic – country-specific 29%
Geographic – region (a cluster or group of countries) 21%
Business unit 11%
Geographic – local (city or sub-county area) 6%
Other 3%
Fifty-four percent of respondents listed headquarters as the part of the organization responsible
for setting local or country-specific compensation strategies. But — perhaps understandably —
there is significant disparity on this question between those who had earlier reported a
centralized global compensation structure and those who had reported a decentralized global
compensation structure. (See Figures 7a and 7b.)
Seventy-one percent of the organizations with a centralized global compensation structure also
said their “headquarters” sets the local or country-specific compensation strategy, while
“headquarters” was mentioned half as frequently (by 36 percent) by organizations with a
decentralized global compensation structure. Among organizations with decentralized global
compensation structures, business units, regional offices and country/local offices play a much
more significant role in setting local compensation strategy.

2004 Global Compensation Practices Survey
WorldatWork and Watson Wyatt Worldwide, 2004
p. 7
Figure 7a: “For your operations outside of the U.S., which of the following groups is primarily
responsible for setting local or country-specific compensation strategy?”
Organizations with a
“centralized” global
compensation structure
(n=111)
Organizations with a
“decentralized” global
compensation structure
(n=117)
All respondents
(n=229)
Headquarters 71% 36% 54%
Business unit(s) 6% 21% 14%
Regional office(s) 10% 18% 14%
Country/local office(s) 3% 12% 7%
It varies 10% 13% 11%
After the compensation strategy is set, responsibility for setting the policies and procedures to
implement the strategy becomes less centralized – even among organizations with a centralized
global compensation structure. Among all respondents, the responsibility of “local offices” goes
from 7 percent in the setting of strategy to 14 percent in the setting of policies and procedures,
and both the business unit and regional offices take greater responsibility.
As noted in Figure 7a, 71 percent of organizations with a centralized global compensation
structure set their country-specific compensation strategies at headquarters, but only 45 percent
set their local compensation policies and procedures at headquarters (see Figure 7b). Regional
offices play a much larger role in local policies and procedures, even for organizations with
centralized global compensation structures.
As might be expected, for decentralized global compensation organizations, headquarters plays a
minor role in setting local compensation policies and procedures. Only 11 percent of
decentralized organizations have headquarters involved in this process. Among the decentralized
group, business units and regional offices play the most significant roles.
Figure 7b: “For your operations outside of the U.S., which of the following groups is primarily
responsible for setting local compensation policies and procedures?”
Organizations with a
“centralized” global
compensation structure
(n=111)
Organizations with a
“decentralized” global
compensation structure
(n=116)
All respondents
(n=229)
Headquarters 45% 11% 28%
Business unit(s) 10% 28% 19%
Regional office(s) 22% 28% 25%
Country/local office(s) 9% 20% 14%
It varies 14% 12% 14%
2004 Global Compensation Practices Survey
WorldatWork and Watson Wyatt Worldwide, 2004
p. 8
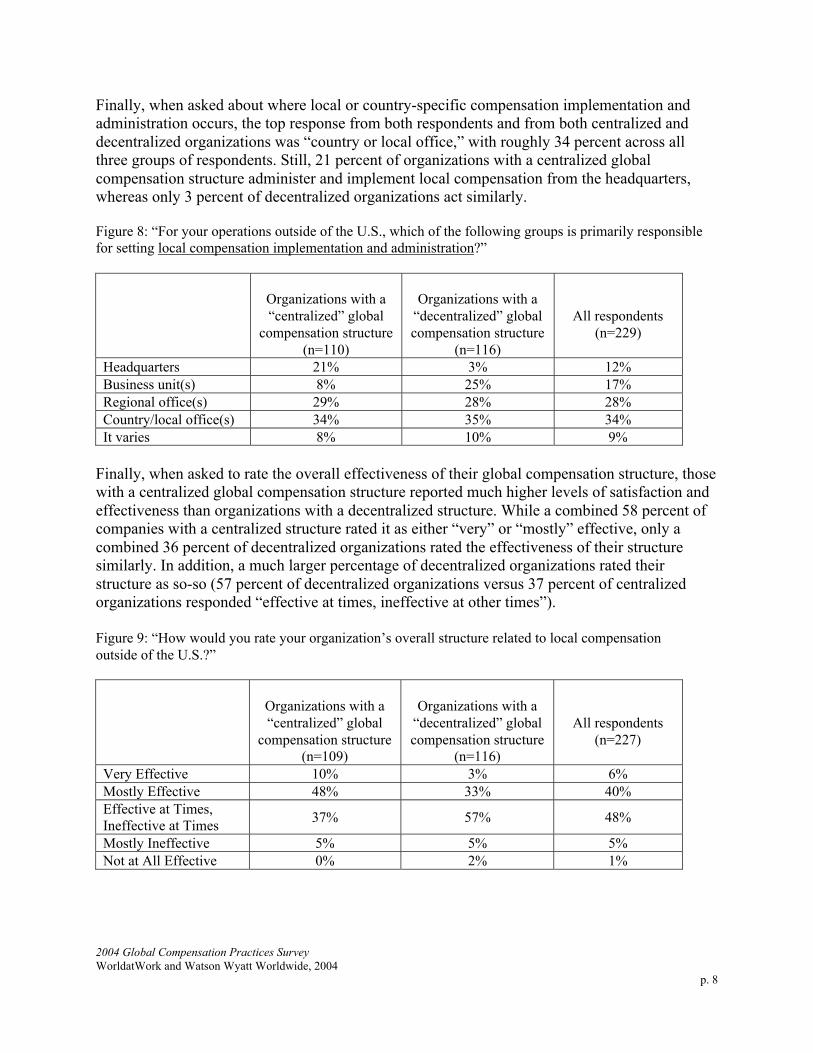
Finally, when asked about where local or country-specific compensation implementation and
administration occurs, the top response from both respondents and from both centralized and
decentralized organizations was “country or local office,” with roughly 34 percent across all
three groups of respondents. Still, 21 percent of organizations with a centralized global
compensation structure administer and implement local compensation from the headquarters,
whereas only 3 percent of decentralized organizations act similarly.
Figure 8: “For your operations outside of the U.S., which of the following groups is primarily responsible
for setting local compensation implementation and administration?”
Organizations with a
“centralized” global
compensation structure
(n=110)
Organizations with a
“decentralized” global
compensation structure
(n=116)
All respondents
(n=229)
Headquarters 21% 3% 12%
Business unit(s) 8% 25% 17%
Regional office(s) 29% 28% 28%
Country/local office(s) 34% 35% 34%
It varies 8% 10% 9%
Finally, when asked to rate the overall effectiveness of their global compensation structure, those
with a centralized global compensation structure reported much higher levels of satisfaction and
effectiveness than organizations with a decentralized structure. While a combined 58 percent of
companies with a centralized structure rated it as either “very” or “mostly” effective, only a
combined 36 percent of decentralized organizations rated the effectiveness of their structure
similarly. In addition, a much larger percentage of decentralized organizations rated their
structure as so-so (57 percent of decentralized organizations versus 37 percent of centralized
organizations responded “effective at times, ineffective at other times”).
Figure 9: “How would you rate your organization’s overall structure related to local compensation
outside of the U.S.?”
Organizations with a
“centralized” global
compensation structure
(n=109)
Organizations with a
“decentralized” global
compensation structure
(n=116)
All respondents
(n=227)
Very Effective 10% 3% 6%
Mostly Effective 48% 33% 40%
Effective at Times,
Ineffective at Times37% 57% 48%
Mostly Ineffective 5% 5% 5%
Not at All Effective 0% 2% 1%
2004 Global Compensation Practices Survey
WorldatWork and Watson Wyatt Worldwide, 2004
p. 9
In addition to the higher perceived effectiveness of centralized global compensation structures,
the data appears to indicate a trend toward centralization. When asked whether they believe their
organization, during the next two years, will not change structure, change to a more centralized
structure or change to a more decentralized structure, 42 percent of all survey participants
responded, “change to more centralized.” Even more revealing, however, is the data split by
organizations that had already reported a centralized or decentralized global structure. Among
those who already have a centralized structure, nearly a quarter (23 percent) say they will
probably become even more centralized in the near future. Among those who currently have a
decentralized structure, 59 percent expect their organization to move toward more centralization
in the next 24 months.
Figure 10: “Do you believe your organization will shift to a more centralized structure, a more
decentralized structure, or will make no change to the structure during the next two years?”
Organizations with a
“centralized” global
compensation structure
(n=108)
Organizations with a
“decentralized” global
compensation structure
(n=117)
All respondents
(n=227)
More Centralized 23% 59% 42%
More Decentralized 15% 2% 8%
No Change 62% 39% 50%
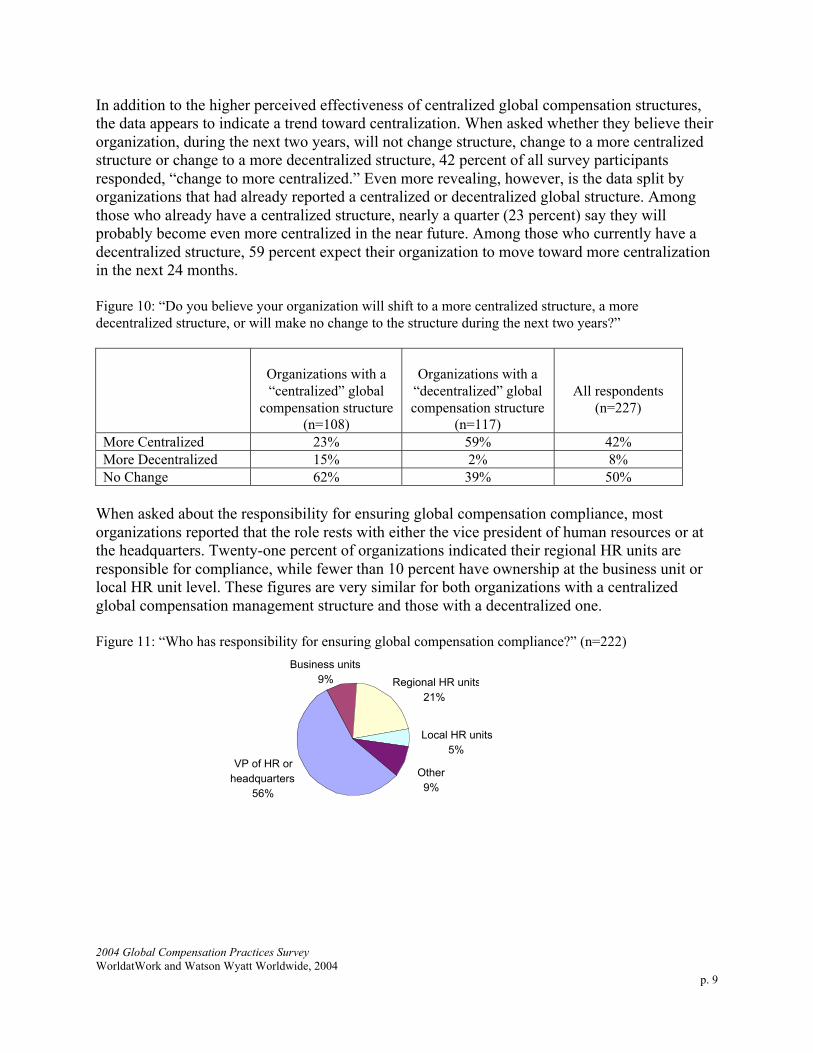
When asked about the responsibility for ensuring global compensation compliance, most
organizations reported that the role rests with either the vice president of human resources or at
the headquarters. Twenty-one percent of organizations indicated their regional HR units are
responsible for compliance, while fewer than 10 percent have ownership at the business unit or
local HR unit level. These figures are very similar for both organizations with a centralized
global compensation management structure and those with a decentralized one.
Figure 11: “Who has responsibility for ensuring global compensation compliance?” (n=222)
VP of HR or
headquarters
56%
Other
9%
Local HR units
5%
Business units
9% Regional HR units
21%

2004 Global Compensation Practices Survey
WorldatWork and Watson Wyatt Worldwide, 2004
p. 10
Global Compensation Tools
A. Global Tools for Line Managers
According to survey respondents, the tools that line managers use for making pay decisions in
organizations with decentralized global compensation structures are not global tools. That is, 73
percent use local tools. In contrast, more than one-half of the organizations (54 percent) with a
centralized global compensation structure provide their line managers with tools that are used
globally within the organization.
Figure 12: “Are the tools your line managers use for pay decisions global tools?”
Organizations with
a “centralized”
global compensation
structure (n=110)
Organizations with a
“decentralized”
global compensation
structure
(n=117)
All respondents
(n=229)
Yes 54% 27% 39%
No 46% 73% 61%
B. Global Leveling Approach
When asked whether their organization uses a global leveling approach, a combined 62 percent
majority responded affirmatively. The largest percentage within this group use whole job slotting
(21 percent), and the second most common approach is role/contribution/framework (19
percent). Thirty-eight percent do not use a global leveling approach.
Figure 13: “Does your organization use a global leveling approach (e.g. point factor,
role/contribution, etc.)?”
Organizations with a
“centralized” global
compensation structure
(n=110)
Organizations with a
“decentralized” global
compensation structure
(n=117)
All respondents
(n=229)
No 30% 48% 38%
Yes, point factor 13% 8% 11%
Yes, whole job slotting 31% 12% 21%
Yes, role/contribution/
framework19% 19% 19%
Yes, other 7% 13% 11%

2004 Global Compensation Practices Survey
WorldatWork and Watson Wyatt Worldwide, 2004
p. 11
C. Global Grades and Global Bands
Across all respondents, 35 percent use global grades (not currency) that are consistent from
country to country, and slightly more than one-quarter (27 percent) use global bands.
Substantially more centralized organizations than decentralized ones use both global grades and
bands. Organizations with a centralized global compensation function are 12 percent more likely
to use global grades and twice as likely as decentralized ones to have global bands (36 percent
versus 18 percent).
Figure 14: “Does your organization have global grades? Does your organization have global bands?”
Organizations with a
“centralized” global
compensation structure
Organizations with a
“decentralized” global
compensation structure
All respondents
Global Grades (n=111) (n=117) (n=229)
Yes 41% 29% 35%
No 59% 71% 65%
Global Bands (n=111) (n=116) (n=229)
Yes 36% 18% 27%
No 64% 82% 73%
D. Global Benchmarks
Among all respondents, 30 percent have designated global benchmark companies. Noteworthy,
however, is the significant disparity on this question between companies with a centralized
global compensation structure and those with decentralized ones. Centralized organizations are
twice as likely as decentralized organizations to have global benchmark companies (40 percent
versus 20 percent).
Figure 15: “Does your organization have global benchmark companies?”
Organizations with a
“centralized” global
compensation structure
(n=111)
Organizations with a
“decentralized” global
compensation structure
(n=115)
All respondents
(n=228)
Yes 40% 20% 30%
No 60% 80% 70%
The survey probed further among respondents who do not have global benchmark companies,
asking them if the benchmarks are set at either the regional or country level. Although the
number of respondents who answered the question is fairly small, the results indicate that
organizations with decentralized global compensation structures are far more likely to use
regional benchmarks, as opposed to country benchmarks, than are centralized organizations.

2004 Global Compensation Practices Survey
WorldatWork and Watson Wyatt Worldwide, 2004
p. 12
Figure 16: “If no, are benchmark companies chosen at a regional or country level?”
Organizations with a
“centralized” global
compensation structure
(n=45)
Organizations with a
“decentralized” global
compensation structure
(n=79)
Regional 18% 33%
Country 82% 67%
E. HRIS
Not surprisingly, companies with a centralized global compensation structure are far more likely
to have a human resources information system (HRIS) that is global in nature and covers most or
all of their global operations. Seventy-one percent of centralized organizations have a global
HRIS, while only 39 percent of organizations with a decentralized global compensation structure
have a global HRIS.
Figure 17: “Is your human resources information system (HRIS) a global system covering most or all of
your operations?”
Organizations with a
“centralized” global
compensation
structure (n=110)
Organizations with a
“decentralized” global
compensation
structure
(n=115)
All respondents
(n=227)
Yes 71% 39% 55%
No 29% 61% 45%
Among the 55 percent of surveyed organizations that have a global HRIS, the largest percentage
use PeopleSoft (38 percent), followed by SAP (22 percent) and Oracle (16 percent). Among the
other responses given by 14 percent of respondents, the most common were ADP, Ceridian and
JDE.
Figure 18: “If your HRIS is a global system covering most or all of your operations, what type of HRIS
program do you use?” (n=136)
PeopleSoft 38%
SAP 22%
Oracle 16%
Other 14%
Lawson 6%
Internal 4%

2004 Global Compensation Practices Survey
WorldatWork and Watson Wyatt Worldwide, 2004
p. 13
F. Total Compensation Statements
Organizations with a centralized global compensation structure are more than twice as likely as
decentralized organizations to provide identical or nearly identical total compensation statements
to all employees globally (28 percent versus 13 percent).
Figure 19: “Does your organization provide identical (or nearly identical) total compensation statements
to employees on a global basis?”
Organizations with a
“centralized” global
compensation structure
(n=110)
Organizations with a
“decentralized” global
compensation structure
(n=116)
All respondents
(n=228)
Yes 28% 13% 20%
No 72% 87% 80%
Global Compensation Targets and Vehicles
A. Target Global Base Salary
A strong majority of respondents use the 50th
percentile as the global target base salary (73
percent) and the global target total cash compensation (58 percent) for employees. The next most
common response to both questions is “varies by market.”
Splitting the data by centralized or decentralized global compensation structures did not provide
much variation in the data, so those data are not presented in Figure 20.
Figure 20: Global target for base salary and total cash compensation
6% 1%
73%
18%
2%0%
20%12%
58%
10%
0%
20%
40%
60%
80%
100%
No target 25th
percentile
50th
percentile
75th
percentile
Varies by
market
Global target
base salary
(n = 227)
Global target
total cash
compensation
(n = 222)
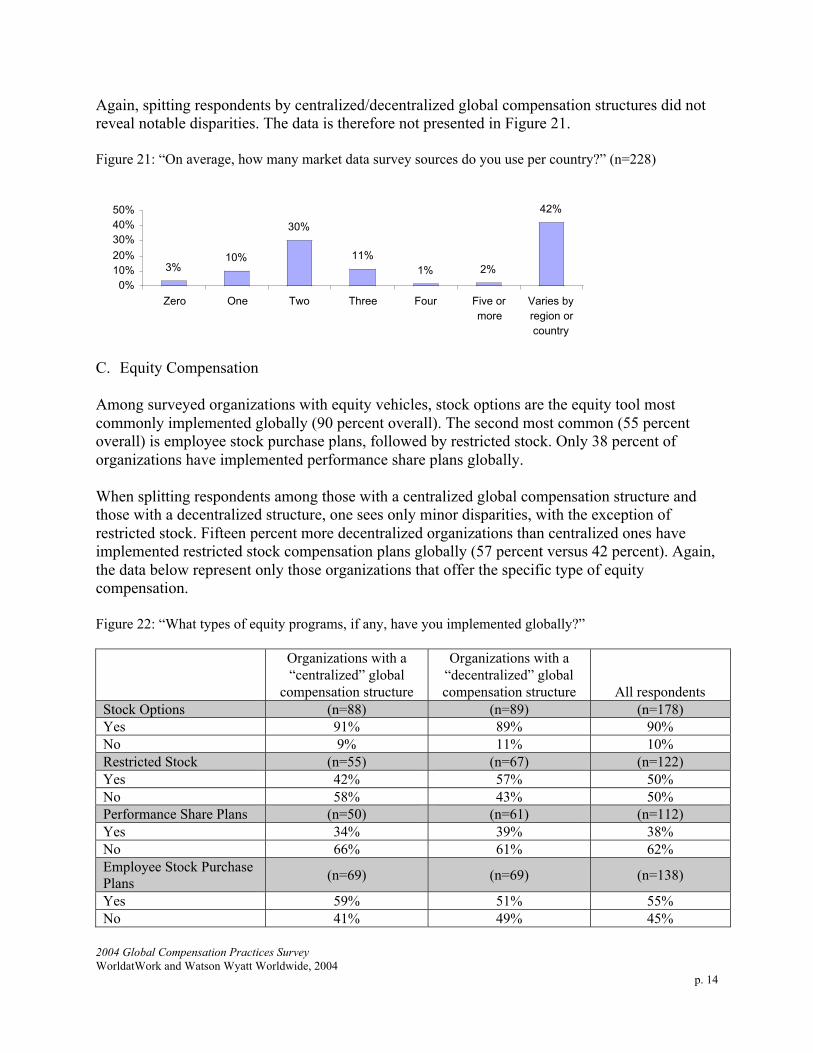
B. Market Data Survey Sources
For 42 percent of respondents, the number of market data survey sources their organization uses
varies by country or region. However, nearly one-half uses two or more survey sources per
country.
2004 Global Compensation Practices Survey
WorldatWork and Watson Wyatt Worldwide, 2004
p. 14
Again, spitting respondents by centralized/decentralized global compensation structures did not
reveal notable disparities. The data is therefore not presented in Figure 21.
Figure 21: “On average, how many market data survey sources do you use per country?” (n=228)
3%10%
30%
11%
1% 2%
42%
0%
10%
20%
30%
40%
50%
Zero One Two Three Four Five or
more
Varies by
region or
country
C. Equity Compensation
Among surveyed organizations with equity vehicles, stock options are the equity tool most
commonly implemented globally (90 percent overall). The second most common (55 percent
overall) is employee stock purchase plans, followed by restricted stock. Only 38 percent of
organizations have implemented performance share plans globally.
When splitting respondents among those with a centralized global compensation structure and
those with a decentralized structure, one sees only minor disparities, with the exception of
restricted stock. Fifteen percent more decentralized organizations than centralized ones have
implemented restricted stock compensation plans globally (57 percent versus 42 percent). Again,
the data below represent only those organizations that offer the specific type of equity
compensation.
Figure 22: “What types of equity programs, if any, have you implemented globally?”
Organizations with a
“centralized” global
compensation structure
Organizations with a
“decentralized” global
compensation structure All respondents
Stock Options (n=88) (n=89) (n=178)
Yes 91% 89% 90%
No 9% 11% 10%
Restricted Stock (n=55) (n=67) (n=122)
Yes 42% 57% 50%
No 58% 43% 50%
Performance Share Plans (n=50) (n=61) (n=112)
Yes 34% 39% 38%
No 66% 61% 62%
Employee Stock Purchase
Plans(n=69) (n=69) (n=138)
Yes 59% 51% 55%
No 41% 49% 45%
2004 Global Compensation Practices Survey
WorldatWork and Watson Wyatt Worldwide, 2004
p. 15
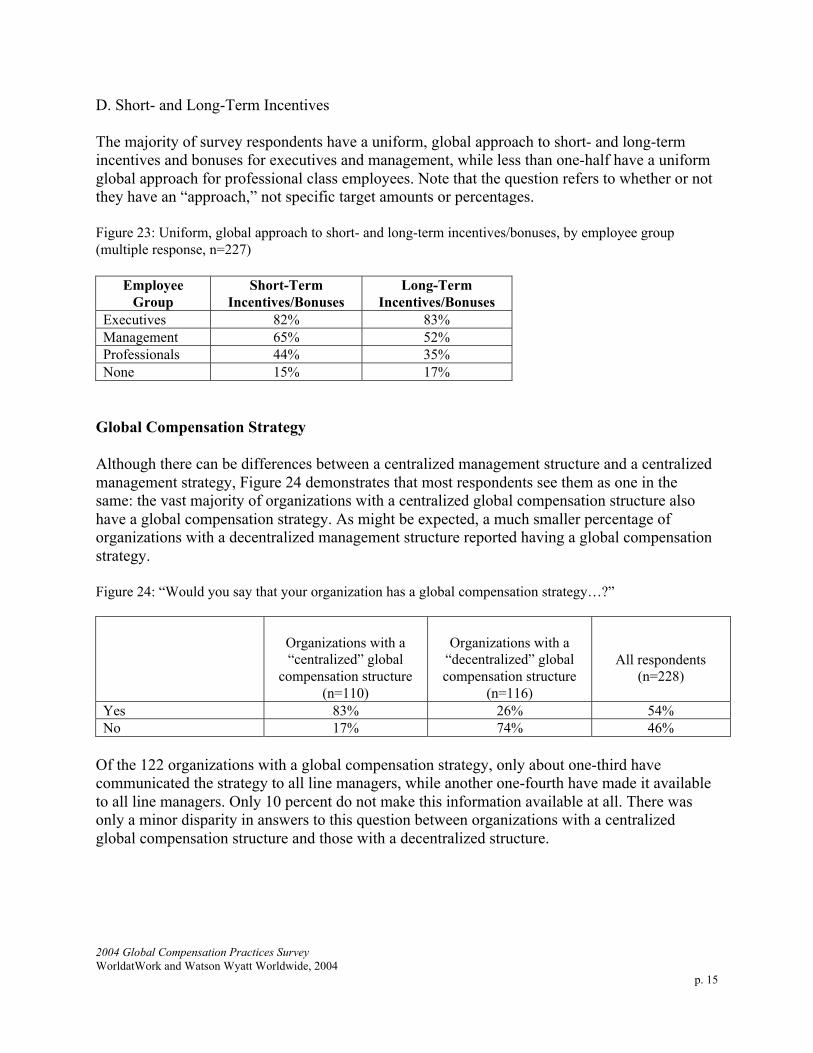
D. Short- and Long-Term Incentives
The majority of survey respondents have a uniform, global approach to short- and long-term
incentives and bonuses for executives and management, while less than one-half have a uniform
global approach for professional class employees. Note that the question refers to whether or not
they have an “approach,” not specific target amounts or percentages.
Figure 23: Uniform, global approach to short- and long-term incentives/bonuses, by employee group
(multiple response, n=227)
Employee
Group
Short-Term
Incentives/Bonuses
Long-Term
Incentives/Bonuses
Executives 82% 83%
Management 65% 52%
Professionals 44% 35%
None 15% 17%
Global Compensation Strategy
Although there can be differences between a centralized management structure and a centralized
management strategy, Figure 24 demonstrates that most respondents see them as one in the
same: the vast majority of organizations with a centralized global compensation structure also
have a global compensation strategy. As might be expected, a much smaller percentage of
organizations with a decentralized management structure reported having a global compensation
strategy.
Figure 24: “Would you say that your organization has a global compensation strategy…?”
Organizations with a
“centralized” global
compensation structure
(n=110)
Organizations with a
“decentralized” global
compensation structure
(n=116)
All respondents
(n=228)
Yes 83% 26% 54%
No 17% 74% 46%
Of the 122 organizations with a global compensation strategy, only about one-third have
communicated the strategy to all line managers, while another one-fourth have made it available
to all line managers. Only 10 percent do not make this information available at all. There was
only a minor disparity in answers to this question between organizations with a centralized
global compensation structure and those with a decentralized structure.

2004 Global Compensation Practices Survey
WorldatWork and Watson Wyatt Worldwide, 2004
p. 16
Figure 25: “If you have a global compensation strategy, is it communicated or available to all line
managers in all operations around the world?” (n=122)
Varies by region or country
34%
Communicated to all line managers
33%
Not communicated or made available to all
line managers10%
Available to all line managers
23%
Organizations communicate their global compensation strategy to all employees (26 percent) less
frequently than they communicate it to line managers (33 percent). Seventeen percent of
organizations do not make compensation information available to employees.
Figure 26: “If you have a global compensation strategy, is it communicated or available to all employees
in all operations around the world?” (n=122)
Communicated to all employees
26%
Not communicated or available to
employees17%
Available to all employees
22%
Varies by region or country
35%
Other Global Compensation Issues
A. Sales Compensation
Overall, two-thirds of survey respondents do not have a global approach to sales compensation.
However, organizations with a centralized global compensation approach are twice as likely to
have a global approach to sales compensation as organizations that are decentralized in their
compensation management structure (44 percent versus 22 percent).
2004 Global Compensation Practices Survey
WorldatWork and Watson Wyatt Worldwide, 2004
p. 17
Figure 27: “Does your organization have a global approach to sales compensation?”
Organizations with a
“centralized” global
compensation structure
(n=109)
Organizations with a
“decentralized” global
compensation structure
(n=117)
All respondents
(n=228)
Yes 44% 22% 33%
No 56% 78% 67%
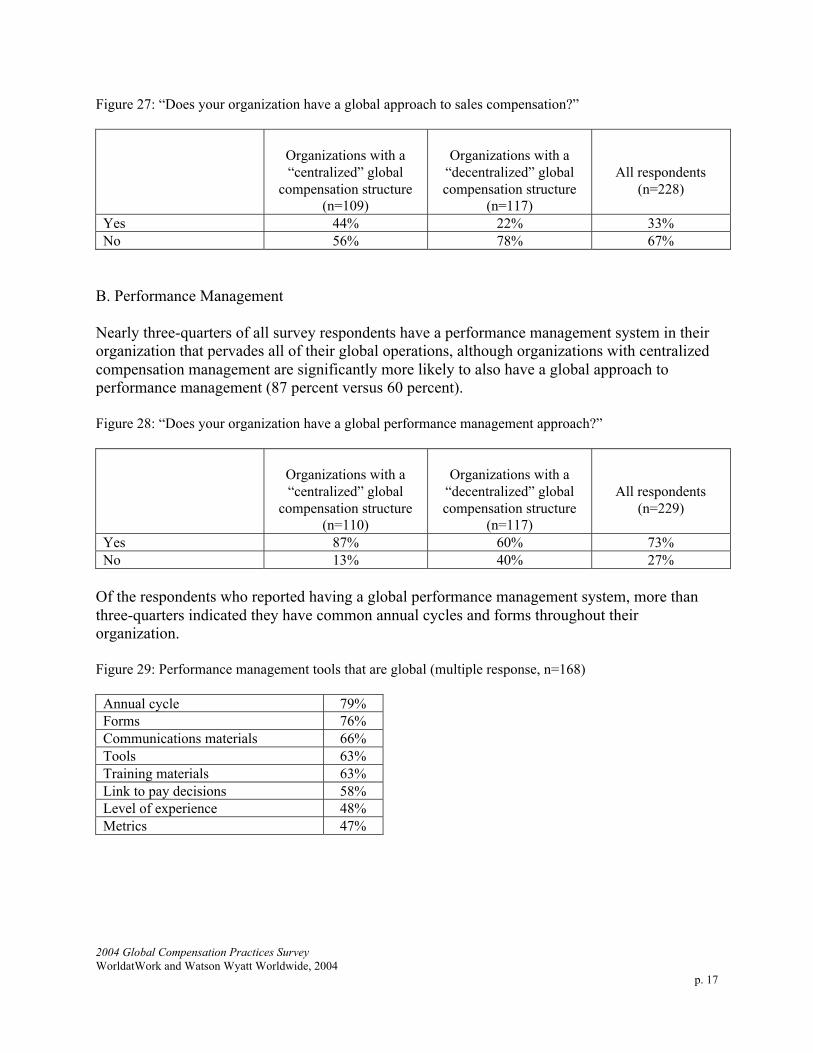
B. Performance Management
Nearly three-quarters of all survey respondents have a performance management system in their
organization that pervades all of their global operations, although organizations with centralized
compensation management are significantly more likely to also have a global approach to
performance management (87 percent versus 60 percent).
Figure 28: “Does your organization have a global performance management approach?”
Organizations with a
“centralized” global
compensation structure
(n=110)
Organizations with a
“decentralized” global
compensation structure
(n=117)
All respondents
(n=229)
Yes 87% 60% 73%
No 13% 40% 27%
Of the respondents who reported having a global performance management system, more than
three-quarters indicated they have common annual cycles and forms throughout their
organization.
Figure 29: Performance management tools that are global (multiple response, n=168)
Annual cycle 79%
Forms 76%
Communications materials 66%
Tools 63%
Training materials 63%
Link to pay decisions 58%
Level of experience 48%
Metrics 47%
2004 Global Compensation Practices Survey
WorldatWork and Watson Wyatt Worldwide, 2004
p. 18
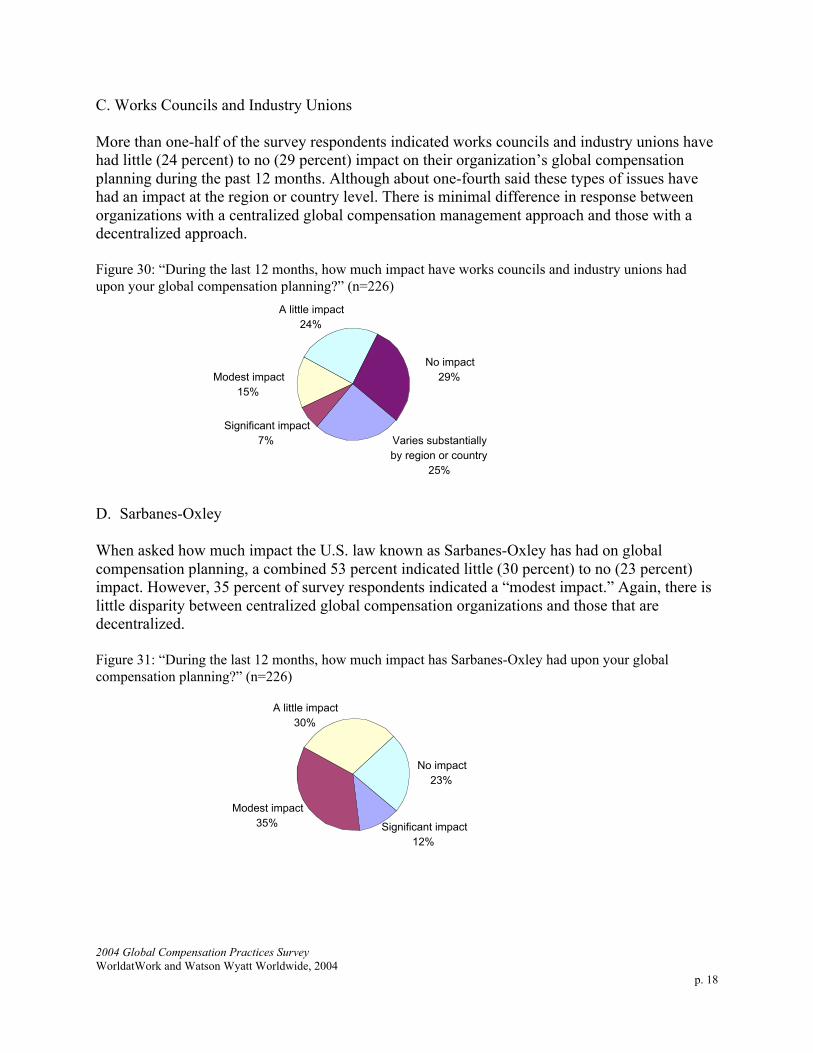
C. Works Councils and Industry Unions
More than one-half of the survey respondents indicated works councils and industry unions have
had little (24 percent) to no (29 percent) impact on their organization’s global compensation
planning during the past 12 months. Although about one-fourth said these types of issues have
had an impact at the region or country level. There is minimal difference in response between
organizations with a centralized global compensation management approach and those with a
decentralized approach.
Figure 30: “During the last 12 months, how much impact have works councils and industry unions had
upon your global compensation planning?” (n=226)
Varies substantially
by region or country
25%
No impact
29%
A little impact
24%
Significant impact
7%
Modest impact
15%
D. Sarbanes-Oxley
When asked how much impact the U.S. law known as Sarbanes-Oxley has had on global
compensation planning, a combined 53 percent indicated little (30 percent) to no (23 percent)
impact. However, 35 percent of survey respondents indicated a “modest impact.” Again, there is
little disparity between centralized global compensation organizations and those that are
decentralized.
Figure 31: “During the last 12 months, how much impact has Sarbanes-Oxley had upon your global
compensation planning?” (n=226)
Significant impact
12%
No impact
23%
Modest impact
35%
A little impact
30%

2004 Global Compensation Practices Survey
WorldatWork and Watson Wyatt Worldwide, 2004
p. 19
Conclusions
The survey results have confirmed a number of long-held assumptions such as the global
application of job leveling approaches by global organizations. However, the survey has also
identified some interesting trends and areas for investigation within international compensation
including the move toward the centralization of compensation management. Within each key
area, we have presented findings that represent valid global compensation approach benchmarks
that WorldatWork and Watson Wyatt will continue to explore for members and clients.
Delivery of Compensation
With the recent trend to downsize corporate and functional roles, the human resources function is
often at the center of discussions about how to effectively deliver global compensation, either
centrally or otherwise. The results of this survey demonstrate that there is not a single, dominant
approach for managing global compensation: approximately one-half manage compensation
centrally while the others have a decentralized approach. Although the majority of organizations
have found their approach to be effective, approximately 50 percent of respondents expect to
change their structure within the next two years and move toward greater centralization.
Given the new compliance obligations that U.S. multinational organizations must meet, the
centralization of compensation management is an expected reaction. Once organizations are able
to implement effective global governance processes including compensation governance, the
structures of organizations may again decentralize and/or change to reflect their organization's
needs.
Approaches to Global Compensation
To decide which components of compensation to globalize, organizations are balancing the
ability to attract and retain talent in various geographies/cultures with consistency in the
organization's approach to conducting business. To that end, compensation also underscores an
organization's culture and strategy to drive business.
The survey results demonstrate the impact that compensation has had upon global organizations.
On an increasingly global scale, organizations are standardizing compensation strategy, job
leveling, target base salary, target total compensation, stock options and stock purchase plans.
Consistency in key compensation components is tantamount to running a global compensation
program.
Noticeably missing in the apparent macro trend toward global standardization of compensation
are sales compensation and short-term incentives at the professional level. However, this may
not be surprising for sales compensation, as organizations must design programs that offer local
rewards and that are appropriate for local geography/culture. They must also, however, account
for the ability of local systems to measure objectives and targets, the isolation of exchange rate
variations and the status quo of local market development (flat, growing, retracting).

2004 Global Compensation Practices Survey
WorldatWork and Watson Wyatt Worldwide, 2004
p. 20
Although designing effective short-term and sales incentive programs is challenging, there may
be a trend among organizations to introduce consistency or the “globalization” of these
programs. This trend is appearing in the organizational leveraging of global customers and the
introduction of global sales teams. This area seems ripe for further research.
Global Tools and Systems
The foundation for making good business decisions is access to accurate data. The results of this
survey indicate that organizations are continuing to procure systems and tools that will allow for
global access to their HR data. The need for this data is being compounded as organizations
continue to make operational decisions on the costs of wages and to do business in various
geographies.
Fifty-five percent of the respondents have implemented their human resource information system
(HRIS) globally. Although global HRIS implementation is becoming increasingly common,
respondents with global compensation tools, such as salary planning systems, are less common
(39 percent). In the future is the notion of providing tools to line managers on a global basis.
Only 39 percent currently provide such tools.
Global compensation tools and systems will continue to increase in importance as organizations'
demands for reliable data increase. For a number of companies, this will continue to be a point
from which to move forward.
Organizations appear to be supporting a consistent and global application of compensation
principles and practices. Future research will investigate the effectiveness of these programs.

2004 Global Compensation Practices Survey
WorldatWork and Watson Wyatt Worldwide, 2004
p. 21
Respondent Demographics
Organization Size
Fewer than 100 employees 0%
100 to 499 0%
500 to 999 9%
1,000 to 2,499 16%
2,500 to 4,999 20%
5,000 to 9,999 15%
10,000 to 19,999 14%
20,000 and over 26%
Industry
Manufacturing 24%
Finance & Insurance 12%
Health Care & Social Assistance 10%
Information (includes Publishing – Electronic & Print, IT, etc.) 7%
Professional, Scientific & Technical Services 7%
Public Administration 6%
Utilities 4%
Educational Services 3%
Retail Trade 3%
Transportation & Warehousing 3%
Other Services (except Public Administration) 2%
Real Estate, Rental & Leasing 2%
Accommodation & Food Services 1%
Agriculture 1%
Arts, Entertainment & Recreation 1%
Construction 1%
Mining 1%
Wholesale Trade 1%
Administrative Support, Waste & Remediation Services 0%
Management of Companies & Enterprises 0%
Other 11%