GLOBAL CLIMATE INDEX 2017 - Asset Owners Disclosure...
41
GLOBAL CLIMATE INDEX 2017 RATING THE WORLD’S INVESTORS ON CLIMATE RELATED FINANCIAL RISK
Transcript of GLOBAL CLIMATE INDEX 2017 - Asset Owners Disclosure...
GLOBAL CLIMATE INDEX 2017 RATING THE WORLD’S INVESTORS ON CLIMATE RELATED FINANCIAL RISK

PREFACEThe fifth AODP Global Climate 500 Index launches after a year of rapid developments in articulating the financial risks of climate change to the global economy. The Paris Agreement entered into force in November, and at time of writing has been ratified by 141 countries representing over 82% of global emissions. The speed of ratification demonstrates how seriously nations are committed to decarbonising their economies and keeping climate change below 2oC.
The world’s first law on mandatory climate disclosure for institutional investors took effect in France, setting a model for other countries.
The Task Force on Climate-related Financial Disclosures (TCFD) delivered its recommendations to the Financial Stability Board in December. This comprehensive guide for all sectors of the economy is due to be considered by the G20 in July and will likely see big changes in the way both companies and investors report this information.
Despite early signs of a rollback on climate policy in the US, long-term climate risk management cannot be unlearned by the investment community, where the majority have now begun to take action. Consideration of the financial implications of climate change is on an upward long term trajectory, transcending short-term political cycles.
LEADERLAGGARD

02
CONTENTS
EXECUTIVE SUMMARY 03ASSET OWNER LEADERS 11ASSET OWNER LAGGARDS 15ASSET MANAGERS 17REGIONS 21COUNTRIES 23CAPABILITIES 31APPENDIX 55
Category Rating Band Asset Owners Asset Managers
Leaders A-AAA Top 7% Top 4%
Challengers B-BBB 7% - 14% 4% - 20%
Learners C-CCC 14% - 22% 20% - 46%
Bystanders D 22% - 60% 46% - 94%
Laggards X Bottom 40%
Zero score Bottom 6% Zero score
The Asset Owners Disclosure Project (AODP) is an independent global not-for-profit organisation that recognises the specific financial risk attributes of climate change. AODP has developed the world’s leading reporting framework for institutional investors encompassing the disclosure and management of climate risk.
Climate risk is of course only one risk that investors have to analyse. We acknowledge this. However, as a multi-sector, multi-asset class and non-diversifiable risk, we believe it requires special attention.
The AODP Global Climate 500 Index rates the world’s 500 biggest asset owners – pension funds, insurers, sovereign wealth funds, foundations and endowments – on their success at managing climate risk within their portfolios, based on direct disclosures and publicly available information.
This year also sees the launch of the first AODP Global Climate Index for Asset Managers, rating the world’s 50 largest asset managers on their success at managing the financial risks of climate change for their clients. It follows the same methodology.
Asset owners and managers are scored on three key capabilities which align with the four key areas highlighted by the FSB Task Force on Climate-related Financial Disclosures: Governance & Strategy, Portfolio Carbon Risk Management and Metrics & Targets. They are graded from AAA to D while those with no evidence of action are rated X.
While the underlying questions remain the same as last year, we have calibrated our assessment categories with the FSB’s recommendations to help asset owners and asset managers prepare for potential future reporting requirements. This alignment provides institutional investors with reporting consistency, trend analysis and an effective framework to implement the strategies required to meet, and perhaps more importantly exceed the FSB’s expected guidelines. Further insight on our methodology can be found in the Appendix to this report and on our website.
To help readers understand how investors are developing in their approach to climate change risks and opportunities, we have designated the following categories based on rating. The proportion of Index participants falling into each category this year is as shown below.
Further information on the methodology can be found in the appendix.
ABOUT AODP
04
EXECUTIVE SUMMARY
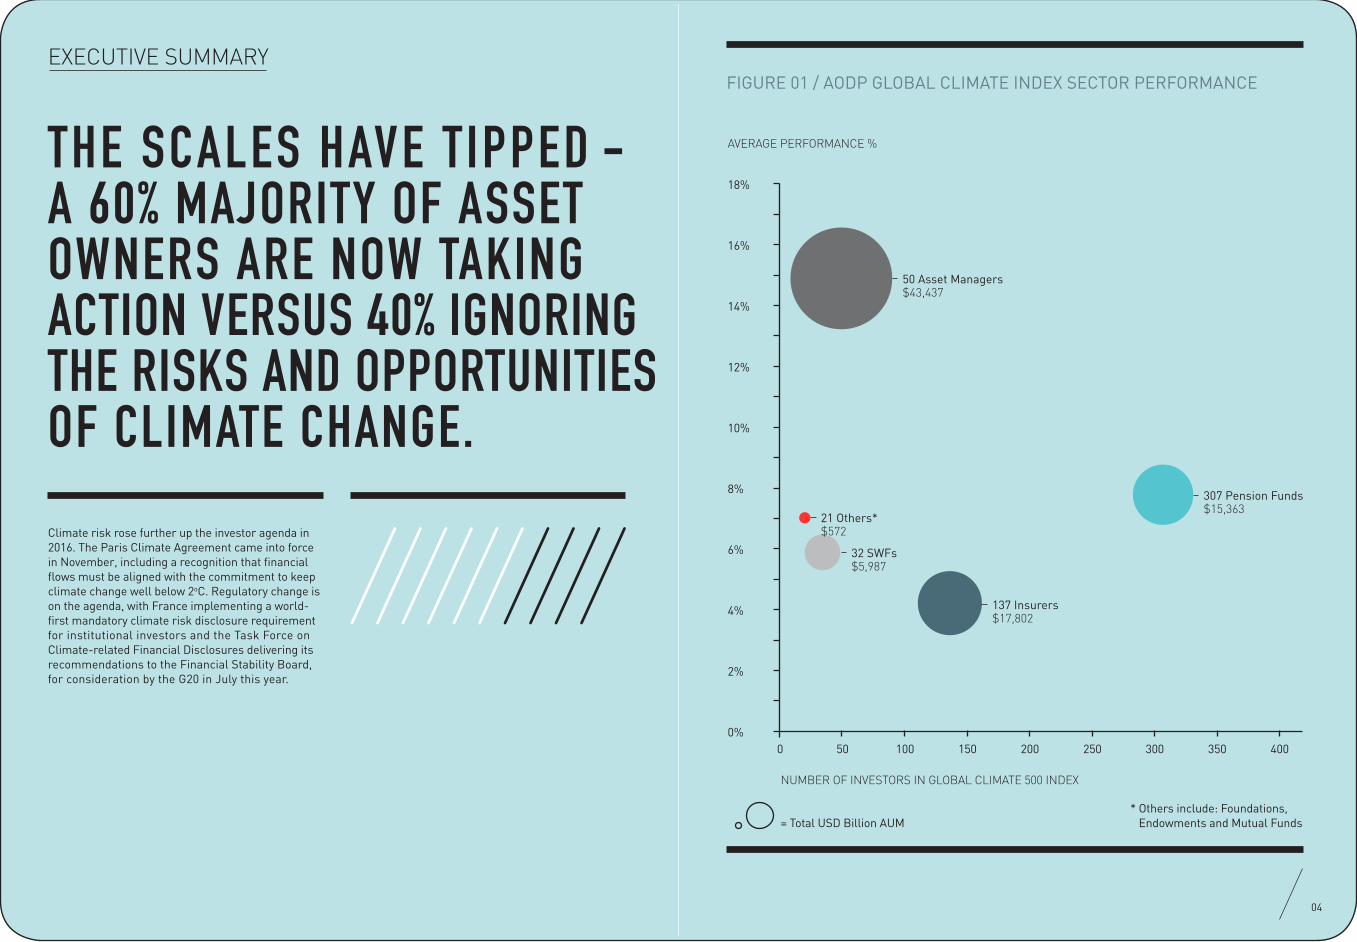
Climate risk rose further up the investor agenda in 2016. The Paris Climate Agreement came into force in November, including a recognition that financial flows must be aligned with the commitment to keep climate change well below 2oC. Regulatory change is on the agenda, with France implementing a world-first mandatory climate risk disclosure requirement for institutional investors and the Task Force on Climate-related Financial Disclosures delivering its recommendations to the Financial Stability Board, for consideration by the G20 in July this year.
THE SCALES HAVE TIPPED - A 60% MAJORITY OF ASSET OWNERS ARE NOW TAKING ACTION VERSUS 40% IGNORING THE RISKS AND OPPORTUNITIES OF CLIMATE CHANGE.
NUMBER OF INVESTORS IN GLOBAL CLIMATE 500 INDEX
AVERAGE PERFORMANCE %
= Total USD Billion AUM* Others include: Foundations,
Endowments and Mutual Funds
0 50 100 150 200 300 350250 400
18%
16%
14%
12%
10%
8%
6%
2%
0%
4%
50 Asset Managers $43,437
21 Others*$572
32 SWFs$5,987
137 Insurers$17,802
307 Pension Funds$15,363
FIGURE 01 / AODP GLOBAL CLIMATE INDEX SECTOR PERFORMANCE

The world’s two biggest economies, the US and China, are among the worst performers, although the US is highly polarised with some important Leaders. In China, Laggards make up 67% of asset owners with investments worth $2.6 trillion – over 80% of AUM. While China has championed green finance at the G20 and has ambitious targets to boost renewables, a lack of transparency prevents us identifying increased low-carbon investment by its institutions.
In the US 63% of asset owners with $4.5 trillion of investments are ignoring climate change. The US leads in low carbon investment in absolute terms: green investments disclosed by asset owners doubled to $55bn, surging past the $47bn of the Netherlands, last year’s top performer, yet this only represents 0.5% of total US AUM, compared to the 3.1% average of Dutch investors. Across the Index low carbon investment has improved 68% to $203 billion yet still only represents 0.5% of index AUM.
In the US, President Trump’s first 100 days have seen plans to reverse much action on tackling climate change. However, with strong opposition from influential states such as California and New York, it remains to be seen what effect federal action will have on companies and investors. Leading investors made a conscious decision years ago that lack of policy or policy reversal was in itself a risk to be managed and only increased their need to grow the size of their clean asset base as a hedge against a climate acceleration scenario.
Asset owners in the US control $10.3 trillion, a quarter of the Index. If more follow the lead set by peers in Europe, Australia and New Zealand and embrace climate-aware investing, they can radically advance the global transition to a low-carbon economy.
FIGURE 02 / NUMBER OF ASSET OWNERS BY RATING GROUPS
34 3425
44 41
187
157
201
246
31
2017 2016
Leaders Challengers Learners Bystanders Laggards
NUMBER OF ASSET OWNERS
AODP’s fifth Global Climate 500 Index reveals how the world’s biggest asset owners are responding to these signals. For the first time ever, we see a significant majority of asset owners scaling up action to protect their portfolios from climate risk, 299 institutions with funds worth $27 trillion representing 60% of asset owners and 70% of Index AUM. Major institutions are leading the way: TIAA, the $915 billion US pension/asset manager hybrid, and AXA, the $601 billion global insurance giant, have both joined the Leaders group now numbering 34 global institutions.
From Bystanders to Leaders, numbers have increased in every category as institutions improve, with the biggest rise in the Challenger group rated B-BBB, which has rapidly improved risk management – a general theme this year.
The number of Laggards has dropped by 19% and now accounts for just 40% of the index, with $12.4 trillion in AUM. Insurers like Mitsui Mutual and National Mutual in Japan and pension funds like Thrift Savings Plan in the US are putting the financial future of customers at risk by failing to acknowledge the risks and opportunities afforded by the low carbon transition.
Nearly one in five asset owners now has staff focused on integrating climate risk into their investments, a 33% increase from last year. Two in five (42%) now incorporate climate change into their policy frameworks, almost twice as many as last year. 13% of asset owners now calculate portfolio carbon emissions, up from 10%, however assessing the risk of stranded assets is still quite an advanced tool used by only 6% of the Index, mostly in the Leaders group.
Oceania and Europe are the most progressive regions, providing the ten best performing countries. In eight of these – Australia, New Zealand, the Netherlands, Ireland and all of Scandinavia – every fund is taking some action on climate risk.
EXECUTIVE SUMMARY / ASSET OWNERS
06
KEY DEVELOPMENTS
The 2017 Global Climate 500 Index covers the Top 500 asset owners globally with $40 trillion AUM.
Upping the ante:
▬ 201 X-rated Laggards, a 18% fall in those ignoring climate risk, a clear minority.
▬ 17 AAA rated Leaders up from 12 last year, the largest AAA gain in AODP Index history.
▬ Challenger group rated B-BBB sees the most significant increase, up 36% to 34, again a record.
▬ 112 rated C and above, a 16% rise in those taking tangible action.
▬ 187 rated D, a 19% rise in those taking first steps acknowledging climate-related financial risk.
08
AODP’s first ever Global Climate Index for Asset Managers shows the world’s top 50 asset managers are well ahead of their asset owner clients in their approach to managing the financial impact of climate change on investment portfolios.
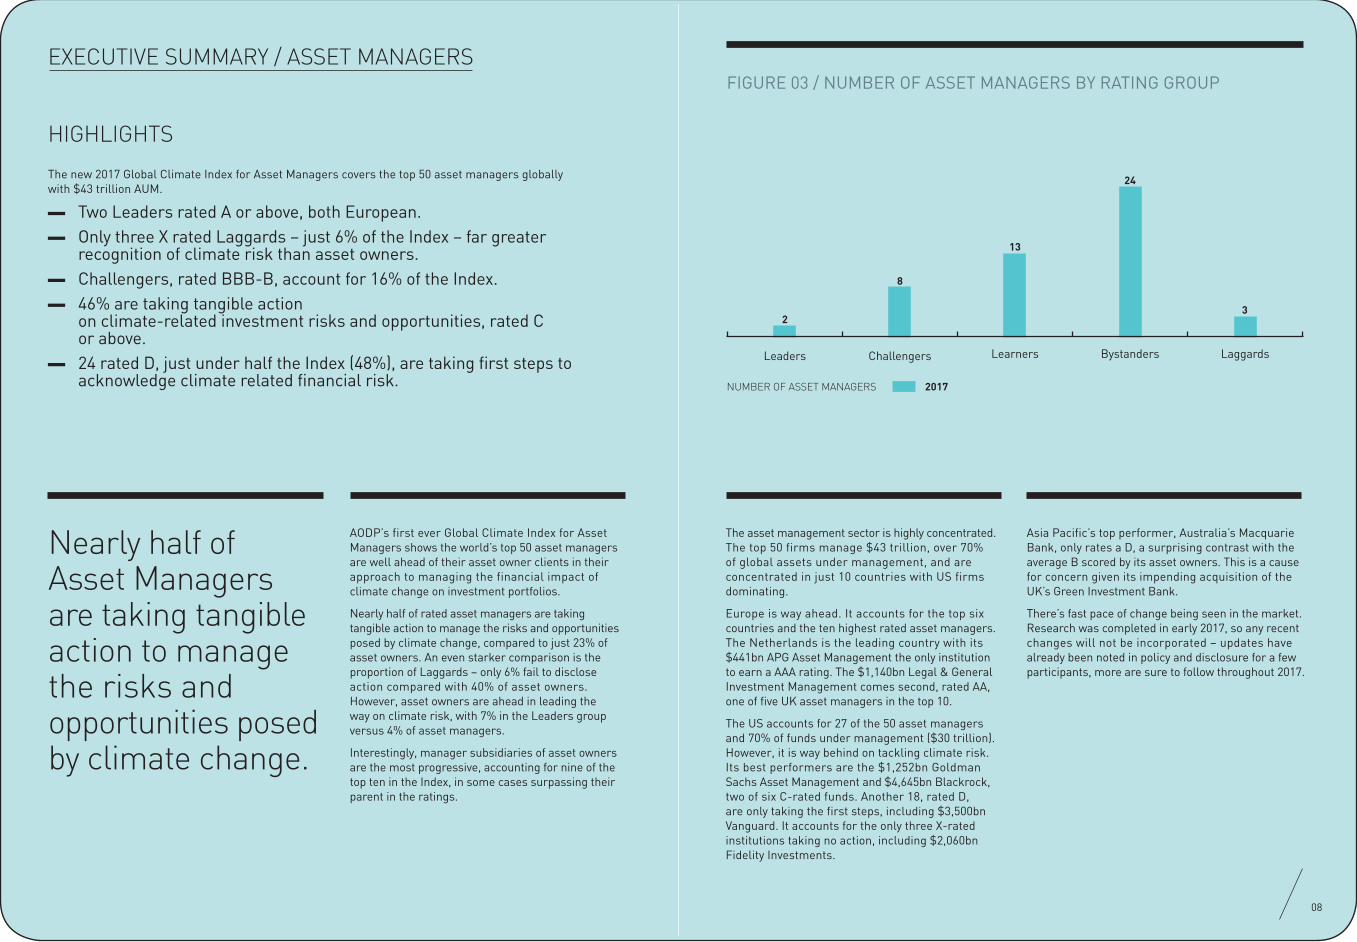
Nearly half of rated asset managers are taking tangible action to manage the risks and opportunities posed by climate change, compared to just 23% of asset owners. An even starker comparison is the proportion of Laggards – only 6% fail to disclose action compared with 40% of asset owners. However, asset owners are ahead in leading the way on climate risk, with 7% in the Leaders group versus 4% of asset managers.
Interestingly, manager subsidiaries of asset owners are the most progressive, accounting for nine of the top ten in the Index, in some cases surpassing their parent in the ratings.
FIGURE 03 / NUMBER OF ASSET MANAGERS BY RATING GROUP
2017NUMBER OF ASSET MANAGERS
2
8
13
24
3
EXECUTIVE SUMMARY / ASSET MANAGERS
The asset management sector is highly concentrated. The top 50 firms manage $43 trillion, over 70% of global assets under management, and are concentrated in just 10 countries with US firms dominating.
Europe is way ahead. It accounts for the top six countries and the ten highest rated asset managers. The Netherlands is the leading country with its $441bn APG Asset Management the only institution to earn a AAA rating. The $1,140bn Legal & General Investment Management comes second, rated AA, one of five UK asset managers in the top 10.
The US accounts for 27 of the 50 asset managers and 70% of funds under management ($30 trillion). However, it is way behind on tackling climate risk. Its best performers are the $1,252bn Goldman Sachs Asset Management and $4,645bn Blackrock, two of six C-rated funds. Another 18, rated D, are only taking the first steps, including $3,500bn Vanguard. It accounts for the only three X-rated institutions taking no action, including $2,060bn Fidelity Investments.
Asia Pacific’s top performer, Australia’s Macquarie Bank, only rates a D, a surprising contrast with the average B scored by its asset owners. This is a cause for concern given its impending acquisition of the UK’s Green Investment Bank.
There’s fast pace of change being seen in the market. Research was completed in early 2017, so any recent changes will not be incorporated – updates have already been noted in policy and disclosure for a few participants, more are sure to follow throughout 2017.
Leaders Challengers Learners Bystanders Laggards
HIGHLIGHTS
The new 2017 Global Climate Index for Asset Managers covers the top 50 asset managers globally with $43 trillion AUM.
▬ Two Leaders rated A or above, both European. ▬ Only three X rated Laggards – just 6% of the Index – far greater
recognition of climate risk than asset owners. ▬ Challengers, rated BBB-B, account for 16% of the Index. ▬ 46% are taking tangible action
on climate-related investment risks and opportunities, rated C or above.
▬ 24 rated D, just under half the Index (48%), are taking first steps to acknowledge climate related financial risk.
Nearly half of Asset Managers are taking tangible action to manage the risks and opportunities posed by climate change.

Climate change is now a mainstream concern throughout the investment community, and activity is gathering unstoppable momentum. A 60% majority of asset owners recognise the financial risks – and opportunities – of climate change, and are taking action, with growing numbers scaling up their activities to achieve A, B and C ratings.
Asset managers are well placed to meet their growing demands. All but three of the top 50 are taking some action, and as a whole they are performing better than asset owners.
As investors prepare for the implementation of disclosure guidelines, the building blocks appear to be in place in the majority of institutions. There is indication of even more advancement to come this year, with many institutions either already underway or preparing to embark on more ambitious actions.
CONCLUSIONS
EXECUTIVE SUMMARY / ASSET MANAGERS
Asset owners and managers that have acted to reduce their exposure to climate risk and increase their investment in the low carbon economy are already seeing this hedging/opportunity strategy paying off.
Pressure will now mount on those resistant asset owners and managers still failing to take and disclose action on climate change. When leading funds around the world are disclosing significant action, it becomes harder to defend doing nothing. As the number of Laggard funds dwindles, their exposure to any market repricing grows significantly higher and a time may be approaching where it will be too late to avoid portfolio losses.
CLIMATE CHANGE IS NOW A MAINSTREAM CONCERN THROUGH THE INVESTMENT COMMUNITY, AND ACTIVITY IS GATHERING UNSTOPPABLE MOMENTUM.

▬ The Leaders – rated A and above – have increased 10% to 34.
▬ AAA rated asset owners have increased by 42% to 17.
▬ USA tops total number in the Leaders group with 7, but this represents only 4% of US asset owners in the Index.
▬ Sweden tops on proportional representation with 40% of their funds in the Leaders category.
Australia’s $7bn Local Government Super reclaims the top ranking from the UK’s $4bn Environment Agency Pension Fund, which reverts to second place in this year’s Global Climate 500 Index for Asset Owners. These two funds are world leaders in all three capabilities of governance and strategy, risk management, and disclosure of metrics on portfolio carbon and investment in the low carbon economy, demonstrating even smaller funds can excel at considering the risks and opportunities presented by the transition to a low carbon economy.
2017 RATING
2017 RANK
2017/2016 CHANGE
ASSET OWNER NAME TYPE COUNTRY
AAA 1 1 Local Government Super (LGS) Pension fund Australia
AAA 2 1 The Environment Agency Pension Fund (EAPF) Pension fund UK
AAA 3 2 New York State Common Retirement Fund (NYSCRF) Pension fund USA
AAA 3 9 First State Super Pension fund Australia
AAA 5 1 Stichting Pensioenfonds ABP (ABP) Pension fund Netherlands
AAA 6 12 Pensioenfonds Zorg en Welzijn (PFZW) Pension fund Netherlands
AAA 7 12 Kommunal Landspensjonskasse Gjensidige Forsikringsselskap (KLP) Pension fund Norway
AAA 8 5 Fjärde AP-Fonden (AP4) Pension fund Sweden
AAA 9 214 Ilmarinen Mutual Pension Insurance Company Pension fund Finland
AAA 10 69 Elo Mutual Pension Insurance Company Pension fund Finland
AAA 11 5 Fonds de Réserve pour les Retraites (FRR) Sovereign wealth fund France
AAA 12 2 Church Commissioners for England Endowment UK
AAA 13 7 Pensionskassernes Administration (PKA) Pension fund Denmark
AAA 14 4 Etablissement de retraite additionnelle de la Fonction Publique (ERAFP) Pension fund France
AAA 15 94 New Zealand Superannuation Fund Sovereign wealth fund New Zealand
AAA 16 16 Sjunde AP-Fonden (AP7) Pension fund Sweden
AAA 17 3 United Nations Joint Staff Pension Fund (UNJSPF) Pension fund USA
AA 18 11 AustralianSuper Pension fund Australia
AA 19 4 Wespath Investment Management (Wespath) Pension fund USA
AA 19 - Vision Pooled Superannuation Trust (VPST) Pension fund Australia
AA 21 7 Bedrijfspensioenfonds voor de Landbouw (BPL) Pension fund Netherlands
AA 22 9 Unilever Pension Funds Pension fund Netherlands
AA 23 17 AXA Group Insurance company France
AA 24 11 Caisse des Dépôts (CDC) Sovereign wealth fund France
AA 25 17 Andra AP-Fonden (AP2) Pension fund Sweden
AA 26 4 Aviva Insurance Insurance company UK
AA 27 19 Tredje AP-Fonden (AP3) Pension fund Sweden
AA 28 19 California Public Employees Retirement System (CalPERS) Pension fund USA
AA 29 4 California State Teachers' Retirement System (CalSTRS) Pension fund USA
A 30 1 The Church of England Pensions Board (CEPB) Pension fund UK
A 31 7 BT Financial Group Pension fund Australia
A 32 15 University of California Retirement System (UC Regents) Endowment USA
A 33 9 TIAA Global Asset Management (TGAM) Pension fund USA
A 34 13 Victorian Superannuation Fund (VicSuper) Pension fund Australia
TABLE 01 / 2017 AODP GLOBAL CLIMATE 500 LEADERS LEAGUE
12
ASSET OWNER LEADERS
MAJOR ASSET OWNERS ARE INCREASINGLY LEADING THE WAY ON CLIMATE RISK.
Major asset owners are increasingly leading the way on climate risk. Two giants join the Leader group: AA-rated AXA, the $601 billion French insurer and A-rated US based pension fund and asset manager TIAA ($915bn). Both funds have risen from a BBB rating as a result of significant improvements in portfolio risk management, which is a general theme this year.
Other large Leaders maintaining their AAA rating include the $410bn Dutch pension fund ABP and the $179bn New York Common Retirement fund. Joining them is major Dutch fund, PFZW ($208bn) up from a AA rating last year, along with our star mover Ilmarinen Mutual Pension Insurance Company, which has leapt from a D rating last year. The $302bn California Public Employees Retirement System, AustralianSuper ($78bn) and Sweden’s AP2 ($38bn) all slip from AAA to AA this year. Notable funds joining the AA group are UK insurer Aviva ($422bn), California State Teachers Retirement System ($193bn), and Unilever Pension Funds ($26bn) – the only corporate pension fund among the prestigious Leaders – all improving from an A rating last year.

JOINING THE LEADERSHIP RANKS
AAA-AAODP GLOBAL
CLIMATE INDEX
2017
These funds may have had a climate strategy previously, but are only now disclosing their actions. Greater transparency is likely to build momentum to a low-carbon economy by revealing to Laggards the true level of climate action among their peers.
Global insurer Axa ($601bn) and Sweden’s $36bn AP3 have both made headway in portfolio risk management to achieve a AA rating, alongside an impressive debut performance by Index newcomer $6bn Vision Pooled Superannuation Trust of Australia. TIAA progress to an A rating from last year’s BBB.
This year has seen eight new entrants to the Leaders group, proving it possible for committed companies to make great progress in a single year.
As mentioned above, Finland’s Ilmarinen has climbed 214 places up the ranking, gaining a AAA rating and a top 10 ranking for their new policies, improved transparency and leading action on managing the financial risks of climate change within their investment portfolio. Finnish compatriots Elo also gain a top 10 AAA rating for improving across the board, rising from a CC rating last year. New Zealand Superannuation Fund (rated D in 2016) and Sweden’s AP7 also joined the AAA elite with significant improvements in risk management.
ASSET OWNER LEADERS

▬ 201 X rated funds, managing $12 trillion, a 19% fall and significant improvement from 2016.
▬ Laggards now represent just 40% of the Index.
TABLE 02 / 2016 AODP GLOBAL CLIMATE 500 LARGEST LAGGARDS [BY AUM]
ASSET OWNER NAME COUNTRY TYPE AUM USD BILLION
China Investment Corporation China Sovereign wealth fund $814
SAMA Foreign Holdings (Saudi Arabian Monetary Agency)
Saudi Arabia Sovereign wealth fund $654
Kuwait Investment Authority Kuwait Sovereign wealth fund $592
SAFE Investment Company China Sovereign wealth fund $568
Mitsui Mutual Life Insurance Japan Insurance company $493
Zenkyoren Japan Insurance company $477
Thrift Savings Plan (TSP) USA Pension fund $458
China Life Insurance (Group) Company China Insurance company $445
Hong Kong Monetary Authority China Sovereign wealth fund $406
Qatar Investment Authority Qatar Sovereign wealth fund $304
Total $5,212
TOTAL X RATED $12,508
16
ASSET OWNER LAGGARDS
Nearly a third of total Index value – $12.4 trillion – is managed by X-rated funds – Laggards who appear to be ignoring climate risk. Ten funds account for $5.2 trillion of this sum, predominantly sovereign wealth funds from the Middle East and large Chinese and Japanese insurers. The $814 billion China Investment Corporation is the largest Laggard completely ignoring climate in its investments.
It is encouraging to see that three of last year’s top 10 are now taking action and have earned a D rating: the $792bn Abu Dhabi Investment Authority, $795bn Japan Post Insurance and the $611bn Japanese insurer Nippon Life Insurance Company.
LARGEST LAGGARDS [BY AUM]
These moves are a result of improved disclosure and investment in low carbon and environmentally sustainable assets.
Success stories are Danica Pension, moving from Laggard to a BB-rated Challenger, driven by improvements in governance, policy and climate risk mitigation actions. The UK’s Cooperative Pension Scheme and Australia’s IOOF move into the Learner ranks at CC and C respectively for similar actions. Another 43 funds advanced to a D rating, with the majority of improvements in policy, voting transparency and becoming a PRI signatory.
▬ The 10 largest Laggards manage $5 trillion in assets: 13% of the total Index.
▬ High proportion of oil-state sovereign wealth funds and Asian insurers.
X

ASSET MANAGER LAGGARDS
2017 LEADERS 2017 LAGGARDS
18
Legal & General Investment Management also performs well across all capabilities – ranking second in both Governance & Strategy and Risk Management, and third in Targets & Metrics, outperforming its parent organisation, which rates D in the Asset Owner Index.
This highlights an issue across the industry: a lack of transparency on policy and action at a corporate level, even where climate is acknowledged as a key issue to manage by a subsidiary.
Asset managers lag behind asset owners on climate leadership. APG and L&GIM account for 4% of the Index and 3.7% of Index AUM, whereas the asset owner Leaders account for 7% of the Index and 10.5% of Index AUM.
As a privately owned company, there is very little disclosure and a general lack of transparency regarding its policies and actions as an investor. This may reflect Fidelity’s market – nearly two thirds of US asset owners are Laggards, and with 94% of its funds under management sourced from this market there may be little pressure from institutional clients for a more progressive ESG approach.
The other two X-Rated funds are: the $611bn Affiliated Managers Group (AMG), a partnership of a number of boutique investment managers; and the $528bn New York Life Investment Management, the asset management subsidiary of New York Life which also rates as a Laggard on our asset owners index. Very little information is available for either manager.
Two asset managers make the Leaders group: AAA-rated Dutch APG Asset Management and AA-rated Legal & General Investment Management, with $441bn and $1,140bn under management respectively.
APG excels in all three categories – ranking number 1 in Governance & Strategy, Portfolio Climate Risk Management and Targets & Metrics. It is a subsidiary of Dutch pension fund ABP, a longstanding Leader on the Asset Owner Index, rated AAA, and is one of a number of high-performing managers owned by asset owners. Its clients include a number of pension funds in addition to ABP.
Only three firms accounting for just 7% of total index assets under management – a mere $3.2 trillion – are X-rated Laggards with no evidence of action on climate risk. This is far better than the 40% of asset owners in this category and a welcome sign that the day-to-day management of their investments is being undertaken by an industry seriously considering the financial implications of climate change.
All three Laggard managers are US- based. Fidelity Investments, one of the largest global investment managers with $2,060bn AUM makes no mention of climate change, responsible investment or ESG in any of its publicly available information.
Asset manager Leaders, both from Europe.
X-rated Laggards, all US-based.2 3
Only 4% of asset managers rate as Leaders versus 7% of asset owners.
Only 6% of asset managers are Laggards vs 40% of asset owners.
4% 6%
ASSET MANAGER LEADERS

2017 RATING
2017 RANK
ASSET MANAGER NAME COUNTRY
AAA 1 APG Asset Management Netherlands
AA 2 Legal & General Investment Management UK
BBB 3 Aviva Investors UK
BBB 4 M&G Investments UK
BBB 5 Schroders Investment Management UK
BB 6 Allianz Global Investors Germany
BB 7 Natixis Global Asset Management France
BB 8 AXA Investment Managers France
B 9 Deutsche Asset Management Germany
B 10 HSBC Global Asset Management UK
CCC 11 UBS Global Asset Management Switzerland
CC 12 Aegon Asset Management Netherlands
CC 13 Standard Life Investments UK
CC 14 BNP Paribas Investment Partners France
C 15 Goldman Sachs Asset management USA
C 16 BlackRock Inc USA
C 17 Aberdeen Asset Management UK
C 18 J.P. Morgan Asset Management USA
C 18 Morgan Stanley USA
C 20 Amundi France
C 21 PIMCO USA
C 22 Credit Suisse Switzerland
C 23 AllianceBernstein USA
D 24 Dimensional Fund Advisors USA
D 25 State Street Global Advisors USA
TABLE 03 / AODP GLOBAL CLIMATE INDEX FOR ASSET MANAGERS
2017 RATING
2017 RANK
ASSET MANAGER NAME COUNTRY
D 26 Columbia Threadneedle Investments USA
D 27 Generali Investments Europe Italy
D 28 RBC Global Asset Management Canada
D 29 Northern Trust Asset Management USA
D 30 Franklin Templeton Investments USA
D 31 Insight Investment UK
D 32 MFS Investment Management USA
D 33 Macquarie Australia
D 34 Sumitomo Mitsui Trust Group Japan
D 35 BNY Mellon Invest Management, EMEA USA
D 36 Mellon Capital Management USA
D 37 T. Rowe Price USA
D 38 Wellington Management USA
D 39 Vanguard USA
D 39 Invesco USA
D 39 Legg Mason USA
D 42 Principal Global Investors USA
D 43 Wells Capital Management USA
D 44 Federated Investors USA
D 45 PGIM (formerly Pramerica Investment Management) USA
D 46 Capital Group USA
D 46 Nomura Asset Management Japan
X 48 Fidelity Investments USA
X 48 Affiliated Managers Group USA
X 48 New York Life Investment Management USA
20
ASSET MANAGER LEADERS

REGIONS
TABLE 04 / REGIONAL LEADERS – ASSET OWNERS
2017 2016
RATING RANK REGION # ASSET OWNERS AUM USD BILLION
# ASSET OWNERS AUM USD BILLION
CHANGE IN AVE SCORE
CC 1 EMEA 190 $15,334 190 $15,426 54%
C 2 Asia Pacific 84 $12,136 90 $10,880 27%
D 4 Americas 226 $12,254 220 $11,432 32%
Total 500 $39,725 500 $37,737
TABLE 05 / REGIONAL LEADERS – ASSET MANAGERS
2017
RATING RANK REGION # ASSET MANAGERS AUM USD BILLION
B 1 EMEA 19 $11,256
D 2 Asia Pacific 28 $30,823
D 3 Americas 3 $1,358
Total 50 $43,437
Europe leads the world on climate risk. Scandinavian asset owners continue to dominate the Leaders group and are setting the bar high for disclosure and action on climate risk. The average rating rose from to CC from C last year (with African and Middle Eastern asset owners remaining at D). Although average scores are rising strongly around the world, EMEA saw by far the fastest improvement with a 54% rise.
Europe’s 19 asset managers mirror the success of their asset owner clients, with an average B rating. The entire top 10 asset managers are based in the region, five of which are based in the UK. The top 50 global asset managers are concentrated in just 10 countries, and the leading six from a climate perspective are all European.
22
▬ Europe is the clear leader on climate risk among asset managers and asset owners.
▬ The Americas performs worst, with asset owners and managers averaging D in all sub-regions.
▬ Asia Pacific asset owners perform better than asset managers, in contrast to Europe.
European countries remain well ahead of the curve in climate risk disclosure.
Asia Pacific sees a variety of performance. Asset owners in Australia and New Zealand average B compared with an average D across Asia. However, all three asset managers based in this region rate D. Macquarie, the sole Australian investment manager included in this index, will have to dramatically improve its climate credentials, with the impending acquisition of the UK’s Green Investment Bank, which has just been given the green light by UK courts1.
Across all parts of the Americas asset managers and owners average D. Most worryingly, the 27 asset managers in the US manage $30.5 trillion, 70% of total Index value.
REGIONAL PERFORMANCE
FIGURE 04 / REGIONAL ASSET MANAGER LEADER/LAGGARD PERFORMANCEPROPORTION OF LAGGARDS
PROPORTION OF LEADERS = Total Region AUM
0% 2% 4% 6% 8% 14%10% 12%
0%
8%
6%
2%
14%
12%
10%
4%
Americas
Asia Pacific EMEA
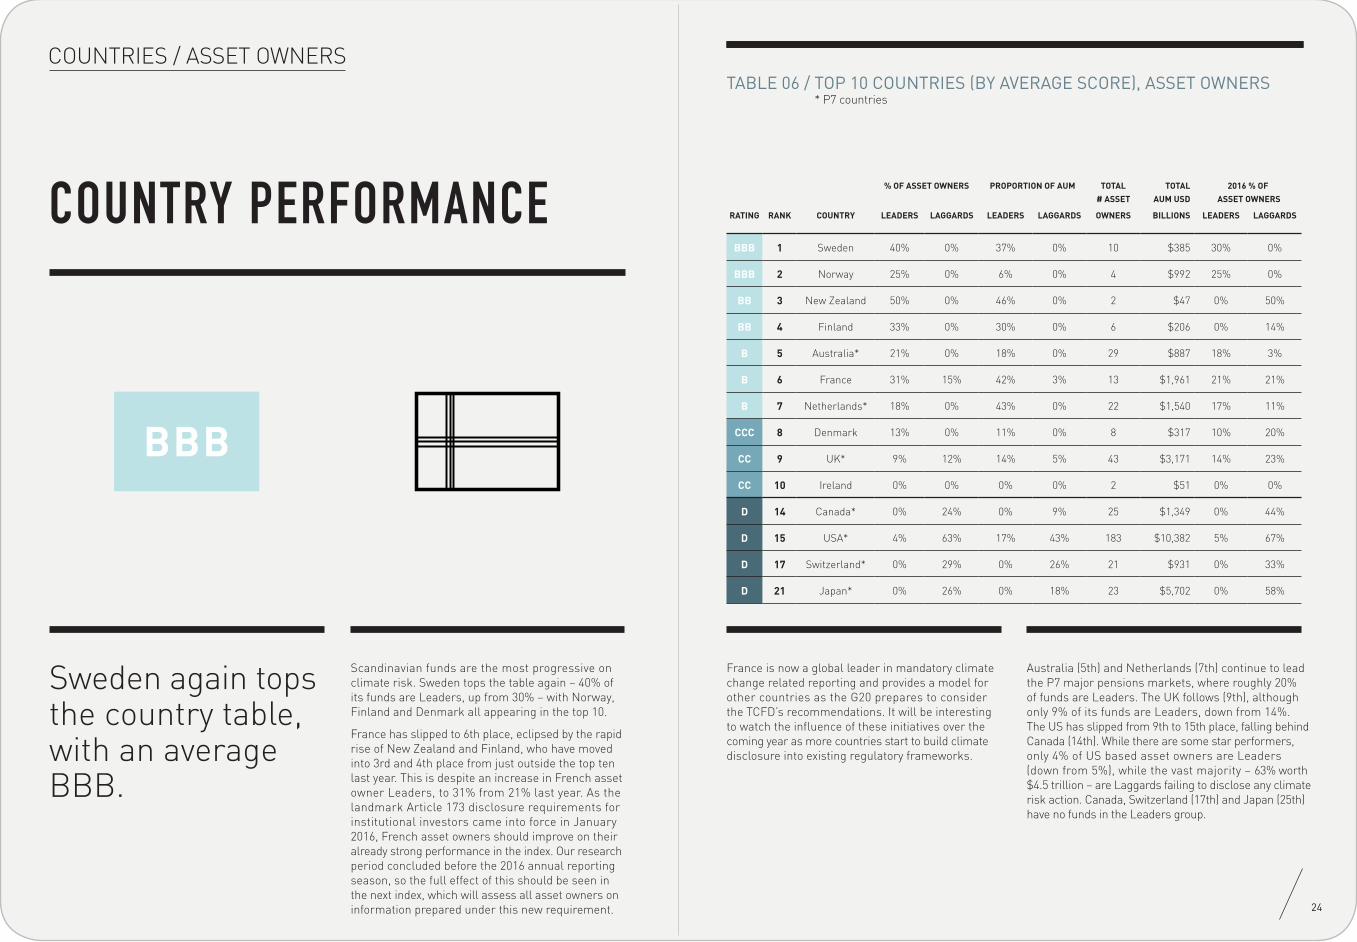
COUNTRIES / ASSET OWNERSTABLE 06 / TOP 10 COUNTRIES (BY AVERAGE SCORE), ASSET OWNERS
* P7 countries
% OF ASSET OWNERS PROPORTION OF AUM TOTAL
# ASSET
TOTAL
AUM USD
2016 % OF
ASSET OWNERS
RATING RANK COUNTRY LEADERS LAGGARDS LEADERS LAGGARDS OWNERS BILLIONS LEADERS LAGGARDS
BBB 1 Sweden 40% 0% 37% 0% 10 $385 30% 0%
BBB 2 Norway 25% 0% 6% 0% 4 $992 25% 0%
BB 3 New Zealand 50% 0% 46% 0% 2 $47 0% 50%
BB 4 Finland 33% 0% 30% 0% 6 $206 0% 14%
B 5 Australia* 21% 0% 18% 0% 29 $887 18% 3%
B 6 France 31% 15% 42% 3% 13 $1,961 21% 21%
B 7 Netherlands* 18% 0% 43% 0% 22 $1,540 17% 11%
CCC 8 Denmark 13% 0% 11% 0% 8 $317 10% 20%
CC 9 UK* 9% 12% 14% 5% 43 $3,171 14% 23%
CC 10 Ireland 0% 0% 0% 0% 2 $51 0% 0%
D 14 Canada* 0% 24% 0% 9% 25 $1,349 0% 44%
D 15 USA* 4% 63% 17% 43% 183 $10,382 5% 67%
D 17 Switzerland* 0% 29% 0% 26% 21 $931 0% 33%
D 21 Japan* 0% 26% 0% 18% 23 $5,702 0% 58%
Scandinavian funds are the most progressive on climate risk. Sweden tops the table again – 40% of its funds are Leaders, up from 30% – with Norway, Finland and Denmark all appearing in the top 10.
France has slipped to 6th place, eclipsed by the rapid rise of New Zealand and Finland, who have moved into 3rd and 4th place from just outside the top ten last year. This is despite an increase in French asset owner Leaders, to 31% from 21% last year. As the landmark Article 173 disclosure requirements for institutional investors came into force in January 2016, French asset owners should improve on their already strong performance in the index. Our research period concluded before the 2016 annual reporting season, so the full effect of this should be seen in the next index, which will assess all asset owners on information prepared under this new requirement. 24
Sweden again tops the country table, with an average BBB.
France is now a global leader in mandatory climate change related reporting and provides a model for other countries as the G20 prepares to consider the TCFD’s recommendations. It will be interesting to watch the influence of these initiatives over the coming year as more countries start to build climate disclosure into existing regulatory frameworks.
COUNTRY PERFORMANCE
Australia (5th) and Netherlands (7th) continue to lead the P7 major pensions markets, where roughly 20% of funds are Leaders. The UK follows (9th), although only 9% of its funds are Leaders, down from 14%. The US has slipped from 9th to 15th place, falling behind Canada (14th). While there are some star performers, only 4% of US based asset owners are Leaders (down from 5%), while the vast majority – 63% worth $4.5 trillion – are Laggards failing to disclose any climate risk action. Canada, Switzerland (17th) and Japan (25th) have no funds in the Leaders group.
BBB

RANK COUNTRY # ASSET OWNERS AUM USD BILLION REGION
1 KUWAIT 3 $666
2 SAUDI ARABIA 1 $654
3 SINGAPORE 3 $404
4 QATAR 1 $304
5 RUSSIA 3 $114
6 KAZAKHSTAN 1 $91
7 IRAN 1 $62
8 ARGENTINA 1 $59
9 BRUNEI 1 $30
10 ALGERIA 1 $19
11 ISRAEL 1 $18
12 PORTUGAL 1 $16
13 EAST TIMOR 1 $16
14 INDIA 1 $14
15 POLAND 1 $12
26
Fossil fuel producing countries consistently rank lowest for climate risk disclosure.
▬ Three exceptions are Norway, already a leader, and both Azerbaijan and UAE who have improved their positions.
▬ USA and China, who together control a third of index AUM, continue to disappoint.
TABLE 07 / LARGEST LAGGARD ASSET OWNER COUNTRIES (BY AUM)
Kuwait is the largest Laggard country, with no evidence of action to tackle climate risk across its $666bn of funds. However in April 2016, the heavily oil-dependent gulf state set a renewable energy target of 15% of energy consumption by 20303. Saudi Arabia comes second with $654bn, and has also recently announced its revolutionary $30-50bn National Renewable Energy Programme4, joining another fossil fuel giant, the UAE, which in January also announced a $163bn investment in clean energy5. Sustained low oil prices, the falling cost of renewables and the influence of the Paris Agreement have had an historic impact in 2016. We hope these developments will lead more fossil fuel producing countries to follow Norway, Azerbaijan and UAE in taking and disclosing climate action.
A striking change this year is that eight of the top ten countries, controlling $4.4 trillion, 11% of Index AUM, now have no Laggard funds ignoring climate risk. Last year this was only true of Sweden and Norway. Other major markets have improved significantly, with many asset owners at last starting to address climate risk in their portfolios. The proportion of X-rated Laggards taking no action has fallen sharply from 58% to 26% in Japan; from 44% to 23% in Canada; and from 23% to 12% in the UK.
30% of Japanese asset owners included in the Index are now PRI signatories, the benefit of which can be seen in improved policy, transparency on voting and the range of climate mitigation strategies being employed.
COUNTRY PERFORMANCE
COUNTRIES / ASSET OWNERS
X

The 183 US funds are worth $10.4 trillion AUM, representing 26% of total Index AUM. However, it has more than twice as many Laggards as any other major pension market: 63% of all funds, down just 4% on last year, with $4.5 trillion of investments. If these asset owners follow the lead of institutions across the Atlantic and embrace climate-aware investing they have the capacity to radically change the climate finance landscape.
The chart to the right illustrates the large proportion of global assets with Laggard owners, and highlights the importance of action by both the USA and China in investing in the global transition to a low carbon economy.
China’s $3.2 trillion is controlled by just nine funds, six of which are Laggards worth $2.6 trillion. China has championed green finance within the G20, and in January, announced a target of at least $360bn in renewables investment by 20202, but its investment industry need to improve on disclosure to ensure this global political leadership is evident.
28
PROPORTION OF LEADERS
PROPORTION OF LAGGARDS
= AUM
0% 10% 20% 30% 40% 50% 60%
0%
10%
20%
30%
40%
50%
60%
80%
90%
France
DenmarkNetherlands
Sweden New ZealandNorway
Australia Finland
UK
Ireland
FIGURE 05 / TOP 10 COUNTRIES LEADER/LAGGARD ASSET OWNER PERFORMANCE
70%
USA
China
JapanSwitzerland
Canada
COUNTRY PERFORMANCE
of Chinese funds are Laggards.
63%The US has more than twice as many Laggards as any other major pension market.
67%
COUNTRIES / ASSET OWNERS
X

COUNTRIES / ASSET MANAGERSTABLE 08 / TOP 10 COUNTRIES (BY AVERAGE SCORE), ASSET MANAGERS
The Netherlands is the country with the best performance on climate risk, and the only one to achieve an AA rating. APG is the only AAA-rated asset manager while Aegon Asset Management also performs well with a CC rating. Germany ranks second, with Allianz Global Investors rated BB and Deutsche Asset Management rated B.
30
Netherlands leads with the only AAA-rated asset manager.
The UK, managing 10% of index AUM, comes third and is poised to leap to a Leader position: three of its eight funds are in a strong Challenger position, rated BBB: Aviva Investors, M&G Investors (Prudential’s asset management arm) and Schroders and all perform very well across all three capabilities. France, where four big funds manage 8% of Index AUM, comes fourth.
US asset managers account for more than half the Index and 70% of investments. Their six best performers, managing $9.6 trillion, only rate C, including Blackrock, the world’s largest asset manager globally, with $4,645bn AUM, Goldman Sachs Asset Management with $1,252bn and JP Morgan Asset Management with $1,723bn.
COUNTRY PERFORMANCE
All three perform fairly in Governance & Strategy and Risk Management, however only Blackrock lifts from a bottom place in disclosure of Metrics & Targets. The last category, quantification of the extent of low carbon investments, is an area where there is little transparency industry-wide.
Another 18 asset managers, rated D, are only taking the first steps including $3,500bn Vanguard, $2,245bn State Street and $1,625bn BNY Mellon Investment Management.
% OF ASSET MANAGERS PROPORTION OF AUM TOTAL
# ASSET
TOTAL
AUM USD
RATING RANK COUNTRY LEADERS LAGGARDS LEADERS LAGGARDS MANAGERS BILLIONS
AA 1 Netherlands 50% 0% 54% 0% 2 $819
BBB 2 Germany 0% 0% 0% 0% 2 $1,329
BB 3 UK 13% 0% 26% 0% 8 $4,305
CCC 4 France 0% 0% 0% 0% 4 $3,329
CC 5 Switzerland 0% 0% 0% 0% 2 $1,005
D 6 Italy 0% 0% 0% 0% 1 $468
D 7 Canada 0% 0% 0% 0% 1 $292
D 8 USA 0% 11% 0% 10% 27 $30,531
D 9 Australia 0% 0% 0% 0% 1 $367
D 10 Japan 0% 0% 0% 0% 2 $991
Grand Total 4% 6% 4% 7% 50 $43,437
AAA

CAPABILITIES / ASSET OWNERS
CAPABILITIES REVIEW
The survey comprises 37 questions covering the following three key areas assessing the asset owner’s capability in managing portfolio climate risk. The survey has been remapped this year to align to the FSB TCFD’s proposed framework for disclosure, to assist asset owners in assessing their readiness for any forthcoming reporting requirements.
C
– Organisation structure and approach it uses to oversee climate risk objectives.
– Degree of integration of climate risk principles in the organisation’s policies and processes.
GOVERNANCE & STRATEGY
– Variety and effectiveness of tools and approaches used to evaluate and manage climate change related financial risks and opportunities. This includes engagement, voting practices, and portfolio management tools.
PORTFOLIO RISK MANAGEMENT
– Key metrics used to measure, monitor and compare portfolio climate risk management performance, including the value asset owners have invested in low carbon assets.
METRICS & TARGETS

CAPABILITIES / ASSET OWNERS
CAPABILITIES REVIEW
34
Local Government Super and Environment Agency Pension Fund continue their tussle over top spot for two of the three capabilities assessed. Governance & Strategy and Risk Management have seen both these funds in the top two for the last two years. Aviva, First State Super, Unilever and PKA have all notably improved their performance on Governance & Strategy.
Risk Management practices have improved amongst the leadership group, with exceptionally strong performance by Ilmarinen. Techniques are evolving and many more asset owners are developing their capabilities in this area. Seven of the top ten in this category are new this year.
25% of asset owners are now investing in low carbon assets such as green bonds and low carbon indices, a 58% increase from last year. While not framed as a specific hedge strategy (only 2% disclose using low carbon as a active hedging strategy even though others have sought out clean opportunities, almost instinctively as a way to offset their high carbon exposures), investment in these areas diversifies a fund away from high carbon, the full value of which will remain opaque until more advanced methods of base case scenario analysis and risk pricing of carbon at the portfolio level become more widespread. The use of screens and exclusion criteria are also rapidly gaining favour.
The Metrics & Targets capability has also seen a big change this year. This is a keen area to watch as disclosure continues to improve. What we look for here is identification and quantification of both portfolio emissions and low carbon investments. This should enhance even further, as responsible investment moves from a qualitative to a more quantitative disclosure. Of the top 10 performance, strong movers this year were PFZW, Elo and NY State Common Retirement Fund.
The chart above demonstrates the performance of the AAA rated Leaders across the three capabilities. While the first two capabilities are showing greater consistency amongst the Leaders, there are a few funds who have outperformed in the Metrics capability: FRR, AP4, First State Super and Elo.
FIGURE 06 / ASSET OWNER AAA LEADERS CAPABILITIES
Governance & Strategy
Local Government Super
The Environment Agency Pension Fund
First State Super
New York State Common Retirement Fund
Stichting Pensioenfonds ABP
Pensioenfonds Zorg en Welzijn
Kommunal Landspensjonskasse Gjensidige Forsikringsselskap
Elo Mutual Pension Insurance Company
Fonds de Réserve pour les Retraites
Church Commissioners for England
Pensionskassernes Administration
Etablissement de retraite additionnelle de la Fonction Publique
Sjunde AP-Fonden
New Zealand Superannuation Fund
Ilmarinen Mutual Pension Insurance Company
Fjärde AP-Fonden
%100
50
25
0
Portfolio Carbon Risk Management Metrics & Targets
75
TABLE 09 / ASSET OWNER CAPABILITY LEADERSRANKING GOVERNANCE &
STRATEGYRANKING PORTFOLIO CARBON
RISK MANAGEMENTRANKING METRICS & TARGETS
1 The Environment Agency Pension Fund 1 Local Government Super 1 First State Super
2 Local Government Super 2 The Environment Agency Pension Fund 1 Fjärde AP-Fonden
3 Stichting Pensioenfonds ABP 3 New York State Common
Retirement Fund 1 Fonds de Réserve pour les Retraites
4 Aviva Insurance 4 California State Teachers' Retirement System 1 Tredje AP-Fonden
5 Wespath Investment Management 5 Stichting Pensioenfonds
ABP 5 Vision Pooled Superannuation Trust
6 First State Super 6 Pensionskassernes Administration 6 Elo Mutual Pension
Insurance Company
7 Church Commissioners for England 7 Pensioenfonds Zorg en
Welzijn 7 Pensioenfonds Zorg en Welzijn
8 Pensionskassernes Administration 8 Unilever Pension Funds 8 Local Government Super
8 Unilever Pension Funds 8 Ilmarinen Mutual Pension Insurance Company 8 Kommunal Landspensjonskasse
Gjensidige Forsikringsselskap
10 New York State Common Retirement Fund 10 Wespath Investment
Management 10 New York State Common Retirement Fund

CAPABILITIES / ASSET MANAGERS
CAPABILITIES REVIEW
36
TABLE 10 / ASSET MANAGER CAPABILITY LEADERSRANKING GOVERNANCE &
STRATEGYRANKING PORTFOLIO CARBON
RISK MANAGEMENTRANKING METRICS & TARGETS
1 APG Asset Management 1 APG Asset Management 1 M&G Investments
2 Legal & General Investment Management 2 Legal & General
Investment Management 1 APG Asset Management
3 Aviva Investors 3 Schroders Investment Management 3 Legal & General
Investment Management
4 HSBC Global Asset Management 4 Aviva Investors 4 Natixis Global Asset
Management
5 Deutsche Asset Management 5 AXA Investment Managers 4 Dimensional Fund
Advisors
6 Allianz Global Investors 6 Allianz Global Investors 6 Allianz Global Investors
7 Schroders Investment Management 7 M&G Investments 7 BNP Paribas Investment
Partners
8 Standard Life Investments 8 Aegon Asset Management 8 AXA Investment Managers
9 Goldman Sachs Asset management 9 UBS Global Asset
Management 9 Aviva Investors
10 BNP Paribas Investment Partners 10 Deutsche Asset
Management 9 Deutsche Asset Management
Asset managers generally perform strongest in Governance & Strategy, and average a score three times that of asset owners, and indicates many are starting to equip their organisations to address the implications of climate change on their investments. Particularly strong areas are incorporating climate change issues into policy framework, including a focus on stewardship and engagement approach.
Risk Management also scores strongly, and again is double that of asset owners in this capability. Key areas here include voting policy/activity and the range of climate risk mitigation approaches used.
Metrics & Targets is the only capability area where the two groups perform relatively similarly.
34% of asset managers invest in low carbon assets, however with only $95bn quantified, transparency on how much is invested lags asset owners, 25% of whom disclose $203bn. Its difficult to draw conclusions on how much capital is being directed towards the low carbon economy without this metric being more reported, and its unclear whether investors are even able to identify this within their portfolios. It will be interesting to watch how this develops as asset owners become more sophisticated in this area and seek out managers with a strong capability for managing a low-carbon tilted portfolio.
FIGURE 07 / TOP 10 ASSET MANAGERS CAPABILITIES
Governance & Strategy
APG Asset Management
Legal & General Investment Management
Aviva Investors
M&G Investments
Natixis Global Asset Management
AXA Investment Managers
Deutsche Asset Management
HSBC Global Asset Management
Allianz Global Investors
Schroders Investment Management
%
Portfolio Carbon Risk Management Metrics & Targets
70
40
30
20
10
0
50
60
European managers dominate the capabilities performance rankings, with APG Asset Management taking top place in two of the three categories, and second place in Metrics & Targets.

CAPABILITIES / ASSET OWNERS
GOVERNANCE & STRATEGY
38
42% of asset owners now incorporate climate change into their policy framework.
FIGURE 08 / PROPORTION OF ASSET OWNERS WITH STAFF WHO INTEGRATE FINANCIAL IMPACT OF CLIMATE CHANGE INTO THE INVESTMENT PROCESS
INTEGRATING CLIMATE RISK
Leaders
Challengers
Learners
Bystanders
Laggards
% WITH ROLE
0 10 20 30 40 50 60 70 80 90 100
Has Has not
Increase in the number asset owners integrating climate change into their policy framework.
82%Increase in the number of Bystander asset owners with a role or team looking at financial considerations of climate risk in investments.
3Xincrease in the number of asset owners with a role or team responsible for including climate considerations in the investment process, increasing from 67 to 89.
1/3
In an indication of more strategic approach to managing the risks and opportunities presented by the low carbon transition, 73 asset owners (15%) are now incorporating climate risk factors into their asset manager selection process, a 30% increase. 20% of asset owners are now embedding climate change risk management into asset manager agreements, up from 12% last year. More than half this group refer to their climate or ESG policy. However, a move towards greater mandate length is still elusive – only a handful of asset owners are currently doing this.
Another policy trend is guidance on how investee companies are engaged on climate change issues. 15% of asset owners now include this, up from 12% last year, a 25% increase.
This year has seen a marked rise in asset owners integrating climate change into their policy frameworks. 42% of the Index now do this in some form, an increase from just 23% last year. This is the shift we have been waiting to see, and comes as a growing number of institutions take an ESG and Responsible Investment approach. While only 20% of asset owners have a dedicated climate change policy, either standalone or as a dedicated section within an ESG/RI policy, a further 20% of funds have implemented a broad ESG policy which covers climate change generally.
All but one of the 34 Leaders (97%) have staff dedicated to integrating climate risk into their investment approach, compared with just 18% of all Index participants. The Challengers are fast closing the gap on Leaders – 83% of this group now have this function – up from 75% last year. Even the D rated Bystanders have started to create these roles – a sure sign this is becoming a mainstream approach.

GOVERNANCE & STRATEGY
40
FIGURE 09 / PROPORTION OF ASSET MANAGERS WITH STAFF WHO INTEGRATE FINANCIAL IMPACT OF CLIMATE CHANGE INTO THE INVESTMENT PROCESS
Leaders
Challengers
Learners
Bystanders
Laggards
% WITH ROLE
0 10 20 30 40 50 60 70 80 90 100
36% of asset managers have a specific policy on climate change, either standalone or as a dedicated section within their ESG or Responsible Investment policy. This exceeds the 20% of asset owners taking this advanced approach. Another 20% of managers have a specific ESG/RI risk assessment incorporated into their broader investment approach. In total, almost all asset managers (90%) have some form of policy, compared with just 41% identified within their clients. This is a reflection of the growing importance of broader responsible investment in the industry, and may be in part driven by asset owners requiring a more sustainable approach to investing, including becoming PRI signatories. This is an exceptionally good sign, indicating asset managers are filling the skills gap inherent in the majority of asset owners.
70% of Asset managers have a voting policy covering environmental issues, with 20 % explicitly stating support for climate change resolutions, usually centred on disclosure and reporting. The other 50% consider climate resolutions on a case by case basis.
68% of asset owners have staff who are responsible for including climate change considerations in the investment decision making. 28% of managers have specific team/role, split evenly between ESG or CIO reporting lines, while a further 36% has this covered as part of the general remit of ESG staff. In total, nearly half of the AODP Index managers have this residing within the risk function, as part of a broader ESG risk assessment of investments.
CAPABILITIES / ASSET MANAGERS
90% of asset managers incorporate climate change into their policy framework.
Compared with just 41% identified within their clients.
INTEGRATING CLIMATE RISK
of asset managers have a standalone climate change policy and/or a dedicated section in ESG/RI policy.
36%of asset managers have a role or team responsible for including climate considerations in the investment process.
68%
Has Has not

PORTFOLIO RISK MANAGEMENT
of asset managers support for at least one shareholder resolution on climate change.
64%of asset owners supported at least one shareholder resolution on climate change (up from 12% last year)
16%31 of 34 Leaders supported such resolutions, compared with 84% last year.
91%
42
Asset Managers 64%
16%Asset Owners
PROPORTION OF INVESTORS SUPPORTING AT LEAST ONE CLIMATE CHANGE RELATED SHAREHOLDER RESOLUTION
FIGURE 10 / ASSET MANAGERS VS ASSET OWNERS: VOTING RECORD ON CLIMATE
0 10 20 30 40 50 60 70 80 90 100
Supported at least one
Did not support
CLIMATE-RELATED SHAREHOLDER RESOLUTIONS
The number of climate –related shareholder resolutions continues to grow.
The big change in this year’s voting season was the level of management support, particularly on the strategic resilience resolutions championed by the Aiming for A investor coalition, and those following a similar model.
The success of these resolutions is a testament to collaborative engagement which is challenging boards to recognise these issues and take action. US-based asset owners still lag behind their peers – only 14% of US funds voted in support of a climate change related resolution, compared to 48% in Oceania and 21% in Europe.
As with asset owners, there’s a significant proportion of asset managers taking positive action on climate change at corporate AGMs.
64% of managers voted in favour of at least one climate change resolution during the 2016 AGM season. Most importantly, 50% of managers were willing to vote against management in the Exxon #12 proposal requiring a report on climate change impact assessment highlighting the growing concern of investors for the impact the shift to a low carbon economy may have on the strategic business plans of these fossil fuel majors.
In contrast, just 13% of asset owners were willing to go against management guidance for this vote (this was 46% vs 11% respectively for the similar Chevron proposal).
However, as uncovered by AODP’s Investor Engagement report6, of the three largest asset managers, only State Street was willing to support this resolution in defiance of management recommendation to vote against.
CAPABILITIES

“ BP AND SHELL’S RESPONSES INDICATE THAT SUPPORTIVE BUT STRETCHING SHAREHOLDER RESOLUTIONS CAN PLAY A POSITIVE STEWARDSHIP ROLE. THEY FOCUS ATTENTION ON AN INCREASINGLY COMPLEX CAPITAL ALLOCATION CHALLENGE FOR ENERGY COMPANIES, INVESTORS AND POLICY MAKERS.”HELEN WILDSMITH HEAD OF ETHICAL & RESPONSIBLE INVESTMENT AT CCLA

No, we do not consider this risk
Six asset managers assess stranded assets exposure for fossil fuel holdings.
12%Just 30 asset owners measure portfolio-level risk of stranded assets, up from 24 last year.
6%23 Leaders measure this in some way compared with 45% last year.
68%
46
Leaders 23
7
9
16Others
PROPORTION OF ASSET OWNERS
FIGURE 12 / ASSET OWNERS ASSESSING STRANDED ASSET EXPOSURE FOR FOSSIL FUEL HOLDINGS
0 10 20 30 40 50 60 70 80 90 100
Yes, we measure stranded asset risks
No, we expect our managers to measure and manage these risks at the asset levels
No information available
Leaders 2
4 9Others
PROPORTION OF ASSET MANAGERS
FIGURE 13 / ASSET MANAGERS ASSESSING STRANDED ASSET EXPOSURE FOR FOSSIL FUEL HOLDINGS
0 10 20 30 40 50 60 70 80 90 100
Yes, we measure stranded asset risks
No, we manage these risks at the company/asset level
Asset Managers 12%
6%
18%
5%Asset Owners
PROPORTION OF INVESTORS ASSESSING STRANDED ASSET EXPOSURE FOR FOSSIL FUEL HOLDINGS
FIGURE 11 / ASSET MANAGERS VS ASSET OWNERS: STRANDED ASSETS ASSESSMENT
0 10 20 30 40 50 60 70 80 90 100
Yes, we measure stranded asset risks
No, we do not consider this risk
No, we manage these risks at the company/asset level
While other key factors in managing the financial risks, and opportunities, of climate change have begun to take hold, this is one key area that is still lagging at an overall Index level. Unsurprisingly, it’s the Leaders who are taking significant steps here, with a 64% increase in their number who have undertaken this analysis during the past year.
Additionally, a number of disclosers this year have indicated this is either currently underway or on their agenda for the coming year, so we hope to see the results showing in next year’s report. Difficulties associated with identification, measurement and cost are a potential cause of this risk assessment not being more widely adopted.
PORTFOLIO RISK MANAGEMENT
CAPABILITIES
STRANDED ASSETS

METRICS & TARGETS
CAPABILITIES
10 assets managers calculate their portfolio carbon emissions.
20%66 assets owners calculate their portfolio carbon emissions – a 27% increase from 2016 (10%, 52).
13%17 Leaders declare an emissions intensity reduction target for next year, almost doubling from last year (9, 29%).
50%PORTFOLIO CARBON EMISSIONS
While more asset owners are calculating their portfolio carbon emissions intensity, overall still only 25 asset owners (5%) set an portfolio carbon emissions intensity reduction target, up from 14 (2.8%) last year. Many respondents have identified the need to undertake further analysis before setting such targets, so this number is expected to increase in the near term.
Some Leaders measure portfolio carbon footprint, but don’t set reduction targets, with lack of standards and reliability of information often cited as a reason. The TCFD scenario analysis guidelines are likely to increase this significantly as more create bases cases that are more carbon savvy than short term markets.
Asset Managers 20%
13%Asset Owners
PROPORTION OF INVESTORS CALCULATING PORTFOLIO CARBON EMISSIONS
FIGURE 14 / ASSET MANAGERS VS ASSET OWNERS: PORTFOLIO CARBON EMISSIONS
0 10 20 30 40 50 60 70 80 90 100
Yes
No
FIGURE 15 / ASSET OWNERS CALCULATING PORTFOLIO CARBON EMISSIONS
PROPORTION OF ASSET OWNERS
0 10 20 30 40 50 60 70 80 90 100
Bystanders
Learners
Challengers
Leaders
Laggards
31
21
12
2
Yes No
FIGURE 16 / ASSET MANAGERS CALCULATING PORTFOLIO CARBON EMISSIONS
PROPORTION OF ASSET MANAGERS
0 10 20 30 40 50 60 70 80 90 100
Yes No
Bystanders
Learners
Challengers
Leaders
Laggards
2
5
2
1
48

CAPABILITIES
The Environment Agency Pension Fund highest ranking asset owner with 26% of AUM invested in low carbon investments. ABP again ranks #1 in absolute terms.
26%APG Investment Management is the top asset manager in both proportion of AUM and absolute terms, with 9.4% and $41bn.
9.4%$203 billion or 0.5% of asset owner Index AUM has been specifically identified as low carbon investments, a 68% increase from last year’s $138bn (last year saw a 63% rise).
68%
50
LOW CARBON INVESTMENT
This year sees another big increase in low carbon investment, indicating disclosure is improving, more capital is transitioning into the low carbon economy or, more likely, a combination of both. The difficulties of quantifying this persists, even where investments are disclosed, often it is not quantified. A key barrier is a clear methodology for defining which assets qualify as low carbon, across asset classes. Where possible, the Low Carbon Investment (LCI) Registry’s Taxonomy of Eligible Investments has been used7. The Climate Bonds Initiative continues to develop its Standard and Certification8 framework, which provides a useful tool for investors to assess the environmental credibility of their investments.
Only $95 billion or 0.2% of asset manager Index AUM has been specifically identified as low carbon investments, indicating a lower level of disclosure and quantification by managers. APG Investment Management ranks top on both a proportional and absolute basis, with 9.4% AUM and $41bn disclosed. BNP Paribas ranks second, investing 3.4% of its total AUM, or $21bn, in low carbon assets. M&G Investments takes third place.
On a regional basis, it is clear that European asset managers are much more transparent in quantifying their low carbon investments, making up 98% of the disclosed total. In total, 16 managers invest $93.3bn, an average of 1.2% AUM. No manager within the Asia Pacific region quantified this.
However, New Zealand leads the country table for low carbon investment by asset owners on a proportional basis 3.2% of total NZ Index AUM, while the US comes in top on an absolute basis with an aggregate of $55 billion invested in low carbon – but this is only 0.5% of total US AUM reported in the Index. In contrast, only one US manager quantifies low carbon investment of $1.4bn, 0.3% of their portfolio AUM.
If US asset owners matched the NZ investment proportion, their LCI would rise to $327 billion. If all countries were to divert the same percentage, an additional $1.3 trillion would flow into the low carbon economy.
METRICS & TARGETS
FIGURE 17 / TOP 10 COUNTRIES FOR LOW CARBON INVESTMENT BY ASSET OWNERS
PROPORTION OF AUM IN LOW CARBON INVESTMENT
France
PROPORTION OF ASSET OWNERS DISCLOSING LOW CARBON INVESTMENT = Total Country LCI
0% 10% 20% 30% 40% 50% 90%60% 70% 80%
4.0%
3.5%
3.0%
2.5%
2.0%
1.5%
0.5%
0.0%
Denmark
Netherlands
Sweden
New Zealand
Norway
Australia
Finland
UK
1.0%
USACanada

1%
FIGURE 18 / LOW CARBON INVESTMENT BY ASSET MANAGERS (BY COUNTRY)
52
PERCENTAGE OF ASSET MANAGERS DISCLOSING LOW CARBON INVESTMENT
PROPORTION OF AUM IN LOW CARBON INVESTMENT
= Total Counry LCD in USD
0 20% 40% 60% 80% 100%
7%
6%
5%
4%
3%
2%
0%
France
Netherlands
Germany
Italy
UK
USA Switzerland
THIS YEAR SEES ANOTHER BIG INCREASE IN LOW CARBON INVESTMENT, INDICATING DISCLOSURE IS IMPROVING AND MORE CAPITAL IS TRANSITIONING INTO THE LOW CARBON ECONOMY.

CLIMATE CHANGE IS NOW A MAINSTREAM CONCERN THROUGHOUT THE INVESTMENT COMMUNITY, AND ACTIVITY IS GATHERING UNSTOPPABLE MOMENTUM. A 60% MAJORITY OF ASSET OWNERS RECOGNISE THE FINANCIAL RISKS – AND OPPORTUNITIES – OF CLIMATE CHANGE, AND ARE TAKING ACTION, WITH GROWING NUMBERS SCALING UP THEIR ACTIVITIES.
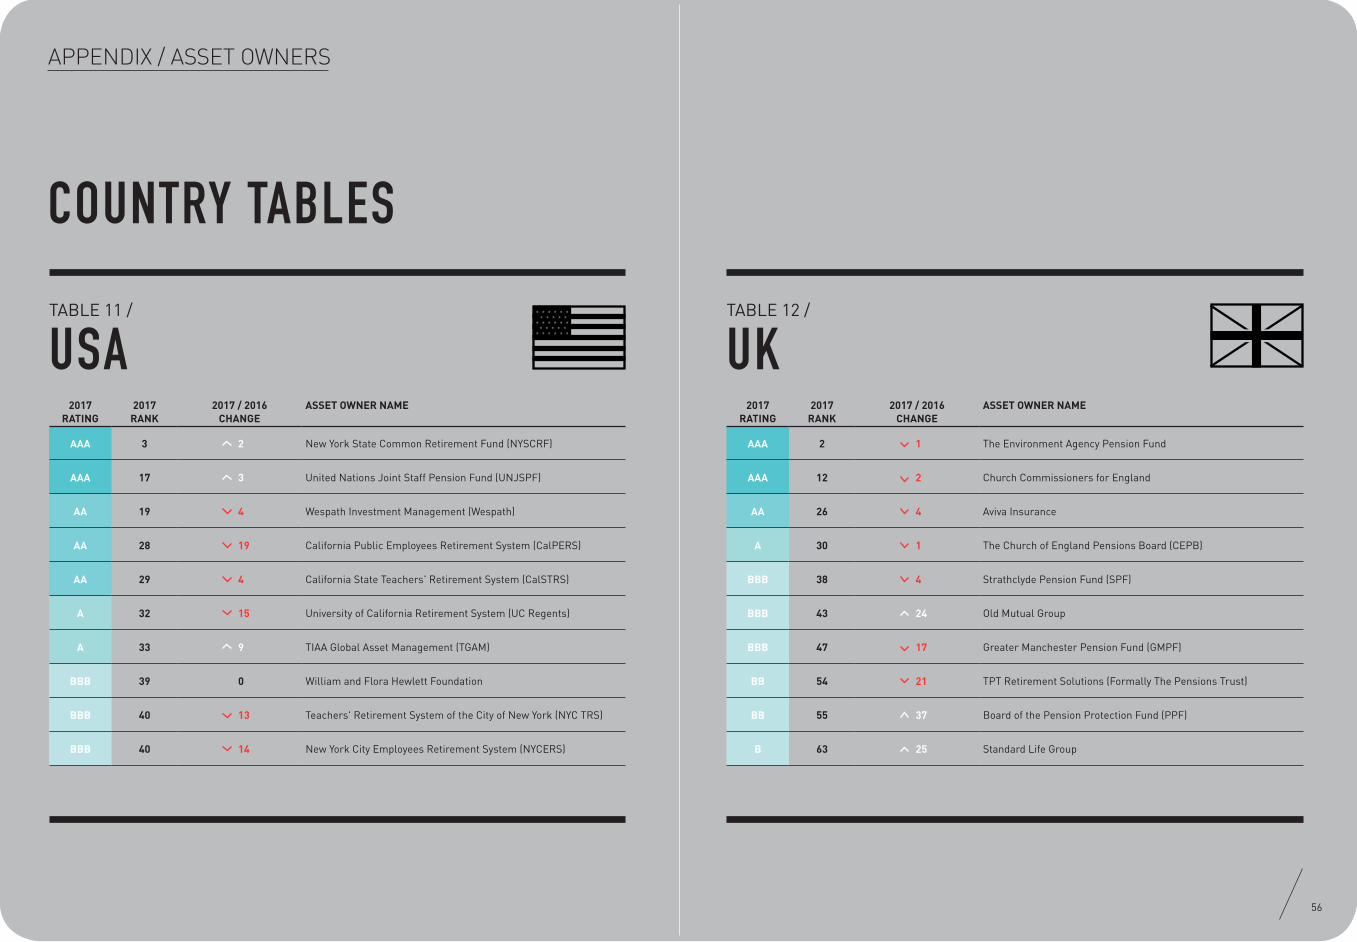
USA UK2017
RATING2017
RANK2017 / 2016
CHANGEASSET OWNER NAME
AAA 3 2 New York State Common Retirement Fund (NYSCRF)
AAA 17 3 United Nations Joint Staff Pension Fund (UNJSPF)
AA 19 4 Wespath Investment Management (Wespath)
AA 28 19 California Public Employees Retirement System (CalPERS)
AA 29 4 California State Teachers' Retirement System (CalSTRS)
A 32 15 University of California Retirement System (UC Regents)
A 33 9 TIAA Global Asset Management (TGAM)
BBB 39 0 William and Flora Hewlett Foundation
BBB 40 13 Teachers' Retirement System of the City of New York (NYC TRS)
BBB 40 14 New York City Employees Retirement System (NYCERS)
2017 RATING
2017 RANK
2017 / 2016 CHANGE
ASSET OWNER NAME
AAA 2 1 The Environment Agency Pension Fund
AAA 12 2 Church Commissioners for England
AA 26 4 Aviva Insurance
A 30 1 The Church of England Pensions Board (CEPB)
BBB 38 4 Strathclyde Pension Fund (SPF)
BBB 43 24 Old Mutual Group
BBB 47 17 Greater Manchester Pension Fund (GMPF)
BB 54 21 TPT Retirement Solutions (Formally The Pensions Trust)
BB 55 37 Board of the Pension Protection Fund (PPF)
B 63 25 Standard Life Group
APPENDIX / ASSET OWNERS
COUNTRY TABLES
56
TABLE 11 / TABLE 12 /

COUNTRY TABLES
58
2017 RATING
2017 RANK
2017 / 2016 CHANGE
ASSET OWNER NAME
B 67 69 Zurich Insurance Group
CC 83 23 Oak Foundation
C 104 119 Swiss Federal Pension Fund (PUBLICA)
D 150 21 Pensionskasse SBB (PK SBB)
D 161 96 Pensionskasse Post (Pkpost)
D 165 39 Swiss Re
D 181 36 Swiss Mobiliar Insurance & Pensions
D 186 6 Helvetia Group
D 213 55 Compenswiss (Swiss Federal Social Security Funds)
D 218 94 Pension Fund City of Zurich (PKZH)
2017 RATING
2017 RANK
2017 / 2016 CHANGE
ASSET OWNER NAME
AAA 5 1 Stichting Pensioenfonds ABP (ABP)
AAA 6 12 Pensioenfonds Zorg en Welzijn (PFZW)
AA 21 7 Bedrijfspensioenfonds voor de Landbouw (BPL)
AA 22 9 Unilever Pension Funds
BBB 40 - Aegon N.V.
BB 49 47 Achmea Holding
CCC 69 80 Bedrijfstakpensioenfonds voor de Bouwnijverheid (bpfBOUW)
CCC 71 15 Stichting Pensioenfonds PGB
CCC 74 149 Pensioenfonds voor de Detailhandel (BpfD)
CCC 77 146 Pensioenfonds van de Metalektro (PME)
APPENDIX / ASSET OWNERS
SWITZERLAND NETHERLANDSTABLE 13 / TABLE 14 /

COUNTRY TABLES
60
2017 RATING
2017 RANK
2017 / 2016 CHANGE
ASSET OWNER NAME
C 97 95 MS&AD Insurance Group
D 113 74 Sompo Japan Nipponkoa Holdings, Inc.
D 146 13 Dai-ichi Mutual Life Insurance Company
D 149 55 Government Pension Investment Fund (GPIF)
D 176 81 Nippon Life Insurance Company (Nissay)
D 207 50 Organization for Workers' Retirement Allowance Mutual Aid
D 213 44 National Pension Fund Association
D 218 26 Tokio Marine Holdings, Inc.
D 218 26 Sumitomo Mitsui Financial Group (SMFG)
D 236 32 T/D Holdings, Inc.
2017 RATING
2017 RANK
2017 / 2016 CHANGE
ASSET OWNER NAME
AAA 1 1 Local Government Super (LGS)
AAA 3 9 First State Super
AA 18 11 AustralianSuper
AA 19 - Vision Pooled Superannuation Trust (VPST)
A 31 7 BT Financial Group
A 34 13 Victorian Superannuation Fund (VicSuper)
BBB 35 0 MLC Super Fund
BBB 45 2 CareSuper
BBB 48 9 UniSuper
BB 50 10 Mercer Super Trust (MST)
APPENDIX / ASSET OWNERS
JAPAN AUSTRALIATABLE 15 / TABLE 16 /

COUNTRY TABLES
62
2017 RATING
2017 RANK
2017 / 2016 CHANGE
ASSET OWNER NAME
B 61 10 OPSEU Pension Trust (OPTrust)
CC 83 66 Manulife Financial
CC 85 64 B.C. Public Service Pension Plan
C 86 106 Industrial Alliance Insurance and Financial Services (IA)
C 89 28 B.C. Teachers Pension Fund
C 89 134 B.C. Municipal Pension Plan (MPP)
C 104 88 Great-West Lifeco Inc. (GWL)
C 106 31 Canada Pension Plan Investment Board (CPPIB)
C 109 44 Ontario Teachers Pension Plan (OTPP)
D 141 116 Alberta Heritage Savings Trust Fund (HSTF)
2017 RATING
2017 RANK
2017 / 2016 CHANGE
ASSET OWNER NAME
AAA 11 5 Fonds de Réserve pour les Retraites (FRR)
AAA 14 4 Etablissement de retraite additionnelle de la Fonction Publique (ERAFP)
AA 23 17 AXA Group
AA 24 11 Caisse des Dépôts (CDC)
CCC 76 11 CNP Assurances Group
CC 79 125 BPI France (BPI)
C 96 15 Crédit Agricole Assurances (CAA)
D 129 57 MAIF
D 207 94 SCOR Group (SCOR)
D 247 77 Natixis Insurance Division
APPENDIX / ASSET OWNERS
CANADA FRANCETABLE 17 / TABLE 18 /

COUNTRY TABLES
64
2017 RATING
2017 RANK
2017 / 2016 CHANGE
ASSET OWNER NAME
AAA 7 12 Kommunal Landspensjonskasse Gjensidige Forsikringsselskap (KLP)
AAA 8 5 Fjärde AP-Fonden (AP4)
AAA 9 214 Ilmarinen Mutual Pension Insurance Company
AAA 10 69 Elo Mutual Pension Insurance Company
AAA 13 7 Pensionskassernes Administration (PKA)
AAA 16 16 Sjunde AP-Fonden (AP7)
AA 25 17 Andra AP-Fonden (AP2)
AA 27 19 Tredje AP-Fonden (AP3)
BBB 36 38 Folksam Group
BBB 36 54 Storebrand ASA
2017 RATING
2017 RANK
2017 / 2016 CHANGE
ASSET OWNER NAME
AAA 8 5 Fjärde AP-Fonden (AP4)
AAA 16 16 Sjunde AP-Fonden (AP7)
AA 25 17 Andra AP-Fonden (AP2)
AA 27 19 Tredje AP-Fonden (AP3)
BBB 36 38 Folksam Group
BB 52 14 Sjätte AP-Fonden (AP6)
BB 53 30 AMF
B 60 4 KPA Pension
CCC 70 18 Första AP-Fonden (AP1)
CCC 78 16 Alecta
APPENDIX / ASSET OWNERS
SCANDINAVIA SWEDENTABLE 19 / TABLE 20 /

COUNTRY TABLES
2017 RATING
2017 RANK
2017 / 2016 CHANGE
ASSET OWNER NAME
AAA 9 214 Ilmarinen Mutual Pension Insurance Company
AAA 10 69 Elo Mutual Pension Insurance Company
B 66 157 Varma Mutual Pension Insurance Company
D 205 29 Local Government Pensions Institution (Keva)
D 213 44 Sampo Group
D 255 132 Valtion Eläkerahasto (State Pension Fund)
2017 RATING
2017 RANK
2017 / 2016 CHANGE
ASSET OWNER NAME
AAA 7 12 Kommunal Landspensjonskasse Gjensidige Forsikringsselskap (KLP)
BBB 36 54 Storebrand ASA
BBB 44 0 Government Pension Fund Global (GPFG)
D 132 46 Government Pension Fund Norway (GPFN)
66
2017 RATING
2017 RANK
2017 / 2016 CHANGE
ASSET OWNER NAME
AAA 13 7 Pensionskassernes Administration (PKA)
BB 59 198 Danica Pension
B 62 13 Velux Foundation
B 63 19 PensionDanmark
D 133 3 PFA Pension
D 136 40 Pensionskassen for Magistre & Psykologer (MP Pension)
D 160 16 Sampension
D 161 65 Arbejdsmarkedets Tillaegspension (ATP)
APPENDIX / ASSET OWNERS
DENMARK
NORWAY
FINLAND
TABLE 21 /
TABLE 22 /
TABLE 23 /

APPENDIX / ASSET MANAGERS
REGIONAL TABLES
TABLE 24 / REGION: EMEA
TABLE 25 / REGION: ASIA PACIFIC
68
2017 RATING
2017 RANK
ASSET MANAGER NAME
AAA 1 APG Asset Management
AA 2 Legal & General Investment Management
BBB 3 Aviva Investors
BBB 4 M&G Investments
BBB 5 Schroders Investment Management
BB 6 Allianz Global Investors
BB 7 Natixis Global Asset Management
BB 8 AXA Investment Managers
B 9 Deutsche Asset Management
B 10 HSBC Global Asset Management
2017 RATING
2017 RANK
ASSET MANAGER NAME
D 33 Macquarie
D 34 Sumitomo Mitsui Trust Group
D 46 Nomura Asset Management
TABLE 26 / REGION: AMERICAS
2017 RATING
2017 RANK
ASSET MANAGER NAME
C 15 Goldman Sachs Asset management
C 16 BlackRock Inc
C 18 J.P. Morgan Asset Management
C 18 Morgan Stanley
C 21 PIMCO
C 23 AllianceBernstein
D 24 Dimensional Fund Advisors
D 25 State Street Global Advisors
D 26 Columbia Threadneedle Investments
D 28 RBC Global Asset Management

DATA TABLES
TABLE 27 / RATINGS BANDS
2017 2016 CHANGE
RATING # ASSET OWNERS
AUM USD BILLION
# ASSET OWNERS
AUM USD BILLION
# %
AAA 17 $1,230 12 $1,141 5 42%
AA 12 $1,888 8 $641 4 50%
A 5 $1,044 11 $896 -6 -55%
BBB 14 $1,537 15 $2,280 -1 -7%
BB 11 $956 4 $17 7 175%
B 9 $611 6 $1,089 3 50%
CCC 10 $764 8 $570 2 25%
CC 7 $419 17 $1,092 -10 -59%
C 27 $2,212 16 $1,695 11 69%
D 187 $16,556 157 $13,969 30 19%
X 201 $12,508 246 $14,348 -45 -18%
Total 500 $39,725 500 $37,737
# ASSET OWNERS
CHANGE AUM USD BILLION
CHANGE
CATEGORY 2017 2016 # % 2017 2016 # %
Leaders Top 7% A PACK 34 31 3 10% $4,163 $2,678 $1,484 55%
Challengers 7% – 14% B PACK 34 25 9 36% $3,103 $3,386 -$284 -8%
Learners 14% – 22% C PACK 44 41 3 7% $3,395 $3,356 $39 1%
Bystanders 22% – 60% D 187 157 30 19% $16,556 $13,969 $2,587 19%
Laggards Bottom 40% Zero score X 201 246 -45 -18% $12,508 $14,348 -$1,840 -13%
Total 500 500 $39,725 $37,737 $1,988 5%
# ASSET OWNERS
CHANGE AUM USD BILLION
CHANGE
CATEGORY 2017 2016 # % 2017 2016 $ %
Endowment C 11 12 -1 -8% $342 $356 -$14 -4%
Foundation CC 9 8 1 13% $179 $166 $13 8%
Pension fund C 307 322 -15 -5% $15,363 $15,868 -$505 -3%
Sovereign wealth fund D 35 38 -3 -8% $5,987 $5,821 $166 3%
Insurance company D 137 118 19 16% $17,802 $15,458 $2,344 15%
Mutual fund CCC 1 2 -1 -50% $51 $67 -$16 -24%
Total 500 500 $39,725 $37,737 $1,988 5%
TABLE 28 / ASSET OWNERS BY RATING SUMMARY TABLE
TABLE 29 / ASSET OWNERS BY CATEGORY SUMMARY TABLE
70
APPENDIX / ASSET OWNERS

DATA TABLES
TABLE 30 / RATINGS BANDS
RATING # ASSET MANAGERS
AUM USD BILLION
AAA 1 $442
AA 1 $1,140
A 0 $-
BBB 3 $1,283
BB 3 $2,156
B 2 $1,210
CCC 1 $671
CC 3 $1,359
C 9 $11,421
D 24 $20,557
X 3 $3,199
Total 50 $43,437
CATEGORY # ASSET MANAGERS
AUM USD BILLION
Leaders Top 4% A PACK 2 $1,582
Challengers 4% - 20% B PACK 8 $4,649
Learners 20% - 46% C PACK 13 $13,451
Bystanders 46% - 94% D 24 $20,557
Laggards Bottom 6% Zero score X 3 $3,199
Total 50 $43,437
TABLE 31 / ASSET MANAGERS BY RATING SUMMARY TABLE
72
APPENDIX / ASSET MANAGERS

APPENDIX
METHODOLOGY
The AODP Global Climate 500 Index provides stakeholders with a ranking and rating to indicate how each major institutional investor performs in managing their exposure to climate risk. The objective of the survey is to encourage integration of climate change capability in portfolio management across the investment sector.
The survey comprises 37 questions covering the following three key areas assessing the investor’s capability in managing portfolio climate risk:
C
The survey has been remapped this year to align to the FSB TCFD’s proposed framework for disclosure, to assist asset owners and managers in assessing their readiness for any forthcoming reporting requirements. Past years’ results have also been realigned in these categories to reflect the new categories to maintain comparability.
The ratings are based on a mixture of publicly available information and asset owner disclosures. The world’s largest long-term asset owners (pension funds, insurers, sovereign wealth funds, foundations and endowments) with at least USD2 billion in assets under management were invited to participate in this year’s survey. This year, we also invited the Top 50 global asset managers to participate. Survey responses were used to rank and rate the asset owners to create the AODP Global Climate 500 Index.
The top 500 asset owners (by AUM) and any of the top 50 asset managers that decline the invitation to participate are researched by our team of analysts and assessed using publicly available information or information provided to us by their members or stakeholders. Investors are scored on actions implementing elements of climate risk best practice in their investment process.
Once all research is completed, peer reviewed and validated; the Ratings Manager aggregates all scores. Annual rating bands are determined statistically and each participant assigned a rating applicable to their aggregated score, from AAA through to D grade, with an additional X category for those that appear to be doing absolutely nothing to manage climate risk.
74
RATING CATEGORY DESCRIPTION FACTORS
AAA Leaders Elite Demonstrates elite performance across all capabilities
AA Leaders Excellent Demonstrates excellence in all capabilities
A Leaders Extremely Strong Demonstrates strong performance across capabilities
BBB Challengers Very Strong Taking advanced actions in mulitple capabilities
BB Challengers Strong Developing sophistication across multiple capabilities
B Challengers Advancing Progressing to a wider variety of capabilities
CCC Learners Above Average Considerable tangible action taken in at least one capability
CC Learners Developing Progressively more action taken in at least one capability
C Learners Average Starting to take action in at least one capablitity
D Bystanders Below Average Limited disclosure on financial implications of climate change in investments
X Laggards Zero Score No evidence of considering financial implications of climate change in investments
– Organisation structure and approach it uses to oversee climate risk objectives.
– Degree of integration of climate risk principles in the organisation’s policies and processes.
GOVERNANCE & STRATEGY
– Variety and effectiveness of tools and approaches used to evaluate and manage climate change related financial risks and opportunities. This includes engagement, voting practices, and portfolio management tools.
PORTFOLIO RISK MANAGEMENT
– Key metrics used to measure, monitor and compare portfolio climate risk management performance, including the value asset owners have invested in low carbon assets.
METRICS & TARGETS
RATINGS BANDS

REFERENCES
1 http://uk.reuters.com/article/uk-britain-gib-court-idUKKBN1792XV
2 https://www.nytimes.com/2017/01/05/world/asia/china-renewable-energy-investment.html?_r=0
3 http://news.kuwaittimes.net/website/renewable-energy-covers-15-kuwaits-consumption-2030-minister-gcc-states-invest-100-billion-renewable-energy/
4 http://fortune.com/2017/01/16/saudi-arabia-renewable-energy-program/
5 http://money.cnn.com/2017/01/11/news/economy/uae-alternative-energy-investment/
6 http://aodproject.net/exxonmobil-investor-engagement-report/
7 http://globalinvestorcoalition.org/wp-content/uploads/2015/10/LCI-Registry-Taxonomy_3rd-Release_211015.pdf
8 https://www.climatebonds.net/standards
ACKNOWLEDGEMENTSREPORT WRITTEN AND PRODUCED BY: LEANNE BOUVET, PAVEL KIRJANAS
THE ASSET OWNERS DISCLOSURE PROJECT GIVES SPECIAL THANKS TO THE FOLLOWING PEOPLE IN PRODUCING THIS REPORT:
BENITA AINABE, FRÉDÉRIC BACH, JEREMY BOURDON, ANDREW CAESAR, CLARENCE GAN, ROSS GRAY, WENDY HAPGOOD, WENXIN HUAI, TERESA KNOERR, LOUISE MACDONALD, REBECCA MACIES, EFUA MERCER, TIFFANY PAN, LISA STAHL, BONITA YIP
THE ONGOING SUPPORT OF AODP’S FUNDERS IS ACKNOWLEDGED. A FULL LIST CAN BE FOUND ON OUR WEBSITE (WWW.AODPROJECT.NET).
THE VIEWS IN THIS REPORT REMAIN THOSE OF AODP.
76

WWW.AODPROJECT.NET