Obstfeld & Rogoff - Foundations of International Macroeconomics

Global capital competition
Michel Henry BouchetSeptember 2013

M.H. Bouchet/SKEMA (c) 2013
Global capital competition
The race for attractingGlobal capital flows
September-December 2013
Michel Henry Bouchetwww.developingfinance.org

A few Misconceptions and Myths
Myth 1: Financial Globalization is for ever: there is an ever wider capital mobility worldwide
Facts: Don’t take it for granted! There are sharp declines in capital mobility in times of crisis, and crises are numerous!
M.H. Bouchet/SKEMA (c) 2013
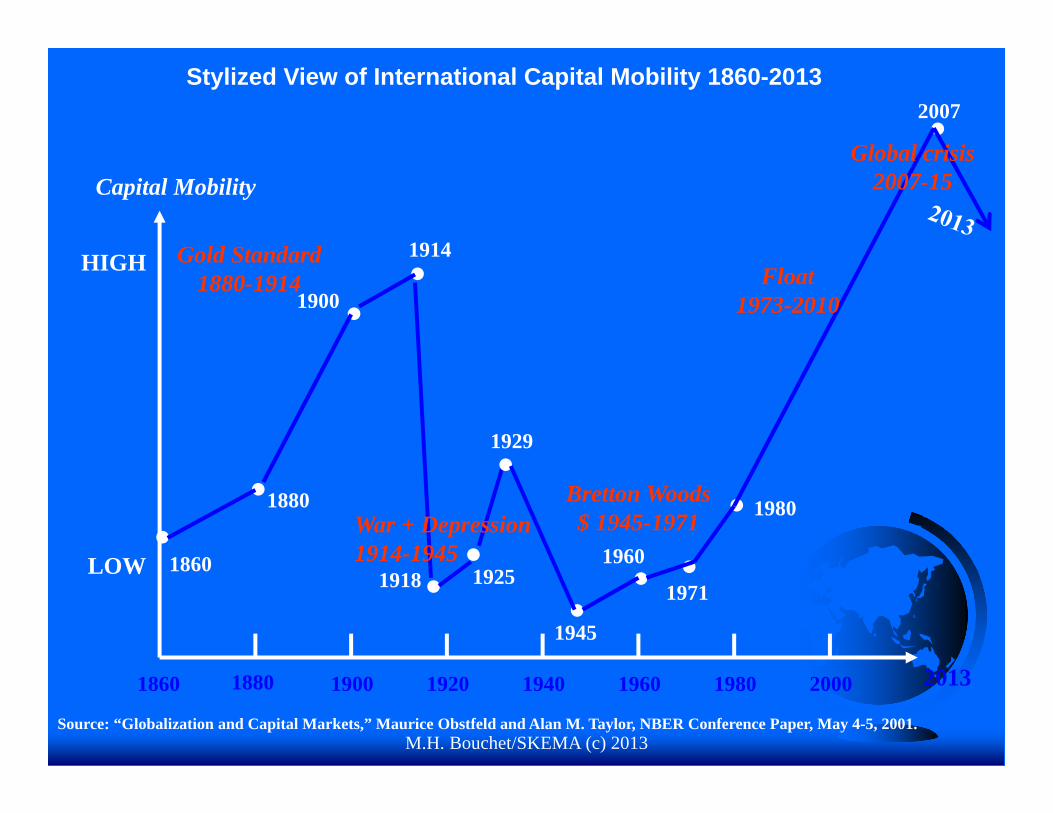
Stylized View of International Capital Mobility 1860-2013
Source: “Globalization and Capital Markets,” Maurice Obstfeld and Alan M. Taylor, NBER Conference Paper, May 4-5, 2001.
LOW
HIGH
Capital Mobility
18801860 1900 1920 1940 1960 1980 2000
•
•
• • •
•
•
•• •
••
1880
1900
1914
1929
1860 19251918
1945
1960
1971
1980
2007
Bretton Woods$ 1945-1971War + Depression
1914-1945
Float1973-2010
Gold Standard1880-1914
M.H. Bouchet/SKEMA (c) 2013
Global crisis2007-15
2013

Global capital flows: crises and cycles
MH BOUCHET Global Finance-SKEMA 2013McKinsey 2013
M.H. Bouchet/SKEMA (c) 2013
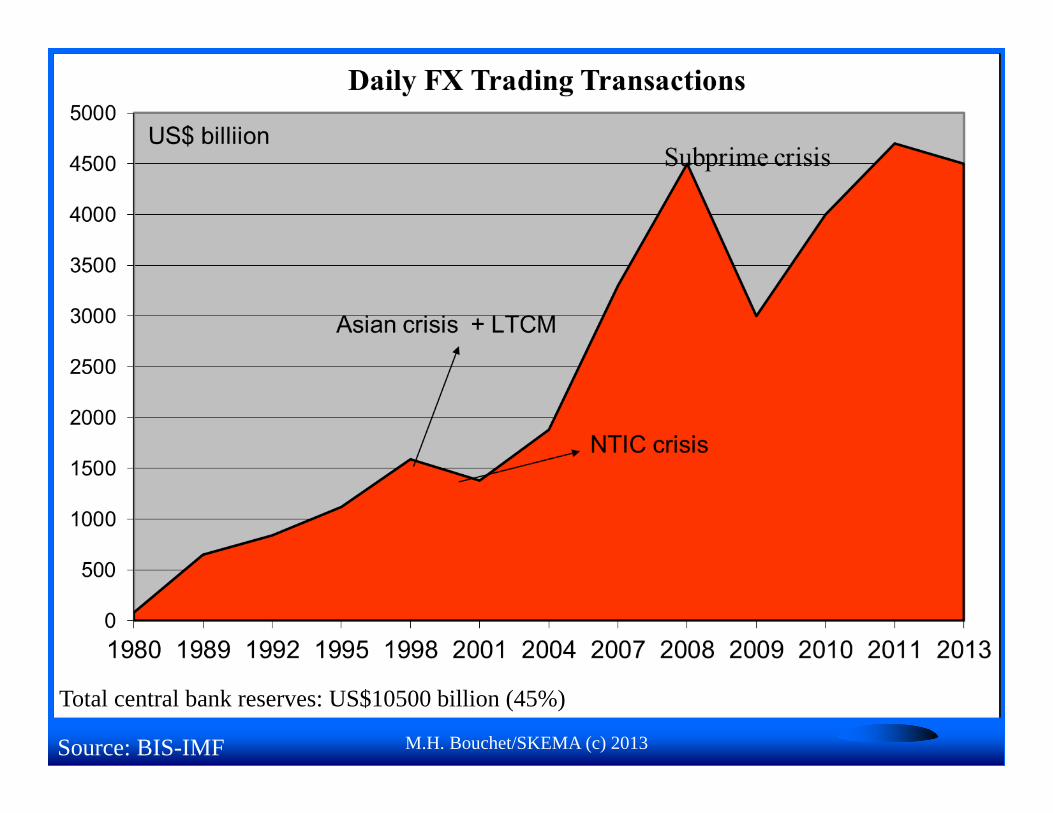
Total central bank reserves: US$10500 billion (45%)
Source: BIS-IMF
M.H. Bouchet/SKEMA (c) 2013
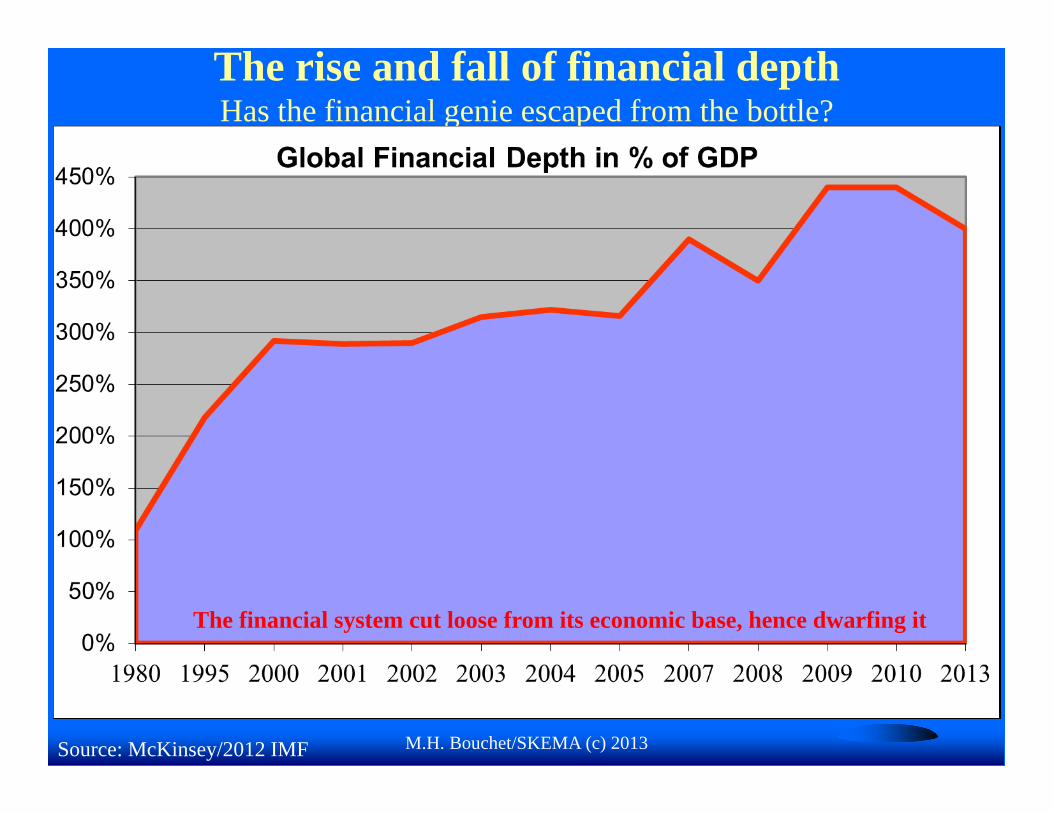
The rise and fall of financial depthHas the financial genie escaped from the bottle?
Source: McKinsey/2012 IMF
The financial system cut loose from its economic base, hence dwarfing it

The rise and fall of net private capital flows to EMCs 2002-14
M.H. Bouchet/SKEMA (c) 2013
A few Misconceptions and Myths Myth 2: Capital flows from rich to poor countries, which have
< capital and offer > returns. By borrowing abroad, LDCs should be able to boost investment and growth rates!
Fact 1: capital is flowing « uphill » and the US CAD isfinanced by emerging countries’ purchase of US Treasurysecurities
Fact 2: US bond yields are 2% lower than they otherwisewould be, thanks to the purchase of US securities by China and other EMCs. If these countries loose their appetite for US assets, bond yields could jump and the dollar plunge!
M.H. Bouchet/SKEMA (c) 2013

M.H. Bouchet/SKEMA (c) 2013
Where do capital flows come from?

M.H Bouchet- SKEMA (c) 2013
Who finances whom?Current account balances of OECD (34) and EMCs (160)
US$ billion
Source: IMF-WEO 2013

Global financial consequences of the Shale gas revolution: change in current account balance as % of GDP
M.H. Bouchet/SKEMA (c) 2013
M.H. Bouchet/SKEMA (c) 2013
Why do EMCs show such large CA surpluses and rising reserves?
1. 1982 debt crisis + 1994 Tequila crisis + 1997 Asia crisis + 1998 Russian crisis + 2001 Argentina crisis + global crisis 2008-13
2. Strong IMF-monitored adjustment + economic and trade liberalization
3. Surge in raw material and oil prices4. Devaluation + Boost in investment ratio=
Current account surplus + Reserve increase5. Improvement in debt indicators!
3. Myths and misconceptions
The richest developed countries with strong financial systems have surplus savings, hence capital exports
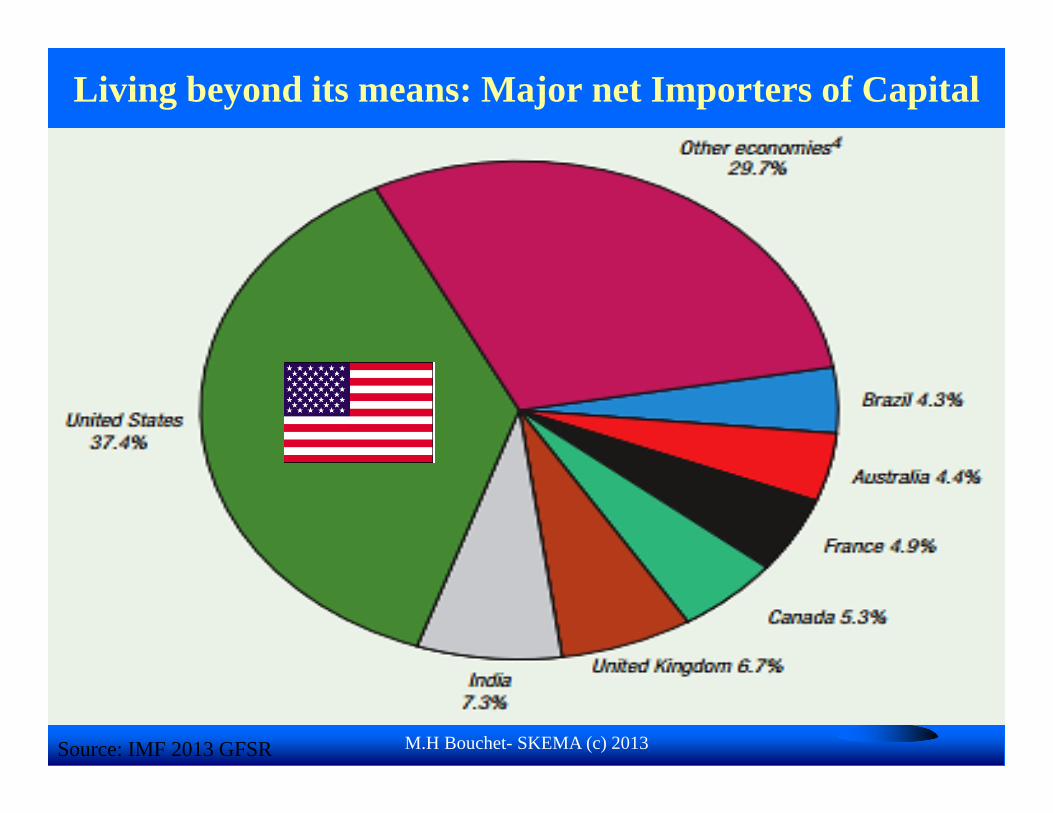
Facts: most of developed countries live « beyond their means » and must import capital
EMCs’ dynamic growth boosts savings relative to investment, hence a current account surplus (China!).
M.H. Bouchet/SKEMA (c) 2013

US structural trade and current account deficit1980-2013
M.H. Bouchet/SKEMA (c) 2013

M.H. Bouchet/SKEMA (c) 2013
Global competition in financial markets
DEFICIT
SURPLUS
?
-$500 billion= $1,4 billion/day
?
??
M.H Bouchet- SKEMA (c) 2013
Living beyond its means: Major net Importers of Capital
Source: IMF 2013 GFSR

M.H Bouchet- SKEMA (c) 2013
Net saving countries: Major Exporters of Capital
Source: IMF 2013

M.H. Bouchet/SKEMA (c) 2013
China’s hard currency reserves
$3500 billion
Σ reserves 2013= $11,000 b

China holds nearly ¼ of foreign holding of US debt
M.H. Bouchet/SKEMA (c) 2013
US Treasury 09/2012
US Treasury 08/2013
A few Misconceptions and Myths
Myth 4: Bulk of capital inflows to developing countries stems from official, bilateral and multilateral, creditors (IFIs and Paris Club)
Facts: Official net capital flows to EMCs are close to zero (6% of total net flows). External financing comes from private creditors, mainly FDI and capital markets, i.e., bonds
M.H. Bouchet/SKEMA (c) 2013
M.H. Bouchet/SKEMA (c) 2013
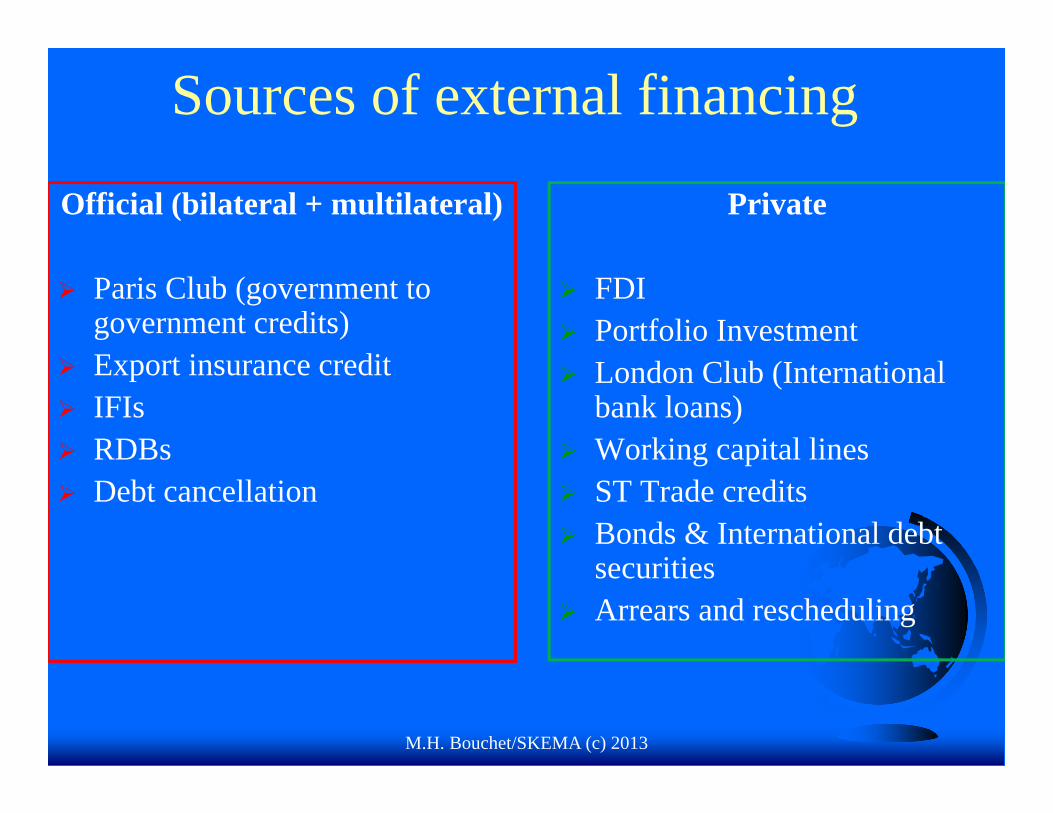
Sources of external financing
Official (bilateral + multilateral)
Paris Club (government to government credits)
Export insurance credit IFIs RDBs Debt cancellation
Private
FDI Portfolio Investment London Club (International
bank loans) Working capital lines ST Trade credits Bonds & International debt
securities Arrears and rescheduling

BOUCHET SKEMA 2013 (c)IIF-2013
A few Misconceptions and MythsExternal financing leads to debt increase, hence
looming liquidity and solvency problems.Facts: Indebtedness is a key ingredient of socio-
economic development process (in the US as much as in Germany, Korea or Japan!) to close the I/S gap
The key issue is how is the debt invested, i.e., the relationship between maturity profile of debt flows and of investment projects, as well as the relationships between interest rates and rate of return!
Reinhart and Rogoff (2009) have empirically established that a developed economy with > 90 % of GDP in public debt can barely manage it; that ceiling is at 60 % of GDP for EMCs (questionable!)
M.H. Bouchet/SKEMA (c) 2013

M.H. Bouchet/SKEMA (c) 2013
External Financing helps boosting GDP growth
M.H. Bouchet/SKEMA (c) 2013
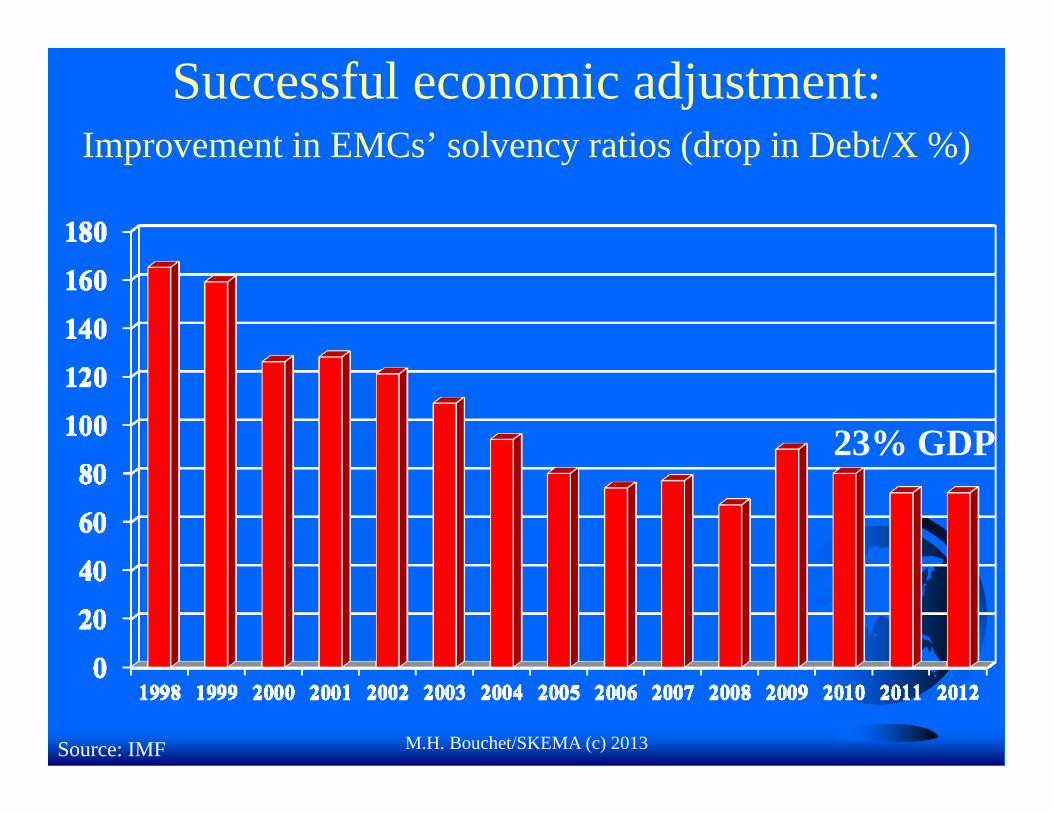
Successful economic adjustment:Improvement in EMCs’ solvency ratios (drop in Debt/X %)
Source: IMF
23% GDP

M.H. Bouchet/SKEMA (c) 2013
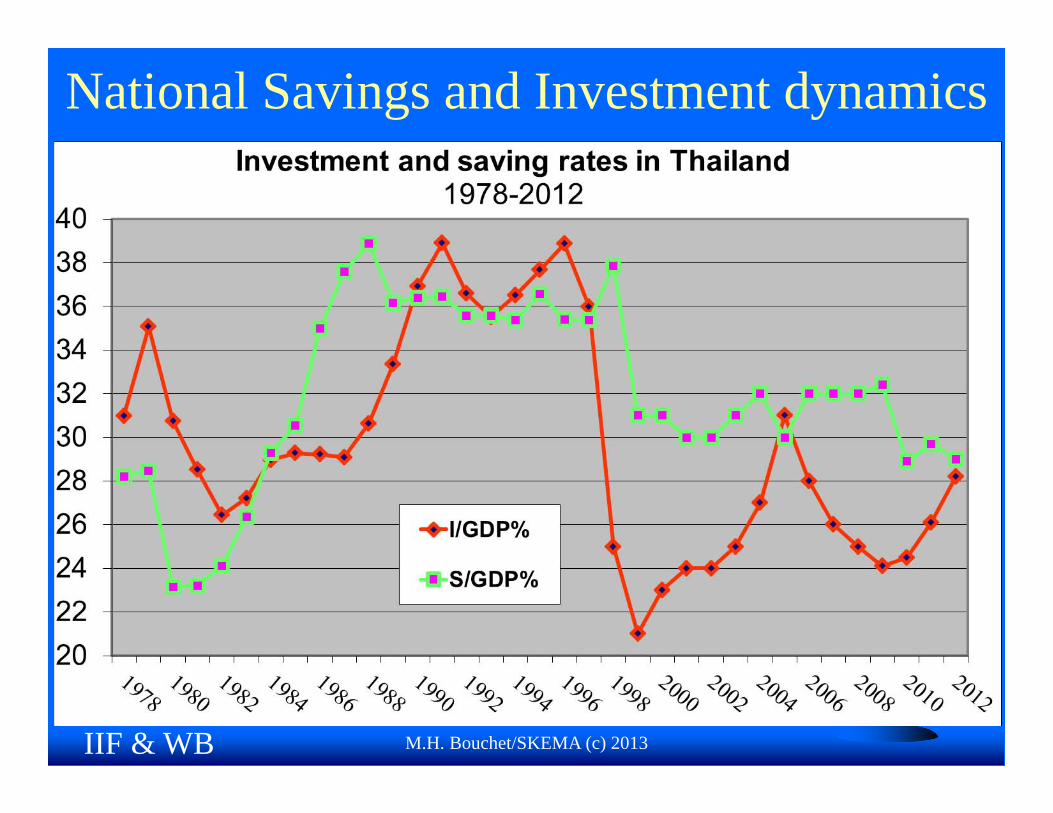
The dynamics of investmentI/GDP %
IMF &WBGDI
M.H. Bouchet/SKEMA (c) 2013
National Savings and Investment dynamics
IIF & WB
A few Misconceptions and MythsMyth 5: FDI is the prime source of long-term
financing of developing countries
Fact: Though developing countries are considered as key target markets, the bulk of FDI flows continue moving toward developed countries (>56%)
M.H. Bouchet/SKEMA (c) 2013
M.H. Bouchet/SKEMA (c) 2013
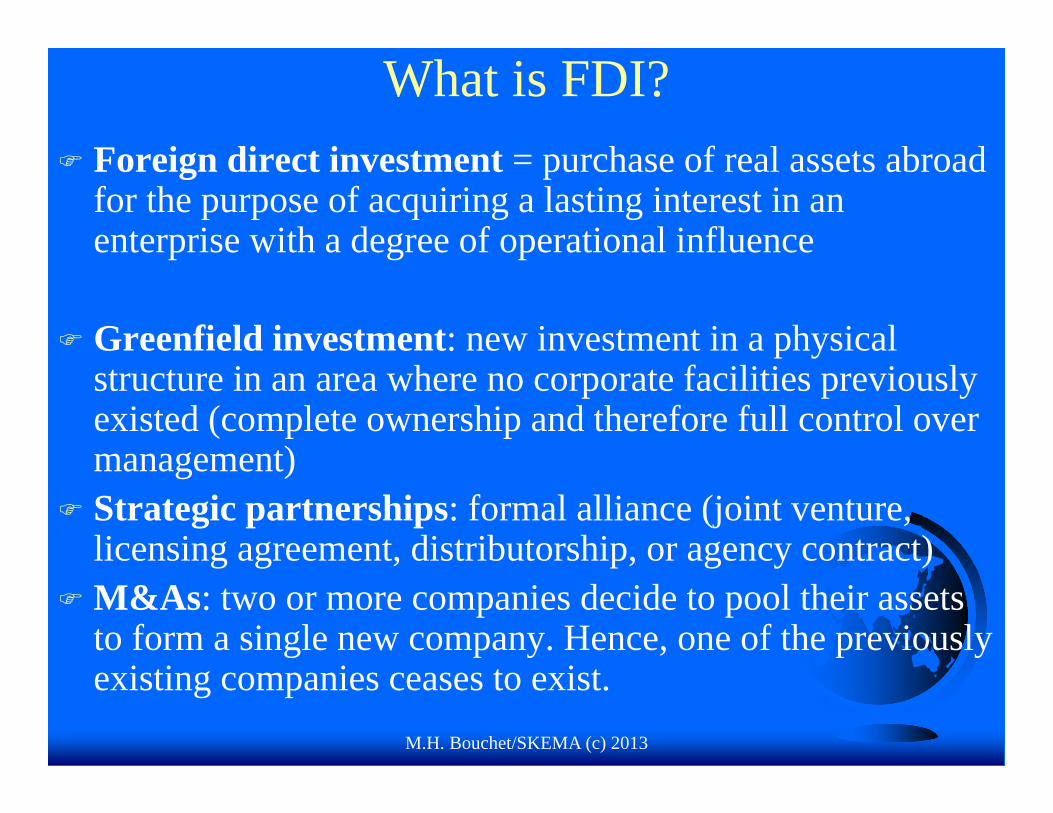
What is FDI? Foreign direct investment = purchase of real assets abroad
for the purpose of acquiring a lasting interest in an enterprise with a degree of operational influence
Greenfield investment: new investment in a physical structure in an area where no corporate facilities previously existed (complete ownership and therefore full control over management)
Strategic partnerships: formal alliance (joint venture, licensing agreement, distributorship, or agency contract)
M&As: two or more companies decide to pool their assets to form a single new company. Hence, one of the previously existing companies ceases to exist.
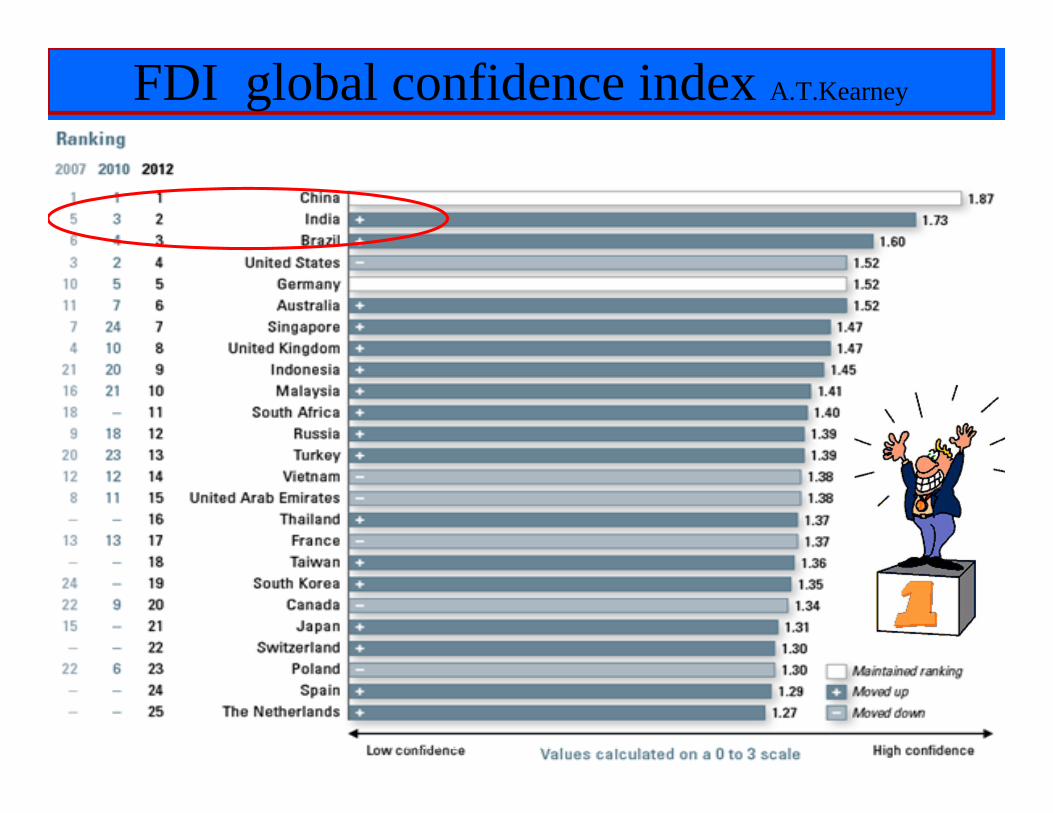
FDI global confidence index A.T.Kearney
M.H. Bouchet/SKEMA (c) 2013

These fast growing Emerging market countries are considered prime targets of FDI by global
private and institutional investors!
M.H. Bouchet/SKEMA (c) 2013

M.H. Bouchet/SKEMA (c) 2013
The most attractive EMCs
HIGHRisk
LOWRisk

Targetting the growing middle-class?
M.H. Bouchet/SKEMA (c) 2013

M.H. Bouchet/SKEMA (c) 2013
OECD (56%)
EMCs (44%)
ASIA (53%)LATIN
AMERICA
(30%)
EMCs
LATIN AMERICA
MEXICO (32%)
CHILE (10%)
PERU (4%)
ASIA
GLOBAL FDI FLOWS= $1500 billion
Source: OECD, UNCTAD 2012 ( )
CHINA25%

A few Misconceptions and MythsMyth 6: Rating agencies can assess, measure and
rank «global risk »
Facts: Rating agencies such as S&Ps, Moody’s and Fitch systematically missed the train. Shortsightedness added a model risk to market riskand country risk, hence no early warning signals!
See: Bouchet, Clark & Groslambert: Wiley, NY, 2005. http://www.cfr.org/united-states/credit-rating-controversy/p22328
M.H. Bouchet/SKEMA (c) 2013

Main rating agencies?
S&Ps (1860)Moody’s (1909) 40% market share
Fitch IBCA (1913)COFACE (1946)
Dagong Credit Rating Co (1994)Euler-Hermes
M.H. Bouchet/SKEMA (c) 2013
95% market share

M.H. Bouchet/SKEMA (c) 2013
Shortcomings of rating agencies? Criticisms:
* Power without accountability * Rating shopping by companies * Conformity and sociocultural bias * Punishment of disobedient firms/countries that do not
request a rating * Procyclical bias, hence followjng the majority opinion of
market participants without any early warning signals nor predictability track record
Spill-over effect!

M.H. Bouchet/SKEMA (c) 2013
Ratings = Poor early warning signals?
South Korea was rated as Italy and Sweden until as October of 1997! But has been downgraded abruptly to junk bond status during the 1998 crisis« There were no early warnings about
Korea from us or, to the best of ourknowledge, from other market
participants and our customers shouldexpect a better job from us »
FICHT IBCA January 14, 1998

M.H. Bouchet/SKEMA (c) 2013
Ratings and the US subprime mortgage-backed securities market
Rating agencies kept a AAA rating for debts whosecollateral was rapidly deteriorating!
Ratings agencies failed to warn investors about the risk of complex financial instruments: In 2007, as housing prices began to tumble, Moody's downgraded 83% of the $870 billion in mortgage securities it had rated at the AAA level in 2006.
Summer 2013: the US SEC accused former Goldman Sachs trader Fabrice Tourre of misleading investors in a crisis-era deal that cost them $1 billion
Challenge: how measuring liquidity and market value risk?
M.H. Bouchet/SKEMA (c) 2013
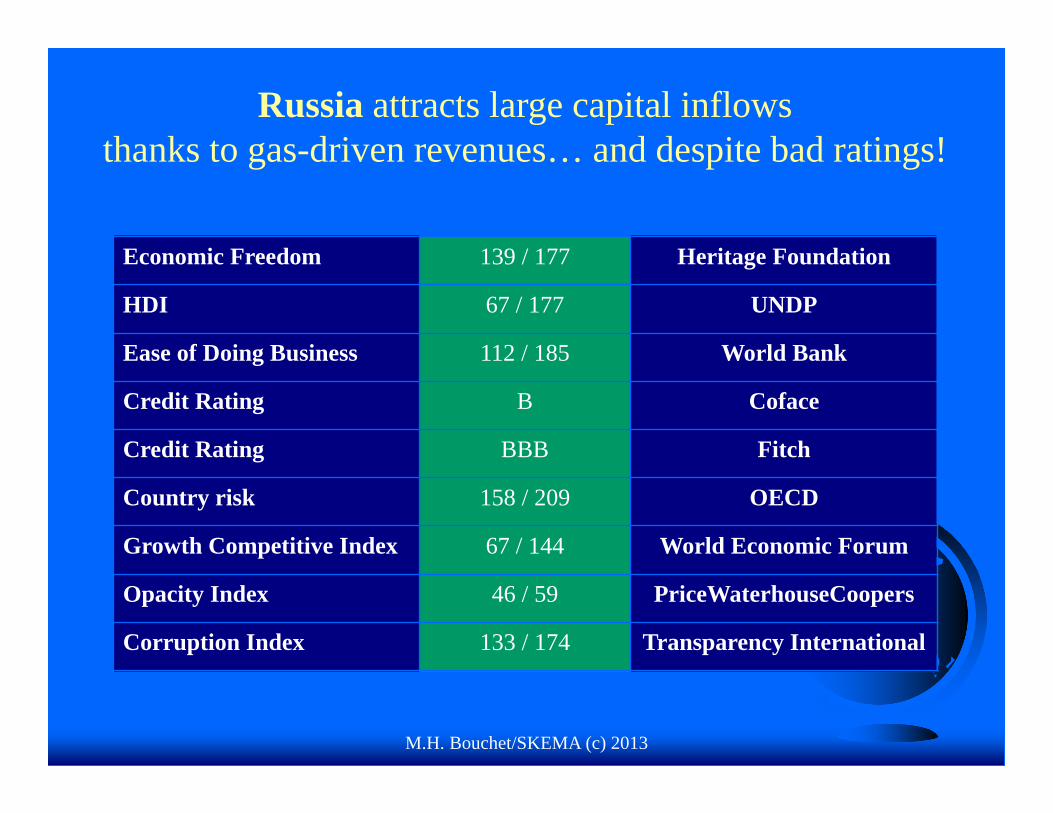
Russia attracts large capital inflows thanks to gas-driven revenues… and despite bad ratings!
Economic Freedom 139 / 177 Heritage Foundation
HDI 67 / 177 UNDP
Ease of Doing Business 112 / 185 World Bank
Credit Rating B Coface
Credit Rating BBB Fitch
Country risk 158 / 209 OECD
Growth Competitive Index 67 / 144 World Economic Forum
Opacity Index 46 / 59 PriceWaterhouseCoopers
Corruption Index 133 / 174 Transparency International

M.H. Bouchet/SKEMA (c) 2013
World Bank: « Doing Business »
in 2013
1. Singapore2. New Zealand
3. HongKong4. USA5. UK
6. Denmark7. Ireland8. Canada
9. Australia10. Norway
29. France91. China
120. Russia126. Brazil132. India
182. Congo
10 ParametersRanking does not take into
consideration the macroeconomic framework nor organized crime

M.H. Bouchet/SKEMA (c) 2013
Conclusion: How to assess sustainability of capital flows?
1. Economic and financial risk analysis(quantitative)
2. Socio-polítical framework, institutionaldevelopment, and structural reforms (qualitative)
3. Resilience to crisis: Economic growth is not sustainable development