Global and National Factors Affecting E-commerce Diffusion ...
34
UC Irvine Globalization of I.T. Title Global and National Factors Affecting E-commerce Diffusion in China Permalink https://escholarship.org/uc/item/79k4p8w0 Authors Tan, Zixiang Ouyang, Wu Publication Date 2002-08-01 eScholarship.org Powered by the California Digital Library University of California
Transcript of Global and National Factors Affecting E-commerce Diffusion ...
UC IrvineGlobalization of I.T.
TitleGlobal and National Factors Affecting E-commerce Diffusion in China
Permalinkhttps://escholarship.org/uc/item/79k4p8w0
AuthorsTan, ZixiangOuyang, Wu
Publication Date2002-08-01
eScholarship.org Powered by the California Digital LibraryUniversity of California
Global and National Factors Affecting E-commerce Diffusion in China
August 2002
Zixiang (Alex) Tan School of Information Studies
Syracuse University, USA E-mail: [email protected]
Wu Ouyang
CIIED Chinese Academy of Social Science
Center for Research on Information Technology and Organizations (CRITO)
University of California, Irvine 3200 Berkeley Place
Irvine, CA 92697-4650 http://www.crito.uci.edu
This research is a part of the Globalization and E-Commerce project of the Center for Research on Information Technology and Organizations (CRITO) at the University of California, Irvine. This material is based upon work supported by the National Science Foundation under Grant No. 0085852. Any opinions, findings, and conclusions or recommendations expressed in this material are those of the author(s) and do not necessarily reflect the views of the National Science Foundation.
SUMMARY • China is a large economy with a large absolute gross domestic product (GDP). However, its
huge population brings its GDP and wealth level per capita way below developed countries and in-line with many developing countries.
• Recently, China’s economy has been experiencing rapid growth (7-8% on average). So have its telecommunications, information technology (IT) and Internet infrastructures (50% - 200% on average). Its large population brings the penetration rates of these infrastructures way below developed countries and a little higher than many developing countries.
• China’s infrastructure is characterized by “disparities” among geographic areas, demographics, and firm size. Large cities and economically advanced coastal provinces enjoy much better infrastructure and many more Internet users than remote and economically poorer provinces. Large enterprises have bigger IT budgets and better-trained staffs than small- and medium-sized enterprises. A younger population with higher education is more likely to adopt Internet and e-commerce.
• The infrastructure disparity leads to e-commerce diffusion disparity with current e-commerce activities concentrated in large cities, coastal provinces, large enterprises, and well-educated young people. Large cities and coastal provinces have a better legal environment because they publish local laws regarding e-commerce and IT infrastructure.
• Barriers to e-commerce diffusion include poor technical infrastructure, lack of security, lack of a system to monitor and guarantee buyer and seller credibility, and an inefficient delivery system. The lack of a credibility monitoring system extends to vendors in general, as well as individual consumers.
• Taxation and privacy, which are vital to e-commerce diffusion in many other countries, do not appear to be serious concerns yet. However, content censorship is among the top concerns.
• The most significant driving forces are government promotion and private entrepreneurial desire to make profits. Government initiatives include general promotion of the IT industry, an industrial and regulatory policy to foster competition among service providers, encouragement of E-government, and sponsorship of projects to mobilize public awareness, such as the “Enterprise Online Project” and “Home Online Project”.
• The poor infrastructure for e-commerce in China has pulled e-commerce back to a base building stage after an initial explosive stage. Significant diffusion can only occur after a solid infrastructure has been built up, including the technical and legal infrastructure.
• Two examples, an E-store for residents in a local living complex and the E-system for college admissions, demonstrate e-commerce models unique in China.
2
INTRODUCTION As a large developing country with an ambition to become one of the world’s economic superpowers, China sees its future closely tied to its information technology (IT) industry, as well as e-commerce deployment. This paper provides an overview of various environmental factors that could facilitate or retard e-commerce diffusion in China in three sections—national environment, national policy, and conclusion. The national environment section examines infrastructures for e-commerce diffusion. These fundamental infrastructures include demographics, economics, IT deployment, consumer readiness, and others. This examination is supported by rich data in recent years, which is compared with data in other Asia-Pacific nations. The national policy section investigates various policy perspectives regarding e-commerce diffusion. In particular, this paper discusses policy institutions and regulation models, enabling policies, e-commerce policies, legal framework, and special promotion efforts. These issues are discussed in detail. The conclusion section summarizes findings for e-commerce diffusion in China. It starts from discussing business-to-business (B2B) and business-to-consumer (B2C) practice in China, including the key drivers and barriers. The section end discusses e-commerce with Chinese characteristics, and the political, social, and economic implications of e-commerce diffusion. In toto, the paper is intended to serve as a foundation for further research and discussion on e-commerce diffusion in China. NATIONAL ENVIRONMENT Since the adoption of the "economic reform" policy in 1978, China has been undergoing rapid economic and social change. This change is captured in the term "socialist market economy", which reflects China's ambition to transform its old socialist economy to a new market economy with Chinese characteristics. This concept of "socialist market economy with Chinese characteristics" means using market forces to improve the efficiency of China's economy while the State maintains control of political activity and guides the direction of the economy. Population and Demographics China is home to one-fifth of the world’s population. With 1.295 billion people in 2000, it ranks as the most populated country in the world. About 64% of China's population lives in rural areas; 23% are under 14 years of age, and 70% between 14 and 65 years old. The predominantly rural population helps to explain the low penetration rates of computer ownership and Internet users in China. In addition, China is culturally and ethnically diverse with more than 50 different ethnic groups. Its provinces often have more people than most European countries. This diversity and the centralized political structure make maintaining state authority both a priority and a challenge. The Internet is viewed as a potential tool that can either strengthen or weaken the government's political and economic control.
3
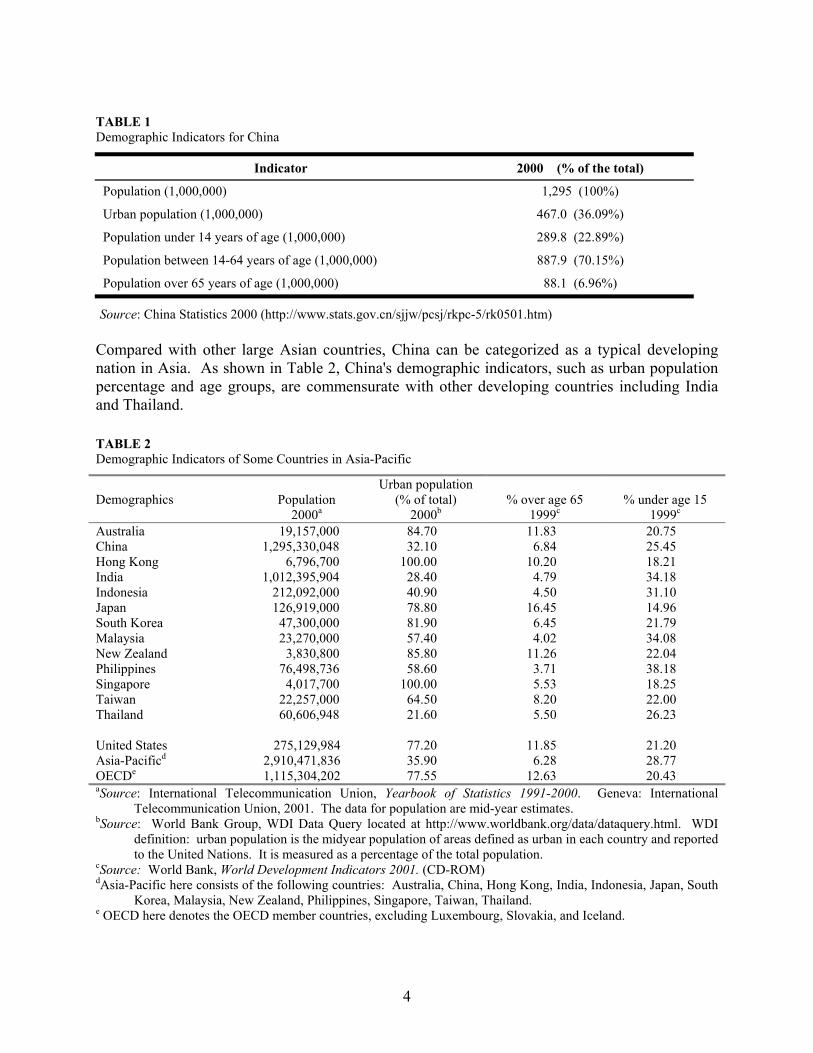
TABLE 1 Demographic Indicators for China
Indicator 2000 (% of the total)
Population (1,000,000) 1,295 (100%)
Urban population (1,000,000) 467.0 (36.09%)
Population under 14 years of age (1,000,000) 289.8 (22.89%)
Population between 14-64 years of age (1,000,000) 887.9 (70.15%)
Population over 65 years of age (1,000,000) 88.1 (6.96%)
Source: China Statistics 2000 (http://www.stats.gov.cn/sjjw/pcsj/rkpc-5/rk0501.htm) Compared with other large Asian countries, China can be categorized as a typical developing nation in Asia. As shown in Table 2, China's demographic indicators, such as urban population percentage and age groups, are commensurate with other developing countries including India and Thailand. TABLE 2 Demographic Indicators of Some Countries in Asia-Pacific Demographics
Population
2000a
Urban population (% of total)
2000b
% over age 65
1999c
% under age 15
1999c Australia 19,157,000 84.70 11.83 20.75 China 1,295,330,048 32.10 6.84 25.45 Hong Kong 6,796,700 100.00 10.20 18.21 India 1,012,395,904 28.40 4.79 34.18 Indonesia 212,092,000 40.90 4.50 31.10 Japan 126,919,000 78.80 16.45 14.96 South Korea 47,300,000 81.90 6.45 21.79 Malaysia 23,270,000 57.40 4.02 34.08 New Zealand 3,830,800 85.80 11.26 22.04 Philippines 76,498,736 58.60 3.71 38.18 Singapore 4,017,700 100.00 5.53 18.25 Taiwan 22,257,000 64.50 8.20 22.00 Thailand 60,606,948 21.60 5.50 26.23 United States 275,129,984 77.20 11.85 21.20 Asia-Pacificd 2,910,471,836 35.90 6.28 28.77 OECDe 1,115,304,202 77.55 12.63 20.43 aSource: International Telecommunication Union, Yearbook of Statistics 1991-2000. Geneva: International
Telecommunication Union, 2001. The data for population are mid-year estimates. bSource: World Bank Group, WDI Data Query located at http://www.worldbank.org/data/dataquery.html. WDI
definition: urban population is the midyear population of areas defined as urban in each country and reported to the United Nations. It is measured as a percentage of the total population.
cSource: World Bank, World Development Indicators 2001. (CD-ROM) dAsia-Pacific here consists of the following countries: Australia, China, Hong Kong, India, Indonesia, Japan, South
Korea, Malaysia, New Zealand, Philippines, Singapore, Taiwan, Thailand. e OECD here denotes the OECD member countries, excluding Luxembourg, Slovakia, and Iceland.
4
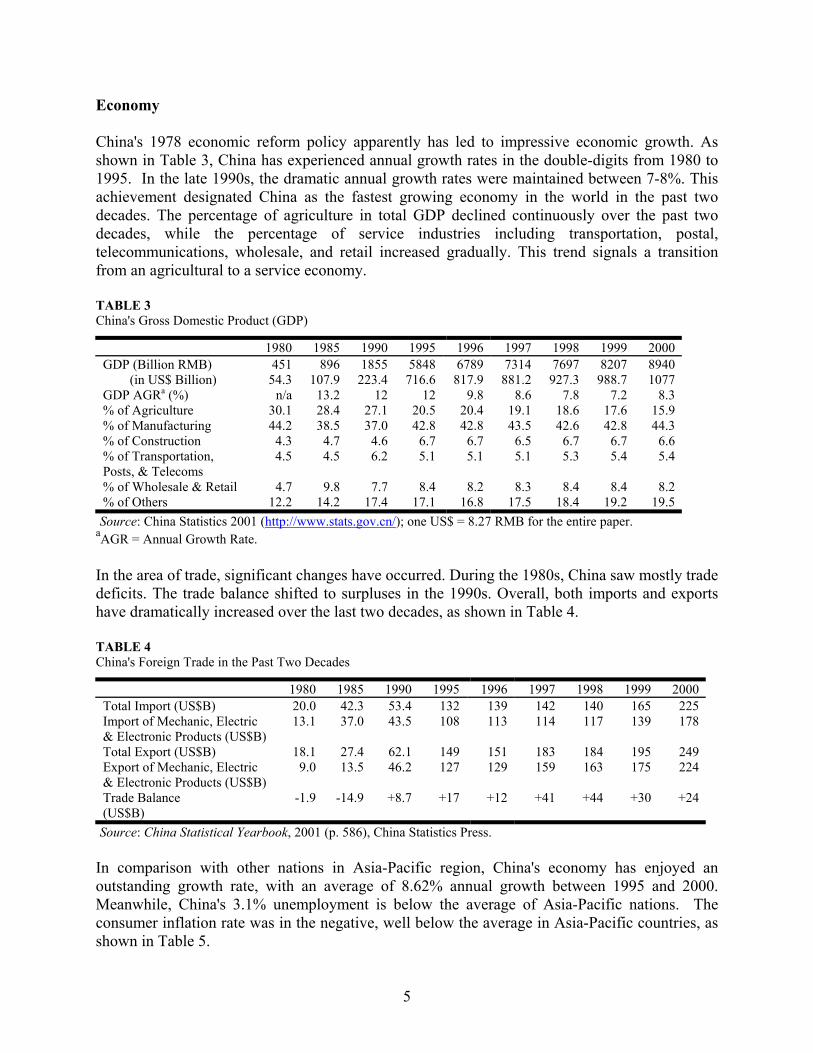
Economy China's 1978 economic reform policy apparently has led to impressive economic growth. As shown in Table 3, China has experienced annual growth rates in the double-digits from 1980 to 1995. In the late 1990s, the dramatic annual growth rates were maintained between 7-8%. This achievement designated China as the fastest growing economy in the world in the past two decades. The percentage of agriculture in total GDP declined continuously over the past two decades, while the percentage of service industries including transportation, postal, telecommunications, wholesale, and retail increased gradually. This trend signals a transition from an agricultural to a service economy. TABLE 3 China's Gross Domestic Product (GDP)
1980 1985 1990 1995 1996 1997 1998 1999 2000 GDP (Billion RMB) (in US$ Billion)
451 54.3
896 107.9
1855 223.4
5848 716.6
6789 817.9
7314 881.2
7697 927.3
8207 988.7
8940 1077
GDP AGRa (%) n/a 13.2 12 12 9.8 8.6 7.8 7.2 8.3 % of Agriculture 30.1 28.4 27.1 20.5 20.4 19.1 18.6 17.6 15.9 % of Manufacturing 44.2 38.5 37.0 42.8 42.8 43.5 42.6 42.8 44.3 % of Construction 4.3 4.7 4.6 6.7 6.7 6.5 6.7 6.7 6.6 % of Transportation, Posts, & Telecoms
4.5 4.5 6.2 5.1 5.1 5.1 5.3 5.4 5.4
% of Wholesale & Retail 4.7 9.8 7.7 8.4 8.2 8.3 8.4 8.4 8.2 % of Others 12.2 14.2 17.4 17.1 16.8 17.5 18.4 19.2 19.5
Source: China Statistics 2001 (http://www.stats.gov.cn/); one US$ = 8.27 RMB for the entire paper. aAGR = Annual Growth Rate. In the area of trade, significant changes have occurred. During the 1980s, China saw mostly trade deficits. The trade balance shifted to surpluses in the 1990s. Overall, both imports and exports have dramatically increased over the last two decades, as shown in Table 4. TABLE 4 China's Foreign Trade in the Past Two Decades
1980 1985 1990 1995 1996 1997 1998 1999 2000 Total Import (US$B) 20.0 42.3 53.4 132 139 142 140 165 225 Import of Mechanic, Electric & Electronic Products (US$B)
13.1 37.0 43.5 108 113 114 117 139 178
Total Export (US$B) 18.1 27.4 62.1 149 151 183 184 195 249 Export of Mechanic, Electric & Electronic Products (US$B)
9.0 13.5 46.2 127 129 159 163 175 224
Trade Balance (US$B)
-1.9 -14.9 +8.7 +17 +12 +41 +44 +30 +24
Source: China Statistical Yearbook, 2001 (p. 586), China Statistics Press. In comparison with other nations in Asia-Pacific region, China's economy has enjoyed an outstanding growth rate, with an average of 8.62% annual growth between 1995 and 2000. Meanwhile, China's 3.1% unemployment is below the average of Asia-Pacific nations. The consumer inflation rate was in the negative, well below the average in Asia-Pacific countries, as shown in Table 5.
5
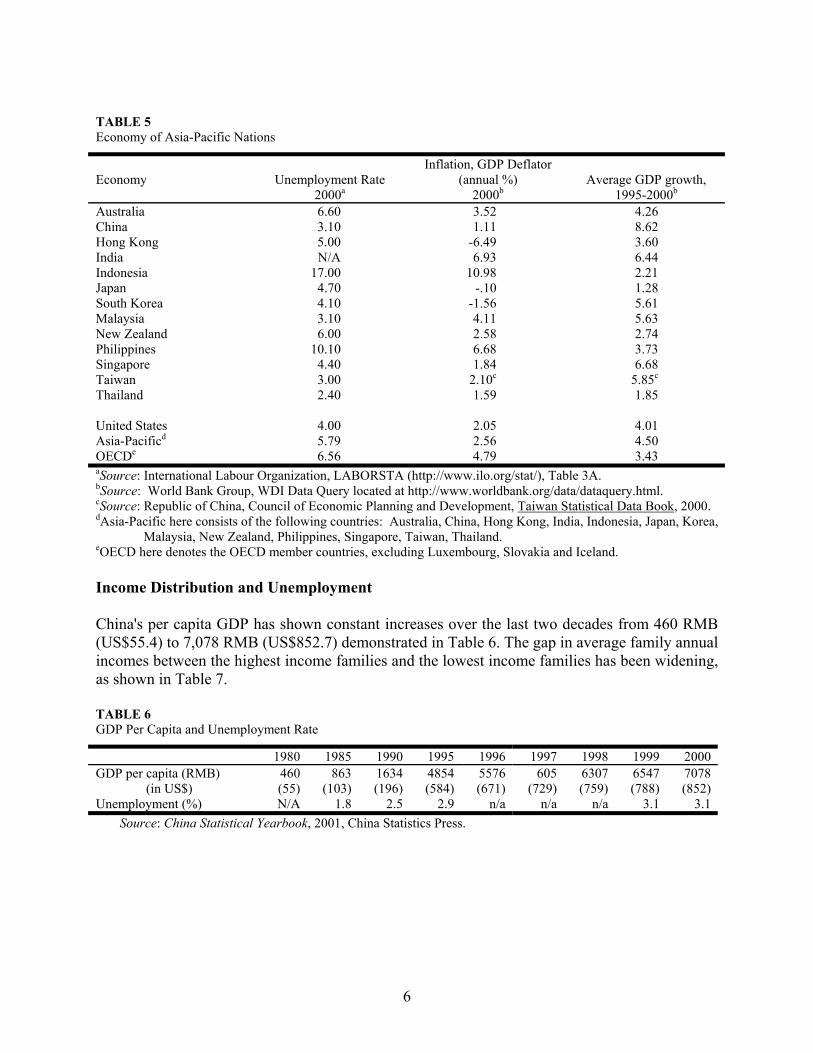
TABLE 5 Economy of Asia-Pacific Nations
Economy
Unemployment Rate
2000a
Inflation, GDP Deflator (annual %)
2000b
Average GDP growth,
1995-2000b Australia 6.60 3.52 4.26 China 3.10 1.11 8.62 Hong Kong 5.00 -6.49 3.60 India N/A 6.93 6.44 Indonesia 17.00 10.98 2.21 Japan 4.70 -.10 1.28 South Korea 4.10 -1.56 5.61 Malaysia 3.10 4.11 5.63 New Zealand 6.00 2.58 2.74 Philippines 10.10 6.68 3.73 Singapore 4.40 1.84 6.68 Taiwan 3.00 2.10c 5.85c Thailand 2.40 1.59 1.85 United States 4.00 2.05 4.01 Asia-Pacificd 5.79 2.56 4.50 OECDe 6.56 4.79 3.43 aSource: International Labour Organization, LABORSTA (http://www.ilo.org/stat/), Table 3A. bSource: World Bank Group, WDI Data Query located at http://www.worldbank.org/data/dataquery.html. cSource: Republic of China, Council of Economic Planning and Development, Taiwan Statistical Data Book, 2000. dAsia-Pacific here consists of the following countries: Australia, China, Hong Kong, India, Indonesia, Japan, Korea,
Malaysia, New Zealand, Philippines, Singapore, Taiwan, Thailand. eOECD here denotes the OECD member countries, excluding Luxembourg, Slovakia and Iceland. Income Distribution and Unemployment China's per capita GDP has shown constant increases over the last two decades from 460 RMB (US$55.4) to 7,078 RMB (US$852.7) demonstrated in Table 6. The gap in average family annual incomes between the highest income families and the lowest income families has been widening, as shown in Table 7.
TABLE 6 GDP Per Capita and Unemployment Rate
1980 1985 1990 1995 1996 1997 1998 1999 2000 GDP per capita (RMB) (in US$)
460 (55)
863 (103)
1634 (196)
4854 (584)
5576 (671)
605 (729)
6307 (759)
6547 (788)
7078 (852)
Unemployment (%) N/A 1.8 2.5 2.9 n/a n/a n/a 3.1 3.1 Source: China Statistical Yearbook, 2001, China Statistics Press.
6
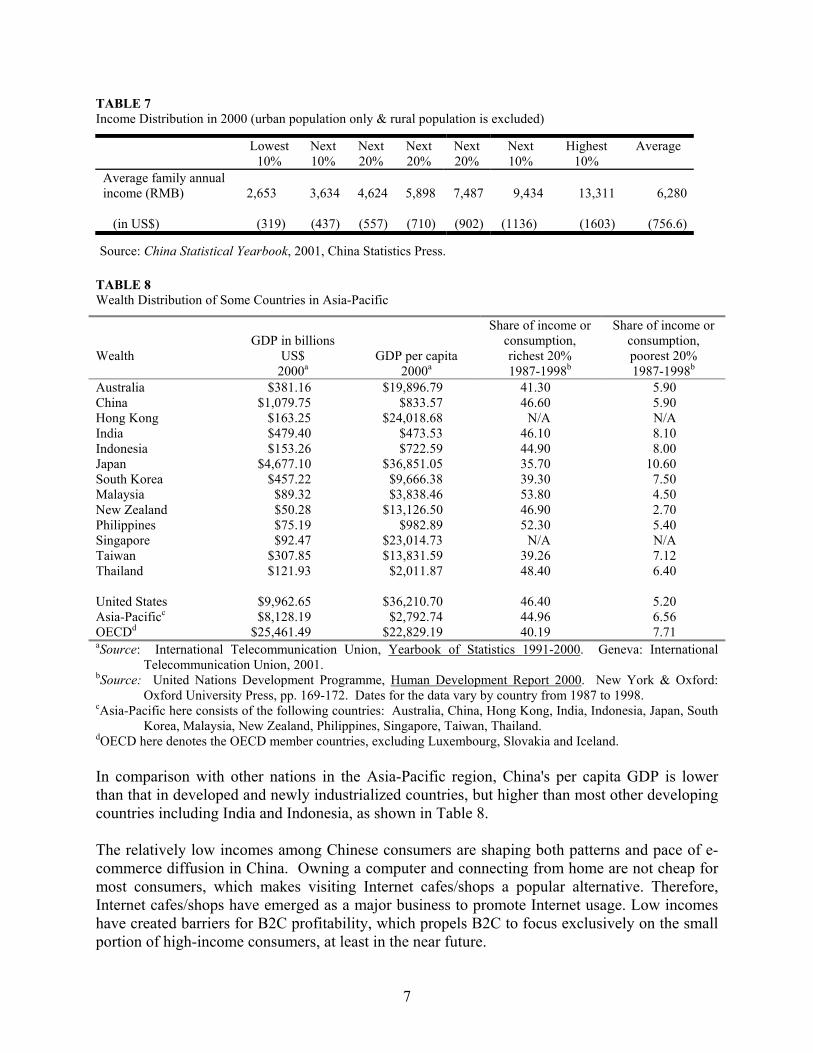
TABLE 7 Income Distribution in 2000 (urban population only & rural population is excluded)
Lowest 10%
Next 10%
Next 20%
Next 20%
Next 20%
Next 10%
Highest 10%
Average
Average family annual income (RMB) (in US$)
2,653
(319)
3,634
(437)
4,624
(557)
5,898
(710)
7,487
(902)
9,434
(1136)
13,311
(1603)
6,280
(756.6)
Source: China Statistical Yearbook, 2001, China Statistics Press. TABLE 8 Wealth Distribution of Some Countries in Asia-Pacific
Wealth
GDP in billions
US$ 2000a
GDP per capita 2000a
Share of income or consumption, richest 20% 1987-1998b
Share of income or consumption, poorest 20% 1987-1998b
Australia $381.16 $19,896.79 41.30 5.90 China $1,079.75 $833.57 46.60 5.90 Hong Kong $163.25 $24,018.68 N/A N/A India $479.40 $473.53 46.10 8.10 Indonesia $153.26 $722.59 44.90 8.00 Japan $4,677.10 $36,851.05 35.70 10.60 South Korea $457.22 $9,666.38 39.30 7.50 Malaysia $89.32 $3,838.46 53.80 4.50 New Zealand $50.28 $13,126.50 46.90 2.70 Philippines $75.19 $982.89 52.30 5.40 Singapore $92.47 $23,014.73 N/A N/A Taiwan $307.85 $13,831.59 39.26 7.12 Thailand $121.93 $2,011.87 48.40 6.40 United States $9,962.65 $36,210.70 46.40 5.20 Asia-Pacificc $8,128.19 $2,792.74 44.96 6.56 OECDd $25,461.49 $22,829.19 40.19 7.71 aSource: International Telecommunication Union, Yearbook of Statistics 1991-2000. Geneva: International
Telecommunication Union, 2001. bSource: United Nations Development Programme, Human Development Report 2000. New York & Oxford:
Oxford University Press, pp. 169-172. Dates for the data vary by country from 1987 to 1998. cAsia-Pacific here consists of the following countries: Australia, China, Hong Kong, India, Indonesia, Japan, South
Korea, Malaysia, New Zealand, Philippines, Singapore, Taiwan, Thailand. dOECD here denotes the OECD member countries, excluding Luxembourg, Slovakia and Iceland. In comparison with other nations in the Asia-Pacific region, China's per capita GDP is lower than that in developed and newly industrialized countries, but higher than most other developing countries including India and Indonesia, as shown in Table 8. The relatively low incomes among Chinese consumers are shaping both patterns and pace of e-commerce diffusion in China. Owning a computer and connecting from home are not cheap for most consumers, which makes visiting Internet cafes/shops a popular alternative. Therefore, Internet cafes/shops have emerged as a major business to promote Internet usage. Low incomes have created barriers for B2C profitability, which propels B2C to focus exclusively on the small portion of high-income consumers, at least in the near future.
7
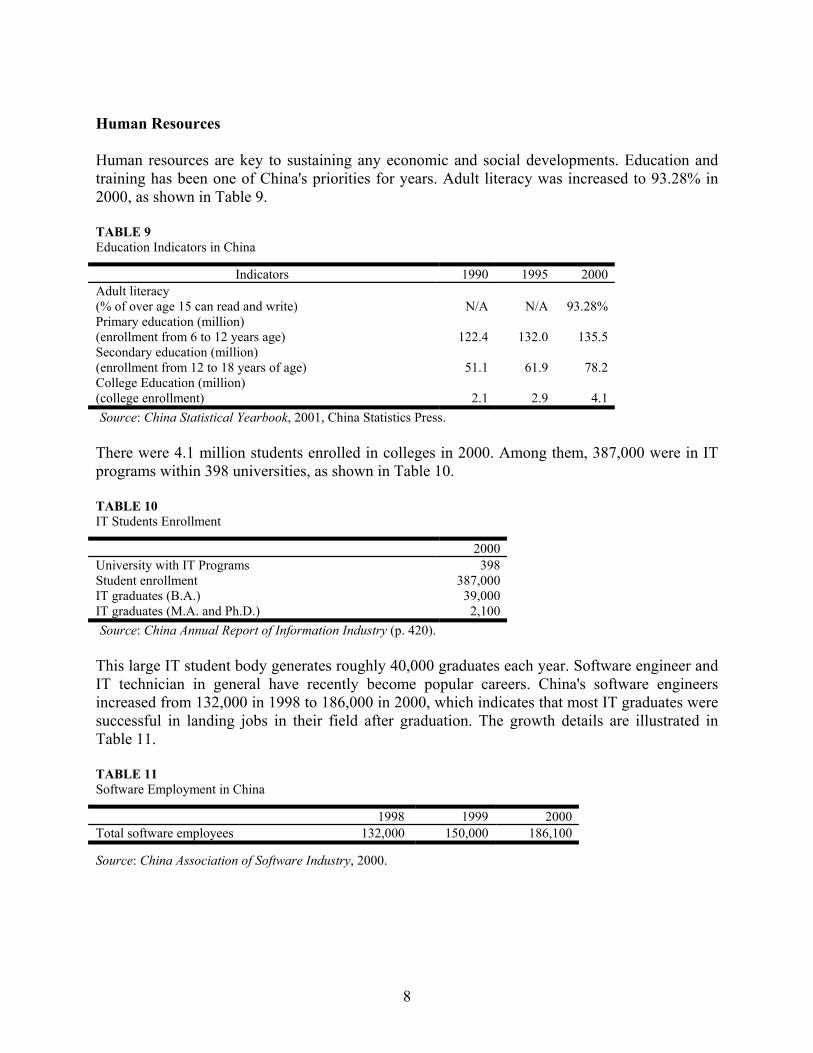
Human Resources Human resources are key to sustaining any economic and social developments. Education and training has been one of China's priorities for years. Adult literacy was increased to 93.28% in 2000, as shown in Table 9. TABLE 9 Education Indicators in China
Indicators 1990 1995 2000 Adult literacy (% of over age 15 can read and write)
N/A
N/A
93.28%
Primary education (million) (enrollment from 6 to 12 years age)
122.4
132.0
135.5
Secondary education (million) (enrollment from 12 to 18 years of age)
51.1
61.9
78.2
College Education (million) (college enrollment)
2.1
2.9
4.1
Source: China Statistical Yearbook, 2001, China Statistics Press. There were 4.1 million students enrolled in colleges in 2000. Among them, 387,000 were in IT programs within 398 universities, as shown in Table 10. TABLE 10 IT Students Enrollment
2000 University with IT Programs 398 Student enrollment 387,000 IT graduates (B.A.) 39,000 IT graduates (M.A. and Ph.D.) 2,100 Source: China Annual Report of Information Industry (p. 420). This large IT student body generates roughly 40,000 graduates each year. Software engineer and IT technician in general have recently become popular careers. China's software engineers increased from 132,000 in 1998 to 186,000 in 2000, which indicates that most IT graduates were successful in landing jobs in their field after graduation. The growth details are illustrated in Table 11. TABLE 11 Software Employment in China
1998 1999 2000 Total software employees 132,000 150,000 186,100
Source: China Association of Software Industry, 2000.
8
Infrastructure Several infrastructures form the fundamental base for e-commerce diffusion. Among them, telecommunication, information technology, Internet, financial resources and delivery systems are the most significant.
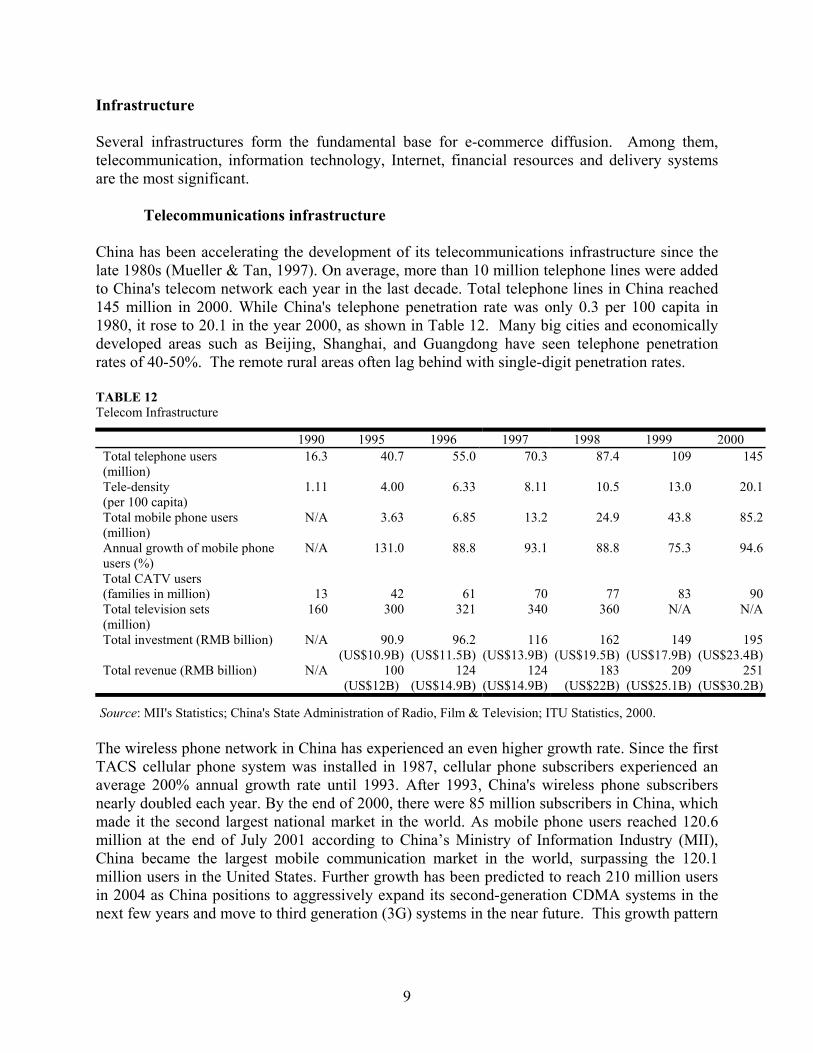
Telecommunications infrastructure China has been accelerating the development of its telecommunications infrastructure since the late 1980s (Mueller & Tan, 1997). On average, more than 10 million telephone lines were added to China's telecom network each year in the last decade. Total telephone lines in China reached 145 million in 2000. While China's telephone penetration rate was only 0.3 per 100 capita in 1980, it rose to 20.1 in the year 2000, as shown in Table 12. Many big cities and economically developed areas such as Beijing, Shanghai, and Guangdong have seen telephone penetration rates of 40-50%. The remote rural areas often lag behind with single-digit penetration rates. TABLE 12 Telecom Infrastructure
1990 1995 1996 1997 1998 1999 2000 Total telephone users (million)
16.3 40.7 55.0 70.3 87.4 109 145
Tele-density (per 100 capita)
1.11 4.00 6.33 8.11 10.5 13.0 20.1
Total mobile phone users (million)
N/A 3.63 6.85 13.2 24.9 43.8 85.2
Annual growth of mobile phone users (%)
N/A 131.0 88.8 93.1 88.8 75.3 94.6
Total CATV users (families in million)
13 42 61 70
77 83 90
Total television sets (million)
160 300 321 340 360 N/A N/A
Total investment (RMB billion)
N/A 90.9(US$10.9B)
96.2(US$11.5B)
116(US$13.9B)
162 (US$19.5B)
149(US$17.9B)
195(US$23.4B)
Total revenue (RMB billion)
N/A 100(US$12B)
124(US$14.9B)
124(US$14.9B)
183 (US$22B)
209(US$25.1B)
251(US$30.2B)
Source: MII's Statistics; China's State Administration of Radio, Film & Television; ITU Statistics, 2000. The wireless phone network in China has experienced an even higher growth rate. Since the first TACS cellular phone system was installed in 1987, cellular phone subscribers experienced an average 200% annual growth rate until 1993. After 1993, China's wireless phone subscribers nearly doubled each year. By the end of 2000, there were 85 million subscribers in China, which made it the second largest national market in the world. As mobile phone users reached 120.6 million at the end of July 2001 according to China’s Ministry of Information Industry (MII), China became the largest mobile communication market in the world, surpassing the 120.1 million users in the United States. Further growth has been predicted to reach 210 million users in 2004 as China positions to aggressively expand its second-generation CDMA systems in the next few years and move to third generation (3G) systems in the near future. This growth pattern
9
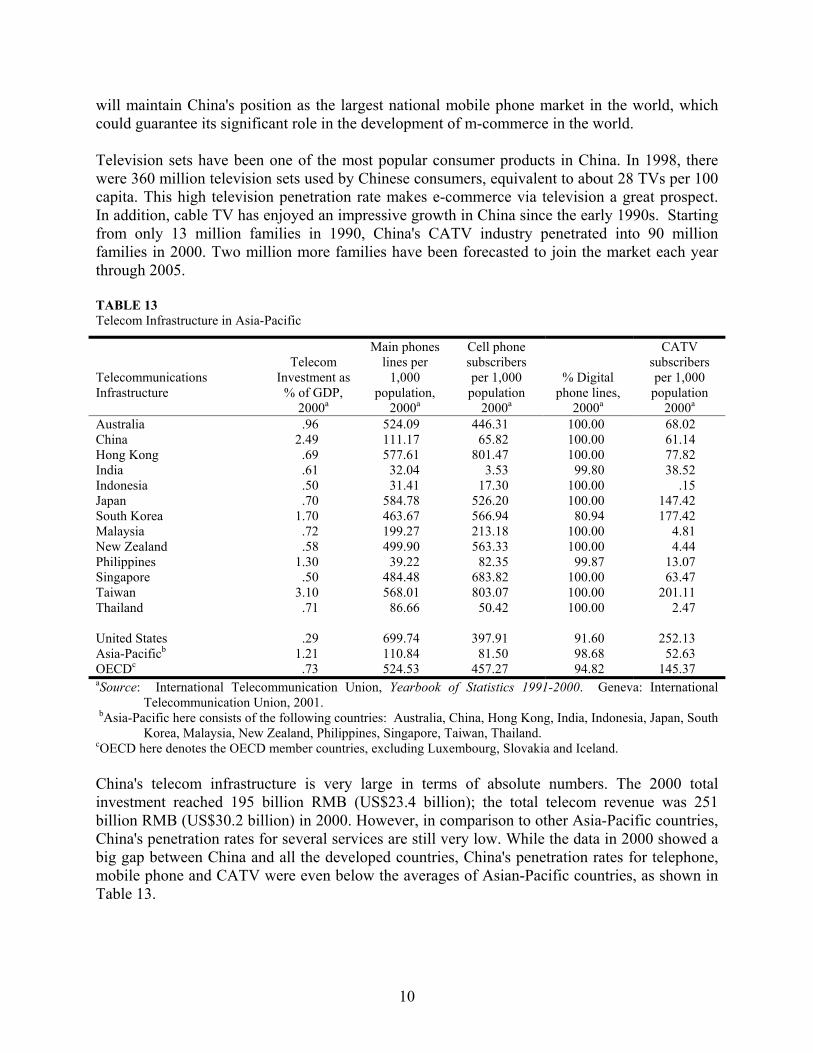
will maintain China's position as the largest national mobile phone market in the world, which could guarantee its significant role in the development of m-commerce in the world. Television sets have been one of the most popular consumer products in China. In 1998, there were 360 million television sets used by Chinese consumers, equivalent to about 28 TVs per 100 capita. This high television penetration rate makes e-commerce via television a great prospect. In addition, cable TV has enjoyed an impressive growth in China since the early 1990s. Starting from only 13 million families in 1990, China's CATV industry penetrated into 90 million families in 2000. Two million more families have been forecasted to join the market each year through 2005. TABLE 13 Telecom Infrastructure in Asia-Pacific
Telecommunications Infrastructure
Telecom
Investment as % of GDP,
2000a
Main phones lines per
1,000 population,
2000a
Cell phone subscribers per 1,000 population
2000a
% Digital phone lines,
2000a
CATV subscribers per 1,000 population
2000a Australia .96 524.09 446.31 100.00 68.02 China 2.49 111.17 65.82 100.00 61.14 Hong Kong .69 577.61 801.47 100.00 77.82 India .61 32.04 3.53 99.80 38.52 Indonesia .50 31.41 17.30 100.00 .15 Japan .70 584.78 526.20 100.00 147.42 South Korea 1.70 463.67 566.94 80.94 177.42 Malaysia .72 199.27 213.18 100.00 4.81 New Zealand .58 499.90 563.33 100.00 4.44 Philippines 1.30 39.22 82.35 99.87 13.07 Singapore .50 484.48 683.82 100.00 63.47 Taiwan 3.10 568.01 803.07 100.00 201.11 Thailand .71 86.66 50.42 100.00 2.47 United States .29 699.74 397.91 91.60 252.13 Asia-Pacificb 1.21 110.84 81.50 98.68 52.63 OECDc .73 524.53 457.27 94.82 145.37 aSource: International Telecommunication Union, Yearbook of Statistics 1991-2000. Geneva: International
Telecommunication Union, 2001. bAsia-Pacific here consists of the following countries: Australia, China, Hong Kong, India, Indonesia, Japan, South
Korea, Malaysia, New Zealand, Philippines, Singapore, Taiwan, Thailand. cOECD here denotes the OECD member countries, excluding Luxembourg, Slovakia and Iceland. China's telecom infrastructure is very large in terms of absolute numbers. The 2000 total investment reached 195 billion RMB (US$23.4 billion); the total telecom revenue was 251 billion RMB (US$30.2 billion) in 2000. However, in comparison to other Asia-Pacific countries, China's penetration rates for several services are still very low. While the data in 2000 showed a big gap between China and all the developed countries, China's penetration rates for telephone, mobile phone and CATV were even below the averages of Asian-Pacific countries, as shown in Table 13.
10
In summary, China's telecommunication infrastructure has experienced rapid growth in the past two decades. However, there is still great potential for further growth given its low penetration rates in fixed telephone and mobile telephone services.
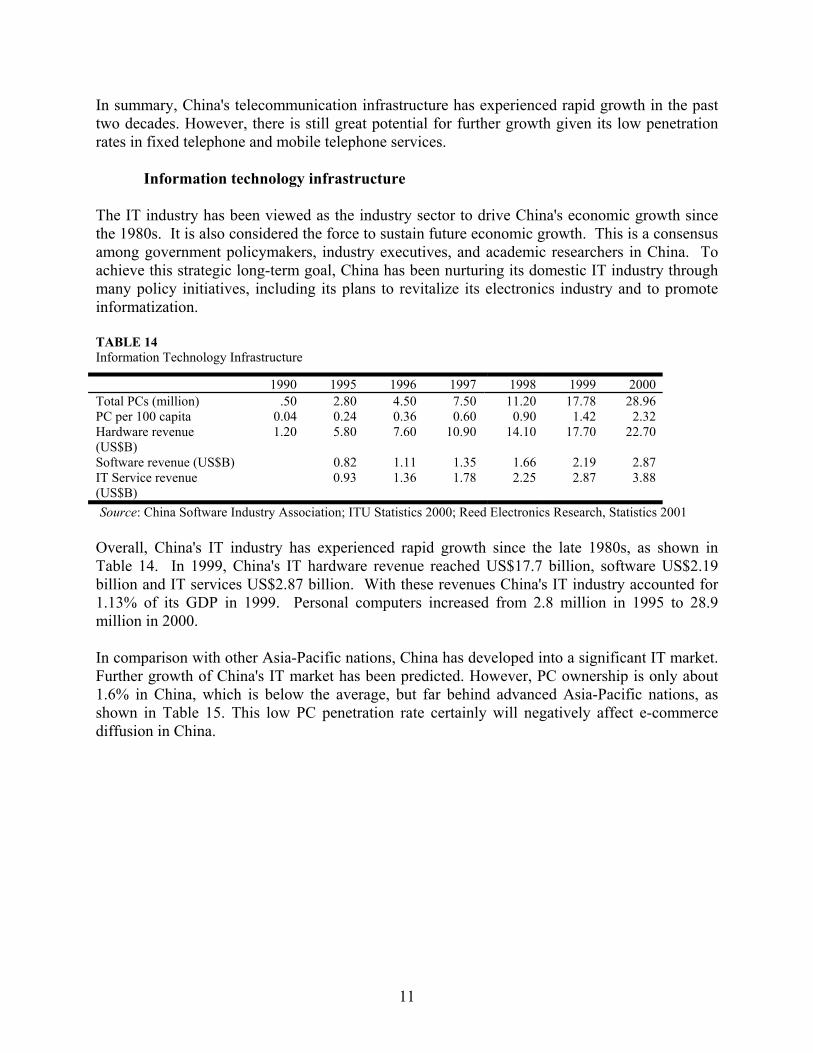
Information technology infrastructure The IT industry has been viewed as the industry sector to drive China's economic growth since the 1980s. It is also considered the force to sustain future economic growth. This is a consensus among government policymakers, industry executives, and academic researchers in China. To achieve this strategic long-term goal, China has been nurturing its domestic IT industry through many policy initiatives, including its plans to revitalize its electronics industry and to promote informatization. TABLE 14 Information Technology Infrastructure
1990 1995 1996 1997 1998 1999 2000 Total PCs (million) .50 2.80 4.50 7.50 11.20 17.78 28.96 PC per 100 capita 0.04 0.24 0.36 0.60 0.90 1.42 2.32 Hardware revenue (US$B)
1.20 5.80 7.60 10.90 14.10 17.70 22.70
Software revenue (US$B) 0.82 1.11 1.35 1.66 2.19 2.87 IT Service revenue (US$B)
0.93 1.36 1.78 2.25 2.87 3.88
Source: China Software Industry Association; ITU Statistics 2000; Reed Electronics Research, Statistics 2001 Overall, China's IT industry has experienced rapid growth since the late 1980s, as shown in Table 14. In 1999, China's IT hardware revenue reached US$17.7 billion, software US$2.19 billion and IT services US$2.87 billion. With these revenues China's IT industry accounted for 1.13% of its GDP in 1999. Personal computers increased from 2.8 million in 1995 to 28.9 million in 2000. In comparison with other Asia-Pacific nations, China has developed into a significant IT market. Further growth of China's IT market has been predicted. However, PC ownership is only about 1.6% in China, which is below the average, but far behind advanced Asia-Pacific nations, as shown in Table 15. This low PC penetration rate certainly will negatively affect e-commerce diffusion in China.
11
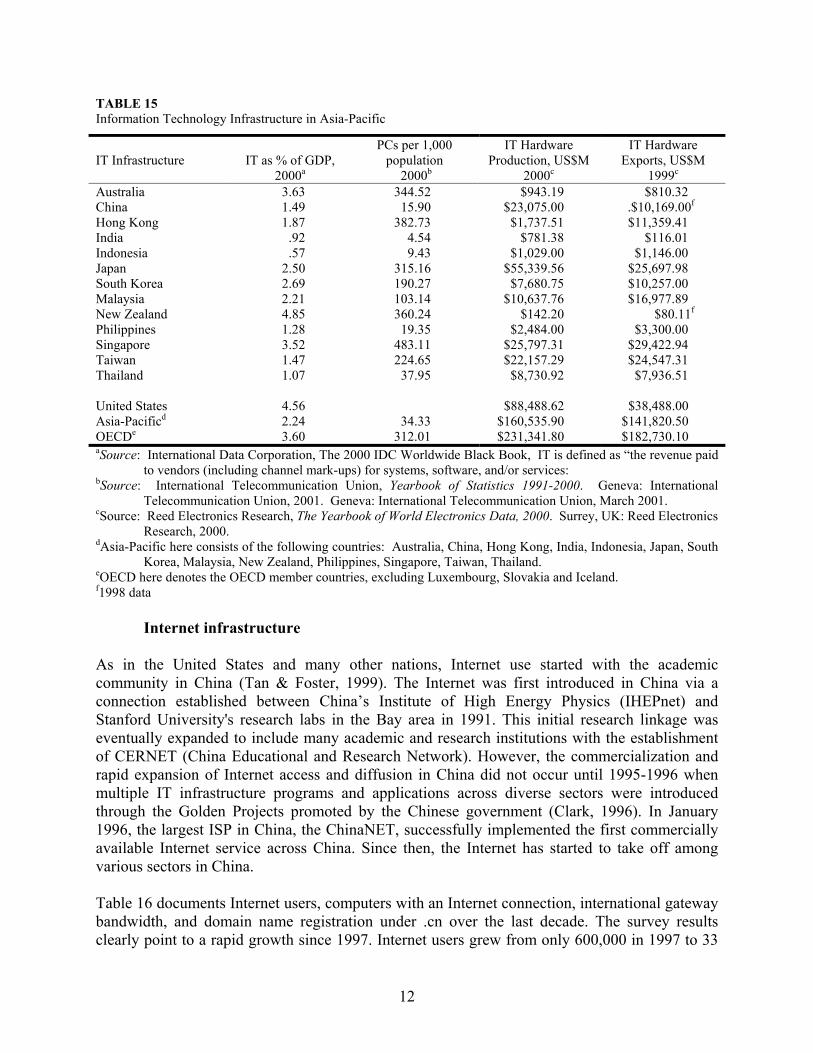
TABLE 15 Information Technology Infrastructure in Asia-Pacific
IT Infrastructure
IT as % of GDP,
2000a
PCs per 1,000 population
2000b
IT Hardware Production, US$M
2000c
IT Hardware Exports, US$M
1999c Australia 3.63 344.52 $943.19 $810.32 China 1.49 15.90 $23,075.00 .$10,169.00f Hong Kong 1.87 382.73 $1,737.51 $11,359.41 India .92 4.54 $781.38 $116.01 Indonesia .57 9.43 $1,029.00 $1,146.00 Japan 2.50 315.16 $55,339.56 $25,697.98 South Korea 2.69 190.27 $7,680.75 $10,257.00 Malaysia 2.21 103.14 $10,637.76 $16,977.89 New Zealand 4.85 360.24 $142.20 $80.11f Philippines 1.28 19.35 $2,484.00 $3,300.00 Singapore 3.52 483.11 $25,797.31 $29,422.94 Taiwan 1.47 224.65 $22,157.29 $24,547.31 Thailand 1.07 37.95 $8,730.92 $7,936.51 United States 4.56 $88,488.62 $38,488.00 Asia-Pacificd 2.24 34.33 $160,535.90 $141,820.50 OECDe 3.60 312.01 $231,341.80 $182,730.10 aSource: International Data Corporation, The 2000 IDC Worldwide Black Book, IT is defined as “the revenue paid
to vendors (including channel mark-ups) for systems, software, and/or services: bSource: International Telecommunication Union, Yearbook of Statistics 1991-2000. Geneva: International
Telecommunication Union, 2001. Geneva: International Telecommunication Union, March 2001. cSource: Reed Electronics Research, The Yearbook of World Electronics Data, 2000. Surrey, UK: Reed Electronics
Research, 2000. dAsia-Pacific here consists of the following countries: Australia, China, Hong Kong, India, Indonesia, Japan, South
Korea, Malaysia, New Zealand, Philippines, Singapore, Taiwan, Thailand. eOECD here denotes the OECD member countries, excluding Luxembourg, Slovakia and Iceland. f1998 data
Internet infrastructure As in the United States and many other nations, Internet use started with the academic community in China (Tan & Foster, 1999). The Internet was first introduced in China via a connection established between China’s Institute of High Energy Physics (IHEPnet) and Stanford University's research labs in the Bay area in 1991. This initial research linkage was eventually expanded to include many academic and research institutions with the establishment of CERNET (China Educational and Research Network). However, the commercialization and rapid expansion of Internet access and diffusion in China did not occur until 1995-1996 when multiple IT infrastructure programs and applications across diverse sectors were introduced through the Golden Projects promoted by the Chinese government (Clark, 1996). In January 1996, the largest ISP in China, the ChinaNET, successfully implemented the first commercially available Internet service across China. Since then, the Internet has started to take off among various sectors in China. Table 16 documents Internet users, computers with an Internet connection, international gateway bandwidth, and domain name registration under .cn over the last decade. The survey results clearly point to a rapid growth since 1997. Internet users grew from only 600,000 in 1997 to 33
12
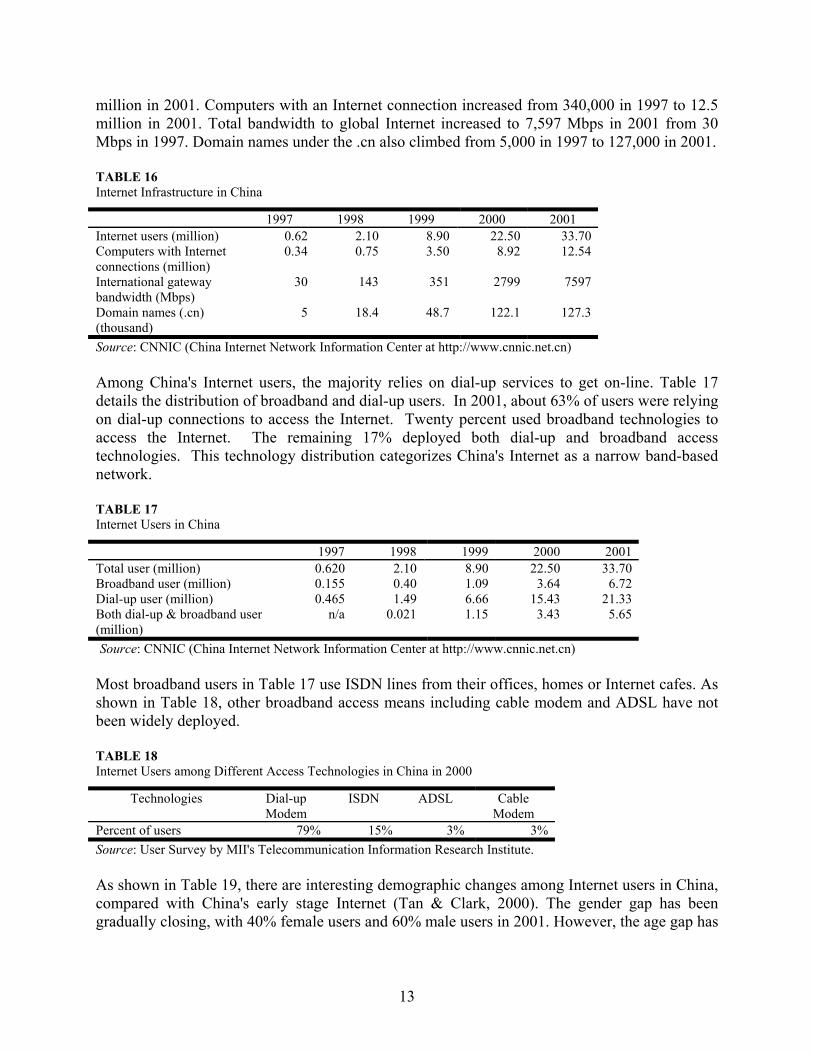
million in 2001. Computers with an Internet connection increased from 340,000 in 1997 to 12.5 million in 2001. Total bandwidth to global Internet increased to 7,597 Mbps in 2001 from 30 Mbps in 1997. Domain names under the .cn also climbed from 5,000 in 1997 to 127,000 in 2001. TABLE 16 Internet Infrastructure in China
1997 1998 1999 2000 2001 Internet users (million) 0.62 2.10 8.90 22.50 33.70 Computers with Internet connections (million)
0.34 0.75 3.50 8.92 12.54
International gateway bandwidth (Mbps)
30 143 351 2799 7597
Domain names (.cn) (thousand)
5 18.4 48.7 122.1 127.3
Source: CNNIC (China Internet Network Information Center at http://www.cnnic.net.cn) Among China's Internet users, the majority relies on dial-up services to get on-line. Table 17 details the distribution of broadband and dial-up users. In 2001, about 63% of users were relying on dial-up connections to access the Internet. Twenty percent used broadband technologies to access the Internet. The remaining 17% deployed both dial-up and broadband access technologies. This technology distribution categorizes China's Internet as a narrow band-based network. TABLE 17 Internet Users in China
1997 1998 1999 2000 2001 Total user (million) 0.620 2.10 8.90 22.50 33.70 Broadband user (million) 0.155 0.40 1.09 3.64 6.72 Dial-up user (million) 0.465 1.49 6.66 15.43 21.33 Both dial-up & broadband user (million)
n/a 0.021 1.15 3.43 5.65
Source: CNNIC (China Internet Network Information Center at http://www.cnnic.net.cn) Most broadband users in Table 17 use ISDN lines from their offices, homes or Internet cafes. As shown in Table 18, other broadband access means including cable modem and ADSL have not been widely deployed. TABLE 18 Internet Users among Different Access Technologies in China in 2000
Technologies Dial-up Modem
ISDN ADSL Cable Modem
Percent of users 79% 15% 3% 3% Source: User Survey by MII's Telecommunication Information Research Institute. As shown in Table 19, there are interesting demographic changes among Internet users in China, compared with China's early stage Internet (Tan & Clark, 2000). The gender gap has been gradually closing, with 40% female users and 60% male users in 2001. However, the age gap has
13
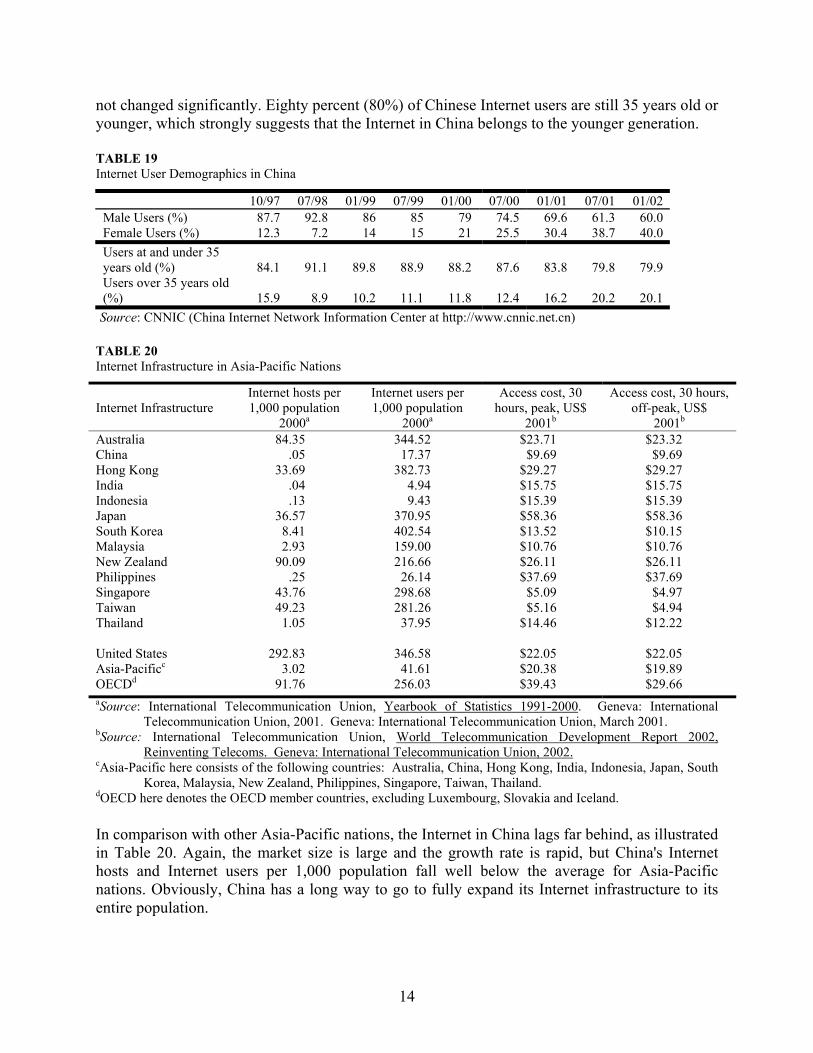
not changed significantly. Eighty percent (80%) of Chinese Internet users are still 35 years old or younger, which strongly suggests that the Internet in China belongs to the younger generation. TABLE 19 Internet User Demographics in China
10/97 07/98 01/99 07/99 01/00 07/00 01/01 07/01 01/02 Male Users (%) 87.7 92.8 86 85 79 74.5 69.6 61.3 60.0 Female Users (%) 12.3 7.2 14 15 21 25.5 30.4 38.7 40.0 Users at and under 35 years old (%)
84.1
91.1
89.8
88.9
88.2
87.6
83.8
79.8
79.9
Users over 35 years old (%)
15.9
8.9
10.2
11.1
11.8
12.4
16.2
20.2
20.1
Source: CNNIC (China Internet Network Information Center at http://www.cnnic.net.cn) TABLE 20 Internet Infrastructure in Asia-Pacific Nations
Internet Infrastructure
Internet hosts per 1,000 population
2000a
Internet users per 1,000 population
2000a
Access cost, 30 hours, peak, US$
2001b
Access cost, 30 hours, off-peak, US$
2001b Australia 84.35 344.52 $23.71 $23.32 China .05 17.37 $9.69 $9.69 Hong Kong 33.69 382.73 $29.27 $29.27 India .04 4.94 $15.75 $15.75 Indonesia .13 9.43 $15.39 $15.39 Japan 36.57 370.95 $58.36 $58.36 South Korea 8.41 402.54 $13.52 $10.15 Malaysia 2.93 159.00 $10.76 $10.76 New Zealand 90.09 216.66 $26.11 $26.11 Philippines .25 26.14 $37.69 $37.69 Singapore 43.76 298.68 $5.09 $4.97 Taiwan 49.23 281.26 $5.16 $4.94 Thailand 1.05 37.95 $14.46 $12.22 United States 292.83 346.58 $22.05 $22.05 Asia-Pacificc 3.02 41.61 $20.38 $19.89 OECDd 91.76 256.03 $39.43 $29.66 aSource: International Telecommunication Union, Yearbook of Statistics 1991-2000. Geneva: International
Telecommunication Union, 2001. Geneva: International Telecommunication Union, March 2001. bSource: International Telecommunication Union, World Telecommunication Development Report 2002,
Reinventing Telecoms. Geneva: International Telecommunication Union, 2002. cAsia-Pacific here consists of the following countries: Australia, China, Hong Kong, India, Indonesia, Japan, South
Korea, Malaysia, New Zealand, Philippines, Singapore, Taiwan, Thailand. dOECD here denotes the OECD member countries, excluding Luxembourg, Slovakia and Iceland. In comparison with other Asia-Pacific nations, the Internet in China lags far behind, as illustrated in Table 20. Again, the market size is large and the growth rate is rapid, but China's Internet hosts and Internet users per 1,000 population fall well below the average for Asia-Pacific nations. Obviously, China has a long way to go to fully expand its Internet infrastructure to its entire population.
14
Enterprise infrastructure In general, IT infrastructures are poor for small and medium-sized enterprises. Large enterprises have better IT infrastructures since they tend to have larger budgets for IT. Based on a survey conducted by China's State Economic and Trade Commission (from Xinhua New Agency, November 19, 2001), the following are year 2000 results among the 100 corporations that had the highest IT investments among various enterprises in China in 2000. • Basic IT infrastructure (Office Automation, Management Information System): Totally
deployed in 16.7% of enterprises; partially deployed in 81.1% of enterprises. • Comprehensive IT infrastructure (ERP, MRPII, CIMS): Totally deployed in 16.5% of
businesses; partially deployed in 50.5%; not deployed in 33%. • 87% completed their Intranet and Web sites in 2000. • 37% conducted some kind of e-commerce. The above data is from enterprises with heavy IT investment; IT infrastructure in average enterprises in China is poorer. China's program, "2000—year for enterprises on-line," has certainly boosted the deployment of overall IT infrastructure among enterprises. However, Chinese enterprises generally lag far behind their counterparts in developed countries such as the United States.
Financial and delivery infrastructure The credit card is a relatively new transaction method in China: the first card was issued in Guangdong province in 1985. The number of credit cards and debit cards has grown rapidly with 330 million new cards issued in 2000. However, the usage rate is surprisingly low. Based on a year-2000 survey in 12 large cities, including Beijing and Shanghai, 20% of residents had a credit or debit card, but only 9% of them used their card at least once a week. Twenty-four percent of them used the card 2-3 times a month. The remaining cardholders used their cards only a few times a year. In general, credit and debit cards are used only in high-end department stores, luxury hotels and restaurants. China's postal delivery system is mostly dominated by the de facto monopoly, China Posts, which provides a complete national coverage. Compared with counterparts in advanced nations, China Posts’ delivery time is long and its service quality is poor, specifically in remote and rural areas. Express delivery services by China Posts are often available in big cities and economically developed provinces, but rarely extended to remote and rural areas. International services are often jointly offered by China Posts and foreign carriers such as UPS. There are cargo services offered by airlines, railway systems, trucking carriers, and boat transportation companies in big cities. However, these services are very different from UPS in many ways. For example, goods are often not delivered to customers’ office or home. They have to be picked up at service providers’ central warehouses. This must improve in order to facilitate e-commerce activities. In many cases, especially within a metropolitan area, e-commerce service providers are hiring, or even establishing their own, private delivery networks. There is no sophisticated national private courier company yet. Meanwhile, e-commerce diffusion is mostly likely to create opportunities for various delivery firms to be reorganized and to grow.
15
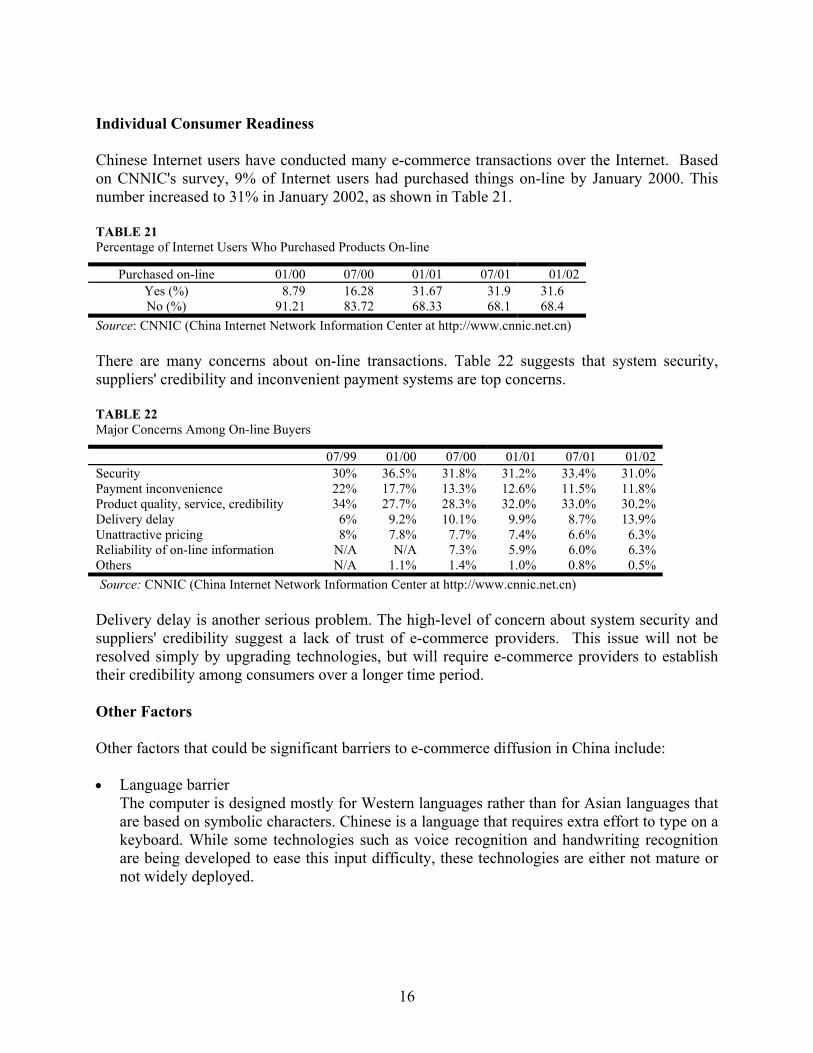
Individual Consumer Readiness Chinese Internet users have conducted many e-commerce transactions over the Internet. Based on CNNIC's survey, 9% of Internet users had purchased things on-line by January 2000. This number increased to 31% in January 2002, as shown in Table 21. TABLE 21 Percentage of Internet Users Who Purchased Products On-line
Purchased on-line 01/00 07/00 01/01 07/01 01/02 Yes (%) 8.79 16.28 31.67 31.9 31.6 No (%) 91.21 83.72 68.33 68.1 68.4
Source: CNNIC (China Internet Network Information Center at http://www.cnnic.net.cn) There are many concerns about on-line transactions. Table 22 suggests that system security, suppliers' credibility and inconvenient payment systems are top concerns. TABLE 22 Major Concerns Among On-line Buyers
07/99 01/00 07/00 01/01 07/01 01/02 Security 30% 36.5% 31.8% 31.2% 33.4% 31.0% Payment inconvenience 22% 17.7% 13.3% 12.6% 11.5% 11.8% Product quality, service, credibility 34% 27.7% 28.3% 32.0% 33.0% 30.2% Delivery delay 6% 9.2% 10.1% 9.9% 8.7% 13.9% Unattractive pricing 8% 7.8% 7.7% 7.4% 6.6% 6.3% Reliability of on-line information N/A N/A 7.3% 5.9% 6.0% 6.3% Others N/A 1.1% 1.4% 1.0% 0.8% 0.5% Source: CNNIC (China Internet Network Information Center at http://www.cnnic.net.cn) Delivery delay is another serious problem. The high-level of concern about system security and suppliers' credibility suggest a lack of trust of e-commerce providers. This issue will not be resolved simply by upgrading technologies, but will require e-commerce providers to establish their credibility among consumers over a longer time period. Other Factors Other factors that could be significant barriers to e-commerce diffusion in China include: • Language barrier
The computer is designed mostly for Western languages rather than for Asian languages that are based on symbolic characters. Chinese is a language that requires extra effort to type on a keyboard. While some technologies such as voice recognition and handwriting recognition are being developed to ease this input difficulty, these technologies are either not mature or not widely deployed.
16
• Content Barrier Most Web site content on the Internet is written in English, which has not been mastered by most Chinese, especially older generations. Web contents in Chinese have been increasing in recent years. The availability of a significant amount of Chinese content and e-commerce Web sites will determine e-commerce diffusion to a large extent.
• Computer Literacy Computers have not been widely deployed in China's daily living and working environment, which has limited the opportunity for ordinary users to acquire computer skills. In many cases, users need some kind of training program before they can become regular Internet and e-commerce users.
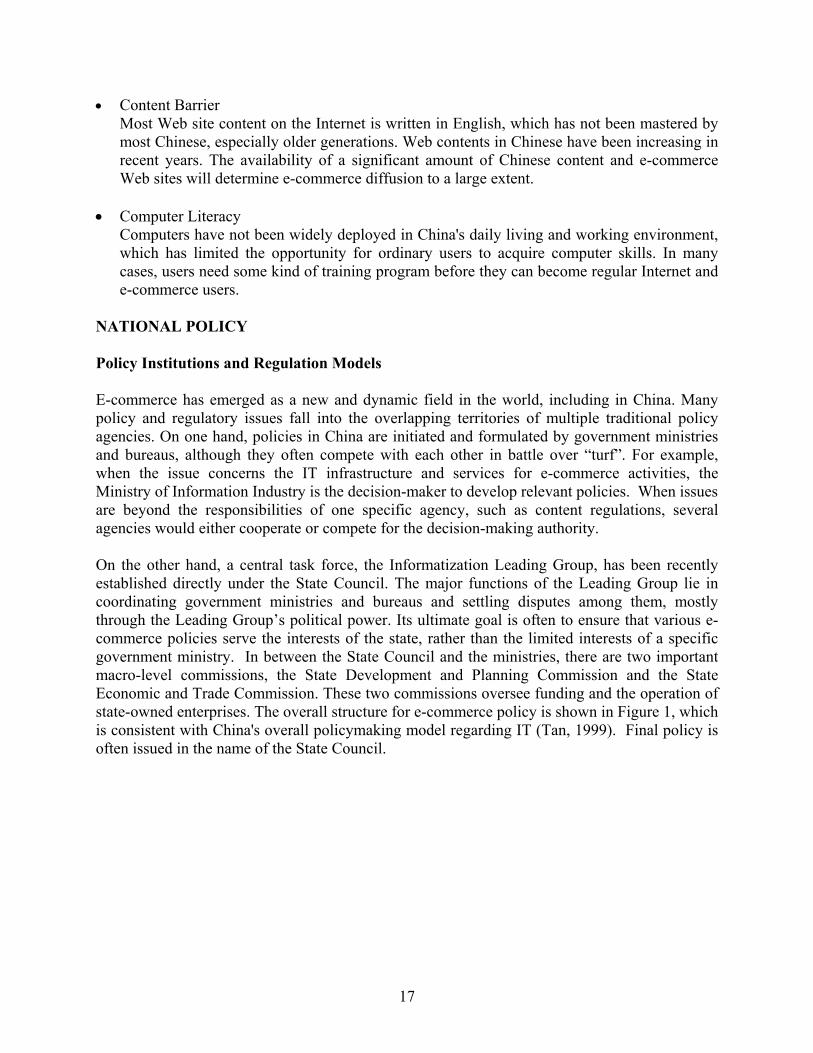
NATIONAL POLICY Policy Institutions and Regulation Models E-commerce has emerged as a new and dynamic field in the world, including in China. Many policy and regulatory issues fall into the overlapping territories of multiple traditional policy agencies. On one hand, policies in China are initiated and formulated by government ministries and bureaus, although they often compete with each other in battle over “turf”. For example, when the issue concerns the IT infrastructure and services for e-commerce activities, the Ministry of Information Industry is the decision-maker to develop relevant policies. When issues are beyond the responsibilities of one specific agency, such as content regulations, several agencies would either cooperate or compete for the decision-making authority. On the other hand, a central task force, the Informatization Leading Group, has been recently established directly under the State Council. The major functions of the Leading Group lie in coordinating government ministries and bureaus and settling disputes among them, mostly through the Leading Group’s political power. Its ultimate goal is often to ensure that various e-commerce policies serve the interests of the state, rather than the limited interests of a specific government ministry. In between the State Council and the ministries, there are two important macro-level commissions, the State Development and Planning Commission and the State Economic and Trade Commission. These two commissions oversee funding and the operation of state-owned enterprises. The overall structure for e-commerce policy is shown in Figure 1, which is consistent with China's overall policymaking model regarding IT (Tan, 1999). Final policy is often issued in the name of the State Council.
17
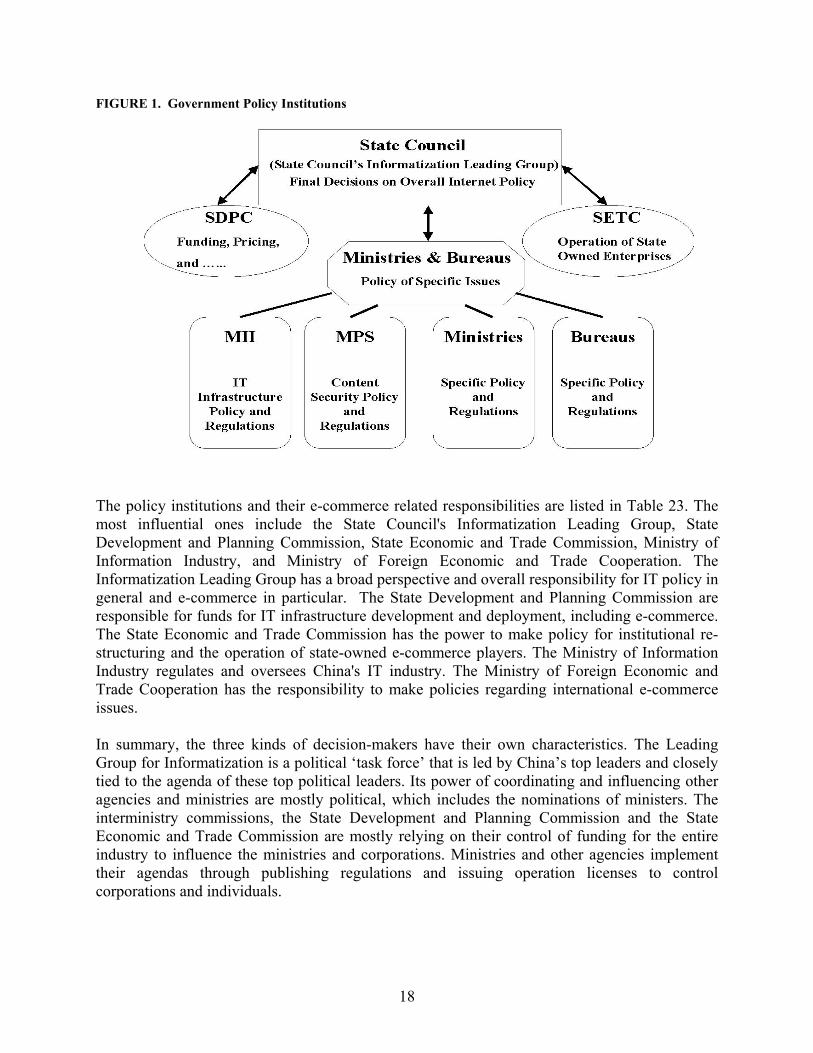
FIGURE 1. Government Policy Institutions
The policy institutions and their e-commerce related responsibilities are listed in Table 23. The most influential ones include the State Council's Informatization Leading Group, State Development and Planning Commission, State Economic and Trade Commission, Ministry of Information Industry, and Ministry of Foreign Economic and Trade Cooperation. The Informatization Leading Group has a broad perspective and overall responsibility for IT policy in general and e-commerce in particular. The State Development and Planning Commission are responsible for funds for IT infrastructure development and deployment, including e-commerce. The State Economic and Trade Commission has the power to make policy for institutional re-structuring and the operation of state-owned e-commerce players. The Ministry of Information Industry regulates and oversees China's IT industry. The Ministry of Foreign Economic and Trade Cooperation has the responsibility to make policies regarding international e-commerce issues. In summary, the three kinds of decision-makers have their own characteristics. The Leading Group for Informatization is a political ‘task force’ that is led by China’s top leaders and closely tied to the agenda of these top political leaders. Its power of coordinating and influencing other agencies and ministries are mostly political, which includes the nominations of ministers. The interministry commissions, the State Development and Planning Commission and the State Economic and Trade Commission are mostly relying on their control of funding for the entire industry to influence the ministries and corporations. Ministries and other agencies implement their agendas through publishing regulations and issuing operation licenses to control corporations and individuals.
18
TABLE 23 Policy Institutions in China
Institution Policy responsibilities regarding e-commerce
State Council Informatization Leading Group
• Coordinates government ministries and bureaus regarding IT policy, including e-commerce.
• Ensures that various e-commerce policies are serving the interests of the state.
State Development and Planning Commission
• Oversees funds for IT infrastructure development and deployment.
• Oversees many pricing policies. State Economic and Trade Commission
• Makes policy for institutional restructuring. • Oversees the operation of state-owned e-commerce players.
Ministry of Information Industry
• Regulates and oversees China's IT industry. • Regulates and oversees China's IT infrastructure for e-commerce
services. Ministry of Foreign Economic and Trade Cooperation
• Policies regarding international e-commerce issues.
Ministry of Science and Technology • R&D for e-commerce services, including hardware and software. Ministry of Education • Human resources development and training for e-commerce. People's Bank of China • Makes policy regarding electronic currency and certificate
authorization. State Bureau of News and Publications
• Policy regarding publication and trade of news, books and other publications through e-commerce.
State Bureau of Industry and Commerce
• Licensing policy for e-commerce business operations.
Ministry of Public Security • Network security, encryption, and content regulation. State Bureau of Radio, Film, and Television
• Policy regarding e-commerce through cable TV systems. • E-commerce regarding audio and video products.
Provincial and Local Governments • Provincial and local policy regarding E-commerce in their territories.
• They are ahead of central governments in many cases. Enabling Policies
Telecommunications liberalization—from monopoly to competition The telecommunication system is one of the vital infrastructures for E-commerce diffusion. China's telecom infrastructure used to be run by a monopoly, the Ministry of Posts and Telecommunications, until the early 1990s. Since the introduction of the first competitor, China Unicom, in 1993, China's telecom infrastructure has been gradually transformed into a competitive market for state-owned corporations as shown in Table 24. The only remaining monopoly sector is cable TV service. To date, foreign capital and domestic investments have not been able to enter this market on a large scale because of regulation restrictions.
It has been very obvious that China's telecommunications infrastructure is becoming more liberalized and competitive. Minister Jichuan Wu of the MII reiterated this trend of market openness and competition in his recent speech at the 2002 Pacific Telecommunications
19
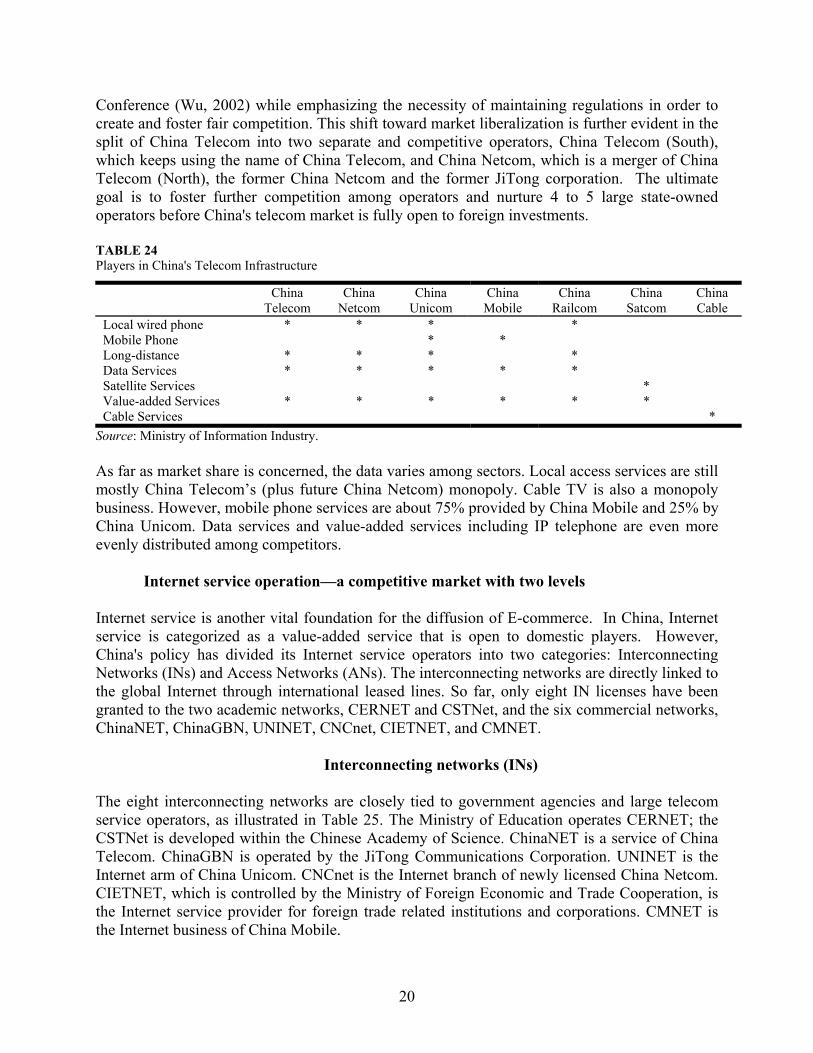
Conference (Wu, 2002) while emphasizing the necessity of maintaining regulations in order to create and foster fair competition. This shift toward market liberalization is further evident in the split of China Telecom into two separate and competitive operators, China Telecom (South), which keeps using the name of China Telecom, and China Netcom, which is a merger of China Telecom (North), the former China Netcom and the former JiTong corporation. The ultimate goal is to foster further competition among operators and nurture 4 to 5 large state-owned operators before China's telecom market is fully open to foreign investments. TABLE 24 Players in China's Telecom Infrastructure
China Telecom
China Netcom
China Unicom
China Mobile
China Railcom
China Satcom
China Cable
Local wired phone * * * * Mobile Phone * * Long-distance * * * * Data Services * * * * * Satellite Services * Value-added Services * * * * * * Cable Services *
Source: Ministry of Information Industry. As far as market share is concerned, the data varies among sectors. Local access services are still mostly China Telecom’s (plus future China Netcom) monopoly. Cable TV is also a monopoly business. However, mobile phone services are about 75% provided by China Mobile and 25% by China Unicom. Data services and value-added services including IP telephone are even more evenly distributed among competitors.
Internet service operation—a competitive market with two levels Internet service is another vital foundation for the diffusion of E-commerce. In China, Internet service is categorized as a value-added service that is open to domestic players. However, China's policy has divided its Internet service operators into two categories: Interconnecting Networks (INs) and Access Networks (ANs). The interconnecting networks are directly linked to the global Internet through international leased lines. So far, only eight IN licenses have been granted to the two academic networks, CERNET and CSTNet, and the six commercial networks, ChinaNET, ChinaGBN, UNINET, CNCnet, CIETNET, and CMNET.
Interconnecting networks (INs) The eight interconnecting networks are closely tied to government agencies and large telecom service operators, as illustrated in Table 25. The Ministry of Education operates CERNET; the CSTNet is developed within the Chinese Academy of Science. ChinaNET is a service of China Telecom. ChinaGBN is operated by the JiTong Communications Corporation. UNINET is the Internet arm of China Unicom. CNCnet is the Internet branch of newly licensed China Netcom. CIETNET, which is controlled by the Ministry of Foreign Economic and Trade Cooperation, is the Internet service provider for foreign trade related institutions and corporations. CMNET is the Internet business of China Mobile.
20
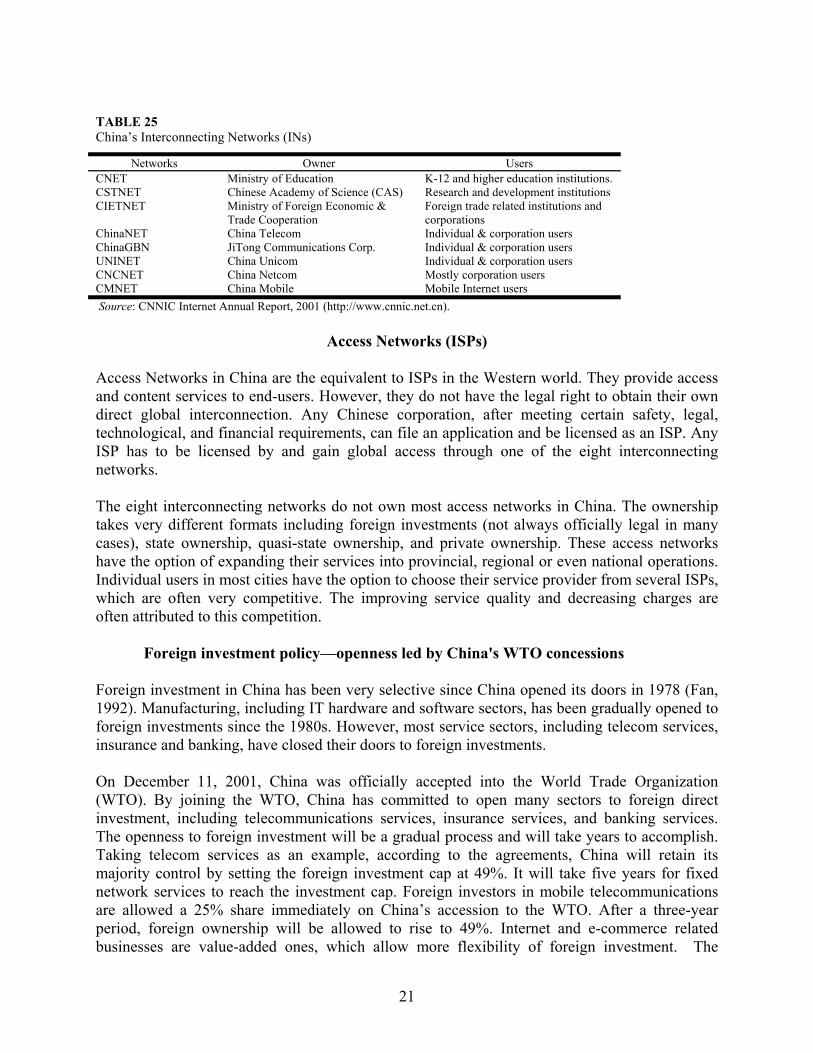
TABLE 25 China’s Interconnecting Networks (INs)
Networks Owner Users CNET Ministry of Education K-12 and higher education institutions. CSTNET Chinese Academy of Science (CAS) Research and development institutions CIETNET Ministry of Foreign Economic &
Trade Cooperation Foreign trade related institutions and corporations
ChinaNET China Telecom Individual & corporation users ChinaGBN JiTong Communications Corp. Individual & corporation users UNINET China Unicom Individual & corporation users CNCNET China Netcom Mostly corporation users CMNET China Mobile Mobile Internet users Source: CNNIC Internet Annual Report, 2001 (http://www.cnnic.net.cn).
Access Networks (ISPs) Access Networks in China are the equivalent to ISPs in the Western world. They provide access and content services to end-users. However, they do not have the legal right to obtain their own direct global interconnection. Any Chinese corporation, after meeting certain safety, legal, technological, and financial requirements, can file an application and be licensed as an ISP. Any ISP has to be licensed by and gain global access through one of the eight interconnecting networks. The eight interconnecting networks do not own most access networks in China. The ownership takes very different formats including foreign investments (not always officially legal in many cases), state ownership, quasi-state ownership, and private ownership. These access networks have the option of expanding their services into provincial, regional or even national operations. Individual users in most cities have the option to choose their service provider from several ISPs, which are often very competitive. The improving service quality and decreasing charges are often attributed to this competition.
Foreign investment policy—openness led by China's WTO concessions Foreign investment in China has been very selective since China opened its doors in 1978 (Fan, 1992). Manufacturing, including IT hardware and software sectors, has been gradually opened to foreign investments since the 1980s. However, most service sectors, including telecom services, insurance and banking, have closed their doors to foreign investments. On December 11, 2001, China was officially accepted into the World Trade Organization (WTO). By joining the WTO, China has committed to open many sectors to foreign direct investment, including telecommunications services, insurance services, and banking services. The openness to foreign investment will be a gradual process and will take years to accomplish. Taking telecom services as an example, according to the agreements, China will retain its majority control by setting the foreign investment cap at 49%. It will take five years for fixed network services to reach the investment cap. Foreign investors in mobile telecommunications are allowed a 25% share immediately on China’s accession to the WTO. After a three-year period, foreign ownership will be allowed to rise to 49%. Internet and e-commerce related businesses are value-added ones, which allow more flexibility of foreign investment. The
21
openness to foreign investment, driven by China's joining the WTO, is expected to bring China closer to global criteria in terms of policy and regulations. E-commerce Policy It is worthwhile to note that some provincial and local governments are ahead of the central government in formulating e-commerce policies. For example, Guangdong province published laws governing e-commerce in its territory. This is another reflection of geographic disparity, which will lead to widely varying diffusion patterns in different geographic areas. There is no trend for provinces to coordinate their policies among each other. The following section is a general review of various policy issues (Zheng, 1999).
Tax treatment of electronic transactions China’s tax system is quite different from that of many other nations. In everyday commerce activities, vendors are required to pay various taxes on their revenues. These taxes are then distributed among local governments and state agencies. However, since consumers are often not charged sales tax, E-commerce is viewed and treated the same as regular commerce. E-commerce vendors are required to pay the same kinds of taxes as regular vendors. There are few discussions about favorable tax terms to e-commerce per se, except for favorable tax terms to high-tech firms in general, which could include e-commerce vendors.
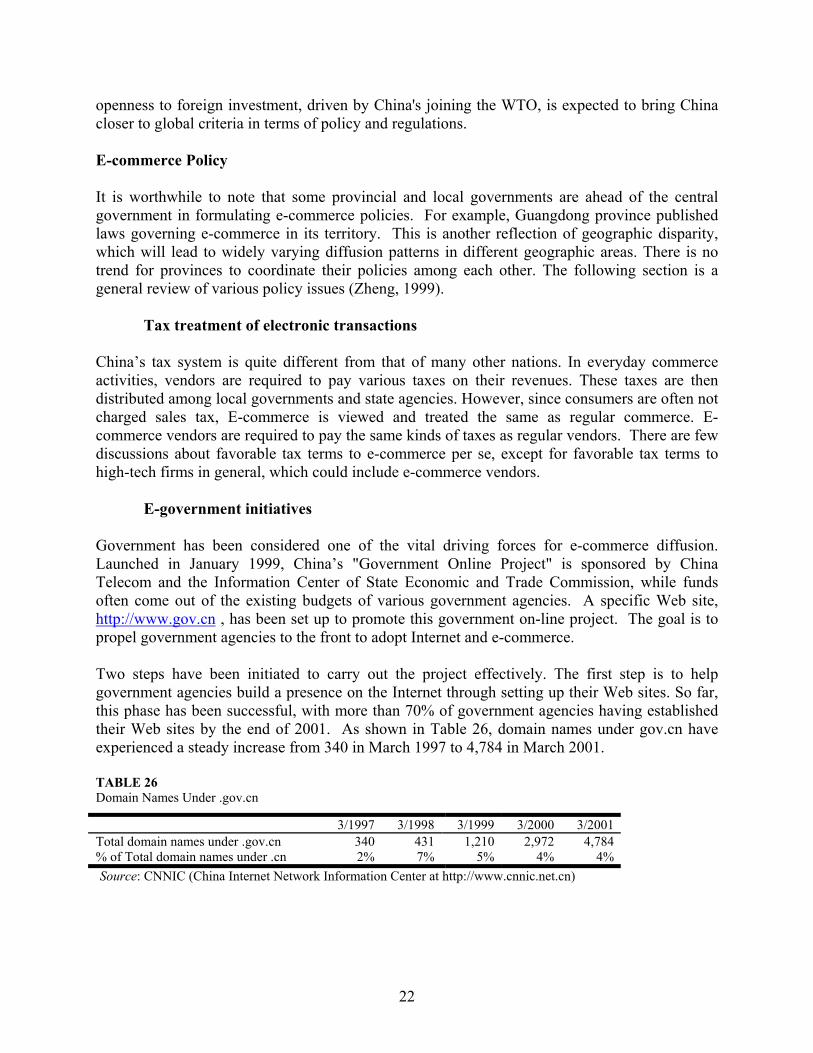
E-government initiatives Government has been considered one of the vital driving forces for e-commerce diffusion. Launched in January 1999, China’s "Government Online Project" is sponsored by China Telecom and the Information Center of State Economic and Trade Commission, while funds often come out of the existing budgets of various government agencies. A specific Web site, http://www.gov.cn , has been set up to promote this government on-line project. The goal is to propel government agencies to the front to adopt Internet and e-commerce. Two steps have been initiated to carry out the project effectively. The first step is to help government agencies build a presence on the Internet through setting up their Web sites. So far, this phase has been successful, with more than 70% of government agencies having established their Web sites by the end of 2001. As shown in Table 26, domain names under gov.cn have experienced a steady increase from 340 in March 1997 to 4,784 in March 2001. TABLE 26 Domain Names Under .gov.cn
3/1997 3/1998 3/1999 3/2000 3/2001 Total domain names under .gov.cn 340 431 1,210 2,972 4,784 % of Total domain names under .cn 2% 7% 5% 4% 4% Source: CNNIC (China Internet Network Information Center at http://www.cnnic.net.cn)
22
The second step is to conduct government services on-line and to share data and publications on-line. So far success has been limited by poor IT infrastructure, lack of IT skills among staff, and poor legal and business infrastructures among government agencies. However, e-government is viewed as one of the sectors that could see dramatically rapid diffusion of e-commerce. Current efforts focus on the establishment of laws and regulations by agencies including the State Council's Informatization Leading Group, the upgrading of related infrastructures, and the training of government servants.
R&D and other incentives to the private sector The Chinese government sponsors R&D by providing research grants to public research institutions and private sectors. Most R&D funds are centrally administrated by the Ministry of Science and Technology. Funds are allocated mostly based on applicants’ technology capabilities and the peer evaluation results of proposals. Some ministries have some internal R&D funds. Based on its published documents (Xinhua news agency, 12/12/02, Priority R&D fields), China will sponsor R&D e-commerce activities in the following areas over the next five years: • Certificate authorization (CA) system; payment system; and supply chain management
system. • Enterprise database systems. • E-commerce platforms to enhance Chinese enterprises' participation in global trade and
cross-national production networks. • Trial e-commerce service operations in certain sectors and feasibility studies of business
operation models. • Critical software and hardware technologies for e-commerce. • Development of technical and transactional standards, in particular, the interconnection
standards among different platforms and systems. Legal Framework
Electronic signatures After observing the signing of the U.S. digital signature law by then President Clinton, China has felt increasing pressure to develop its own policy regarding this issue. Academic researchers and policymakers are studying the issue of electronic signature, and a law is expected to be published no later than 2003.
Security and cryptographic systems Consumers have listed security and encryption as the top concern in many surveys. This is in part because China's overall technical and legal environment is too weak to effectively fight fraud. This area also involves multiple government agencies. Several agencies oversee some aspect of the security issue, and each has developed specific policy covering its own concerns.
23
Content control is regulated by different agencies for different concerns. The National Bureau for Information Protection is concerned with the impacts of information publication/leaking on national security. It is the bureau to determine what kind of security information could be published on-line and what could not be put on-line. State Councils’ News Offices regulates the publication of news reports on any topics and determines whether they could be put on-line and which Web sites could publish the news. The Ministry of Information Industry coordinates the blocking of “indecent” foreign content. The safety of China’s Internet operation is the responsibility of the Ministry of Information Industry. Licensing network products for security is a joint coordination between the Ministry of Public Security and the Ministry of National Security. Encryption policy and implementation are handled by National Encryption Code Commission. The Ministry of Public Security is responsible for investigating any criminal cases.
Privacy Although privacy has been one of the major concerns for e-commerce diffusion in many nations, it has not been on the list of major concerns among Chinese consumers, based on various surveys. This could be related to Chinese culture where privacy is neither highly valued nor well respected. In the near future, policy and regulations regarding privacy are not likely to be developed and published. Privacy might be a potential issue for e-commerce diffusion in the long run as consumers become more concerned about safeguarding their personal information.
Intellectual property protection Protection for both on-line and off-line intellectual property rights has been a top priority for Chinese lawmakers in recent years. Intellectual property legislation is viewed as a vital base for the healthy development of the software industry and audio-video industry, as well as e-commerce. State Council published China’s Directive for Computer Software Protection back in 1991. Relevant laws on copyright protection of on-line publications and audio-video products have also been published by State Intellectual Ownership Bureau and State Custom Bureau. The major challenge is the poor enforcement, which is closely related to the general income and culture of consumers. The relatively low income of most individuals in China makes buying a software product expensive. Meanwhile, Chinese culture tends to value hardware products, and software products are often undervalued or even thought to have no value. The combination of low income with the lack of respect to software products makes illegal copying a popular practice. Any e-commerce activities for software products have to fight this. One theory is to argue that over time, income will catch up and intellectual property rights will be protected and honored.
Censorship Censorship is one of the most sensitive and significant policy issues in China, related to E-commerce diffusion (Tan, Mueller & Foster, 1997; Tan & Lu, 1998; Tan, Foster & Goodman, 1999). The government has been censoring all kinds of subject matter in its society, including
24
news, publications, radio broadcasting, television programs, and movies. Subject matter is highly regulated by several relevant government agencies, including the Propaganda Department of the Chinese Communist Party, State Bureau of Broadcasting, Film and Television, State Bureau of News and Publications, and Ministry of Public Security. The emergence of the Internet and e-commerce has created a potential threat for the government to lose its censorship control. However, the Internet and e-commerce could not be renounced since they are considered the driving force of China's economic growth. Facing this dilemma, China is trying to extend its censorship model for the off-line world to the on-line world. The underlying policy thinking is to open the Internet and e-commerce for economic benefits while monitoring and controlling content in order to minimize “negative” social and political impacts. The logic and effectiveness of this policy have been routinely challenged by the belief that the Internet, per se, makes any effort to filter and control content obsolete. China’s efforts focus on several different fronts. On the technical side, the government is licensing a limited number of networks that are connected to the global Internet though their gateways. Currently, only eight large networks have been granted rights to run the gateways. By installing filtering software and firewalls in these gateways, China’s Internet has virtually converted into a national intranet (Tan, 1999). Politically sensitive sites such as cnn.com and pornographic sites have been routinely blocked from access by Internet users in China. This intranet structure gives the Chinese government the power to block any E-commerce services or sites from its domestic consumers. Regarding individual consumers and ISPs, the Ministry of Public Security has published several regulations, which have made access to politically sensitive and pornographic information on the Internet illegal. Publishing, disseminating and trading “indecent” information are categorized as crimes. “Indecent” information includes national political and economic secrets. What will be significant for e-commerce diffusion is the treatment of political and economic secrets, which are often vaguely defined and arbitrarily applied.
Policy to promote international e-commerce In general, China is promoting international e-commerce. Many e-commerce platforms have been established to promote export of Chinese products, as well as import of other countries’ goods. The driving idea is to see whether the on-site semi-annual import-export fairs could be converted into virtual and always-on import-export fairs over the Internet. The Ministry of Foreign Economic and Trade Cooperation has been charged to make policies regarding international e-commerce issues. After joining the WTO in 2001, China has been pressed to adopt policies consistent with WTO's criteria. However, specific policies on this issue have not been published yet.
Certificate authorization (CA) The central government has lagged behind in developing policy on CA, while several provincial governments have moved ahead. No national law exists governing the nationwide CA system
25
and its credibility. However, local governments in Beijing, Shanghai, Tianjing and Guangzhou have published their local policies to implement CA within their own administrative territories.
Favorable policies for network access and usage rates Recognizing the unusually high cost of Internet usage, the government has worked with telecom carriers to lower access charges. From this perspective, pricing is still regulated by the State Development and Planning Commission. The ultimate goal is to transform China's telecom service market from a monopoly to a competitive regime—an obvious policy trend under implementation as discussed in other sections of this paper. Promotional Efforts to Mobilize Public Awareness In a country with centralized political, social and economic systems, the Chinese government is one of the most vital players in promoting e-commerce diffusion and mobilizing public awareness. The government has been proactively initiating national projects. The 1990s featured the government's "Three Golden Bridges" project (Lovelock, 1997). The current initiative consists of a three-step effort: the Government Online Project launched in 1999 (www.gov.cn), Enterprises Online Project in 2000 (www.sinoeol.com), and Home Online Project in 2001 (www.sinohome.com). In general, these projects are sponsored by major policymakers and implemented by major service providers. The projects are sponsored by the State Economic and Trade Commission and the Ministry of Information Industry. China Telecom, the Information Center of the State Economic and Trade Commission, and 50 other organizations are involved in implementing the three projects. The Government Online Project is part of the big e-government initiative, which has been discussed in the section on government. The Enterprise Online Project was launched in July 2000 and a Web site, www.sinoeol.com, has been set up for this project. The goal is to have one million small firms, 10 thousand medium-sized firms, and 100 large enterprises on-line within one year (CNNIC, 2001). There are three strategic channels for enterprises to join over time: Green Path, Profit Route, and High-Speed E-commerce. The Green Path aims to provide a standardized channel and technical support for enterprises to create and maintain their Web sites for information publication purposes. The Profit Route would be an e-commerce portal created and maintained by service providers. Enterprises could join the portal and make business transactions through the portal. The High-Speed E-commerce would be a packaged solution for enterprises to conduct B2B e-commerce for their own products within their own Web sites. The Web site and other technical solutions are provided by China’s most significant ISP, China Telecom. The entire project could be viewed as a combination of government’s political desire with China Telecom’s business interests. However, the lack of funds and technical staff in many medium and small sized firms may undermine the ambition of this project. The Home Online Project was launched in 2001 with its dedicated Web site at http://www.sinohome.com/. With the goal of promoting e-commerce to families, the Home
26
Online Project focuses on establishing on-line local communities in metropolitan areas. It aims to offer various information services related to family life on-line. While all three projects are under way, the most successful one to date is the Government Online Project with measurable growth in domain names by government agencies. CONCLUSION Given the specific economic, infrastructure and policy environments, e-commerce in China could be characterized as being in a start-up stage with uneven diffusion among different geographic areas and different sectors with their own unique implementation strategies. The following features describe e-commerce in China (Deng, 2001). • 90% of B2C transactions use COD (Cash On Delivery; pay upon receiving the goods) to
settle the payment. • Vendors or e-commerce service providers, rather than special delivery firms, deliver most of
the purchased goods. • Pricing through e-commerce is the same as through traditional commerce. • Many e-stores are not a 24-hour/7-day operation. They are open for certain days and certain
time periods similar to traditional stores. Business-to-Business (B2B)
B2B activities Most B2B services in China were launched in 2000. China’s overall environment leads to the dominance of “on-line trading markets” in the B2B sector, where service providers create Web sites to serve a large number of vendors and buyers, often small- and medium-sized enterprises. This model is popular, mostly because small- and medium-sized businesses do not have adequate IT investment, technical capabilities and staff support to create and maintain their own e-commerce facilities and have to rely on a third party for a packaged solution. In 2000, on-line and off-line B2B transactions were 305 million RMB (US$36.7 million) and 76 billion RMB (US$9.1 billion), respectively, as shown in Table 27. This is an estimate by the respected domestic IT information consultant firm, CCID, which is closely tied to China’s Ministry of Information Industry. Because of the variance of B2B definition and data collection methods, the size of China’s B2B transactions has a wide range by different sources. TABLE 27 B2B transactions in 2000
On-line Off-line Total Transaction (million RMB) 305
(US$36.7M) 76,700
(US$9.24B) Source: CCID – 2000-2001 B2B Market Report. Note: On-line means that payment is made on-line. Off-line means that part of the transaction is on-line, but
payment is made off-line.
27
B2B e-commerce diffusion will, to a large extent, be determined by the pace of IT infrastructure development among enterprises. In the short-run, rapid diffusion is predicted with the dominance of “on-line trading market” services (CCID, 2001a).
Key B2B drivers and barriers One of the most significant key drivers is the Chinese government. China is still a government-dominated society. Promoting information technology has been viewed by the government as both the bottom line to survive and the strategic means to grow. That is why the government has launched “Government Online” and “Enterprises Online” to promote Internet and e-commerce among government agencies and enterprises. This driver is based both on the economic and political agenda. Another driver is the desire of enterprises, especially larger ones, to connect to the global economy after China’s WTO accession. Promoting B2B e-commerce is viewed as one of the basic requirements to enter global production networks, while it would also enhance the efficiency and effectiveness of Chinese firms. Further, B2B is viewed as one of the significantly growing sectors in China in the near future by both Chinese and foreign IT service providers. The potential profits would attract both domestic and foreign service providers to allocate more resources and implement more deployments, which would further drive e-commerce diffusion in China. One of the most serious barriers would be the lack of trust among B2B participants. There is not a solid legal and technical foundation to monitor and to enforce the trust relationship among involved parties. This lack of trust will generally handicap contract enforcement and delay the adoption of e-commerce. Another barrier could be the resistance from middle-level managers, especially in state-owned enterprises. The implementation of B2B e-commerce often eliminates managers’ opportunities to manipulate their privileged power and sometimes even causes the loss of their jobs. Business-to-Consumer (B2C)
B2C activities In general, B2C has not succeeded in taking off in China, which is consistent with China’s general environment. B2C is concentrated in large cities and coastal provinces where we see better IT infrastructure and a larger number of Internet users. The poor delivery system and lack of a general credibility monitoring system, plus a poor payment system, have resulted in serious barriers to B2C market expansion. In addition, publication of government laws is also lagging behind. CCID (2001b) concluded that the B2C market would require much nurturing by service providers and the government to succeed in the near future. TABLE 28 B2C Market in 2000 Total Transaction 390 million RMB (US$46.9M) % of payments conducted on-line 16.31% Total B2C Web sites 205 % of Internet users, who made on-line purchases 36.4% Source: CCID – 2000-2001 B2C Market Report.
28
Key B2C drivers and barriers
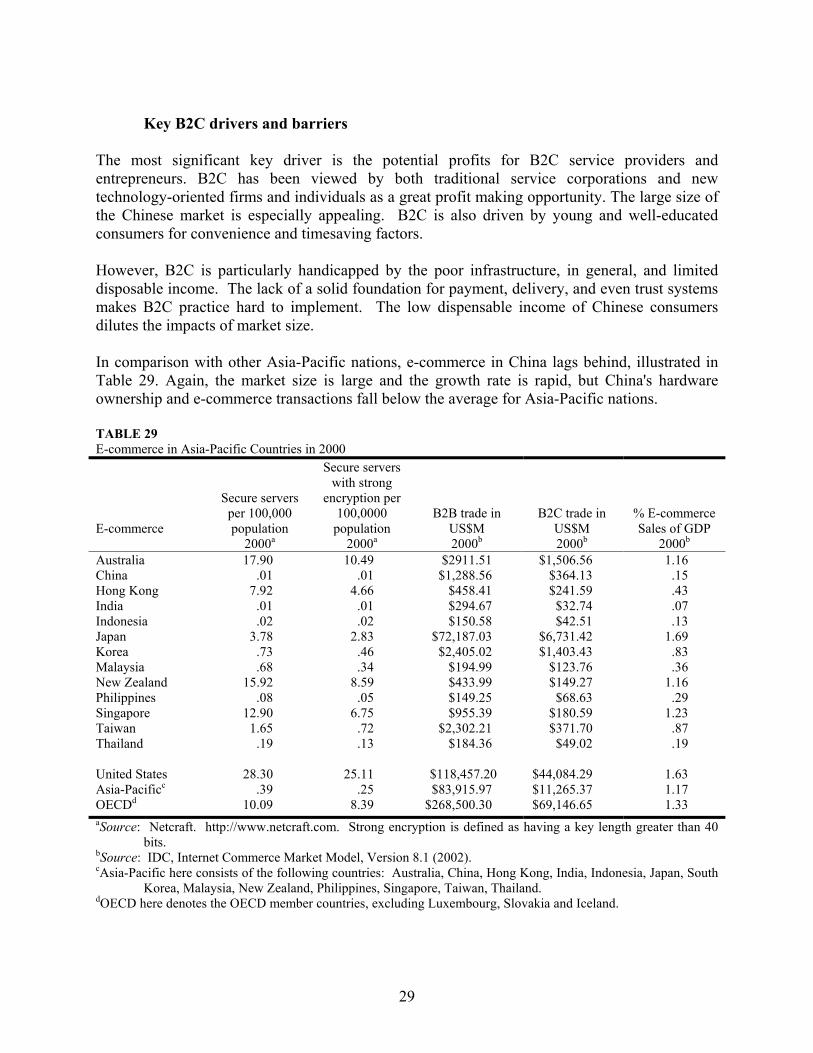
The most significant key driver is the potential profits for B2C service providers and entrepreneurs. B2C has been viewed by both traditional service corporations and new technology-oriented firms and individuals as a great profit making opportunity. The large size of the Chinese market is especially appealing. B2C is also driven by young and well-educated consumers for convenience and timesaving factors. However, B2C is particularly handicapped by the poor infrastructure, in general, and limited disposable income. The lack of a solid foundation for payment, delivery, and even trust systems makes B2C practice hard to implement. The low dispensable income of Chinese consumers dilutes the impacts of market size. In comparison with other Asia-Pacific nations, e-commerce in China lags behind, illustrated in Table 29. Again, the market size is large and the growth rate is rapid, but China's hardware ownership and e-commerce transactions fall below the average for Asia-Pacific nations. TABLE 29 E-commerce in Asia-Pacific Countries in 2000 E-commerce
Secure servers per 100,000 population
2000a
Secure servers with strong
encryption per 100,0000
population 2000a
B2B trade in US$M 2000b
B2C trade in US$M 2000b
% E-commerce Sales of GDP
2000b Australia 17.90 10.49 $2911.51 $1,506.56 1.16 China .01 .01 $1,288.56 $364.13 .15 Hong Kong 7.92 4.66 $458.41 $241.59 .43 India .01 .01 $294.67 $32.74 .07 Indonesia .02 .02 $150.58 $42.51 .13 Japan 3.78 2.83 $72,187.03 $6,731.42 1.69 Korea .73 .46 $2,405.02 $1,403.43 .83 Malaysia .68 .34 $194.99 $123.76 .36 New Zealand 15.92 8.59 $433.99 $149.27 1.16 Philippines .08 .05 $149.25 $68.63 .29 Singapore 12.90 6.75 $955.39 $180.59 1.23 Taiwan 1.65 .72 $2,302.21 $371.70 .87 Thailand .19 .13 $184.36 $49.02 .19 United States 28.30 25.11 $118,457.20 $44,084.29 1.63 Asia-Pacificc .39 .25 $83,915.97 $11,265.37 1.17 OECDd 10.09 8.39 $268,500.30 $69,146.65 1.33 aSource: Netcraft. http://www.netcraft.com. Strong encryption is defined as having a key length greater than 40
bits. bSource: IDC, Internet Commerce Market Model, Version 8.1 (2002). cAsia-Pacific here consists of the following countries: Australia, China, Hong Kong, India, Indonesia, Japan, South
Korea, Malaysia, New Zealand, Philippines, Singapore, Taiwan, Thailand. dOECD here denotes the OECD member countries, excluding Luxembourg, Slovakia and Iceland.
29
E-commerce with Chinese Characteristics Given diverse social, political, economic, and IT environments, E-commerce may take different forms of diffusion into a specific society. The following two examples provide some insights.
On-line department store for a local community The first example involves a typical living complex with several 30-floor apartment buildings in Beijing (Wang, 2001). The property management operates an e-store to serve its residents. Residents type in what they want to purchase from the e-store’s Web site (they have the option to call the operator to place the order) before 11 a.m. everyday. The goods are ready for residents to pick up at 3 p.m. The e-store staff buy and sort out the goods during the four-hour window between 11 a.m. and 3 p.m. The payment is deducted from the deposit put down by registered residents. Delivery by the e-store’s staff to residents’ homes is an optional service with extra charges. This e-store has proven to be a successful case that combines on-line service with off-line services and bypasses potential barriers such as credibility and payment method. However, it is less likely to be extended to a citywide or nationwide service.
On-line student admissions service for colleges Entering a college is still very competitive for a high school graduate in China. Every year, there is a national entrance exam in July. Universities then send their admissions people to every province’s center to select the right students and grant them admission, mostly based on students’ scores on the national entrance exam. There are two major concerns–corruption and expenditures. Corruption occurs when university admissions staff misuse their authority and admit students based, not on their scores, but on their connections. Expenditures involve the transportation, lodging and staff time for each university to send out teams to each province. E-commerce service has been implemented to address these two concerns. In recent years, all student profiles are brought on-line after the national entrance exam. Each university conducts its admissions remotely through the Internet. The process is more open and not many human transactions are involved. Each action is recorded for audit. In addition, expenditures are reduced. From this perspective, E-commerce serves as a tool to lower costs and fight corruption. However, its implementation is opposed by those whose power is thereby threatened. Political, Social and Economic Implications for E-commerce Diffusion E-commerce is still in its infancy in China. It is premature to measure its implications yet. However, some trends and potential have started to emerge. At the macroeconomic level, e-commerce diffusion would generate great demand for IT products including software and hardware. While a certain part of the demand would be captured by multinational corporations, China would utilize this growth in IT demand as an opportunity to nurture its indigenous manufacturing base. Certain indicators have pointed to the rapid growth of
30
China’s manufacturing capacity in PC production, telecommunications equipment, software, and consumer appliances (Tan, 2001; Kraemer & Dedrick, 2002). On the application side, China is hoping to upgrade its enterprises to world standards through e-commerce and other IT infrastructures since this upgrading will determine whether Chinese enterprises can survive in the global market after China’s WTO concessions. Meanwhile, e-commerce diffusion is also tied to political and economic reforms in China. As illustrated in the example of college student admission, e-commerce could certainly be deployed to fight corruption by publicizing the process and recording every transaction. At the same time, middle-level managers who have the power to grant special favor may simply block the diffusion of e-commerce for fear of losing their privileges. In addition, e-commerce could either strengthen or weaken the power of the central and local governments to monitor and control the society and individual citizens, depending on how it is deployed. This uncertainty makes e-commerce a dynamic and complicated process that is closely tied to the political, social, and economic environment in China.
31
REFERENCES CCID (2001a). Survey on B2B E-commerce in China. Beijing: CCID Consultant Corporation.
CCID (2001b). Survey on B2C E-commerce in China. Beijing: CCID Consultant Corporation.
China Statistics Bureau (2001). China Statistics 2001. Beijing: China Statistics Press.
Clark, T.H., & Sviokla, J.J. (1996). China Internet Corporation. Retrieved from Harvard Business School Case #9-396-299, Web site: http://www.China.com
CNNIC (2001). 2001 Annual Report of Internet in China. Retrieved from Web site: http://www.cnnic.net.cn/annual/ann2001.shtml
Deng, S. (2001). Research and analysis: Development and future trends of e-commerce in China. Commerce and Trade Economics, 11/20/2001.
Fan, Yongming (1992). FDI and China's Industrialization. Shanghai, China: Shanghai Social Science Academy Press [in Chinese].
Goodman, S.; Burkhart, G.; Foster, W.; Press, L., Tan, Z., & Woodard, J. (1998). The Global Diffusion of the Internet Project: An Initial Inductive Study. Fairfax, VA: The MOSAIC Group.
International Data Corporation (2002). Internet Commerce Market Model. Version 8.1.
International Data Corporation (2000). The 2000 IDC Worldwide Black Book.
International Labor Organization. LABORSTA, Table 3A. Retrieved at Web site: http://www.ilo.org/stat.
International Telecommunication Union (2002). World Telecommunication Development Report 2002, Reinventing Telecoms. Geneva: ITU.
International Telecommunication Union (2001). Yearbook of Statistics 1991-2000. Geneva: ITU.
Kraemer, K., & Dedrick, J. (2002). Enter the dragon: China’s computer industry. Computer, 35(2), 28-37
Lovelock, P., Petrazzini, B., & Clark, T. (1997). The golden projects: China’s national networking initiative. Information Infrastructure and Policy. 5(4), 265-277.
Mueller, M., & Tan, Z. (1997). China in the Information Age: Telecommunications and the Dilemmas of Reform. Washington, D.C./Westport in CT: The Center of Strategic and International Studies (CSIS)/Praeger Publishers.
Reed Electronics Research (2000). The Yearbook of World Electronics Data, 2000.
32
Tan, Z. (2001). Product cycle, wintelism, and cross-national production networks (CPN) for developing countries. Telecommunication Policy Research Conference (TPRC). Washington, D.C.
Tan, Z., & Clark, T. (2000). Internet diffusion in the USA and China. INFO, 2(6), 595-604.
Tan, Z., Foster, W., & Goodman, S. (1999). China's unique Internet infrastructure. Communications of the ACM, 42(6), 44-52.
Tan, Z. (1999). Regulating China's Internet: Convergence toward a coherent regulatory regime. Telecommunications Policy, 23(3/4), 261-276.
Tan, Z. & Lu, D. (1998). The state borderline in the cyberspace. In Bohlin E. and Levin, S. (Eds.), Telecommunications Transformation: Technology, Strategy, and Policy (pp. 281-296). Amsterdam, Berlin, Oxford, Tokyo, Washington D.C.: IOS Press.
Tan, Z., Mueller, M., & Will, F. (1997). China’s new Internet regulations: Two steps forward and one step back. Communications of the ACM, 40(12), 11-16.
United Nations Development Program (2001), Human Development Report 2000. New York & Oxford: Oxford University Press.
Wang, T. (2001). The 2001 blue book of e-commerce in China. Beijing: China Finance Press.
World Bank Group. WDI Data Query. Retrieved at Web site: http://www.worldbank.org/data/dataquery.html
World Bank (2001), World Development Indicators 2001 [CD-ROM].
Wu, Jichuan (2002), "Meeting the challenges of global informatization and networking", Speech at PTC 2002, Hawaii. Retrieved at Web site: http://www.mii.gov.cn/Mii/homepage.nsf/documentview/ 2002-01-17-22-EE4A2737D970A7D748256B45000248A9?OpenDocument
Zheng, Y., Pipe, R., Wu, G., & Fan X. (Eds., 1999). China e-commerce development and policy decision. Beijing: Chinese Finance and Economy Publish House.
33