Global adaptation index™ - mrcc.illinois.edu · Source: Hayhoe et al. Journal of Great Lakes...
35
ADAPTATION IMPLEMENTATION: RESEARCH TO IMPACT IN THREE SECTORS Resilient Chicago: Climate Planning for the Future 1
Transcript of Global adaptation index™ - mrcc.illinois.edu · Source: Hayhoe et al. Journal of Great Lakes...

ADAPTATION
IMPLEMENTATION: RESEARCH TO IMPACT IN
THREE SECTORS
Resilient
Chicago:
Climate Planning
for the Future
1

Research to Action: Themes
•Collateral Benefits
•Business Case
•Humanitarian Issue
2

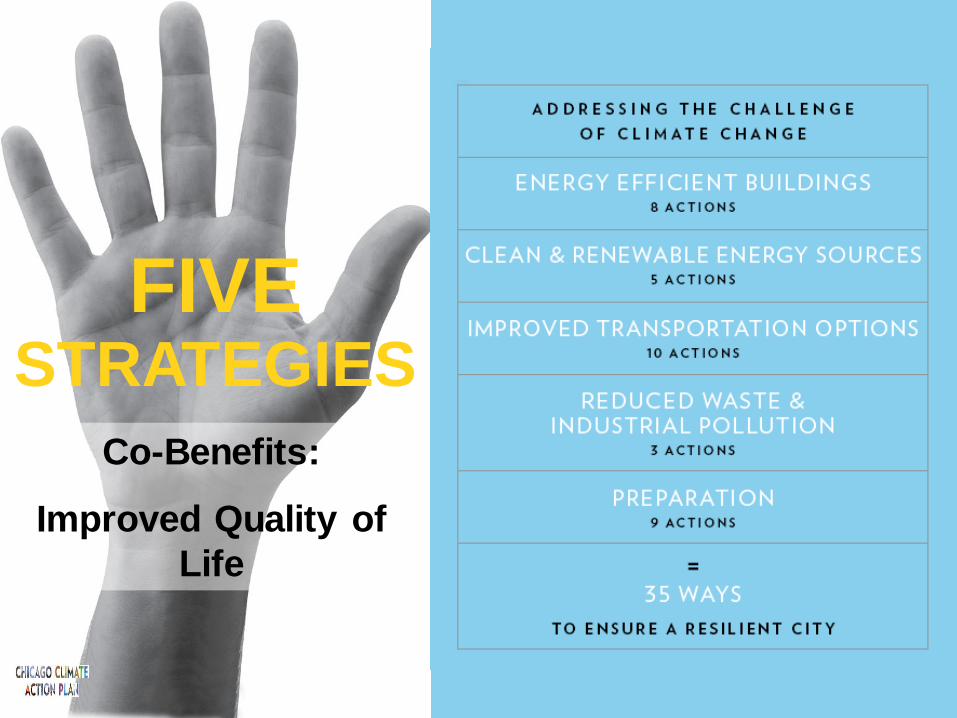
FIVE STRATEGIES
Co-Benefits:
Improved Quality of
Life
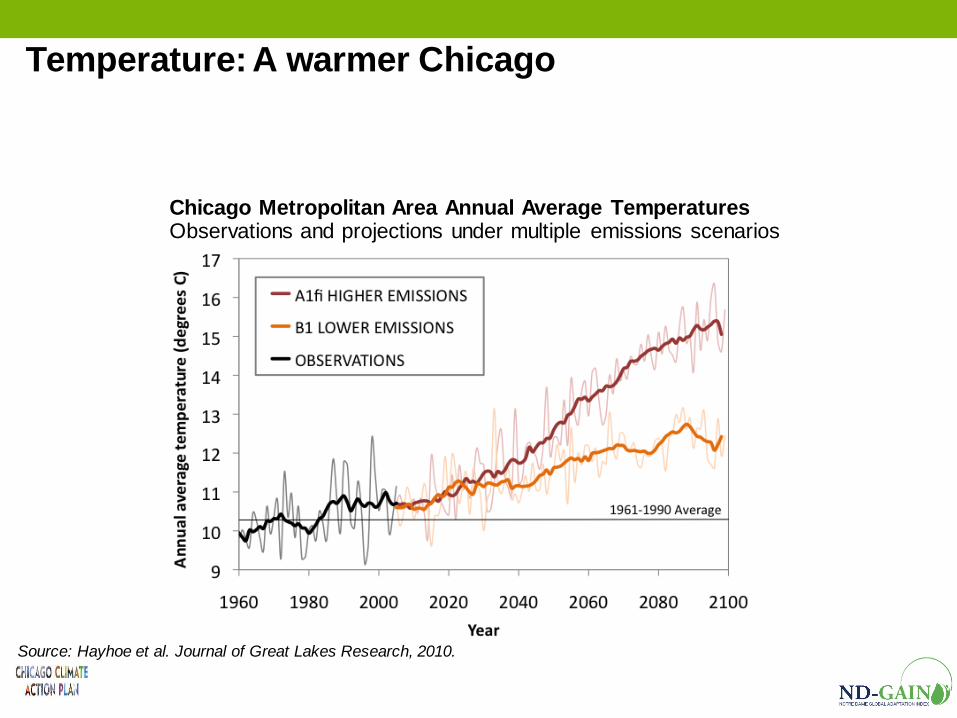
Source: Hayhoe et al. Journal of Great Lakes Research, 2010.
Temperature: A warmer Chicago
Chicago Metropolitan Area Annual Average Temperatures Observations and projections under multiple emissions scenarios

Higher Emissions:
Lower Emissions:
Projected
number of 100-
degree days
per year in
Chicago
31 days
8 days

Health: Increasing heat-related risks
Source: Hayhoe et al. Journal of Great Lakes Research, 2010
Chicago Metropolitan Area Heat-Related Deaths
Observations and projections under multiple emissions scenarios


Source: Hayhoe, U.S. Global Change Research Program , 2009
Impacts of Chicago’s Changing Climate
Midwest Seasonal Precipitation Events
Projected under high emissions
2010-2039 2040-2069
2040-2069
% changes relative to a 1961-1990 average
2070-2099

Copyright 2010, City of Chicago
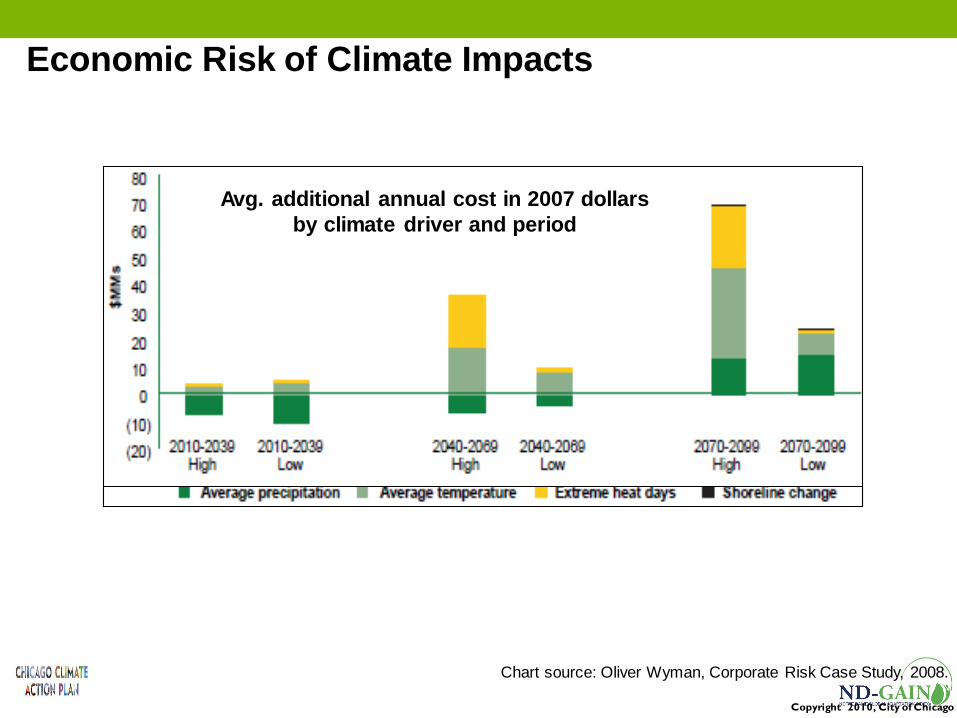
Economic Risk of Climate Impacts
Chart source: Oliver Wyman, Corporate Risk Case Study, 2008.
Avg. additional annual cost in 2007 dollars
by climate driver and period

Mitigation-Adaptation Overlap

Adaptation Resources
www.chicagoclimateaction.org
Copyright 2010, City of Chicago
Projections and
potential impacts
Adaptation quick
guide
Corporate risk
analysis

14

Business is Struggling to Address Corporate Responsibility Issues
28%
13% 15%
25% 21% 20% 18%
26% 23% 23% 22%
30% 27%
42% 42%
49%
58%
87%
90% 87%
94%
89% 87%
84%
91%
87% 86% 84%
84%
79%
90% 87%
85%
83%
Global France Germany Indonesia Canada Belgium UK Brazil Italy US Netherlands Singapore Japan Malaysia China UAE India
What Business Should Do
Current Performance

But there is a Shift in Trust-Building From Operational to Societal
16 TRUST BUILDING ATTRIBUTES SOCIETAL
OPERATIONAL
1 Listens to customer needs and feedback
8 Communicates frequently and honestly
7 Has transparent and open business
6 Has ethical business practices
5 Takes actions to address issue or crisis
4 Places customers ahead of profits
3 Treats employees w ell
2 High quality products or services
9 Works to protect/ improve environment
16 Partners w ith third parties
15 Ranks on a global list
14 Delivers consistent f inancial returns
13 Highly regarded, top leadership
12 Innovator of new products
11 Positively impacts the local community
10 Addresses society's needs
SOCIETAL attributes more important
to building future trust
CURRENT TRUST
driven by operational attributes

17
The World Economic Forum
The World Economic Forum

18
More than 70% of corporate
respondents saw risks to their supply
and value chains from climate
disruption
Cdp.net/supplychain
Carbon Disclosure Project

Millennials’ Expectations
19
• 88% believe the for-profit
sector should address social and
environmental issues Source: 8095 survey
• Almost 90% would
choose an employer with
corporate responsibility values
that echo their own and 90%
would consider leaving if a firm’s
corporate responsibility values no
longer matched their
expectations. Source: 2010 Net Impact

Environmental Cost Impact of Supply Chains
On average, US firms
saw supply chain
accounting for 60% of
environmental costs
20
Source: GreenBiz “State of Green Business Report 2013”
Food and Beverage Sector: 92% of
environmental costs in supply chain

CORPORATE RESPONSIBILITY A BUSINESS STRATEGY
Source: MIT Sloan Management Review
2013 “The Innovation Bottom Line”
90% companies note
that sustainability is a
part of business
strategy
• 61%: sustainability
measures added to
company’s profit when
on the agenda of top
management
21
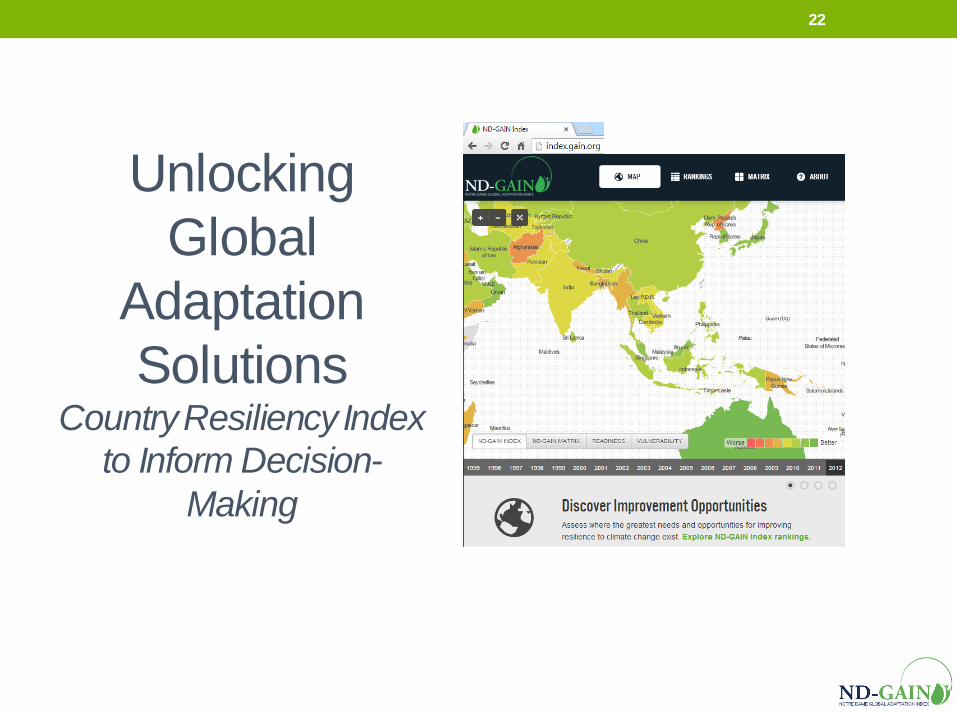
Unlocking
Global
Adaptation
Solutions Country Resiliency Index
to Inform Decision-
Making
22

23
Country
Rankings
2012
ND-GAIN Country Rankings
ND-GAIN Country Rankings

24
ND-GAIN Users
ND-GAIN Users

Food
25
Energy
Infrastructure
Coastal
Infrastructure
Health
Ecosystems
Precipitation change
Freshwater withdrawal
Access to improved water supply
Water
ND-GAIN Vulnerability Sectors and Indicators

26
ND-GAIN Vulnerability Sectors and Indicators
Crop yield change
Food import dependency
Agriculture capacity, including
irrigation and fertilizer
Food
ND-GAIN Vulnerability Sectors and Indicators
Water
Energy
Infrastructure
Coastal
Infrastructure
Health
Ecosystems

27
ND-GAIN Vulnerability Sectors and Indicators
Climate-change-induced disability
adjusted life years
External health resource
dependency
Health workers per capita
Health
ND-GAIN Vulnerability Sectors and Indicators
Water
Energy
Infrastructure
Coastal
Infrastructure Food
Ecosystems

28
ND-GAIN Vulnerability Sectors and Indicators
Land area less than 10m above
sea level
Population living less than 10m
above sea level
Coastal
Infrastructure
ND-GAIN Vulnerability Sectors and Indicators
Water
Energy
Infrastructure
Food
Health
Ecosystems

29
Water
Food
Health
Ecosystems
Coastal
Energy
Transportation
ND-GAIN Vulnerability Sectors

30
LIC/OECD Resiliency
LIC OECD Resiliency

0
0.1
0.2
0.3
0.4
0.5
0.6
0.7
0.8
0.9
1
1995 1997 1999 2001 2003 2005 2007 2009 2011
31
Australia
China
India
Japan
South Korea
Russia
United States
Laos
Cambodia
Myanmar
Vietnam
Philippines
Indonesia
Thailand
Singapore
Malaysia
Re
sili
ency
1995-2012
ASEAN+ Resiliency
Adaptive Capacity Over Time

32
Myanmar
Cambodia
Laos
Vietnam Philippines
Indonesia
Singapore
Malaysia
Thailand
The ND-GAIN
Matrix
Vuln
era
bili
ty
Readiness 0 .1 .2 .3 .4 .5 .6 .7 .8
.2
.3
.4
.5
.6
.1
Greatest
Challenges and
Urgency to
Act
Great
Challenges, but
Adopting
Solutions
Few Present
Challenges, Time to Get
Ready
Well-
Positioned with Few
Challenges
LOW HIGH READINESS
LO
W
HIG
H
VU
LN
ER
AB
ILIT
Y
ND-GAIN Matrix
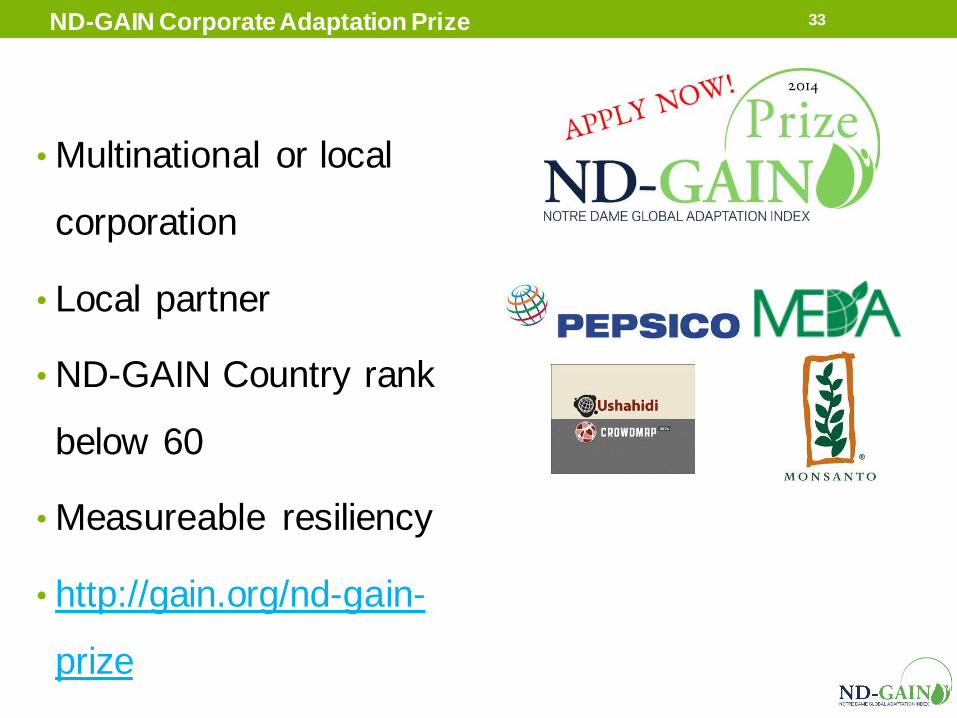
• Multinational or local
corporation
• Local partner
• ND-GAIN Country rank
below 60
• Measureable resiliency
• http://gain.org/nd-gain-
prize
33
ND-GAIN Corporate Adaptation Award
ND-GAIN Corporate Adaptation Prize

34
Regional Assessments
Sector Assessments
Urban Assessments
Collaborate with us: ND-GAIN Future Plans
Readiness * Vulnerability * Corporate Stakeholders • Joyce Coffee • Managing Director • Notre Dame Global Adaptation
Index • www.nd-gain.org • [email protected] • 1 (574) 807-9322
Collaborate with Us: ND-GAIN Future Plans

Joyce Coffee
Managing Director
Notre Dame Global Adaptation Index
www.nd-gain.org
1 (574) 807-9322
35
Thank You