Glass Reinforced Plastic Structural · PDF fileDynamic Response of S-2 Glass Reinforced...
118
AD-A273 868 111tIIItl/l/llll l1111111l1! 11l 11 Ill 1111lll ARMY RESEARCH LABORATORY Dynamic Response of S-2 Glass Reinforced Plastic Structural Armor A Progress Report Edited By Shun-Chin Chou and Eugenio DeLuca ARL-SR-5 TIC December 1993 S ELECTE DEC 17 1993 A - *Original contains olor plates: All DTIC reproduot- ------ ions will be in blaoc and I ahiteo CA) 0 00 Approved for public release; distribution unlimited. 93 12 1.6 029
Transcript of Glass Reinforced Plastic Structural · PDF fileDynamic Response of S-2 Glass Reinforced...

AD-A273 868111tIIItl/l/llll l1111111l1! 11l 11 Ill 1111lll
ARMY RESEARCH LABORATORY
Dynamic Response of S-2 GlassReinforced Plastic Structural Armor
A Progress Report
Edited ByShun-Chin Chou and Eugenio DeLuca
ARL-SR-5 TIC December 1993
S ELECTEDEC 17 1993
A
- *Original contains olorplates: All DTIC reproduot-
------ ions will be in blaoc andI ahiteo
CA)0
00
Approved for public release; distribution unlimited.
93 12 1.6 029

BestAvailable
Copy

The findings in this report are not to be construed as an official Departmentof the Army position unless so designated by other authorized documents.
Citation of manufacturer's or trade names does not constitute an officialendorsement or approval of the use thereof.
Destroy this report when it is no longer needed. Do not return it to theoriginator.
REPORT DOCUMENTATION PAGE F No. 0704o0188
PuCisc r~ponevg titom (ow tenS co tion of wfn onfmo is Mestimted to aerage 1 how per response. rincium tne orne to rwos m instructons. sswctg etstmg *Ca swces.gahww"g arm mawtaiwtg me data netede. and atund revieimng te coaection o0 wilonmatn. Seand come1eWs reg"alg 11" bL n 51m. or any tiw aspect of thisC06000iCII of Infmaa, mCjngSgeeo For uI Vfgtis aurdelt to Wae ~lelol Headquateris Servtcee. Cufeciorate for Information Operatton. wtORew 1215 JeffersonlDave. Higha. Sat to04 "i~gln V 20-3.an Offic, of Managemalt and Budget. Paperworkt ReductIon Prqac~t (0704-01661. Washiriqlon. DC 20503
1. AGENCY USE ONLY (LeaVe dmnk) L REPORT DATE & REPORT TYPE AND DATES COWARD
December 1993 Progress Report
4. TTI.E AND SUBTITLE L FUNDING NUMBERS
Dynamic Response of S-2 Glass Reinforced PlasticStructural Armor
A Progress ReportS. AUTHOR(S)
Edited by Shun-Chin Chou and Eugenio DeLuca
7.PERFORMING ORGANIZATION NAME(S) AND ADOAESS(S) S.PERFORMING ORGANIZATION
U.S. Army Research Laboratory REPORT NUMBER
Watertown, Massachusetts 02172-0001
ATTN: AMSRL-MA-PD ARL-SR-5
I. SPONSORINGdMONITOPrNG AGENCY NAME(S) AND ADDRESS(ES) 10. SPONSORINGdNONITORING
U.S. Army Research Laboratory AGENCY REPORT NUMBER
2800 Powder Mill Road
Adeiphi, MD 207R3-]197
11. SUPPLEMENTARY NOTES
12a. DISTRIBUTION/AVAILAbILITY STATEMENT 12b. DISTRIBUTION CODE
Approved for public release; distribution unlimited.
13& ABSTRACT (UAfaxinlm 200 words)
This is a progress report on work conducted in FY93 to define the dynamicresponse of S-2 glass reinforced plastic laminate under ballistic loading.The work is divided into three parts, a description of ballistic impactdamage in monolithic laminates produced by fragment simulators and mea-
surement of target residual compressive strength, determination of mate-rial dynamic properties, and measurement and analysis of stress levels inglass reinforced plastic laminates under ballistic impact. Enlargement
and extension of the data base constructed herein is planned for FY94.The overall objectives of this effort are to provide design guidelinesfor application of S-2 glass reinforced plastic in vehicular structuresand to define the dynamic behavior of this material for general applica-tions in armor technology.
14. SUBJECT TERMS IS. NUMBER OF PAGES
Composite material, Dynamic properties, Ballistics, 120Modeling, Simulation, Delamination i6. PRICE CODE
17. SECURITY CLASSIFICATION 1., SECURITY CLASSIMICATION 1. SECURITY CLASSIFICATION 20. LIMITATION OF ABSTRACT
OF REPORT OF THIS PAGE OF ABSTRACT
Unclassified Unclassified Unclassified UL
NSN 7540-01-280-5500 Standard Form 298 (Rev 2-89)
Pr, bod bV ANSI Sid Z39- 1829ge-102

CONTENTS
PAGE
1. INTRODUCTION AND SCOPE ................................................................................. 1
2. BALLISTIC IMPACT DAMAGE EVALUATION ........................................................ 3
J. Prifti, E. DeLuca, and W. Bethoney
a. Ballistic Im pact Experim ents ..................................................................... 3b. Computed Tomography Analysis of Delamination ............................... 5c. Compressive Strength After Ballistic Impact ..................................... 28d. Rear Surface Transient Displacement ........................... 32e. Sum m ary of Results ................................................................................ 37
3. DYNAMIC CHARACTERIZATION ......................................................................... 39
D. P. Dandekar, J. L. Green, and P. Beaulieu
a. Background ............................................................................................ 39b. Elastic Constants ...... .............................. 41c. Quasi-Static and Medium Strain Rate Tensile and Compressive
Properties .......................................... 49d. High Strain Rate Compression in the Thickness Direction ................. 58e. Sum m ary .................................................................................................. 60f. Future W ork ............................................................................................. 61
4. STRESS WAVE EXPERIMENT AND ANALYSIS UNDER BALLISTICCO NDITIO NS ......................................................................................................... 63
A. Rajendran, D. Kokidko, and B. Durant
a. Background ............................................................................................. 63b. Test M ethod ............................................................................................. 63c. Instrumention and Data Acquisition ...................................................... 64d. Test Results .................................................................................................. 64 ore. Prelim inary Analysis .................................................................................... o65
5. SUMMARY OF RESULTS AND FUTURE WORK ................................................... 75 ' A
6. A PPEN D IX .................................................................................................................. 79
Dist-K-Av.iJibhy Jrd/Os
111-r c a

1. INTRODUCTION AND SCOPE
Since the development of nylon fiber in the 1930's and the inception offlak vests during World War II, the technical community has endeavored toextend the use of high strength, light weight fibers in protective armor.The first use of glass fiber-reinforced plastic (GRP) for armor applicationsoccurred with development of Doron, a laminate of fiberglass and polyesterresin, which was employed by the U.S. Marines in their fragmentation vestduring the Korean conflict. During the 1960's Goodyear Aerospace in concertwith Army engineers discovered that ceramics backed by glass-reinforcedplastic results in a weight efficient armor system for stopping armorpiercing bullets. More extensive use of fibers and reinforced plastics asarmor components occurred with development of the high tenacity fiber Kevlarby Dupont. This led to development of a Kevlar based fragmentation vest andhelmet under the PASGT (Personnel Armor Systems for Ground Troops) programconducted by NRDEC and ARL. The utilization of Kevlar was extended to spallliners within the M113 APC and Bradley Fighting Vehicles; most recently S2glass-reinforced plastics have been accepted for liner applications.
It is most important to note that all fiber and fiber-reinforced plasticarmor applications to date have been non load-bearing items or components.With the consideration of glass-reinforced plastic composites for combatvehicle hulls it is imperative that the structural integrity and dynamicresponse of these composites during and following ballistic impact bedetermined. The GRP composite systems investigated in this report consist ofmultiple layers of S2 glass fabric impregnated with Cycom 4102 polyesterresin (32% by weight). This GRP laminate system has been employed by ARL/MDfor fabrication of the composite hull of Bradley type and a 55 ton prototypecomposite hull vehicle. This fiber-resin composite system was found topossess the optimal combination of strength and ballistic performance of aglass fiber system. The strength is dependent on the mechanical propertiesof the S2 glass fiber and strong bonding to the resin, while the ballisticperformance favors a relatively weak bond between the glass fiber and theresin. A weak bond allows the fibers to break away from the resin allowingsubsequent extension of the fibers thereby utilizing the fibers high tensileand elongation properties. Therefore for GRP structural armor there isalways a trade-off between structural strength and ballistic performance.
To date only limited data has been generated to describe the dynamicresponse, damage, and residual strength of thick GRP laminates due toballistic loading. This investigation is a first attempt to provide fullunderstanding of the dynamic response of GRP laminates subjected toprojectile (fragment) impact and to measure damage and residual compressivestrength of laminates after ballistic impact. The report is divided intothree chapters that deal, in-turn, with evaluation of ballistic impactdamage, material dynamic properties, and combined experimental/computationalanalysis of stress wave profiles generated by ballistic impact.

The objectives of the first chapter are to describe and quantifyballistic impact damage experienced by S-2 glass-reinforced plastic laminatepanels, to measure laminate strength after ballistic impact, and to explorecorrelation of residual strength with ballistic impact and/or damageparameters. The following chapter describes experiments and procedures todetermine certain mechanical properties of the GRP material that include afull set of elastic constants, quasi-static and medium strain rate tensileand compressive properties, and through-thickness, compressive stress-straindata at high strain rate. These properties are required not only forcomplete characterization of the material but, more important, as input toanalytical and computational methods for modeling the dynamic response andbehavior of GRP. The final chapter describes a combined experimental andcomputational approach for predicting stress profiles in thick GRP laminatezresulting from fragment ballistic impact. The primary objective of thischapter is to use experimentally measured stress profiles in the GRP laminateto calibrate and verify mathematical simulations of shock/stress transmissionthrough the laminate; this is an important step towards development of anaccurate methodology for prediction of GRP response under ballistic impact.
The laminates used throughout this work are identical in composition andconstruction to S-2 glass fabric-reinforced plastic material used in theprototype combat hulls designed and built by FMC for ARL. The GRP laminateswere made up of S-2 glass woven roving in a polyester resin matrix withresin content 32 + 2% by weight; laminates satisfied MIL-L-46197. Glassfabric was provided by Owens Corning in a 5 X 5 balanced construction withweight 24 oz/yd2 + 3% (814 g/m2 ± 3%); resin coating of the fabric wasperformed by American Cyanamide using Cycom 4102 polyester resin. The finallaminates were manufactured according to the processing schedule of MIL-L-46197.
This progress report summarizes work conducted by the ARL MaterialsDirectorate in FY93. Enlargement and extension of the data base constructedin this work is planned for FY94. The ultimate aim of the effort is first toprovide design guidelines for application of S-2 glass-reinforced plasticlaminates in ground combat vehicle structures and second to define dynamicbehavior and response of this material for general applications in armortechnology.
2

2. BALLISTIC IMPACT DAMAGE EVALUATION
Primary concerns for any armored structure must include the extent ofdamage and residual integrity of the structure following ballistic attack.Metal-based armored structures generally enjoy a large margin of structuralover design. This follows from the structurally generous cross-section ofmetal required to defeat the ballistic design threat and the fact thatballistic failure modes for metals are localized. Consequently, residualintegrity of metal-based armored structures is not a major issue. Glass-reinforced plastic laminates, on the other hand, demonstrate large ballisticdamage zones so that extent of damage and residual strength of glass-reinforced plastic based structures must necessarily be a design concern.
a. Ballistic Impact Experiments
The scope of this study was confined to characterization of ballisticimpact damage in monolithic laminates of S-2 glass fabric-reinforced plasticproduced by fragment-simulating projectiles. Ballistic damage resulting fromimpact by projectiles other than fragments and damage experienced by a GRPlaminate that is the rear or backup component for applique armor are subjectsfor future work. However, a preliminary experiment was conducted to examinedamage to a GRP laminate acting as backup comp ent in an applique typedesign; specifically a fragment impact test was co.iducted on a two-componentarmor system consisting of a titanium alloy (MIL-A-46077) frontal platebacked by the GRP laminate.
Each of the GRP laminate targets tested was subjected to a singlefragment impact. Test parameters for the monolithic laminate targetsincluded fragment mass, strike velocity, and laminate thickness. Tests wereconducted with fragment simulators of mass 207 grains (12.7 mm in caliber)and 830 grains (20 mm in caliber) at 00 oblique impact. Strike velocity wasvaried but, in all cases, kept below the limit velocity of the test laminateto produce only partial penetration of the target. Except in the case of thetitanium-faced GRP laminate target and a monolithic GRP laminate of thickness2.95", a minimum of two replicate tests were conducted for each strikevelocity.
Fragments were launched using rifled barrels of 8' length with twist1/15 for the 12.7 mm barrel and 1/24 for the 20 mm barrel. Fragment velocityand yaw measurements were made from orthogonal radiographs taken 44" from thetarget face. A drag correction was applied to the measured velocity toobtain the strike velocity. Projectile yaw did not exceed 1.50 for any testshot.
The GRP laminate targets were supported by a rigid, vertical steel framewith an 18"-diameter circular opening. The target was centered on thecircular opening and held to the frame by clamps located at each of the fourcorners of the target. A .020"-thick 2024-T6 aluminum alloy sheet 18" X 18"in size was sandwiched between the rear face of the GRP laminate and thefront face of the target holder to measure the maximum transientdisplacement of the laminate rear surface.
3

Table 2.1 summarizes the individual test shots conducted in this work.Since test laminates received but a single shot, test panels are identifiedby the shot identification or T number.
Table 2.1 Summary of Ballistic Tests
Panel No. S-2 GRP Laminate Panel Fragment Mass Strike VelocitySize Ply Count (grains) (ft/sec)(in)
T44-93-1 20x20xl.73 69 207 1912
T44-93-2 20x20xl.73 69 207 2025
T44-93-3 20x20xl.73 69 207 3022
T44-93-4 20x20xl.73 69 207 2946
T44-93-5 20x20xl.73 69 207 3938
T44-93-6 20x20xl.73 69 207 3958
T 7-93-1 20x20xl.64 63 830 1522
T 7-93-2 20x20xl.63 63 830 1581
T28-93-1 20x20xl.71 67 830 1256
T28-93-2 20x20xl.73 67 830 1180
T28-93-3 20x20xl.68 67 830 1257
T26-93-1 20x20xl.73 67 830 1729
T26-93-2 20x20xl.68 67 830 1865
T26-93-3 20x20xl.68 67 830 1753
T27-93-1 20x20xl.70 67 830 2459
T27-93-2 20x20xl.69 67 830 2559
T27-93-3 20x20xl.68 67 830 2450
T45-93-1* 20x20xl.72 69 830 4100
T45-93-2 23x23x2.95 118 830 4109
*Frontal titanium plate 14" X 14" X .83" clamped to GRP laminate

Following ballistic test, the GRP laminates were shipped to Ogden AirLogistics Center at Hill AFB, Utah where computed tomography (CT) wasconducted to measure internal delamination. Panels were then returned toMaterials Directorate for measurement of compressive strength. These resultsare described in the following sections.
b. Computed Tomography Analysis Of Delamination
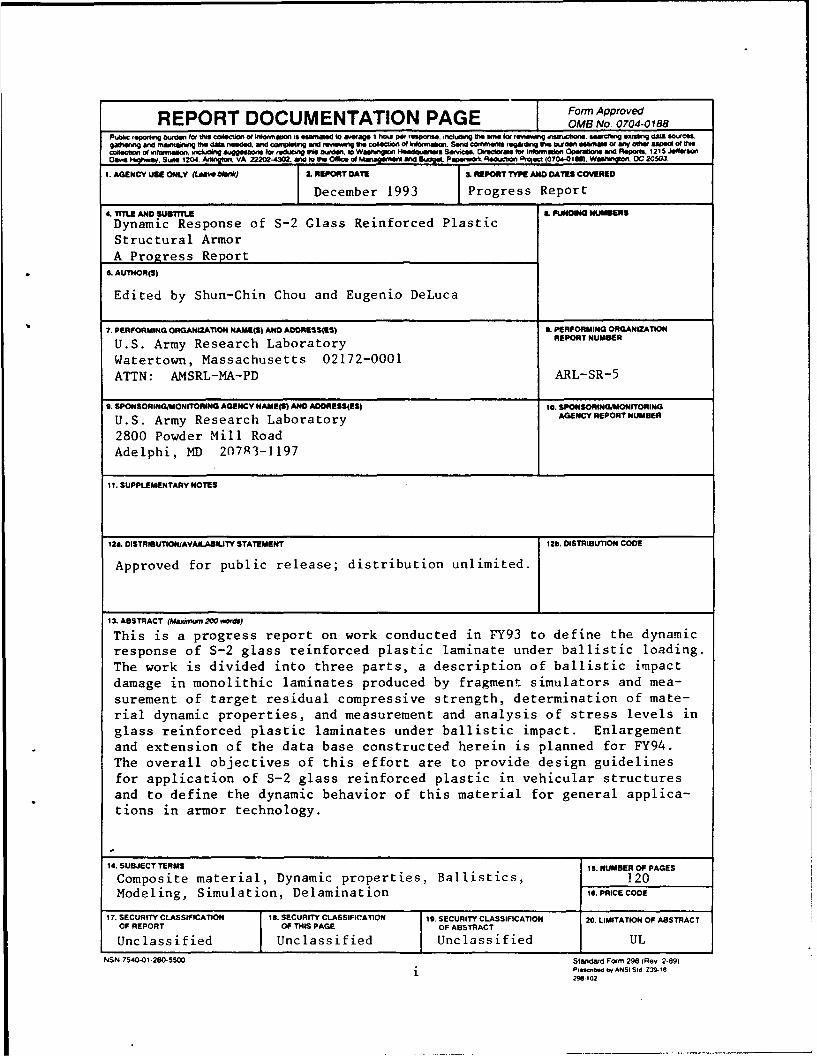
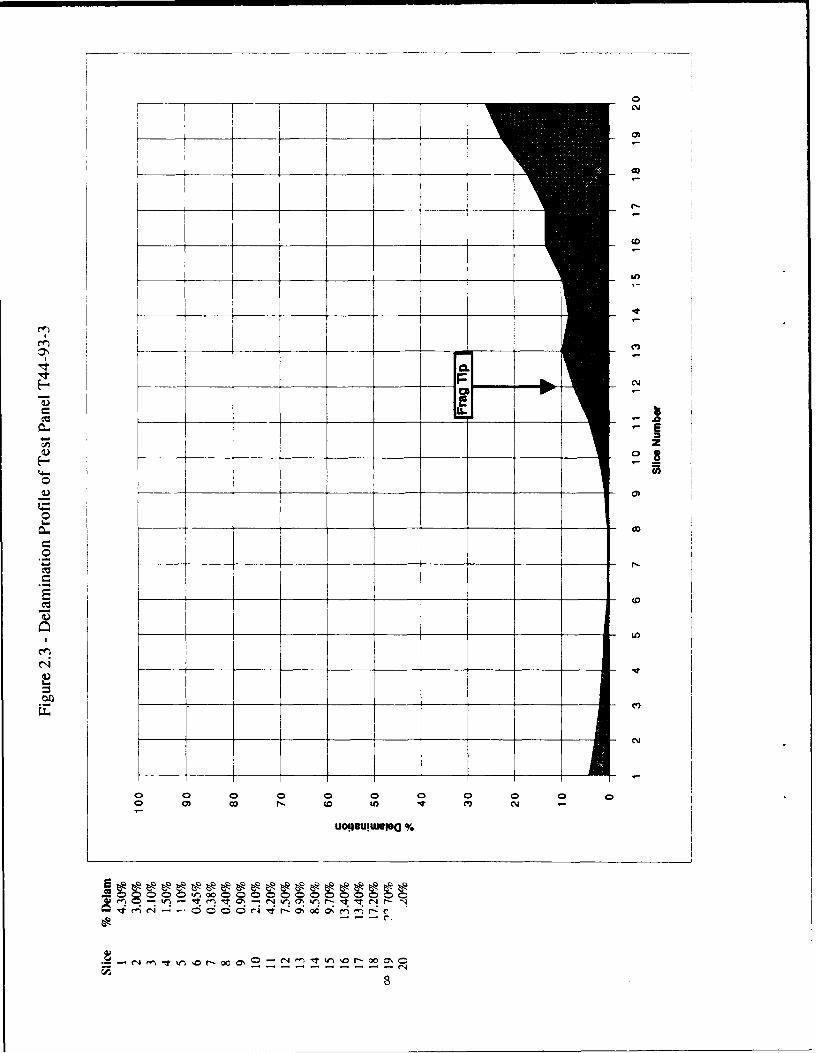
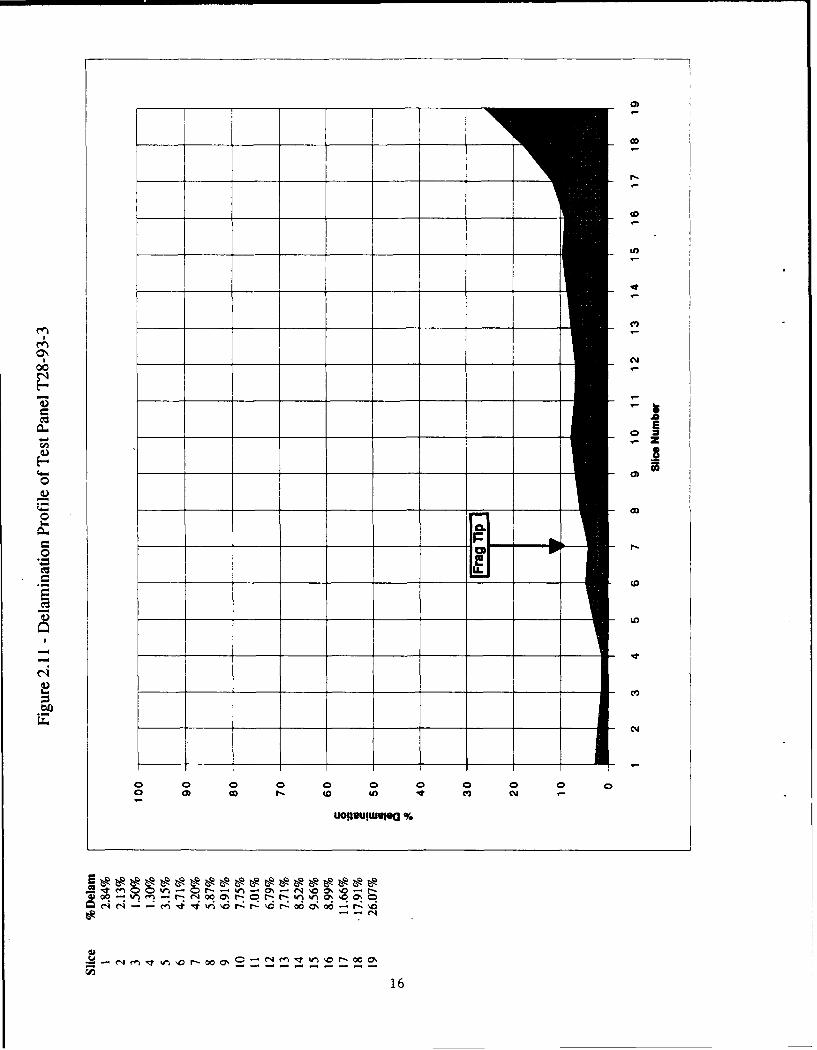
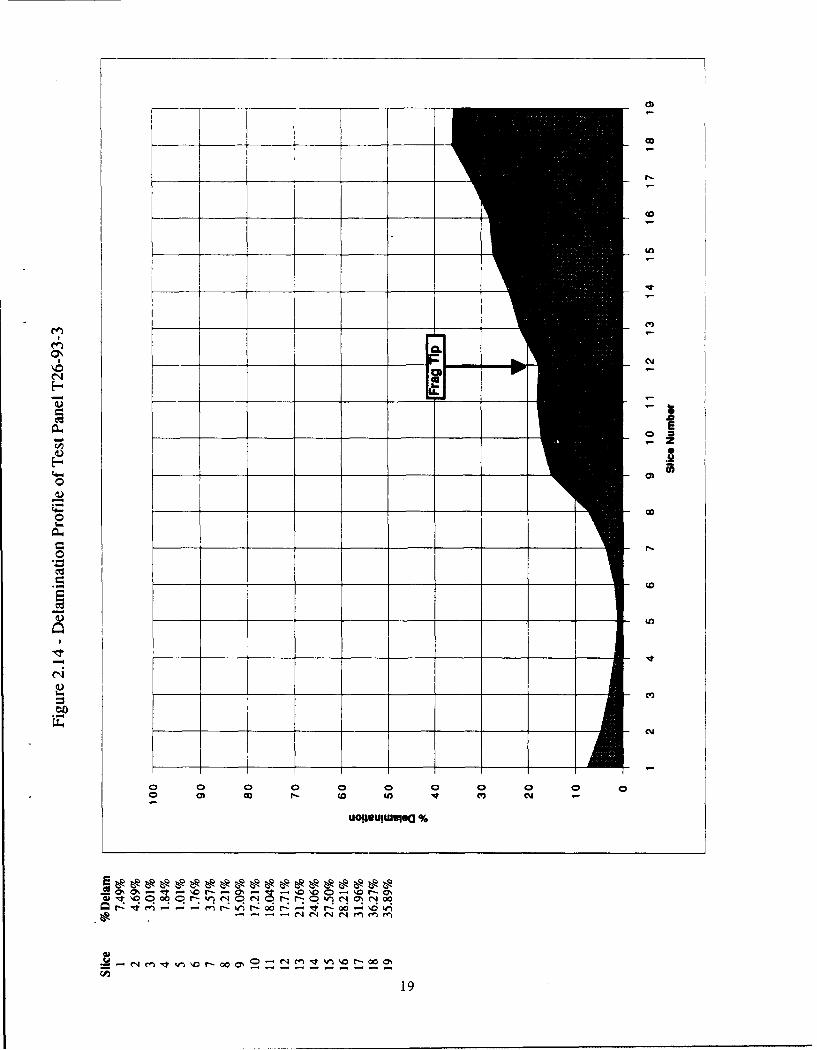
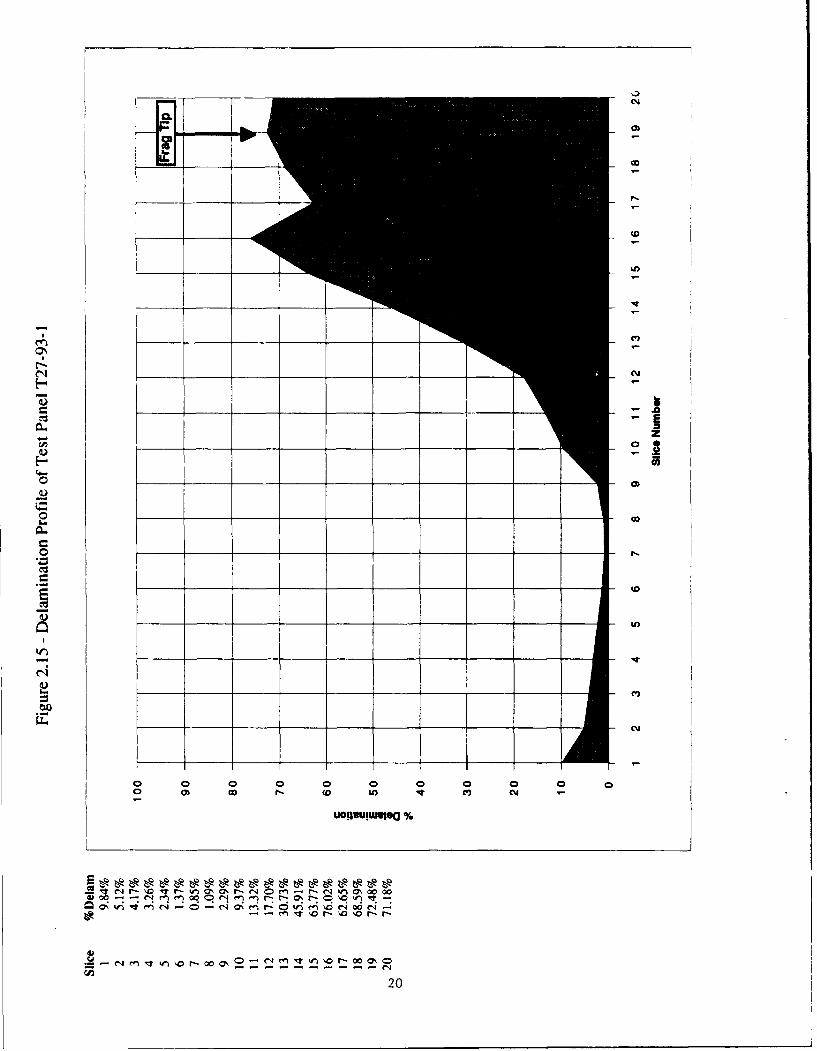
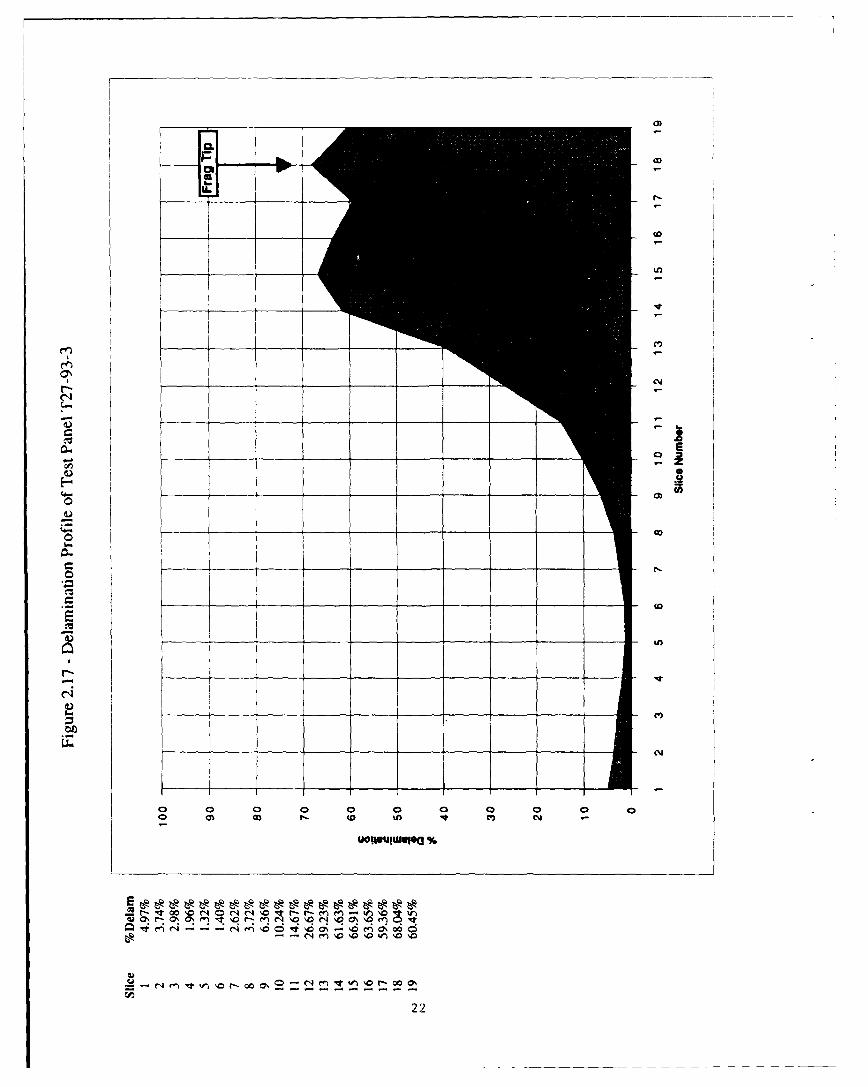
Computed tomography (CT) inspection was used to locate and quantifyinternal delamination resulting from ballistic impact for each GRP laminateidentified in Table 2.1. Scans of the panel cross-sectional area normal tothe thickness axis were taken at planes along the thickness direction. Scanswere taken with a 2.0 mm slice thickness uniformly spaced 2.0 mm along theentire panel thickness; a total of nineteen or twenty scans was used for eachpanel. Since the CT image obtained for each scan is a representation of x-ray attenuation in the slice plane and, in this case, since the attenuationis due almost entirely to density, the CT image is a density map of the sliceplane. The area in the CT image identified as low density is attributed hereto delamination in the slice plane. Delaminated area displayed symmetryabout the impact point and, to a first approximation, can be considered ascircular. Percent delamination for each slice was obtained by simplydividing the delaminated area identified in the slice plane by the panelarea. Details of CT inspection including system and scan parameters andimagery analysis is contained in Appendix A.
Results of the CT inspection for each GRP laminate are contained inFigures 2.1 through 2.19. Percent delamination for each 2.0 mm slice isshown as a function of slice location from the impact face; slice location istaken to be at the midplane of the 2.0 mm slice. The extent of delaminationin slices along the thickness direction for each GRP laminate penetrated bya fragment simulator displays the same general pattern, namely a fall to aminimum value followed by a rise to a maximum value at the rear face of thelaminate. For the titanium-faced target, extent of delamination of the GRPlaminate rises almost monotonically from a minimum value at the front face ofthe GRP laminate to a maximum value at its rear face. Delamination profilesthrough the thickness direction show good reproducibility for replicateexperiments. In instances wherein the fragment simulator was imbedded in theGRP laminate, the scan or slice containing the front face of the projectileis identified in Figures 2.1 through 2.19.
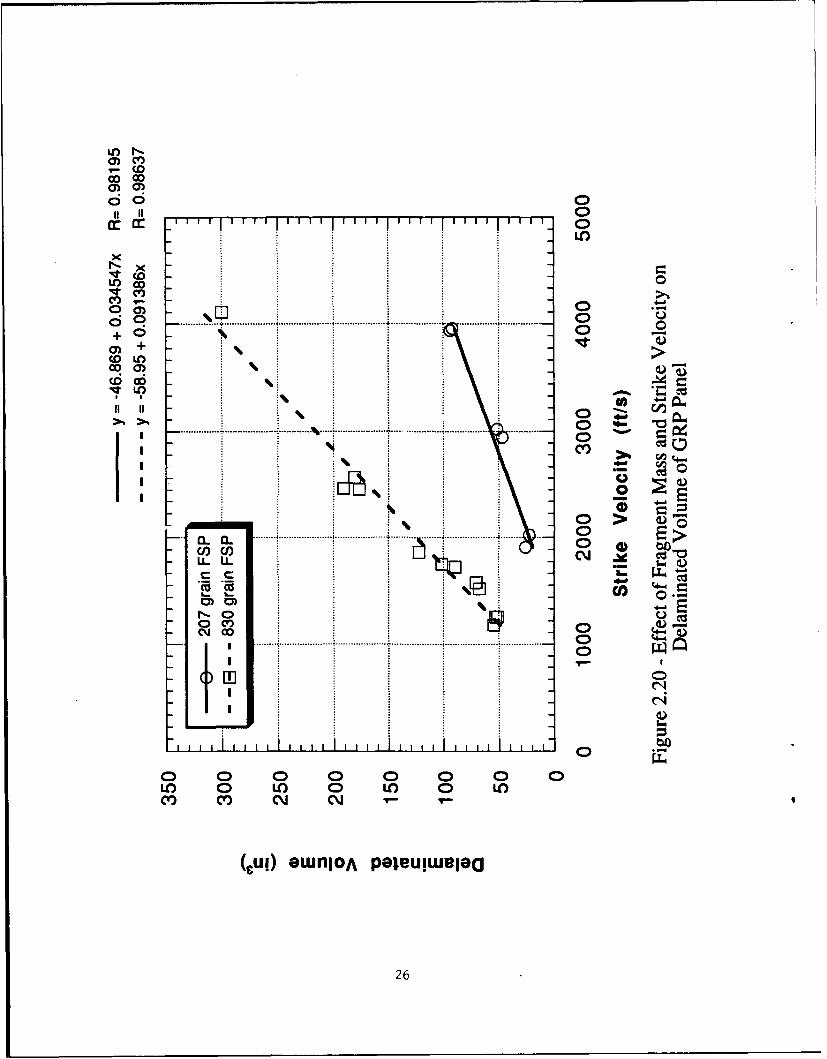
Table 2.2 tabulates depth of fragment penetration, percent delaminationaveraged over all slices, and delaminated volume for each GRP laminate; theseresults are taken from Figures 2.1 through 2.19. Delaminated volume issimply the product of panel total volume and average fraction delamination.Depth of penetration was obtained using the expressiondop (mm) = (i/2)(t-2n) + 2m + 1 where t is the panel thickness in mm, n isthe total number of slices taken on the panel (19 or 20), and m is the slicenumber, counting from the impact face, that contains the tip of the fragment.Delaminated volume for all test panels except T45-93-1 is shown in Figure2.20 as a function of fragment mass and strike velocity. Clearly, each graphof Figure 2.20 applies only up to the limit velocity of the GRP laminate.Fragment depth of penetration in GRP laminate is plotted versus strikevelocity for the 207 grain and 830 grain fragments in Figure 2.21.
5

t 0)
____ ____ ___ ___ __ _ __ _ __ _ _ __ _ __
0 0 0 0 0 0-
+1 t 't- o -w0CA_

I C.
- I - I _ __ _ _ _ _ __ P
I - t cE
I I zI I jCM
Goo f . l-oele %
6- o 0)wW0o k 7 or ý 4 , -C or
P CY
V I _ __ __ _ ILa_ _ _ _ _ _ I L
Ita
__ __ _ _ __ _ _ __ l
U0p-umo
000 08 CU~r- p--- I
0f 1 )r tr-0 N mr

0I
1.n
I IIt
IA.q
CD r- zOC-Hoelwlc [
ooe nr n 00 C 1
ci_ _-
eq m_ _ _r wa .2cn
C9

__ _ 0U
CLN
_P CD_ _ _ _ _ _U
Cu
0
1to
CCu
Cu~
oq C7 00 ý 0 0ot 0 0n 0 0 0 N q
W=O r- Mt ~ n -- 0 l 0~r- wr r
10

_____ 0CLN
_________ ___ .
____ ___ _ _ ___ ___ ___ _ O
0 C
Go P, t _ )_
Uoe~eo
m0tc c nr brc n-:r:"-o no I"
o6i;c0--iI n o - c4ý nr

CuD
__ _ __ _ __OD~
to
Lo
0c
4)~
OD LO r) C0
0ouwo
I- - - - w 6C ý66C4eicir: v
N t
412

C2
o 0Hz
00
CLD
a CD
co~
o ) D 0 ý 0 o 0 v 0 V0 04 0
uoqewfuiepc %
C4 en t00 0%, C7 l' ý oq c qtcl '
13

____I
C.,
-" U3_ 0 0
I--o) ODc wm c
Cu1
14

Cll
00o
U U)
H U.)
o 0) O - 0 U . 0
IC C4
cdn
0qm, ný -wa
U1
1 OD
__ I I --
Cu~
co 0 n cS_ _ _ _ _ _ _ _ ci%
0 wo-nn 0 -o - tw0'o .0 ici c;4r:r dr-o Uo -ý
Cu U.
fn V- ýo r a,0
E1
coJ
-E* z
0ý __ _ _ _ _ _ _
w 0n 0n 0n 00 0q 0n 0n 0Q" - -t 0 0ooi C-; Ci w, C.) CJ fq ;- Z r 6\
17

CA C
'-i
*n 0o0-00
01
_____ _ ___ eD
U CLP.
ý,EN_0
-C
119
CNN
ICA
0 0
E-
44. oC _ _
- - --U
o _20

0
_____ _____CY
* r-
0001Ccm__ _ _ _
H2
all
04
oc
4.))
0M
0 c f.- V v
K-Ouwe
r- wbF0 Nc c r -c -
r. __) C4_ C __ ____ - - - (
Ei
22,

_____ ____ ____
I It
H F__ __ _ __ .)
"Mmmm I tzk
_n It 08\ - O
02

CL.
ONN
ra
vi CIn- ot - n"------M n O DM 0"q
C-4 eqC nC nin. n )
0nOf ý ) wC
N mm24%

Table 2.2 Damage Data For GRP Laminates
Panel' Fragment Strike Depth of Average DelaminatedPanel No. Thickness Mass Velocity Penetration Delamination Volume
(in) (grains) (ft/sec) (mm) (%) (in 3 )
T44-93-1 1.73 207 1912 8.6 3.76 26.02
T44-93-2 1.73 207 2025 8.6 3.29 22.77
T44-93-3 1.73 207 3022 24.6 7.45 51.55
T44-93-4 1.73 207 2946 26.6 6.81 47.13
T44-93-5 1.73 207 3938 36.6 13.63 94.32
T44-93-6 1.73 207 3958 38.6 13.29 91.97
T 7-93-1 1.64 830 1522 N/A 10.31 67.63
T 7-93-2 1.63 830 1581 16.3 10.85 70.74
T28-93-1 1.71 830 1256 14.6 7.79 53.28
T28-93-2 1.73 830 1180 14.6 7.94 54.94
T28-93-3 1.68 830 1257 15.6 7.61 51.14
T26-93-1 1.73 830 1729 20.6 12.89 89.20
T26-93-2 1.68 830 1865 19.6 18.19 122.24
T26-93-3 1.68 830 1753 25.6 16.01 107.59
T27-93-1 1.70 830 2459 38.6 28.10 191.08
T27-93-2 1.69 830 2559 34.6 26.83 181.37
T27-93-3 1.68 830 2450 37.6 26.31 176.80
T45-93-1 2 1.72 830 4100 N/A 26.44 181.91
T45-93-2 2.95 830 4109 53.5 23.47 366.26
1. All panels measure 20" X 20" in size except for T45-93-2 which measures 23" X 23".
2. Frontal titanium plate 14" X 14" X .83" clamped to GRP laminate.
25
CD C
1 1 - I I I I I I I f III I I
LO LO
00co LO
OD C) cuQ
. ......... ... ................. : ............. % ..................... ... ...... ...... ................. .. .......... .. oE ,
-0
- Cl (
- t LL L1
- l "D 0 MT
0 0 0 0 0 0 0 0LO 0 L.O 0 LO 0 LOCV) 0) C\j Cj -
(cu!) owenlOA peeuluweiea
26

(D C14oco
d c;
'r- ccS00 0'' ' ' 1 ' ' ' ' ' ' ' '
oco In0I I
Q0 m
+~ +......................•..................... ........................ ..................... .•
cv,S..... .......... i .............. . ........................ '. ...... ........ ........................ ................... : C "
co \
S...~~~~............ •..........................• ........................ •........................ .- .... .........
0 -
0 0) 0 0 0 0 0)
cm cvC'
I I ) I -1" I) I I I I
(ww) Uo!leJIGUed 0o qildeo
27

c. Compressive Strength After Ballistic Impact
The compression test was chosen to measure residual strength of the GRPlaminates after ballistic impact rather than a tensile or fatigue test.Testing of composite panels in compression constitutes the worst case loadingcondition; laminate failure modes under compressive loading are matrixcontrolled.
The fixture used in the compression test was a modified version of acompression test fixture developed by NASA. The specimen was gripped on thetop, bottom, and sides. The side supports help keep the specimen frombuckling. A small space at the top of the specimen between the sides and theupper fixture leaves room for the panel to compress unrestrained. Allfixturing was made from 6061 T-6 aluminum alloy. Loads were applied to thefixture and specimen using a 600 kip universal test machine.
Prior to testing damaged panels, compression testing was conducted onundamaged S2-glass fabric reinforced laminates. Tests were conducted onpanels ranging in thickness from approximately 1.0" to 1.7". Panel size forthe nominal 1.0"-thick laminate was 20" X 20"; panels of thickness greaterthan 1.0" measured 10" X 20" in size to accommodate the maximum load of thetest machine. For all tests (both undamaged and damaged panels) the loadingaxis was parallel with the panel long side. Since the fabric reinforcementis of balanced weave and delamination zones in the damaged panels areaxisymmetric, no distinction was made in the two possible loading directionsfor any panel.
One control panel was photoelastically coated to determine if theloading was uniform across the cross sectional area of the specimen. Therewas no evidence of non-uniform loading. The load and time history wasmeasured during each test; the maximum load was considered the failure load.
Compression test data for the undamaged laminates is tabulated in Table2.3 and shown in Figure 2.22. The nominal strength was computed by dividingthe maximum load by the entire cross-sectional area of the panel normal tothe loading axis. Figure 2.22 shows that the laminate nominal compressivestrength falls within a band over the thickness range examined. Meanstrength for each pair of 10" X 20" panels and overall mean strength for allpanels tested satisfy the minimum required value of 20 ksi specified in MIL-L-46197. Also, variation in length of the panel load-bearing side from 10"to 20" does not appear to affect laminate nominal compressive strength.
Compressive test data for all of the ballistically damaged laminates ofTable 2.2 is contained in Table 2.4. Compressive strength of the GRPlaminates after ballistic impact shows good reproducibility for replicateexperiments.
28
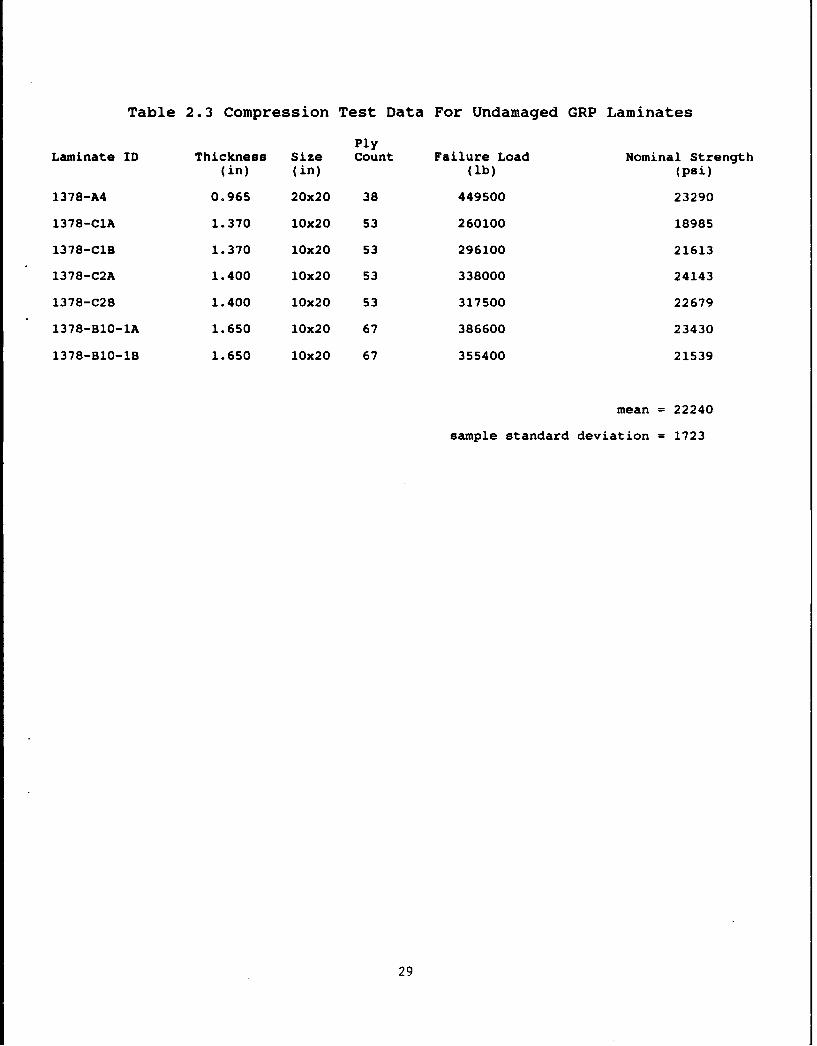
Table 2.3 Compression Test Data For Undamaged GRP Laminates
PlyLaminate ID Thickness Size Count Failure Load Nominal Strength
(in) (in) (lb) (psi)
1378-A4 0.965 20x20 38 449500 23290
1378-CIA 1.370 10x20 53 260100 18985
1378-CIB 1.370 1Ox20 53 296100 21613
1378-C2A 1.400 10x20 53 338000 24143
1378-C2B 1.400 10x20 53 317500 22679
1378-B10-1A 1.650 10x20 67 386600 23430
1378-BlO-lB 1.650 10x20 67 355400 21539
mean = 22240
sample standard deviation = 1723
29

0 0
0 0o
-0
°>-0 00-
.. ................... ........................ ............. ............. ............. ...........
oto
300
0
0 L.LL 0 L WI. W I, LW 0W±.~ I. 0 .
(!S1l) q4IOueJIs leU!UON
30
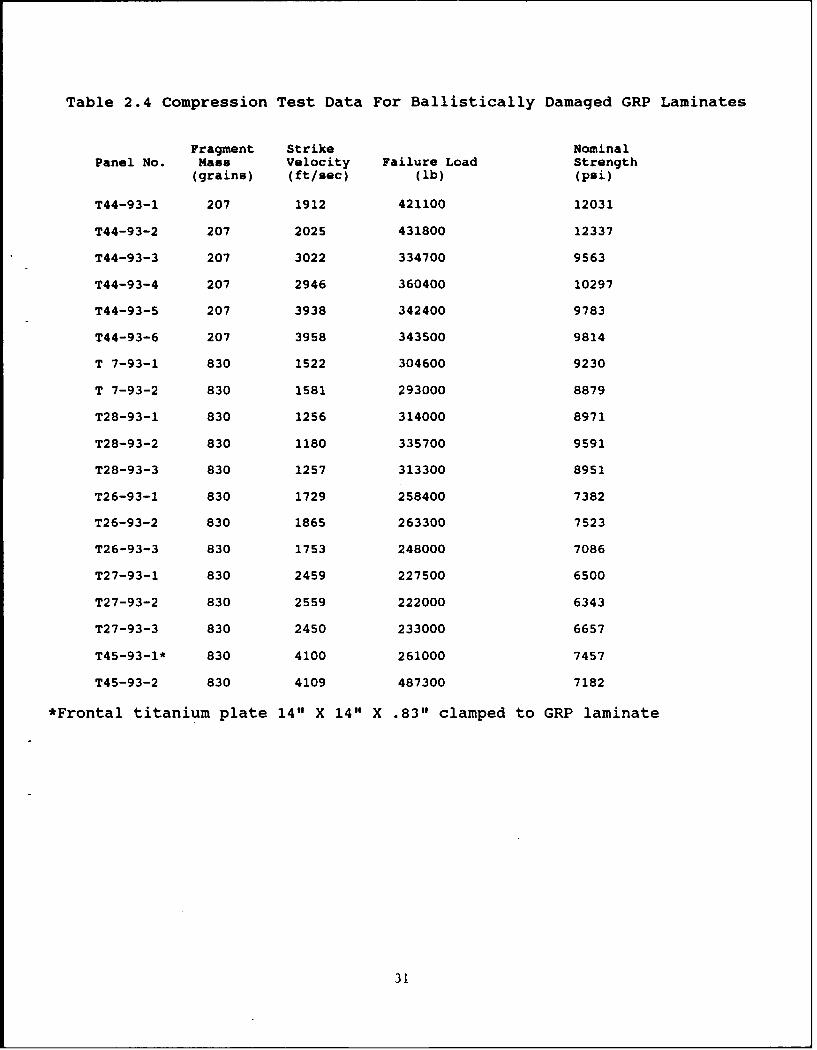
Table 2.4 Compression Test Data For Ballistically Damaged GRP Laminates
Fragment Strike NominalPanel No. Mass Velocity Failure Load Strength
(grains) (ft/sec) (lb) (psi)
T44-93-1 207 1912 421100 12031
T44-93-2 207 2025 431800 12337
T44-93-3 207 3022 334700 9563
T44-93-4 207 2946 360400 10297
T44-93-5 207 3938 342400 9783
T44-93-6 207 3958 343500 9814
T 7-93-1 830 1522 304600 9230
T 7-93-2 830 1581 293000 8879
T28-93-1 830 1256 314000 8971
T28-93-2 830 1180 335700 9591
T28-93-3 830 1257 313300 8951
T26-93-1 830 1729 258400 7382
T26-93-2 830 1865 263300 7523
T26-93-3 830 1753 248000 7086
T27-93-1 830 2459 227500 6500
T27-93-2 830 2559 222000 6343
T27-93-3 830 2450 233000 6657
T45-93-1* 830 4100 261000 7457
T45-93-2 830 4109 487300 7182
*Frontal titanium plate 14" X 14" X .83" clamped to GRP laminate
31

The nominal compressive strength of panels 20" X 20" X 1.7" in sizeafter ballistic impact is shown in Figure 2.23 as a function of fragment massand strike velocity. An initial, sharp drop in compressive strength withstrike velocity is seen for both fragment sizes. However, compressivestrength tends to level out at an asymptotic value of approximately 10 ksifor strike velocities greater than 3000 ft/sec in the case of the 207 grainfragment and approximately 7 ksi for strike velocities greater than 2000ft/sec in the case of the 830 grain fragment. It is of interest to note thatinternal damage (delaminated volume) continues to increase linearly forstrike velocities above 3000 ft/sec in the case of the 207 grain fragment and2000 ft/sec in the case of the 830 grain fragment (Figure 2.20), whilecompressive strength remains virtually constant. This increase indelaminated volume with strike velocity holds only up to the panel limitvelocity.
The compressive strength for the 1.7"-thick GRP laminate T45-93-1 showeda post-impact value comparable to laminate T26-93-2. The latter experienceddirect impact with the 830 grain fragment at 1865 ft/sec; the former was therear component of a titanium-faced binary target and, as such, experiencedonly minor penetration by the fragment and a titanium plug at the residualvelocity of the fragment after it passed through the titanium plate. Theimplication, here, is that a GRP laminate acting as backup component for ametallic armor applique can suffer internal damage (loss of strength) withoutexperiencing direct impact or projectile penetration.
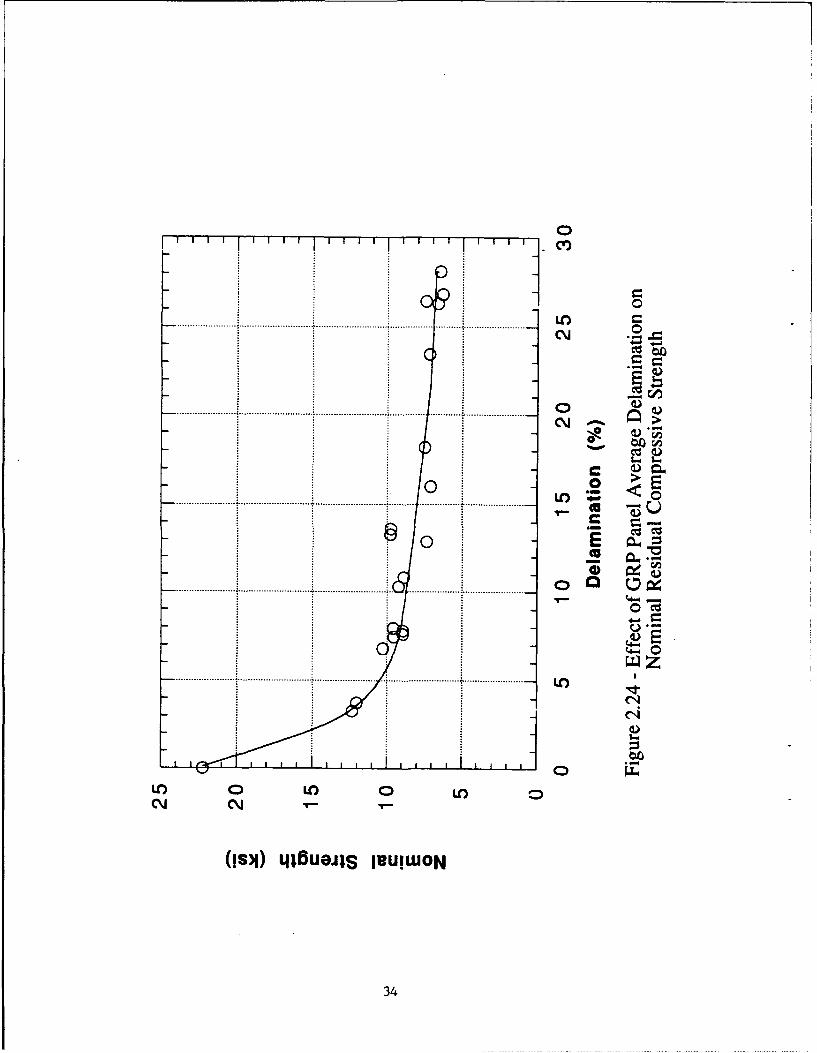
Figure 2.24 shows nominal residual compressive strength for each GRPlaminate tested in this work as a function of average percent delaminationexperienced by the panel. Average delamination as low as five percentreduces the panel compressive strength by approximately fifty percent;however, compressive strength falls off slowly as average delaminationincreases above five percent. A critical question for future work is whetherthe results of Figure 2.24 apply to panels of size other than tested here.
d. Rear Surface Transient Displacement
Measurement of rear surface maximum, transient displacement for the GRPlaminate of each test shot was taken from the permanent deformation of a.020"-thick aluminum witness sheet placed directly behind the laminate. Thealuminum witness sheet experienced the same transient displacement as therear surface of the GRP laminate but, unlike the laminate, retained themaximum displacement profile as the permanent deformation. Measurementstaken from flash radiographs of the rear surface displacement of reinforcedplastic laminates struck by fragment simulators has shown this techniques toprovide good accuracy. Rear surface displacement data is tabulated in Table2.5; results for the GRP laminates of nominal thickness 1.7" are shown inFigure 2.25.
32

LO
ULLL cc)0
oM 00
0Cc0
o
I 0o r
> Cd~~C)C
. ........ ...... ............... C
LO~~ 0>(
0\ C\J
(!S)I) 4I15UOJIS IBU!WON
33
00
0
> E00 Q
LZZ
ilCl
.) . .. 0. . 0
oo
c'J c•I 1- 1--
(!s~l) Lfl~ueJlS IBUIWON
34

Table 2.5 Rear Surface Displacement Of GRP Laminates
Panel' Fragment Strike Rear SurfacePanel No. Thickness Mass Velocity Max Transient Displacement
(in) (grains) (ft/sec) (in) (mm)
T44-93-1 1.73 207 1912 3/16 4.8
T44-93-2 1.73 207 2025 5/32 4.0
T44-93-3 1.73 207 3022 11/32 8.7
T44-93-4 1.73 207 2946 3/8 9.5
T44-93-5 1.73 207 3938 21/32 16.7
T44-93-6 1.73 207 3958 11/16 17.5
T 7-93-1 1.64 830 1522 3/8 9.5
T 7-93-2 1.63 830 1581 5/16 7.9
T28-93-1 1.71 830 1256 3/16 4.8
T28-93-2 1.73 830 1180 3/16 4.8
T28-93-3 1.68 830 1257 3/16 4.8
T26-93-1 1.73 830 1729 3/8 9.5
T26-93-2 1.68 830 1865 1/2 12."
T26-93-3 1.68 830 1753 7/16 11.1
T27-93-1 1.70 830 2459 13/16 20.6
T27-93-2 1.69 830 2559 1 25.4
T27-93-3 1.68 830 2450 7/8 22.2
T45-93-1 2 1.72 830 4100 21/32 16.7
T45-93-2 2.95 830 4'09 31/32 24.6
1. All panels measure 20" X 20" in size except for T45-93-2 which measures23" X 23".
2. Frontal titanium plate 14" X 14" X .83" clamped to GRP laminate.
35

N N
rL. + 0 +
00
ooi0 ""~qi7 0
• . .... ...... ...... .................... .... ... ........ ................. ........ ,
a...... .......... .. .......0 CO0 a•
co~~ U)C~b
0 uc
Cocc~ 0
0 CV) 0 0
0!
0
0 to LI J cO It 0 0
(9L/u!Iueweoeldsia lueisueJi wunwixenl
36

e. Summary of Results
Computed tomography inspection of glass-reinforced plastic panels hasbeen shown to provide detailed, quantitative data on internal delaminationresulting from fragment ballistic impact.
Fragment ballistic experiments conducted on S-2 glass-reinforced plasticpanels demonstrate correlation of panel delamination volume with fragmentmass and strike velocity. Replicate experiments show excellentreproducibility of results.
Corollary results include measurement of fragment depth of penetrationin S-2 glass-reinforced plastic laminate and maximum displacement of laminaterear surface during fragment impact. These results were obtained to assistdevelopment of dynamic behavior simulation models for the laminate material.
Compression testing of both undamaged and ballistically damaged S-2glass-reinforced plastic panels shows that test results are reproducible forreplicate experiments and that compressive strength of single-thicknesspanels after fragment impact can be related to fragment mass and strikevelocity; compressive strength after fragment impact did not correlate withimpact kinetic energy.
The most important result of this chapter is a proposed correlation ofcompressive strength of S-2 glass-reinforced plastic panels after ballisticimpact with panel average delamination. The correlation shows an immediatedrop in compressive strength to approximately 50% of the undamaged value foras little as 5% average delamination. However, compressive strength fallsoff slowly as delamination increases above five percent. Future work willfurther test this result.
A preview experiment consisting of a fragment impact on a titanium-facedglass-reinforced plastic panel shows that glass-reinforced plastic laminatescan suffer extensive delamination and loss of strength without direct impactby a kinetic energy threat. Induced ballistic damage to glass-reinforcedlaminates behind applique armor is a major topic for follow-on work.
The objectives defined for this study have been satisfied. This workhas also provided a clear and logical set of follow-on questions and issuesas well as the experimental methods to pursue these issues.
37

3. DYNAMIC CHARACTERIZATION
(a). Background:
The development of armor systems is a complex process whichrequires performance of ballistic experiments as well as computersimulations of ballistic events in order to fully understand theperformance of armor material. Simulations are conducted usingwave propagation / finite element codes; such codes requiredynamic properties of materials for carrying out analysis ofballistic events. Thus, a knowledge of the response of glassreinforced plastic (GRP), under dynamic loading is essential todevelop a better understanding of its performance as a structuralarmor material. This chapter describes experiments performed tomeasure the mechanical properties of GRP under quasi-static anddynamic loading. It is divided into three sections that describethe experiments performed (i) to define the material model with afull set of elastic constants, (ii) to obtain deformation curvesfor compressive and tensile loading under quasi-static and mediumstrain rates ( 10-4 to 1 s-1 ), and (iii) deformation undercompression at high strain rate. The results of these experimentsare discussed and summarized in the last section of this chapter.
For purpose of this chapter, the thickness direction along thefiber axis was designated as the z or <001> direction; the othertwo orthogonal directions were designated as x or <100> and y or<010> directions. Ultrasonic wave velocities were measured in<100>, <010>, <001>, <110>, <101>, and <011> directions todetermine the nine independent elastic constants for a 3-Dorthotropic material Orientations are shown in Figure 3.1.
X:<IO0> AZ <01 bY:<O I 1>
Z: <0 0 > <0 0 1) <1 0 \ A L
Ayy
Figure 3.1 GRP specimen orientations.
39

Photomicrographs in the <100> and <001> orientations of GRP showthat the material is not homogeneous or uniform with respect tofiber weave geometry and contains voids, (Figure 3.2)Consequently, density variation must be considered indetermination of elastic constants.
(a)
SA
Figure 3.2 Photomicrographs of typical specimens (a) Orientation<110> , (b) Orientation <001>.
40

Specimen densities were measured using Archemides method Densitiesof GRP composite specimens used in this chapter are tabulated inTable 3.1. Numbers in square brackets are the number of testspecimens. A statistical analysis of the density data showed nosignificant difference in density with respect to specimenorientation or shape; hence the value of 1.949 ± 0.030 Mg/m 3 isused when needed.
Table 3.1 Densities of GRP specimens in ( Mg/m 3 ).
SPECIMEN COMPRESSION SPECIMENS ULTRASONIC SPECIMENSORIENTATION
RECTANGULAR CIRCULAR
<100> 1.956 ± ).015 [15] 1.948 ± 0.008 [51 1.955 ± 0.007 [4]<010> 1.964 ± 0.033 [13] 1.967 ± 0.010 [5] 1.958 ± 0.011 [4]<001> 1.938 ± 0.014 [12] 1.932 ± 0.010 [5] 1.926 ± 0.034 [41<110> - 1.946 ± 0.048 [4]<101> - 1.964 ± 0.004 [41<011> - 1.968 ± 0.026 [4]
AVERAGE 1.950 ± 0.031 [40] 1.947 ± 0.030 [151 1.952 ± 0.036 [24]VALUES
1.949 ± .030 Mg/M 3
(b). Elastic Constants:
Experimental Procedure
Elastic constants of GRP are obtained from phase velocities ofultrasonic waves. Phase velocity is defined as the velocity ofindividual cycles in a continuous wave, and is given by
V = fX= W/k (3.1)
where V is the phase velocity, f is the frequency of theultrasonic wave, kis the wavelength,o(is the angular frequency 2nf,and k is the wave number 27/A. If the phase velocity is non-dispersive, i.e., it does not vary with frequency, then elasticwaves remain unchanged traveling through the thickess ofspecimen.The implication is that the elastic constants are notfrequency dependent.
At an ultrasonic frequency, with wavelength being much smallerthan specimen cross-sectional dimension, but larger then the fiberdiameter and spacing the phase velocity, (V) is given by
V = (C/p)1 / 2 (3.2)
41

where C is the appropriate elastic constant.
This relation is based on the propagation of a plane wave frontThe wave fronts ate considered to be planer when the dimension ofthe specimen in the wave propagation direction is les than theFresnel limit (F) ,i.e.,
L = F r 2 /% (3.3)
where L is the specimen length and r is the radius of thetransducer. The Fresnel region will be greatest for the case oflongitudinal waves. The number of cycles (N) of delay of the wavetraveling in the specimen is N=LrA. From (3.3) the Fresnel regionrequirement is met for those frequencies such that
N Ž (L/r)2 (3.4)
Since shear wavelength is shorter than longitudinal wavelength atthe same frequency, only longitudinal wavelength is used tocalculate thickness requirements for specimens used in ultrasonicwave experiments. For these experiments a frequency range ofbetween 0.2 and 2 MHz was used, with a 1.27 cm radius transducerWave velocity measurements could not be made at higher frequenciesdue to the limitation of the transducers frequency responseUsing equation 3.3 with a frequency of 0.2 MHz and transducerradius of 1.27 cm., the Fresnel region is 9.76 mm. Therefore,specimens used were 3.2 mm and 9.5 mm thick to insure a plane wavethrough the specimen. Lateral crossection of the specimen weresquare with a side of 37 mm to be compatible with transducerdimensions.
Phase velocity measurements were made at frequencies between 0.2MHz and 2 MHz. For these phase velocity measurements, an imagesuperposition method [3.1] similar to the pulse - echo overlapmethod [3.2] was used. The image superposition method employsbursts of ultrasonic vibrations rather than continuous waves . Thebursts consist of a continuous wave amplitude modulated bysinusoidal pulses synchronized with the wave. The repetition rateof the pulses is 1/2048 times the frequency of the continuouswave. The pulse duration is made long enough to encompass manycycles of the wave in order to make it as monochromatic aspossible. Images of the pulses are superposed by control of thetiming of pulses relative to the timing of oscilloscope sweeps Thecontrol of timing is done by means of digital circuitry.
Phase velocity data is obtained by comparing the phase ofindividual cycles as they enter and leave a specimen. This isdone by adjusting the advance of bursts applied to the specimen sothat lead time equals travel time of individual cycles. Then theimages of individual cycles coincide as they are presentedalternately on the oscilloscope.
42
These measurements are done with two pairs of identicaltransducers. Two methods were adopted to obtain wave number as afunction of frequency. In the first method, one pair is coupledtogether, and the other pair is separated by and coupled to aspecimen. In the second method, each pair of transducers iscoupled to one of two specimens of the same orientation butdiffering in thicknesses to generate wave number vs frequencydata. In both methods, one transducer of each pair is connectedin parallel to the signal source. The other two transducers areconnected to the two signal inputs of the oscilloscope through twopreamplifiers.
The signal frequency is started at the lowest frequency at whichthe travel time through the specimen is the inverse of thatfrequency. From that point, the frequency is gradually increasedand recorded along with the number of cycles of delay needed tokeep the images superimposed. An additional record may be keptof the number of cycles needed to match the envelope of the burstfor group velocity determination.
For each set of data, n/L (number of cycles/specimen length, i.e.,1/1) was plotted vs frequency. The data generated in thismanner for GRP were found to vary linearly. Hence, it was notnecessary to adjust the phase velocity data so as to bring theintercept to the origin. The details of this technique are givenin Reference [3.1].
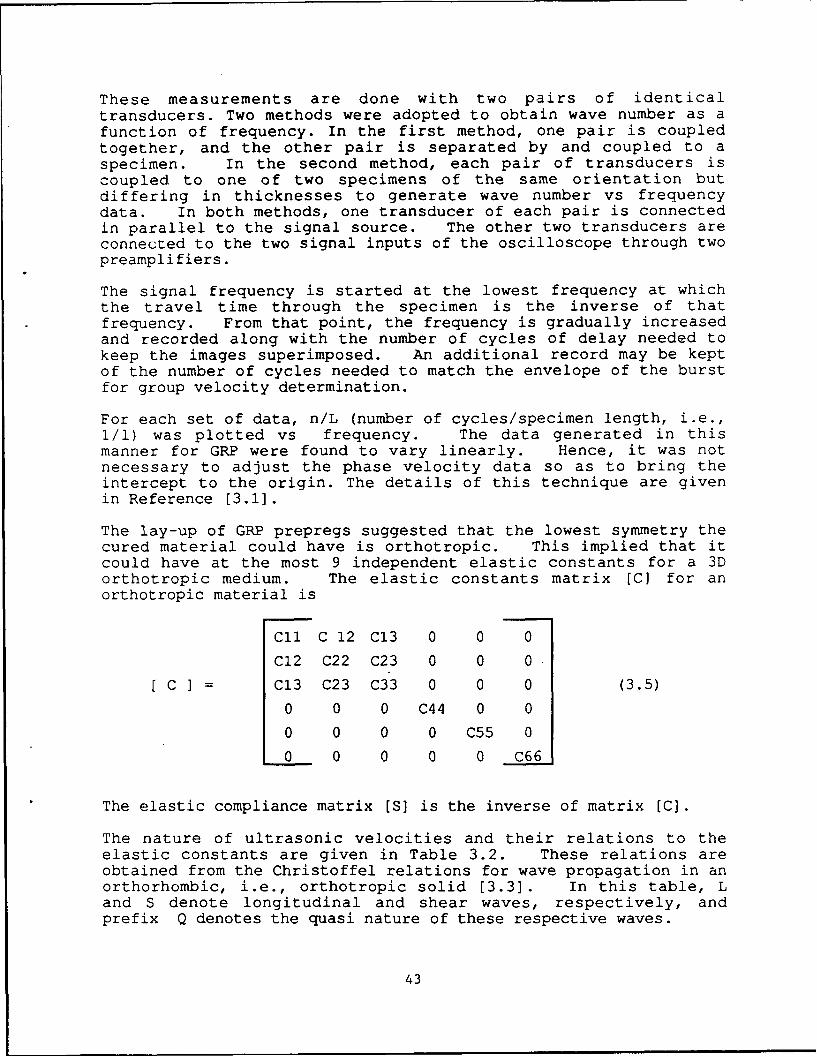
The lay-up of GRP prepregs suggested that the lowest symmetry thecured material could have is orthotropic. This implied that itcould have at the most 9 independent elastic constants for a 3Dorthotropic medium. The elastic constants matrix [C] for anorthotropic material is
C1I C 12 C13 0 0 0
C12 C22 C23 0 0 0
C ] = C13 C23 C33 0 0 0 (3.5)
0 0 0 C44 0 0
0 0 0 0 C55 0
0 0 0 0 0 C66
The elastic compliance matrix [S] is the inverse of matrix [C].
The nature of ultrasonic velocities and their relations to theelastic constants are given in Table 3.2. These relations areobtained from the Christoffel relations for wave propagation in anorthorhombic, i.e., orthotropic solid [3.3]. In this table, Land S denote longitudinal and shear waves, respectively, andprefix Q denotes the quasi nature of these respective waves.
43

Table 3.2 Wave velocity types and relations to elastic constants(Cij) of an orthotropic composite as expressed by the products ofdensity (r) and squared wave velocity(V).
Wave VebkiesDiredon of
Mode Prmpagafon Parlde Wave rV2 Eq.MoWon Vekoity
L <100> <100> V1 C1 1 3.6
S <100> <010> V2 C66 3.7
S <100> <001> V3 C55 3.8
L <010> <010> V4 C22 3.9
S <010> <100> V5 C66 3.10
S <010> <001> V6 C44 3.11L <001> <001> V7 C33 3.12
S <001> <100> V8 C55 3.13
S <001> <010> V9 C44 3.14
(L <110> <110> V10 0.5C66 +025 (Cl1 +C22) + 3.15
0.5[(C12 + C66)2 +025 (C22- C1 1)2]112QS <110> <110> V11 05C66 +025 (Cl1 +C22)- 3.16
0.5 [(C12 + C66)2 + 025 (C22-CC 1)2]112S <110> <001> V12 0.5(55+C44) 3.17
CL <101> <101> V13 0.5C55+025(C(11 +C3 3 ) + 3.18
0.5 [(C 13 +C5 5 )2 +025 (C(1 1 -C33)2]1/2OS <101> <101> V1 4 0.5C55 +025 (Cll +C3 3 )- 3.19
0.5 [(C13 + C55)2 + 025 (C1 1 -C33 )2]1'2
S <101> <010> V1 5 0.5 (C66 +C44) 320
CL <011> <011> V16 0.5 C44 +025 (C22 +C3 3 ) + 321
0.5 [(C23 + C44)2 + 025 (C22 -C33)211/2
as <011> <011> V17 0.5C44 +025 (C22 +C3 3 )- 322
0.5 [(C23 + C44)2 + 025 (C22 -C33)/2
S <011> <100> V18 0.5(C66 + C55) 323
Within the range of frequency of measurements none of the wavevelocity modes showed dispersion. Figure. 3.3 shows consistencyof the phase velocities through a plot of frequency vs. wavenumber for some of the velocity modes.
44

0.8 1.2
0.71 -- </>
Z 0.6A
>- <0.5 I" -- < 10 >o.5 I-- <1• I--a. Colo>I
S0.4 0.1i-.-i.- i -_
C. 0.3 y 0.1239 + 0.2552x y6 0.99512 - 0.0315 + 0.571x R- 0.999220.2 -y - 0.051 + 0.2574x R, 0.99732 0.4 y - -0.133+0.698xR-0.999210.2 •/ - - y - 0.091 + 0.251% R., 0.9979 ' Y . ,-0.1335 + 0.698x P,6 0.9992
0.1 --- ;y- 0.12o 0.2 ,,4- y-6-o.0•75+. R0 o.50 0.5 1 1.5 2 2.5 3 3.5 0 0.5 1 1.5 2 2.5
CYCLES CYCLES
(a) Longitudinal Mode (b) Shear Mode
Results
The measured values of wave velocities in 24 different specimensof GRP composites are given in Table 3.3. The results are used:
(i) to show the extent of variability in the measurement of wavevelocities in different specimens of the GRP composite,
(ii) to determine the symmetry of GRP composite and the numberof independent elastic constants required to describe itselastic behavior,
(iii) to determine the values of the independent elasticconstants from these wave velocity measurements, and
(iv) to compare the elastic constants obtained from the higherultrasonic frequency measurements with those from quasi-staticconditions.
Table 3.3 shows that variation in the values of even the purelongitudinal and shear modes of propagation along <100>, <010>,and <001> directions exceed the estimated errors for this type ofexperiment. It is also noticed that within the error ofmeasurement variation in density of GRP specimens with the sameorientation do not affect the values of wave velocities.
45

Table 3.3 Ultrasonic wave velocities and density of GRP specimens.
PAIR COMBINATION VELOCITIES AND PROPAGATION
'km/sec)SPEC DENSITY LENGTH (mm) LONGITUDINAL SHEAR SHEAR
No. (g/cc) POLARIZATION POLARIZATION1 a-2 1.960 2.9201-1 1.955 9.552 4.04 1.58 1.57
la-1 1.948 3.185 4.151-1 1.949 9.552 4.13 1.43 1.42
la-2 1.960 2.920 4.161-2 1.949 9.523 3.82 <010> 1.60 <100> 1.57 <001>
4.04±.284 V4 1.53±.186 V5 1.52±.173 V6
2a-1 1.929 3.1052-1 1.928 9.509 3.21 1.57 1.55
2-2 1.945 9.5412a-2 1.904 3.133 3.21 1.36 1.43
2a-2 1.904 3.133
2-1 1.928 9.509 3.22 <001> 1.63 <100> 1.62 <010>
3.21±.012 V7 1.52±.284 V8 1.53±.192 V9
3a-1 1.959 3.212 4.053-1 1.956 9.558 3.98 1.72 1.70
3a-2 1.955 3.154 3.863-2 1.950 9.538 4.03 <100> 1.63 <010> 1.56 <001>
3.98±.170 V1 1.68±.127 V2 1.63±.198 V3
4a-1 1.972 9.5564b-1 1.919 3.366 3.80 1.55 2.36
4a-2 1.960 9.5664b-2 1.935 3.348 3.86 <110> 1.37 <001> 2.19 <110>
3.83±.085 V10 1.46±.255 V1 2 2.28±.240 V11
5a-1 1.967 3.2065-1 1.962 9.565 3.44 1.64 1.58
5a-2 1.965 3.2105-2 1.964 9.561 3.45 <101> 1.64 <010> 1.56 <101>
3.45±.028 V13 1.64±.014 V1 5 1.57±.028 V1 4
6a-2 1.982 3.1836-2 1.960 9.521 3.41 1.51 1.52
6a-1 1.976 3.1686-1 1.954 9.519 3.43 <011> 1.55 <100> 1.60 <011>
3.42±.028 V1 6 1.53±.056 V1 8 1.56±.11 V1 7
46

For example, the values of longitudinal and shear velocity modesin <001> directions do not vary significantly even when thedensities of the specimens vary between 1.904 and 1.945 Mg/m 3 orwhen these measurements are carried out on a pair of thesespecimens with varying densities. Hence, the average value of aspecific velocity mode is assumed to be the representative valuefor that mode. Values of the various velocity modes in GRPcomposite are given in Table 3.4.
Table 3.4 Velocity modes measured in GRP composite.
Wave Vekxbes
Drecon of
Mode Propagadon Paride km/sMolion
L <100> <100> V1 3.98±0.170S <100> <010> V2 1.68±0.127S <100> <001> V3 1.63±0.198L <010> <010> V4 4.04±0284S <010> <100> V5 153±0.186S <010> <001> V6 152±0.173L <001> <001> V7 321 ±0.012S <001> <100> V8 152±0284S <001> <010> V9 153±0.192CL <110> <110> V10 3.83±0.085aS <110> <110> V 1 228±0240S <110> <001> V12 1.46±0213
CL <101> <101> V13 3.45±0.028QS <101> <101> V14 157±0.028S <101> <010> V15 1.64±0.014CL <011> <011> V16 3.43±0.028aS <011> <011> V17 156±0.113S <011> <100> V18 153±0.056
This table indicates that following equalities hold among thevarious velocity modes in GRP composite.
V"2 = V42 (3.24)
V22 = V5
2 (3.25)
V32 = V6
2 = V82 = V9
2 = V1 22 (3.26)
V1 52 =0.5 (V2
2 + V32 ) = V18 2 (3.27)
V1 02 + V1l 2 = V2
2 +V, 2 (3.28)V1 3
2 + V1 42 = V3
2 +0.5 (V12 +V7
2 )
47
= V1 62 + V1 72 (3.29)
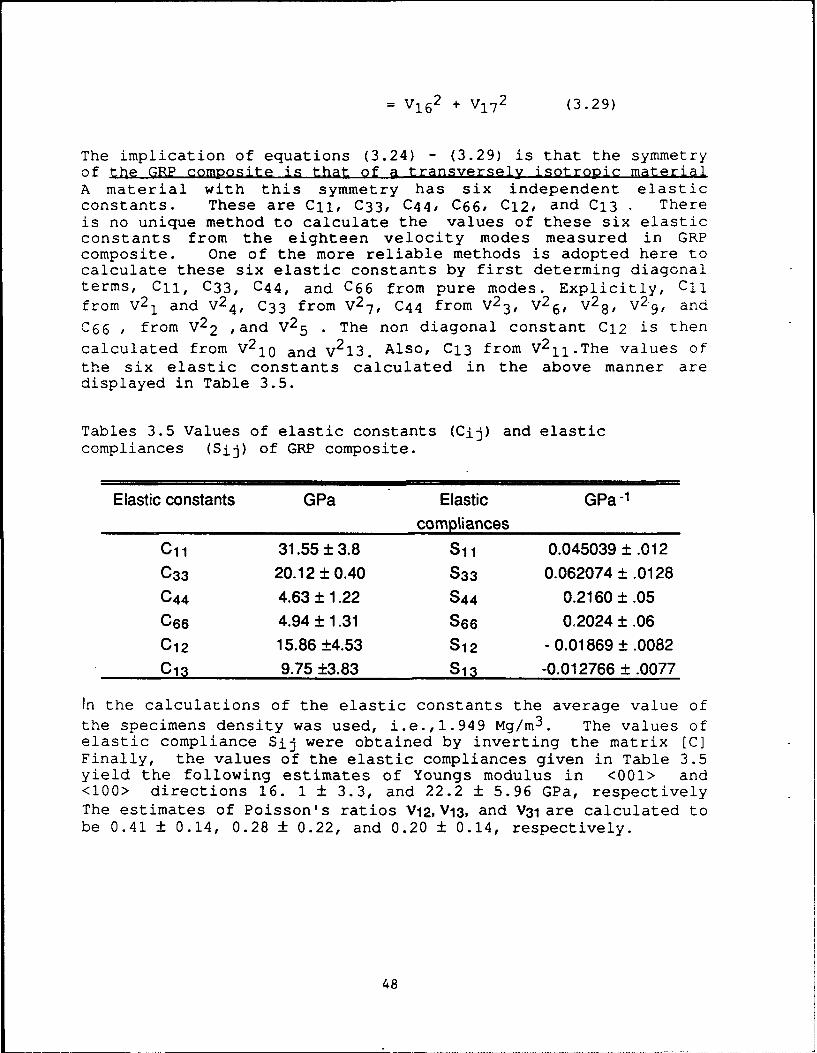
The implication of equations (3.24) - (3.29) is that the symmetryof the GRP composite is that of a transversely isotropic materialA material with this symmetry has six independent elasticconstants. These are CII, C33, C44, C66, C12, and C13 Thereis no unique method to calculate the values of these six elasticconstants from the eighteen velocity modes measured in GRPcomposite. One of the more reliable methods is adopted here tocalculate these six elastic constants by first determing diagonalterms, ClI, C33, C44, and C66 from pure modes. Explicitly, Ciifrom V2
1 and V2 4, C33 from V2 7, C44 from V2 3, V2 6, V28 , V2 9, and
C66 , from V22 ,and V2
5 . The non diagonal constant C12 is then
calculated from V21 0 and V213. Also, C13 from V2
1 1 .The values ofthe six elastic constants calculated in the above manner aredisplayed in Table 3.5.
Tables 3.5 Values of elastic constants (Cij) and elasticcompliances (Sij) of GRP composite.
Elastic constants GPa Elastic GPa 1
compliancesC11 31.55 3.8 S11 0.045039 .012033 20.12 ± 0.40 S33 0.062074 + .0128044 4.63 ± 1.22 S44 0.2160 ± .05
066 4.94 ± 1.31 S66 0.2024 ± .06C12 15.86 ±4.53 S12 - 0.01869 ±.0082C13 9.75 ±3.83 S13 -0.012766 ± .0077
In the calculations of the elastic constants the average value ofthe specimens density was used, i.e.,i.949 Mg/m 3 . The values ofelastic compliance Sij were obtained by inverting the matrix [C]Finally, the values of the elastic compliances given in Table 3.5yield the following estimates of Youngs modulus in <001> and<100> directions 16. 1 ± 3.3, and 22.2 ± 5.96 GPa, respectivelyThe estimates of Poisson's ratios V12,V13, and V31 are calculated tobe 0.41 ± 0.14, 0.28 ± 0.22, and 0.20 ± 0.14, respectively.
48

(c).Quasi-Static and Medium Strain Rate Tensile and CompressiveProperties:
This section deals with the experimental program to determinedeformation of GRP composite under uniaxial compression andtension at two strain rates. The two strain rates are 10-4 s-1 and1 s-1. A medium strain rate machine (MSRM) [3.4] was used tocarry out these experiments. The orientation of specimens usedin tension experiments were <100> and <010>, see Figure3.1.Compression experiments were conducted in three directions<100>, <010>, and <001>. The facilities, test procedures andresults are described in the following paragraphs.
Experimental Procedure
The tension and compression tests were carried out in the MediumStrain Rate Machine (MSRM). The MSRM has a 140,000 pounds stati.cload capacity. There are two operating modes: close loop modeand open loop mode. In the closed loop mode, the MSRM has thesame characteristics typical of servo-hydraulic controlled testmachines. A strain / load / displacement rate up to 1 s-1 can beachieved in the closed loop mode. In the open loop mode,thehydraulic fluid is replaced by nitrogen gas. A fast-acting valveis used to release the gas from the top or bottom of an actuatingpiston creating a pressure differential which moves the piston.Theloading rate in the open loop mode is controlled by the gaspressure, stroke of the piston, and the orifice size selected forthe fast-acting valve. A nominal rate of up to 50 s-1 can beachieved depending on the ductility of the specimen. Stress andstrain measurements were made by means of load cells, straingages, and linear variable differential transformer (LVDT). Thestrain gages are used to measure a max strain up to 5%. The LVDTwas used to measure displacements corresponding to strains in thespecimen above 5%. The LVDT displacement measurements togetherwith the specimens gage length and a correction factor were usedto obtain strains greater than 5% . The LVDT data was correctedfor compliance of the test fixtures by measuring the displacementof the fixtures without specimen. A computer with a fast dataacquisition card and a digital oscilloscope were used to controlthe MSRM and record load, strain, displacement, and time duringthe conduction of experiments. For all experiments conducted themeasurement errors from the strain and load systems were less than2.0 percent .
Tension and compression testing was conducted at strain rates of10-4 s-I and 1 s-1. The tension tests were conducted in accordancewith ASTM D3095 standard, Figure 3.4 is a sketch of the tensionspecimen.
49

305 cm
178cm
0.254 cm Tab Thickness
1500
Specimen 0.127cmThickness
Figure 3.4 A sketch of tension specimens (ASTM D3095)
All specimens were strain gaged using standard techniques. Thegages used were an overlay bi-axial gage, Micro-Measurements CEA-13-062WT-350. The gages were bonded to the specimens with BLHPermabodn 910 adhesive.
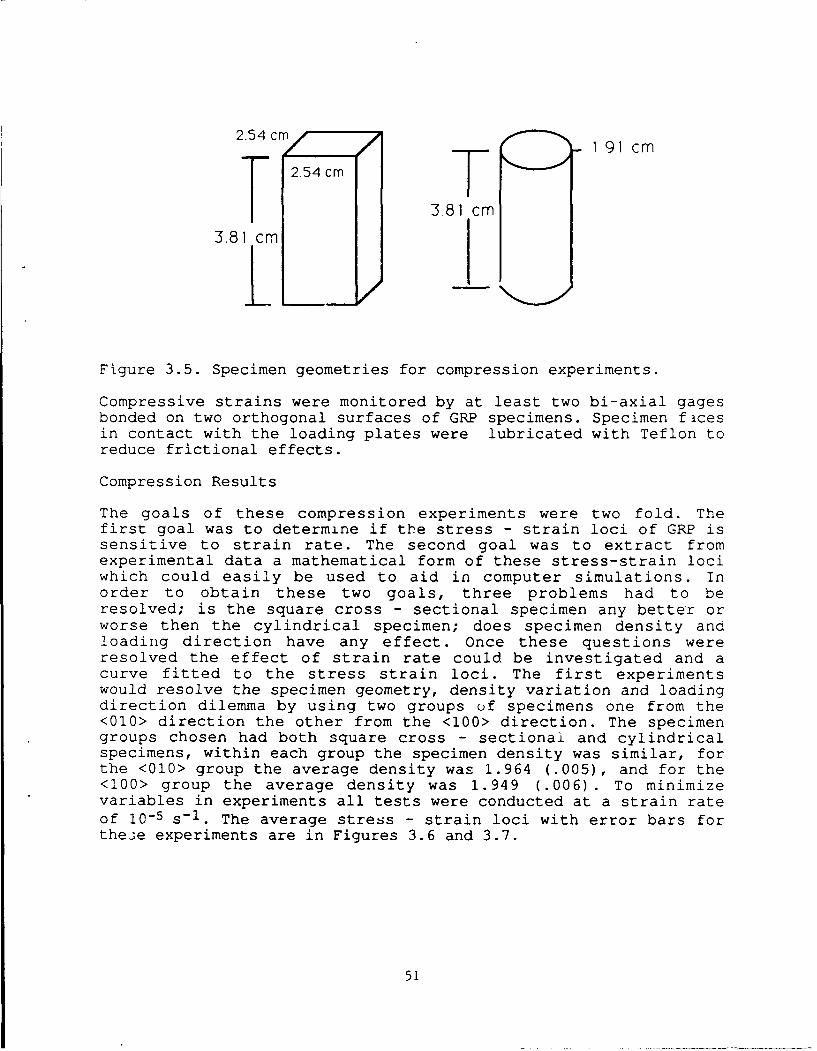
No ASTM standard specimen configuration exists for compressiontests of a thick laminate composites. Also thickness of specimenmaterial in the <001> direction was limited to a maximum dimensionof 4.32 cm. Hence, the specimen chosen was the same as the oneused by Fazle et .al. [3.5]. This specimen geometry has a squarecross section of 6.45 cm2 , with a length of 3.81 cm.In addition atraditional right circular cylinder specimen was used. Thecylindrical specimen has a diameter of 1.91 cm, with a length of3.81 cm. Both specimen geometries retain thick compositedimensions. Sketches of these two specimen geometries are givenFigure 3.5.
50
2.54 cm M/12.m
2.54 cm 1 91 cm
3.8 1 cm
3.81 cm
Figure 3.5. Specimen geometries for compression experiments.
Compressive strains were monitored by at least two bi-axial gagesbonded on two orthogonal surfaces of GRP specimens. Specimen ficesin contact with the loading plates were lubricated with Teflon toreduce frictional effects.
Compression Results
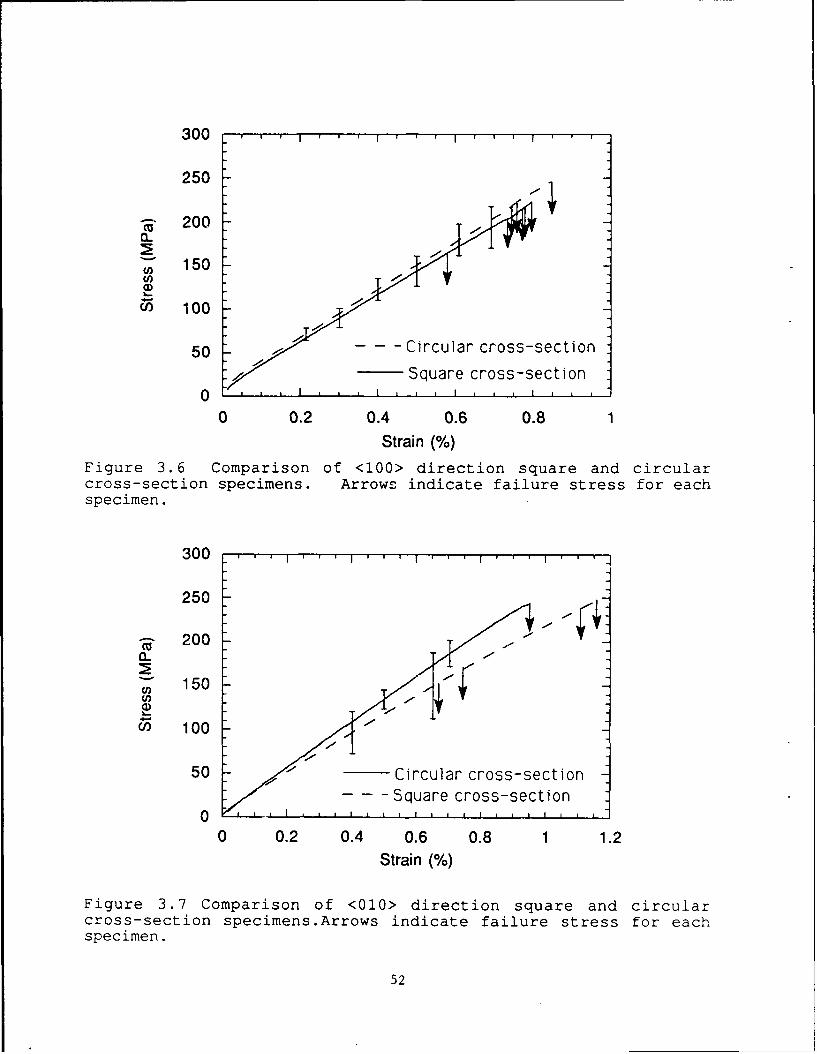
The goals of these compression experiments were two fold. Thefirst goal was to determine if the stress - strain loci of GRP issensitive to strain rate. The second goal was to extract fromexperimental data a mathematical form of these stress-strain lociwhich could easily be used to aid in computer simulations. Inorder to obtain these two goals, three problems had to beresolved; is the square cross - sectional specimen any better orworse then the cylindrical specimen; does specimen density andloading direction have any effect. Once these questions wereresolved the effect of strain rate could be investigated and acurve fitted to the stress strain loci. The first experimentswould resolve the specimen geometry, density variation and loadingdirection dilemma by using two groups of specimens one from the<010> direction the other from the <100> direction. The specimengroups chosen had both square cross - sectional and cylindricalspecimens, within each group the specimen density was similar, forthe <010> group the average density was 1.964 (.005), and for the<100> group the average density was 1.949 (.006). To minimizevariables in experiments all tests were conducted at a strain rateof 10-5 s-1. The average stress - strain loci with error bars forthese experiments are in Figures 3.6 and 3.7.
51
300 'u'
250
"~ 200
',, 150Una)W5 100
50 --- Circular cross-section
Square cross-section
0 0.2 0.4 0.6 0.8Strain (%)
Figure 3.6 Comparison of <100> direction square and circularcross-section specimens. Arrows indicate failure stress for eachspecimen.
300
250
- 200 --
0~,,) 150(D
Wo 100
50 / -- Circular cross-section-Square cross-section
0 L I ý pI I . I . I . I I I , i
0 0.2 0.4 0.6 0.8 1 1.2Strain (%)
Figure 3.7 Comparison of <010> direction square and circularcross-section specimens.Arrows indicate failure stress for eachspecimen.
52

The scatter in these stress-strain loci varies from -10-15 % eventhough stress and strain are measured with a precision of ± 2 %.The failure stresses were calculated from load measurements madewith a calibrated load cell. For these two groups of specimens thescatter in failure stress was -40%, indicating that the materialvariability was much greater then any inaccuracies imposed by loadmeasurement. The average failure stress for the <010> direction is212.9 ± 23.2 MPa, and 210.3 ± 46.2 MPa for the <100> direction.The strain measurements were made using strain gages on twoorthogonal faces. For the <010> and <100> direction specimens oneface was parallel to the ply lay-up direction, the other wasperpendicular to it, see Figure 3.1. The face that wasperpendicular to ply lay-up always had a 12% larger strainreading. The <010> direction specimen strains were measured in the<001> and <100> planes. The average strains for <001> and <100>planes were .65 ± .19 % and .83 ± .14 % respectively. For the<100> direction specimen strains were measured in the <001> and<010> planes. The average strains measured in the <001> and <010>planes were .76 ± .18 % and .89 ± .04 % respectively. With thishigh level of scatter in the stress - strain loci, failure stressand failure strain cannot be distinguished between the squarecross-section specimens from the cylindrical specimens, nor the<010> direction specimens from the <100> direction specimens.Although density within each group was similar, inherentvariations in the GRP panels caused specimens between the groupsto have different densities, 1.949 ± .006 Mg/m 3 for <100> and 1.964± 005 Mg/m 3 for <010>. Since these two groups results areindistinguishable we concluded that density variations less than0.02 Mg/m3, need not be considered in analysis of the data. It isassumed that the specimen geometry and density variations will noteffect results in <001> direction. Therefore all other experimentsused the cylindrical specimen.
The effect of compressive loading a specimen in the <001>direction was determined next. The cylindrical specimen wascompressed at a constant strain rate of 10- 4 /sec. The averagefailure stress for <001> direction was 628 ± 30.4 MPa and this isan increase of almost 300 % compared to the average of 210.3 ±46.2 MPa for the <100> direction. The average failure strain was7.57 ± .61 %, an increase of almost 7 times compared to <010> and<100> directions. The average modulus for <001> was 12.2 ± .081MPa. The stress - strain loci was found to have a small nonlinearity, ie., a knee at -150 MPa.
At this point the issue of specimen geometry, densityvariation,and the effect of loading direction for the <100>,<010>, and <100> directions have been addressed. The effort willfocus on,strain rate sensitivity of GRP and mathematicalrepresentation of test data. To address the strain ratesensitivity, compressive loading of GRP specimens in the <100>,<010> and <001> directions was conducted at a strain rate of1/sec. All measuring techniques were the same as for staticexperiruents. The results of all compression experiments are given
53

in Table 3.6. The table lists density, strain rate failurestrain, failure stress, modulus and poisson's ratio for eachspecimen tested. Specimen geometry is indicated by specimennumber; "-c-" for cylindrical and a "-s-" for square crosssectional specimens.
Table 3.6 Results of compression experiments on GRP compositespecimens with square and circular cross-section with threedifferent orientations.
Spedman Density Strain Failure Failure Failure Modulus Modulus Poisson' Poisson'NxTber Rate Strain Strain Stress s ratio s ratio
(Mg/m3) (sec-1) (0/6) N (MPa) (GPa) (GPa)
<001> <100> <001> <100> <001> <100>
Y-C-10 1.964 5.3e-05 0.88 1.03 243.2 29.2 25.9 0.35 0.07Y-c- 12 1.970 1.18 0.73 0.86 296.5 24.5 19.2 0.34 0.18Y-c-13 1.961 1.84 0.66 0.91 304.1 34.2 28.1 0.30 0.12
Y-S-1 1.958 2.7e-05 0.88 1.11 249.2 34.6 24.0 0.06Y-s-4 1.963 2.7e-05 0.76 1.06 151.9 19.1 14.2 0.31 0.09Y-s-5 1.970 2.8e-05 0.84 1.17 238.6 28.5 21.1 0.31 0-10
Y-s-14 1.967 2.3e-05 0.45 0.64 168.5 43.0 25.8
<001> <010> <001> <010> <001> <010>
X-c-5 1.947 6.8e-05 0.84 0.93 245.1 26.3 25.4 0.35 0.11X-c-7 1.943 4.3e-05 0.62 0.77 216.4 36.4 32.8 0.34 0.16X-c-4 1.953 2.1 e-05 0.81 0.89 221.7 27.2 27.3 0.33 0.11X-c-6 1.948 1.69 0.95 1.04 293.6 29.2 29.6 0.33 0.20
X-C-1 0 1.951 1.67 0.99 324.1 31.1 0.36
X-s-3 1.957 2.1 e-05 0.53 0.78 204.2 26.4 0.23X-s-8 1.952 2.8e-05 0.41 0.90 213.8 36.8 28.5 0.36 0.09
X-s-1 2 1.949 2.8e-05 0.73 0.83 215.7 30.2 26.1 0.30 0.14X-s-14 1.941 3.1 e-05 0.84 1.00 223.1 27.4 21.1 0.33 0.12X-s-15 1.933 1.5e-05 0.38 0.54 163.4 47.5 24.6
Z-c-2 1.931 1.8e-04 6.96 603.3 13.1 0.17Z-C-1 9 1.932 2.1 e-04 7.59 618.7 11.6 0.23Z-c-21 1.931 1.9e-04 8.17 662.0 11.8 0.24
Z-C-8 1.929 1.21 8.20 761.0 14.7 0.17Z-C- 15 1.931 1.46 7.46 658.4 13.0Z-c-20 1.935 0.99 8.00 703.3 13.3 0.25
For all three directions increasing the strain rate from 10-5 S-1
to 1 s-1 caused a small increase in average failure stress.Becausethe scatter for the <100>, <010> and <001> directions is so large,and the number of experiments are limited, to consider thisdifference more than a trend would be poor judgment. There wasalso a small increase in the initial modulus for the <001>direction, which is typical of a polyester resin under dynamic
54

loading. The average stress-strain curves with failure locationsare plotted in Figures 3.8 and 3.9 for all three directions.
3 5 0 .' .' ' , , i ' ' ' i ' ' i 'X
300 XI /1 XX
250200
150
100 <-<100> - 105/sec--- <100>- i/sec
50 <010> - 10- 5/sec...... <010> - 1/sec
0 . . . .I . ....
0 0.2 0.4 0.6 0.8 1 1.2
Strain (%)Figure 3.8 Orientation and strain rate effect for <100> and <010>directions.
800 I I , I
700
600
500
Un 400
C,,S300
200 0 sec
I sec 1100L
0 2 4 6 8 10
Strain (%)Figure 3.9 The <001> orientation strain rate effect.
55

The "x" symbols in these figures are the failure points foreach specimen. With an increase in strain rate for the <100>direction the average failure stress increased from 210.3 ± 46.2MPa to 303.3 ± 5.4 MPa, and for the <010> direction theincrease was from 212.9 ± 23.2 MPa to 308.8 ± 21.6 MPa. Forthese two directions there appears to be a strain rate effectsince the errors in failure do not overlap. For the <001>direction the increase was from 628 ± 30.4 MPa to 707.6 ± 51.4MPa, although the average values of failure stress aredifferent there is an overlapping of their errors. This makesthe increases in failure stress suspect, and more experiments needto be conducted to establish limits for data scatter. Thefailure strain and modulus for all directions were not effectedby the increase in strain rate. For the <100> and <010>direction the average value of strain and modulus were 0.81 ±20% and 28.3 ± 6.7 GPa respectively. For the <001> the averagevalues of failure strain and modulus were 7.73 ± .48% and 12.9 ±1.1 GPa respectively. Table 3.7 list average values ofdensity, strain rate, failure strain, failure stress, modulus,andpoisson's ratio.
For applications, i.e., simulation, which do not find the smallincreases in failure stress obtained in the 1 s-1 experiments ofinterest the data has been placed into two groups the <001> groupand <100> plus <010> group. These two groups consist of data acboth strain rates and both square cross-section and cylindricalspecimens. Using the least squares fit, the <100> plus<010> data was fitted with a linear curve,
S(MPa) = 2.59 + 307(E)(%) (3.30)
The average failure stress and failure strain was 234 ± 49 MPa and0.81 ± 0.20 % respectively. The same treatment of data was appliedto <001> results to yield the linear relationship;
S(MPa) = 42.7 + 83(C)(%) (3.31)
with average failure stress and strain of 668 ± 58 MPa and 7.73± 0.48 % respectively.
56
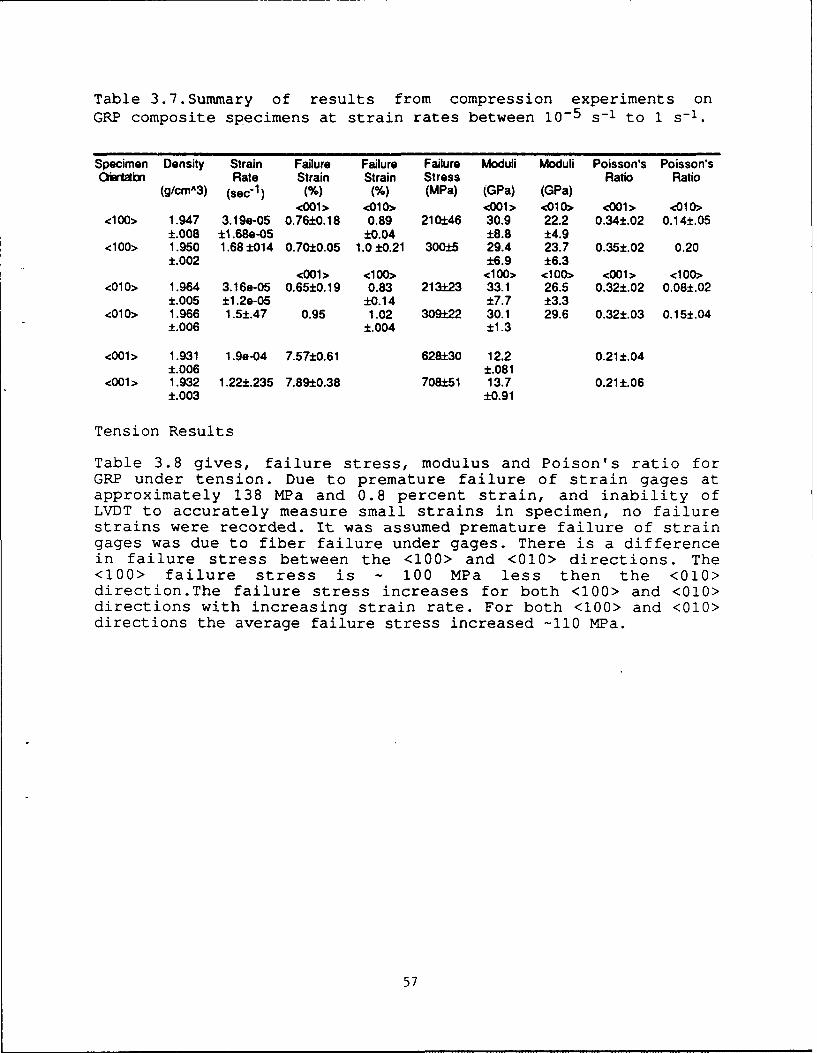
Table 3.7.Summary of results from compression experiments onGRP composite specimens at strain rates between 10-5 s-1 to 1 s-1 .
Specimen Density Strain Failure Failure Failure Moduli Moduli Poisson's Poisson'sOniartn Rate Strain Strain Stress Ratio Ratio
(g/cm^3) (sec"1) (%) (%) (MPa) (GPa) (GPa)<001> <010> <001> <01O> <001> <010>
<100> 1.947 3.19e-05 0.76±0.18 0.89 210±46 30.9 22.2 0.34±.02 0.14±.05±.008 ±1.68e-05 ±0.04 ±8.8 ±4.9
<100> 1.950 1.68±014 0.70±0.05 1.0 ±0.21 300±5 29.4 23.7 0.35±.02 0.20±.002 ±6.9 ±6.3
<001> <100> <100> <100> <001> <100><010> 1.964 3.16e-05 0.65±0.19 0.83 213±23 33.1 26.5 0.32±.02 0.08±.02
±.005 ±1.2e-05 ±0.14 ±7.7 ±3.3<010> 1.966 1.5±.47 0.95 1.02 309±22 30.1 29.6 0.32±.03 0.15±.04
±.006 ±.004 ±1.3
<001> 1.931 1.9e-04 7.57±0.61 628±30 12.2 0.21±.04±.006 ±.081
<001> 1.932 1.22±.235 7.89±0.38 708±51 13.7 0.21±.06±.003 ±0.91
Tension Results
Table 3.8 gives, failure stress, modulus and Poison's ratio forGRP under tension. Due to premature failure of strain gages atapproximately 138 MPa and 0.8 percent strain, and inability ofLVDT to accurately measure small strains in specimen, no failurestrains were recorded. It was assumed premature failure of straingages was due to fiber failure under gages. There is a differencein failure stress between the <100> and <010> directions. The<100> failure stress is - 100 MPa less then the <010>direction.The failure stress increases for both <100> and <010>directions with increasing strain rate. For both <100> and <010>directions the average failure stress increased -110 MPa.
57

Table 3.8. Results of tension experiments on GRP with twodifferent orientations.
Specimen Strain Rate Failure Modulus Poisson'sNumber Stress Ratio
(sec-1) (MPa) (GPa)X-3P-1-14 1.0e-04 467.0 21.9 0.09X-3P-1-17 1.0e-04 474.6 23.9 0.07X-3P-1-10 1.0 611.4 22.7 0.23X-3P-1-13 1.0 595.1 26.7 0.21Y-3p-1-3 1.0e-04 564.1 19.5Y-3p- 1-5 1.0e-04 569.5 20.9Y-3p-1-2 1.0 635.8 20.5Y-3p-1-4 1.0 703.0 14.5 0.14
(d). High Strain Rate Compression In The Thickness Direction:
This section deals with the high strain rate experimentalprogram.There were five high strain rate experiments conducted inthe thickness or <001> orientation. The high strain ratecompression tests were conducted using a Split Hopkinson PressureBar (SHPB) .The bar consists of a striker, gun barrel, gasreservoir, input bar and output bar. A specimen is placed betweenthe input and output bars. Nitrogen gas is compressed to apressure required to obtain the desired striker velocity. Uponrelease,the gas expands down the gun barrel propelling thestriker. The striker impacts the input bar causing a stresspulse to propagate through the bar. When the pulse reaches thespecimen, some of it is reflected and some of it is transmitteddue to the impedance mismatch between the specimen and thebars.These pulses are recorded by strain gages placed on the barsand transferred to computer for analysis. The stress and strainare obtained from the recorded pulses by the following relations
Aba=Eb-e t(t)(3As (3.32)
L (3.33)where
0r = stress
S=strain rateEb= Youngs modulus of bar
C1 =longitudinal sound velocity of bar
Ab=Cross sectional area of bar
58

L =specimen length
As= Cross sectional area
Er= reflected pulse as function of time
Et= transmitted pulse as a function of time
Strain is obtained by integrating the strain rate vs time trace(Eq.3.33). This data is then converted to true stress and truestrain.
As described in the earlier section, the medium rate tests showthat only the through thickness direction ,shows same observablestrain rate dependence, or in-elasticity in compression.Therefore, this was the only direction deemed worthwhile forconducting Split Hopkinson Pressure Bar experiments. Fiveexperiments were conducted. In these experiments two pulsewidths were used to strain the specimen either to failure or belowfailure as indicated in Table 3.9. Two tests were replicated toinsure repeatability. The specimens were right circular discs.Ofthe five specimens four were 0.6 cm in diameter and 0.3 cmthick.The remaining one was 1.5 cm in diameter and 0.75 cmthick.The choice of these two geometries was to investigate theeffect of scale.
Table 3.9 Conditions of Split Hopkinson Pressure Bar experimentsin <001> direction of GRP composite.
Specimen Pulse width DiameterZs-1 80 Lsec 1.5 cmZ207 80 psec 0.6 cmZ208 80gsec 0.6 cmZ211 40 gsec 0.6 cmZ212 40 gsec 0.6 cm
Results
59

500
o400
cn300
200207
uw -e-Z211D -- Z21 2rr100 1---0-ZS-1I
0 I I I
0 0.02 0.04 0.06 0.08 0.1 0.12TRUE STRAIN
Figure 3.10 Stress - Strain for GRP Composite in the <001>direction.
The results of the five experiments performed on GRP composite inthe <001> directions are shown in Figure 3.10. Only the non -linear portion of the curve is shown. As seen from the figure,no effect of scale is seen for the two geometriestested.Determination of failure is made by examining thetransmitted and reflected pulses. Upon failure, due to the freesurface created in the specimen, the pulses drop sharply tozero.This occurred only in the case of specimen Z2-7. From thisspecimen, failure stress and strain were calculated to be 374 MPaand 0.11, respectively.
(e) .Summary:
The results of experiments performed on GRP show that:
(i) It deforms like a transversely isotropic composite.
(ii) Directional sensitivity
Stress - strain loci under compression in the transverselyisotropic plane i.e., in < 1 m.0 > and in < 001 > directionsup to the respective failure strains in these directions aregiven by equations 3.30 and 3.31
60

a=2.59 + 3076; £<0.85, for<Im0> (3.30)
a=42.7 + 83 C; E<7.73, for <0 0 1> (3.31)
where a is in MPa and E is percent strain.
(iii) Strain rate sensitivity
The estimated value of failure stress under compression inthe < 001 > direction at 4000 per second is only 374 MPacompared to 628 and 708 MPa at the strain rates of 10 - 4 and1 per second,respectively.
Values of failure stresses under tension in both < 100 > and< 010 > directions are 519 ± 55 at strain rate of 10 - 4 S-1and 636 ± 47 MPa at strain rate of 1 s-1, respectively.
(iv) Finally, since GRP does not appear to deforminelastically up to its failure , the complete set of elasticconstants data can be used to calculate strain developed inGRP in any arbitrary direction under compressive and tensileloading.
(f).Future Work:
The future work on GRP will be done to determine and to elucidateits shock wave response in the < 001 > direction and to understandthe mechanics of delamination under impact loading. The abovetwo facets of deformation of GRP under shock wave loading will beinvestigated by conducting controlled one dimensional shock waveexperiments in which GRP will undergo either a completecompressive and release stress cycle or a complete compressive andrelease stress cycle followed by another cycle of tensile waveloading and unloading. Care will be taken to recover GRP fromthese types of .shock wave experiments to determine themicrostructural changes brought about in the GRP specimens due tothe above mentioned stress histories. The idea behind conductingthese experiments is to investigate the conditions required toinitiate the process of delamination in GRP. It is expected thatthe results of these experiments will improve our currentunderstanding of delamination process in a transversely isotropicfiber reinforced composite. A few additional two dimensionalimpact experiments will be carried out delineate the role ofconfinement on the delamination of this composite.
REFERENCES
[3.1] Martin, A. G. 1976. Phase Velocity Measurements inDispersive Materials by Narrow Band Burst Phase Comparison. ArmyMaterials and Mechanics Research Center, Watertown, MA: AMMRC TR76-22.
61

[3.2] Papadakis, E. P. ,Jr. 1967. J. Acoust. Soc. Amer. 42: 1045.[3.31 Love, A. E. H. 1944. A Treaties on the Mathematical Theoryof Elasticity. New York, NY: Dover Publications.[3.4] Green, J.L, Emsli, J.F,.and Chou, S.C.,The Application ofLaser Speckle Interferometry to Measure Strain at EleQatedTemperatures and Various Loading Rates, MTL TR 90-23, May 1990[3.5] Fazle J., Goeke E.,and Nunes J, Characterization of ThickGlass Rienforced Composites, MTL TR 92-43[3.6] Robertson, K.D., Chou, S.C., and Rainey,J.H.,DesianandOperating Characteristics of a Split Hopkinson Pressure Bar&aratus, AMMRC TR 71-49, November 1971
62

4. STRESS WAVE EXPERIMENT AND ANALYSIS UNDER BALLISTIC CONDITIONS
(a) Backgzound:
The shock response of GRP materials is complex in nature. Researchefforts to evaluate and determine the stress-strain response in GRPunder shock and penetration loading conditions have been minimal.
Unlike in metals, the shock stress amplitude in GRP rapidlyattenuates and the wave disperses. Since the amplitude and loadingduration greatly influence damage initiation and propagation, it isessential to experimentally measure these quantities and develop ananalytical model. For this purpose, we considered an impact testin which a thick GRP target with embedded piezo-resistive(manganin) stress gauges was impacted by a steel projectile of 20
mm diameter and about 7.5 mm length.
One of the difficulties in predicting dynamic behavior of a GRPcomposite is that the material delaminates during ballisticpenetration. Interpretation of the measured stress response willbe difficult when several types of damage mechanisms operate insidethe target, simultaneously. Therefore, in order to develop astress wave propagation model, one must establish a thresholdstress condition for damage initiation by eliminating 1) fiber-cutting in the target due to projectile penetration, and 2) targetdelamination.
For this purpose, a threshold level impact velocity of about 350m/s was experimentally established. When the GRP was impacted atvelocities below this threshold level, the stress gauge responsewas assumed to be entirely due to the shock wave propagation. Thisassumption was further confirmed by the posttest observations ofthe impacted panels in which the fiber cutting and delaminationwere absent.
(b) Test Method:
The projectile chosen was a modified 20mm FSP (Fragment SimulatingProjectile) with a flat face and somewhat rounded back surface asshown in Figure 4.1. The mass was approximately 250 grains (16.2grams). The projectile was launched by conventional powder guntechniques out of a 20mm gun tube with a 1 in 20 twist.The basic target configuration consisted of three (front, middle,and rear) GRP laminates with thicknesses, 9.53mm, 9.53 mm, and 25.4mm respectively. The laminates were roughly 0.3 x 0.3 meter wide.A relatively thicker rear plate was chosen to assure that therelease waves from the stress-free rear surface of this plate wouldnot interfere with the stress measurements.
The target configuration is schematically shown in Figure 4.2. Twomanganin stress gauges, one on the top surface of the middle plate(plate 2), and another on the top surface of the bottom plate(plate 3) were respectively bonded using Perma-Bond 910 with acatalyst supplied by BLH electronics.
63

The three plates were then carefully assembled with the impactpoint aligned along the axis of the stress gauge. The plates werebonded together using Epoxy Patch Kit (0151 clear) supplied byDexter corporation.
(c) Instrumentation and Data Acquisition
A two channel pulsed power supply and a digitizing 10 mhz, 12 bitoscilloscope were employed for data acquisition. The pulsed powersupply and the Wheatstone bridge combination are shown in Figure4.3. The power supply has two independent channels so that twogages can be installed each with separate 50 volt excitationsources. Upon triggering, a silicon controlled rectifier (SCR) isactivated allowing a 50 volt charging capacitor to be dumped acrossthe bridge powering the manganin gages. Dynasen manganin gageshave an element size of 6.35mm x 6.35mm, a lead length of 158.75mm,and a nominal resistance of 47 ohms.
Two "make screen" circuits are used to trigger the data acquisitionequipment and to record the time-zero of the impact. The makescreen is a 100 mm x 100 mm conductive circuit printed on a 0.05 mmthick mylar sheet. The projectile's contact with the screencompletes the circuit which produces a 7 volt square-wave output.The first make screen is placed approximately 75 mm in front of thetarget to simultaneously trigger both channels of the power supplyand the oscilloscope.
The power supplies were triggered in this manner to allow anyinitial transients and instability in the power supply to subsideduring the first few microseconds after activation. The secondmake screen is placed in front of the target to record the impacttime-zero to which all subsequent shock pressure signals aremeasured.
The gages are initially balanced under a no-load condition byrepeatedly exciting the bridge and adjusting a balancingpotentiometer until a voltage output of zero is achieved. Once thebridge is balanced, the gage is calibrated by a series of resistorsof pre-determined values that are used to shunt the bridge tosimulate a loaded condition. When the gage is stressed due toshock loading, the resistance change in the gage leads to voltagechange with respect to time and this corresponding voltage historyis recorded by the oscilloscope. Using calibration factorsprovided by Dynasen, the voltage data is then converted into stressmeasurement data.
(d) Test Results
The accurate impacting of the FSP type projectile at the center ofthe front plate was accomplished by performing a series of trialand error tests on available E2 glass/polyester panels. However,in the subsequent test series, the S-2 glass/polyester GRPlaminates were used. The test details are summarized in Table 4.1.
64

The surface of the GRP laminates was found to be very rough anduneven. The initial attempt was to keep the bondline between thelaminates to be very thin (less than 500 microns). However, whenthe laminates were bonded together with the gauge package, theinterface (glue) layers were seen to be relatively thick (about 1mm).
The measured stress histories fcr the two successful tests (seeTable 4.1) are shown in Figure 4.4. Since the velocity in test#T41-93-4 was lower by 40 m/s than in test #T41-93-2, the stressamplitude of front gauge was also lower. However, the rear gaugein the lower velocity test registered higher amplitude. The slopeof the elastic waves in the front gauge response compared very wellbetween these two tests; however, the rear gauges showed differentslopes. Since the impact location in test #T41-93-2 was notexactly at the center, this offset could introduce a significantdifference between these two tests. Additional tests with minimumoffsets are needed to establish repeatability of the tests as wellas the scatter due to material variability.
Table 4.1: Tests on GRP with B-2 reinforcement
Target Component HitThickness (mm) Impact Location
_ Velocity (mm)Test # Target (m/s)
ID Plate Plate Plate Cc...nents1 2 3 X Y
T41-93 38381-2 9.91 9.93 25.4 411.4 5 12 Projectile-1 -1 hit above
gages. Nostress wavewas detected
T41-93 38381-2 9.98 10.01 25.4 285.6 4 2 Successful-2 -2 gauge
I _measurements
T41-93 38381-2 10.16 10.10 25.4 331.9 4 4 First gauge-3 -3 broke during
impact
T41-93 38381-2 9.88 9.42 25.4 246.0 1.5 -1 Successful-4 -4 gauge
measurementswith a smalloffset
(e) Preliminary Analysis
The primary objective of the computational analysis is to determinethe critical need for appropriate EOS (Hugoniot) data. Thesecondary objective is to interpret and analyze the manganin stressgauge data. The 91 version EPIC code [4.1] was employed toaccomplish these objectives.
65

There are two essential requirements in the EPIC-code modeling ofGRP laminates under shock and penetration loading conditions. Thefirst requirement is the availability and development of theequation of state (EOS). The EOS describes the thermodynamicallybased pressure-volume relationship. The second requirement is theconstitutive relationship which describes the flow stress variationwith respect to strain, strain rate, temperature, and pressure.Therefore, availability of EOS and constitutive models areessential in any realistic and accurate analysis using advancedfinite element computer codes. Since the EOS and constitutivemodels are not readily available for the S2 glass/polyester GRPmaterial system, models that are applicable to metals were used toexplore the characteristics of GRP under shock loading.
The EPIC code was employed in the preliminary analysis of theballistic experiment. The GRP was modeled using simplistic EOS andmaterial descriptions. The GRP was described as an isotropicmaterial using the through-thickness properties reported in Section3 of this report. These properties are shown in Table 4.2. TheEOS was described simply by a linear relationship (P = Key) betweenpressure (P) and volumetric strain (eJ); K is the bulk modulus.
Table 4.2. Properties of GRP used in the Simulation
Density (g/cm) Young's Modulus Poisson's Ratio Average Flow(from Table 3.1) (GPa) (from Table 3.12) Strength (GPa)
(from Table 3.12) (using the quasi-static tests datafrom Table 3.11)
1.949 12.2 0.2 0.667
Test T41-93-4 was simulated using the 91 version of the EPIC code.The target and projectile were discretized by a finite element meshwith a total of 2345 nodes and 4520 cross-triangle elements (4.1]as shown in Figure 4.5. The steel projectile was modeled as acircular disk with 7.5 mm length and 10 mm radius. The GRP targetwas assumed to be a plate of 100 mm radius and a total thickness of44 mm. This radius is sufficiently large enough to delay thearrival of release waves from the lateral boundaries. Thus,similar boundary and loading conditions on the target were employedbetween the computational modeling and the experiment.
The calculated stress histories at the top and bottom gaugelocations are compared with the experimental data in Figure 4.6.The stress levels in the experiments were significantly higher thanthe calculated levels. The pulse durations between the simulationand the experimental measurements for the two gauges matched well.However, the stress rise time in the test .:as much larger comparedto the simulation. Since we employed a simplistic EOS and strengthmodel, the dispersion of the wave is not realistically modeled inthe code. Therefore, it is not too surprising to see smaller risetime in the EPIC simulation.
66

Since the shock impedance was calculated using the through-thickness elastic properties and material density of the GRP, thecalculated stress amplitudes are expected to be higher than thegauge measurements. However, the simulated stress amplitudes weremuch lower than the measured amplitudes as shown in Figure 4.6. Acritical, examination of the experimental technique and the codeanalysis suggested the following areas for future investigation.
1. The gauge package between the two GRP laminates was too thick(1 mm). There is a strong possibility that the gauge responded tothe plastic straining in the surrounding bond layer.
2. The stress gauge calibration had taken into account only theresistance change die to the stress applied normal to the gaugesurface. This is always true under a planar impact where thelateral strains are relatively low and the pressure across thegauge surface is uniform.
3. Since the bond layer surrounding the gauge deformssignificantly, this deformation introduces stretching of the gauge.Therefore, the recorded voltage includes the effects of both stressand strain. To accurately measure the stress, the straincontribution should be subtracted out from the measured voltagerecord.
4. In the EPIC simulation, the bond layer was not modeled.Therefore, the rise time in the modeling will be shorter than therise time in the test. Additional simulation with the modeling ofthe bond layer is needed to evaluate the effect of this layer onthe rise time.
5. Hugoniot data must be obtained from the plate impactexperiments for a realistic EOS description for the GRP. The codeanalysis with an improved EOS will provide meaningful values forthe shock amplitude.
Reference: [4.1] Johnson, G. R. and Stryk, R. A., "UserInstructions for the 1991 Version of the EPIC Research Code,"WL/MN-TR-91-53, Eglin Air Force Base, FL, (1991).
67

I00~o.0 - m8*O--
Az. H - 0OOO+OCO
++
000
Cl
01)
~~002
68

uLJ
CDC
0
Lu C
-j
o 0-69
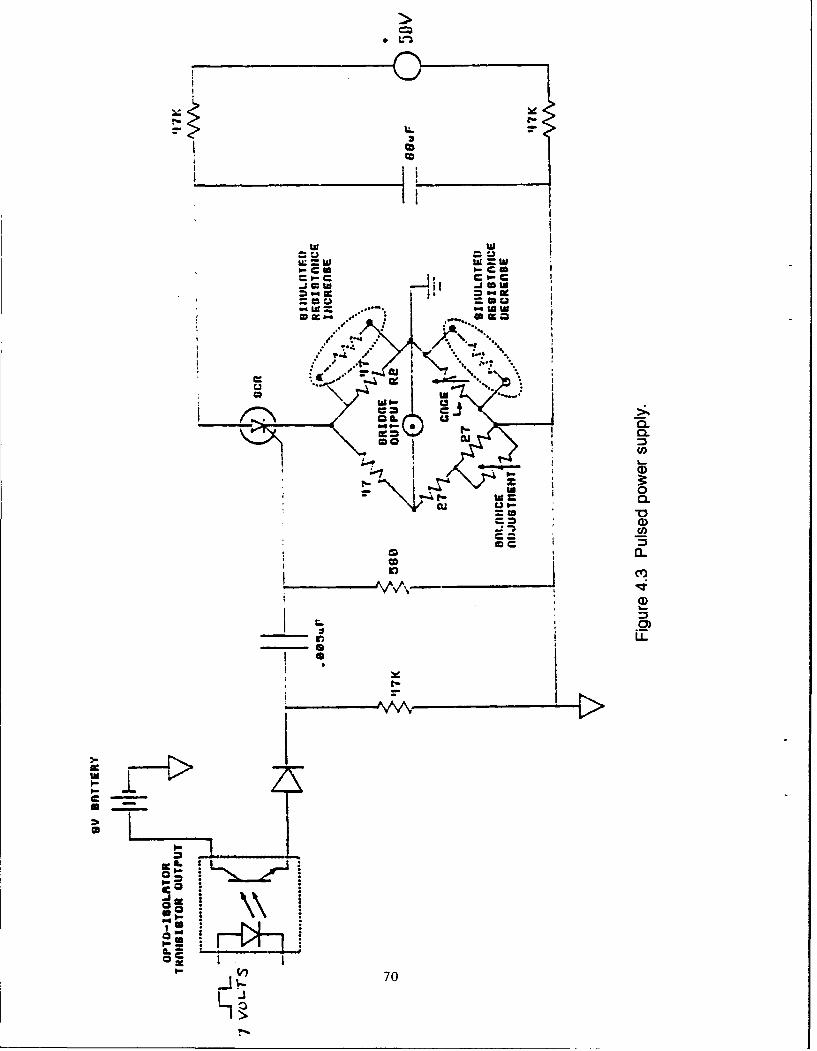
I I lw w
~~co
-j ago
a i
* .4-
0:
0 C,,
cc
~Vw 0.coS
-C l . , U)l
K)r
70,
U -. .t- / • . , ..
I ICt) 70
,LV,•

Stress MeGsurements .nGRP BPl I lsstLc Testts
4-
rn--.-'- Top Gouge (T41-93-2)<•-u-a-- Bo t tom Gouge ( T41 -93-2)
0- Top gouge (T41-93-4)O3 A-'-'-- Bottom Gouge (T41-93-4)
0
[H2
0
0 20 40 60 80
TINE MHICROSECONDS)
Figure 4.4. Measured stress histories at the gauge locationsin tests# T41-93-2 and #T41-93-4.
71

EPIC POST PROCESSOR POSTI (1392-2) 1509llsS 12-Oct-932-0 AXISYNNETRIC WH6ETRY 1ITHOUT SPIN
TRIAL ,CASE I, TINE :.1011111i; CYCLE I
- 1.00
0D
x0 .75
0 .50
0.25
(n
-0 .025
-1 .0 0.. I ....... ...-1 .........0 -... 0.0....1.0.1.
.... ... . .. ... . . .. .. .. ...I ......... R... A X IS.................
Fiur..5. iit.lmetmehfr.h.roetietrgtco.gra.n
.. .. .. .. .. .. .. .. . . .. .. .. .. . 7 2. .

Compar" tson of CodGS tmuI a t, ton w t th Do toe
3-Top Gauge DATA
,-- -Bo Lt orm Gouge DATA< -u-e-°-uTop gauge (EPIC CODE)
n -a~-Bottom Gauge (EPIC CODE)
02
0_
TINE-•- MICROS ug (EPCON ODS)
LLJF-
Figure 4.6. Comparison between stress gauge data (#T41-93-4) and
EPIC computed stress histories using a simplistic metal-based
description for the GRP.
73

5. Summary of Results and Future Work
a. Summary of Results
The objective of this effort is to develop a predictivemethodology for dynamic response of S-2 glass-reinforced plastic(GRP) laminate subjected to impact loading. The technical approachis a combination of experiments and analysis. The effort wasdivided into three parts:
Ballistic Impact DamageDynamic CharacterizationStress Wave Experiment and Analysis.
The efforts in ballistic response of GRP provide results of aglobal manner which could be used for engineering purposes and,more important, as a guideline for developing predictivemethodology and eventually as a bench mark or data base to validatepredictive capability. The results from dynamic characterizationof GRP are necessary for formulating a material model which is anessential ingredient for numerical simulation of material orstructural response under impact loading. The other importantparameters and information required in developing predictivecapability are effects of heterogeneity of the GRP on transientresponse and those of the multi-dimensional and free boundaries onthe stress states in GRP.
The progress of each part is detailed in Chapters (2), (3) and(4) respectively. The findings are collected and summarized here.
(I) Ballistic Impact Damage Evaluation
Computed tomography inspection of glass-reinforced plasticpanels has been shown to provide detailed, quantitative data oninternal delamination resulting from fragment ballistic impact.
Corollary results to the fragment impact experiments includedata on fragment depth of penetration in S-2 glass-reinforcedplastic laminate and maximum transient displacement of GRP laminaterear surface during fragment impact. These results were obtainedto assist development of dynamic behavior simulation models for theGRP laminate material.
Compression testing of both undamaged and ballisticallydamaged S-2 glass-reinforced plastic panels shows that test resultsare reproducible for replicate experiments and that compressivestrength of single-thickness panels after fragment impact cam berelated to fragment mass and strike velocity.
75

A correlation of compressive strength of S-2 glass-reinforcedplastic panels after ballistic impact with panel averagedelamination has been found. The correlation shows an immediatedrop in compressive strength to approximately 50% of the undamagedvalue for as little as 5% average delamination volume. However,compress~ive strength falls of f slowly as average delaminationincreases above five percent. Future work will further test thiscorrelation.
A preview experiment consisting of a fragment impact on atitamium-faced glass-reinforced plastic panel shows that glass-reinforced plastic laminates can suffer extensive delamination andloss of strength without direct impact by a kinetic energy threat.Induced ballistic damage to glass-reinforced laminates behindapplique armor will be a major topic for follow-on work.
(II) Dynamic Characterization
The GRP investigated behaves like a transversely isotropicmedium with the transversely isotropic plane coinciding with theplane of weave.
A set of six elastic constants required for describing thematerial behavior in the small strain region has been determined.
The GRP does not appear to deform in-elastically up to itsfailure; therefore, failure stresses in three directions and thesix elastic constants provide a complete set of material parametersrequired for numerical simulation under a quasi-static loadingcondition. The dynamic and shock response (determination ofequation-of-state) will be a major effort for follow-on work.
The preliminary results indicate that the material possessesa relatively mild strain-rate sensitivity. Further investigationin the future will clarify this issue.
(III) Stress Wave Experiments and Analysis
Experiments of a blunt projectile impacting a GRP plate wereconducted. The stress-time history at two locations in the platealong the impact trajectory was recorded. The impact velocity waskept below the threshold of initiating any damage in the GRP plate.
The EPIC code, a hydrodynamic computer program, was employedto perform numerical simulations of the experimental configuration.Due to the lack of precise equation-of-state (EOS) for GRP, asimple linear relationship between pressure and volumetric stainwas used in this preliminary attempt.
Results indicate that the trend of stress-time history at thetwo locations was reproduced; however, the details of stress waveforms were not simulated. This is attributed to the lack of EOSand the effect of anisotropy of the material. These two issueswill be explored in follow-on work.
76
b. Future Work
In the area of ballistic impact damage evaluation the workplanned for FY94 will critically test the hypothesis that averagepercent delamination of a GRP laminate panel determines compressivestrength after ballistic impact. Fragment ballistic experiments ofChapter 2 will be repeated for panels of different size andthickness than tested in this work. Specifically, panels ofdimensions 30"x30"xl.75" (approximately two times the area ofpanels tested in Chapter 2) will be subjected to fragment impact asin Chapter 2; panels of dimensions 20"x20"xl" will be tested withfragments of two sizes at strike velocities below the panel limitvelocity. The former set of experiments examines the effect ofpanel size on the results of Chapter 2; the latter examines theeffect of panel thickness.
A set of experiments will be conducted to examine damageexperienced by a GRP laminate that is the backup component in anapplique-type armor. Chapter 2 reported results of a previewexperiment on this topic which is necessarily made complicated bythe number of possible applique and threat types. For thisprogram, binary armor consisting of a 1"-thick frontal plate of5083 aluminum alloy backed with a 1-3/4"-thick GRP laminate will betested. with the 830 grain fragment at strike velocities that rangeup to the limit velocity of the binary; also a ceramic compositearmor made up of an array of aluminum oxide tiles backed with a7/8"-thick GRP laminate will be tested with a 1/2 scale model 30 mmtungsten penetrator at velocities corresponding to service velocityand 500 meters ranges for a 30 mm cannon.
Finally, the question of GRP laminates panel damage resultingfrom multiple impacts will be addressed by testing panels ofdimension 20"x40"x1-3/4" with single and double fragment impacts.The double impacts will be selected to provide both mutuallyexclusive (disjoint) damage zones and overlapping damage zones toexamine the extent to which superposition of damage can be used todetermine compressive strength after (multiple) ballistic impact.
Computed tomography inspection will be used to locate andquantify panel internal delamination; compression testing will beused to measure residual strength of GRP laminates after ballistictest. Completion of this work should provide design guidelines onresultant damage and residual compressive strength of thick GRPlaminates after ballistic attack.
The future work on dynamic characterization of GRP will bedone to determine and to elucidate its shock wave response in thethrough thickness direction and to understand the mechanics ofdelmaination under impact loading. The above two facets ofdeformation of GRP under shock wave loading will investigated byconducting controlled one dimensional shock wave experiments inwhich GRP will undergo either a complete compressive and releasestress cycle or a complete compressive and release stress cyclefollowed by another cycle of tensile wave loading and unloading.
77

Care will be taken to recover GRP from these types of shock waveexperiments to determine the micro-structural changes brought aboutin the GRP specimens due to the above mentioned stress histories.The idea behind conducting these experiments is to investigate theconditions required to initiate the process of delamination in GRP.It is expected that the results of these experiments will improveour current understandinq of delamination process in a transverselyisotropic fiber reinforced composite. A few additional twodimensional impact experiments will be carried out to delineate therole of confinement on the delamination of this composite.
A critical examination of the stress wave experiments and theEPIC code analysis suggests the following areas for futureinvestigation.
The epoxy bond in the gauge package between the two GRPlaminates was relatively thick; there is possibility that the bondlayer deforms significantly. This deformation induces stretchingin the gauge itself, the effect of which must be calibrated for amore accurate measurement of stress levels.
The reason for employing a relatively thick bond layer is tocompensate for the roughness of the GRP surfaces. In thepreliminary simulation, the bond layer was not modeled which may beone of the causes for the discrepancy between the experimental andcalculated results. The effect of this additional bond layer onthe stress calculation will be investigated.
Finally, a realistic EOS description for the GRP must bedetermined and implemented into the computer code for simulation.
78
APPENDIX
Final Report
COMPUTED TOMOGRAPHY INSPECTIONOF IMPACTED FIBERGLASS PANELS
Under contract to:
US Army Research LaboratoryAMSRL-MA-DA
Purchase Order DAALO1-93-M-S390ARACOR Project No. D004September 27, 1993
Prepared by:
Robert N. Y"•nceyDaManager, ,A*pications Ddelopment Area
Advanced Research and Applications Corporation
ADVANCED RESEARCH AND APPLICATIONS CORPORATION425 Lakeside Drive
Sunnyvale, CA 94086
79

CT INSPECTION REPORT
I. ADMINISTRATIVE DATA
Purpose: This test report discusses the test methods and results of computedtomography (CT) insrection using the 9-MeV CT System installed at Hill Air ForceBase, Utah.
Background/Objectives: This study was to investigate the feasibility of usingcomputed tomography (CT) to detect the extent of damage in impacted fiberglasstest panels. The purpose is to locate and define the damage zone in each of the shotpanels as well as determine the depth of penetration of the projectile. Smallerpanels were scanned previously on a 420-keV CT system (LAM/DE) and the resultswere encouraging. Larger panels were scanned for this study and the size of thepanels required that the scans be carried out on a higher energy CT system. TheHill AFB 9-MeV system was chosen for this purpose.
Test Dates: 10-13 August 1993
II. TEST ASSETS
Description: Twenty fiberglass panels, 24" x 24" were scanned. Nineteen of thepanels were approximately 1.7" thick and one (T'45-93-2) was 2.75" thick. Allpanels had been impacted except for one control panel (K).
System Serial Number: A-TEach plate was given a letter identifier (A-T) and the corresponding filename
contained the identifier and the slice number (i.e. A00012). Table I gives the letteridentifier with the corresponding plate serial number.
TABLE 1. Letter identifiers with corresponding serial numbers
Letter ID Plate ID Letter ID Plate IDA T45-93-1 K ControlB T44-93-2 L T28-93-3C T44-93-3 M T28-93-2D T44-93-6 N T27-93-2E T7-93-2 0 T27-93-1F T44-93-P T26-93-3G T45-93-2 Q T27-93-3H T7-93-1 R T28-93-1I T44-93-5 S T26-93-2J T44-93-4 T T26-93-1
III. CONFIGURATION
Mounting: The panels were mounted flat on four wood mounting blocks. Theconfiguration of the panel is shown in Figure 1 and on the data analysis printouts.The nylon rod to secure one of the wood blocks is always on the edge opposite theedge with the panel serial number. The nylon rod is visible in all of the CT slices.The panels were mounted with the impact side facing up and the scans began at the
80
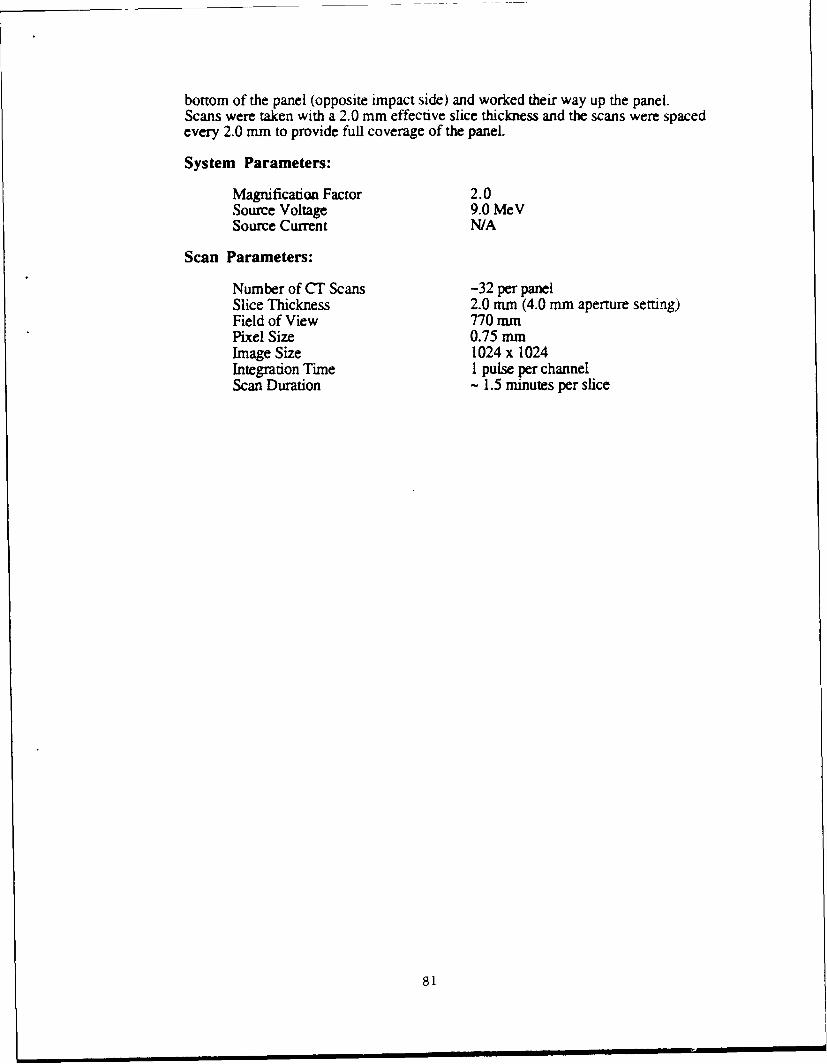
bottom of the panel (opposite impact side) and worked their way up the panel.Scans were taken with a 2.0 mm effective slice thickness and the scans were spacedevery 2.0 mm to provide full coverage of the panel.
System Parameters:
Magnification Factor 2.0Source Voltage 9.0 MeVSource Current N/A
Scan Parameters:
Number of CT Scans -32 per panelSlice Thickness 2.0 mm (4.0 mm aperture setting)Field of View 770 mmPixel Size 0.75 mmImage Size 1024 x 1024Integration Time 1 pulse per channelScan Duration - 1.5 minutes per slice
81

TOP VIEW
Wood Fixurg
ImpactSite
Scan
SIDE VIEW
Fixturing Blocks
Scan Table
FIGURE 1. Mounting Configuration for Fiberglass Impact Panels
82

IV. ANALYSIS OF IMAGERY
A summary sheet is supplied for each panel scanned. The summary sheet includesimportant scan parameters including the field of view, resolution aperture setting, slicethickness aperture setting, scan height, integration time, and image matrix. The summarysheet also includes notes on certain slices such as location of the slug and the slices wherephotos were taken. The summary sheet also includes the percent damage calculations forall slices where the entire cross-section of the plate was imaged. A curve of the damagestate vs. slice number is shown below. A trapezoidal rule calculation was used todetermine the area under the curve which is noted as TOTAL DAMAGE at the bottom right.The summary sheet also includes an illustration of how the panel was positioned on thescan table.
The damage state was determined by applying a median filter to the images to betterhighlight the damage. An illustration of how the filtering enhanced the damage is shown inFigure 2. As shown, the filtering smoothes the image and eliminates the fiber weavepattern from the thresholded image. After processing with the median filter, a thresholdwas applied to the image to just the point where the damaged area began to "break up" andbecome distributed. This is illustrated in Figure 3. The threshold is started too low andslowly increased to just the point where the damage area "breaks up" as shown when thethreshold is too high. At this boundary, the threshold is set for calculation of the damagedarea. The area of the damaged region was calculated by a routine which simply countsnon-thresholded pixels and multiplies that by the area of each pixel. The damaged area wasthen divided by the total area of the plate at that slice location to calculate the percentdamage. Some images included the slug or a high-density region right at the center of theplate. In these cases, that area of the image was erased prior to calculating the damagedregion so that those areas were not counted as non-damaged. Also, .f da .age waspresent outside of the circular damage zone (e.g pre-existing delaminations), this damagewas not considered as damaged in the analysis.
A few issues should be noted when analyzing the images. These are subtle pointsbut can be important when interpreting the images:
SA CT image is a representation of the X-ray attenuation coefficient in the sliceplane. At 9-MeV, the X-ray attenuation is due almost entirely to density so forall intents and purposes, the CT image is a density map of the slice plane. Ifthere are any damage states that would not result in a density change, the CTimage will not detect it.
• Each slice is 2 mm thick meaning that it represents an average density of theplate through the 2 mm thickness.
* When defining the slice location, the convention used in this study is that theslice location represents the center of the 2 mm slice.
* The images do represent some beam hardening which is an image artifact whichmakes the outside of the plate appear as higher density than the center. Themagnitude of the artifact can be determined from analyzing the control panel. Inthe future, this can be calibrated out of the images with some additional work, ifdesired.
V. DELIVERABLES
& CT Inspection Report• 19 - 128-MB Optical Cartridges containing CT scan data and processed CT scan
data• 100 - 8" x 10" Polaroid photographs of selected slices
83

VI. PERSONNEL
CT System SupportArt McCarty, OO-ALCJTIWND (801) 777-6080
Image Analysis
Robert N. Yancey, ARACOR (513) 427-5485
VIII. APPENDICES
Appendix A: CT System DescriptionAppendix B: Technical Discussion of ImagesAppendix C: Excel Data Summary Sheets for Each Panel
84

Original Image Processed Image
a.7
Threshold Applied to Original Image Threshold Applied to Processed Image
FIGURE 2. Piocessing Image Helps Hilight Damnage Zone
85

Threshold Too Low Threshold Too High
Threshold Setting for D~amage Calculation
FIGURE 3. D~etermnining the Threshold Setting for D~amage Calculation
87
APPENDIX A
COMPUTED TOMOGRAPHY DESCRIPTION
CT SYSTEM DESCRIPTION
The Hill AFB 9-MeV CT System installed at the Hill AFB, Ogden, UT was designedprincipally for the inspection of Minuteman rocket motor components. The Hill CT systemhas two modes of operation. First, conventional CT non destructively inspects the internalcharacteristics of a component at a specified area. Second, the system generates DigitalRadiographic (DR) images that represent the through body radiographs of the object.
The Hill 9-MeV system is a second generation CT scanner that has been operational in itscurrent configuration since 1989. Second-generation CT scanners obtain data by atranslate-rotate technique. For a conventional CT scan, the component to be inspected ismounted on a turntable located between the X-ray source and detector array. Thecomponent translates past an X-ray energy source that transmits X-rays through the objectin a horizontal plane. The component then rotates the fan beam angle between each traverseand repeats the traverse. This process is repeated until 180' worth of data are obtained(Figure A l).
The detector array measures attenuated beam strength and passes these measurements to adata acquisition computer where the data are pre-processed and arranged in a raw data setcalled a sinogram. Reconstruction software applies sophisticated mathematical algorithms(computed tomography) to the sinogram producing a cross-sectional image of thecomponent scanned (Figure A2). The display subsystem allows display and analysis of theresulting reconstructed CT image.
The current system configuration allows for inspection of components with physicaldimensions of 1500 mm in diameter, 2600 mm in height and up to 18,000 kgs in weight.The radiation source is a Varian Linear Accelerator capable of a maximum voltage of 9-MeV.
88

X- RaySource
TurntableObject
Linear
Angular Mto
Motion
Dual EnergyDetector Array
Figure AlI
Radiograph
X-raySource
Angular CT SliceMotion
Plane PFigure A2
89

APPENDIX B
TECHNICAL DISCUSSION OF IMAGES
PhotagUha
The supplied photographs are reproductions of the images obtained from LAMDE. On thetop left comer of the images is the image filename for the displayed image and theparameters for the inspection. The parameters on the left read as follows:
1. COLS/ROWS: Matrix reconstruction size (in pixels)2. X-SIZE/Y-SIZE Field of View of thr Inspection (in mm)3. Z-GANT Handling System Slice Height (in mm)4. RES AP Width of exposed detector (in mm)5. THICK Thickness of the slice collimator (in mm)6. SLICE # Slice number in sequence of scans7. INTEG Integration time in # of pulses8. SCAN Scan time in minutes9. CTMIN Minimum CT number in image10. CTMAX Maximum CT number in image
On the right side is a color bar legend that identifies the color for a range of CT values. Redcorresponds to lower density and white corresponds to higher density. On the top (white)and bottom (red) of the color bar are numbers that correspond to the top and bottom of thescale respectively.
Viewing Images on the Macintosh
The CT images taken with this study have been loaded onto 128-MB optical cartridges.The CT image files are raw data files with no header information. Each image file is a 1024x 1024 data set written as 16-bit signed integers with the bytes swapped in DEC orderformat. The images can be read into NIH Image using the import command under the Filemenu. In order to view the images in the same orientation as the images in thephotographs, the images must be flipped vertically by using the Flip Vertical commandunder the Edit menu. The processed images have been flipped and rotated so that imageswill be oriented with the nylon rod at the bottom of each image.
For viewing in DIP Station, use the open command under the File menu and select the firstslice image in the set. This will then bring up a dialog box where you set the rows andcolumns to 1024 each and enter the number of consecutive slices in the set. You shouldthen choose the "By Pattern Rule" checkbox which will bring up another dialog box whichshould be set correctly. Click "OK" which returns you to the original dialog box. TheHeader info should be set to O's and the Pixels should be set to "16-bit signed (byteswapped)" and the Alignment set to "None". Clicking "OK" will bring up the first imagein the set. Like with NIH Image, to view the invages in the same orientation as in the
90

photographs, the images need to be flipped vertically. Clicking the "+°' or "-" buttons onthe left of the image allows you to go to the next or previous slice respectively. Typing "s"will bring up a dialog box allowing you to go to any slice in the set. DIP Station is muchfaster than NIH Image and has much more flexibility. Any significant analysis of theimages should be done with DIP Station which is sold by Hayden Image Processing Groupin Colorado for approximately $595. They can be reached at (303) 449-3433.
LabelFiles
Included with the data files are label files for each slice. The label files are denoted by the"$LA" suffix. The label files are ASCII files which contain information on the scanparameters and calibration constants used. Most of this information is not important foranalysis of the data but a few parameters may be of interest. The first part of a sample labelfile is attached. Some of the parameters of interest are as follows:
COLUMNS Number of columns of data in the imageROWS Number of rows of data in the imageINCCOL Pixel width in millimetersINCROW Pixel height in millimetersRSCALE Scale factor used to convert raw image values to CT number
values. CT numbers correspond to density in milligrams percubic centimeter. Raw image values should be divided byR_SCALE to calculate CT number values.
BEGSEC Slice height location in millimetersAPERTURE Resolution aperture setting in millimetersTHICK Slice thickness aperture setting
91
SAMPLE LABEL FILE
VERSION 3SITE :HILL9MACHINE :ICT-1500NIMHDR 228NSCHDR 106TITLE :FIBRGLS T27-93-2TITLETITLEPROGRAM :RECOOPERAT :ReconstructionIMTYPE :ReconstructionRELATED :X_UNITS :mmY_UNITS :DegreesZ_UNITS :mmR_UNITS :CT NumbersDATE :16-AUG-1993TIME :09:38:36.92COLUMNS 1024ROWS 1024SECTIONS: 1COLREC : 2ROWREC : 1024SECREC : 784BEGCOL : -385.3764BEGROW : -385.3764BEGSEC : 54.00000INCCOL : 0.7526882INCROW : 0.7526882INCSEC : 4.000000RSCALE : 8.000000Z_REFRNC: 0.0000000E+00NCAL : 0NDET : 112NTRAV : 7SERIES : 10KY : 420MA : 4MSEC : 4.081633APERTURE: 2.000000SPOT : 1.500000THICK : 4.000000NTRIG : 1LOLEV : -4545HILEV : 17077
92

APPENDIX CEXCEL DATA SUMMARY SHEETS
93

lw - 10 DI-M -UqlcZ
o4 /o !r:_i1 rý-- t- 4t - -
I", pe ic,;_q~ 4
IC'4 I- IV
__ _ _ _ ____ .DL
CL' I ~-i-1!I m 11R A eJI
LA. -4
bt (4 CNI eqC 1 4C 4CN 4C4
V' lc; tlc.ý I i0- 10 ip~ q~' ~Z~Z Iq iq
000'000000'O
10 10 IC i0I-' i 0 q 0 1c; I0I0 0 tI q I0' q 1q - 4 I' 0VSri ini W ri '" - w 0 \O 0 'D 10 [ot- r- r- - t 00 00 lo 1c00100 !*'iI 7
Iq I'
_T7
F 11 .. ....
M, c; c;ICq qq IqR C ýqýc Iqp i CIqc;iq q C; C;
C 1C oocloo ~ & o o i C ý ........
>r-. fHl..I I' ' I I C Ir
94

/-7t
Ei
le (- f I& e- l &I I~ &l
l-,,1S 12 7 lýn ti 00 cl - I r - .T f C
Lk I
=o I' i, 0,I% ,) DiaI!- 0. - - 1(, r -,-. -.---- I.D--- ______
El 1 Il ,Lt a
C. oo1,i2ý 1!-I - I-- 1" -- 1~
T1 2
19 C4 1i C4 AIATA' r4 I 'lcl l ýA C4C4c rlC ,
I C~ oooItoi 0 10. 020000I20 0I!10i0; 0 0202
ýo ~ ~ ~ ~ ~ ~ ~ ~ i 00000010 o~ P1- ý o d1i 000
C- (N~c ýc . .C .- 0 . ct CV vI.i ,i1- .NTT 11-T ~w~
1 9 5 ý

S! I
I, 'IT 0%_lt,_ _ _
meI
A
C; ____tv~7
Go TI TF~feOV
'i q v i leI 'T - 1i I
96 -=I .? 0 0
I x Ii II ............c. F
o~~0 0 V) 0 ~ _
lei, ) C r "); w~kor-io
I I~ C ,4 !- - 0 ZQ
6; , 5i
I-6

-l 00r~~. )v tt 1'1W -
a___ It 1 IR -- P I. .. -I
CL *I , I
a. 12 a.0-
cooc
-- -- - - --i
-- --- t- t- -- 1- r- r- r- - i- r- -= -. - - t-- r-. -r--
FA8TKVK --i--0iIo0 C 4- 416 N Q"I 'o 01 4'TI o c% nk n1nI Qý -r-r -r;c0 0 0 0 1a ýr
:01I I )COcco000=0oo0OC0c q Týqq-4 < K41 I -z.c('PNE'Nt4''
1 ~ ZUI~
LLI 0 0 qI q_____CIO_=_q_
ýe C C e q 4 -4C I4 4 4r4C- C4e4ý(4 4 Cý,ri C4e97l

I~~ I II& i I
'All
*c Im I I __
00 I fnl,,Ion r- r rI 2 i.I4r:
ut T_ I tc 1 IS
IC IE E
iz
I' PV V q "
A .9AV AAAiC1,I Icg AA C IC4Arl4AAA 1coo c c o 00 hI01 .0.O I
00 p(N 'Tdc I~0o~'D ~ 0 'oco 4 ýQ
~D -I- -- -- -- .L- 0_ _ _ 0000 0
.._ ...... .~~~C C;999oC;&&TC;ooo4;99 o0
rq-
I1 H
98
7E V
I I , i fr - fW4 lep -14 1W)-'~ C tl. ~
Cal IM V 1&:11`t
nI q Iq
9..
- - - -- -- - - - - - - -C
o ~00
e4 000q000000l000000 C4-cc0 001D 00 0 CAit o
............................................................ .. ........
-r r
0~ 00I 0~ 0 A I0.00 0000 000. ....... .....O
u~ E EN~iEE~lEENEENINENNENEENE 1 ENN 1 ENe~t4~eE i
'a~~ -NN(fl
00 00 lieII
010 10 000 T I 09

LL.
ip:
In 7-i. *
C-4 (.4 . C'
r,0000
VF-cc f'0-i'.V .~~o .-7!
%fi ,ý;,,ý r,ý1 clo o IV)fntr
1011- 0100
No
C:6.7
_ A ___
1(I 0c U4;.
IcI 1 ~'0 0i - 1- 0 I , I F-
:1 12 "' 0 W) %c T-0 In 10 I~IAD-( 71 NO 1010 IV 00;0
ell ~ ~ m m~ 00:00 -. 1-- 4Fo 0 0ý
IrF e4
to1I WF
-r -~ ot-- 00 ~ Iaccc m m A ,h
- 00000 0000000 0000000 000 000
-11 --
'0
CIO 00 000CIO0 00I00 ql;0 000 q q qqciqqqqq ll
C Iq II ------
O!C 00 0 000 000 00 p0 00e,r- t- i-. I-- rr r- -r- t- ,- I- 7r- it r- r- -r- -rl- el- r- lr- -r
-.: 1w r 0-0 ' 10 IN i) t I I
I(4 -I ~f~ if 0-NI ' ~, r- 00,01 W) 0010B 2J1~~~~ C4,______
101

co en '01 0 00M0 ll o ;
I* le le *RleCts II en- 00O <KI q
00I IC m- ,0 i !Tc14
CL,. ,
CIDI
No 0 I
____
I..i.~00Im00 0c1eq ý '0 00 10 eC4 0ico'\0 0j -TJ
V n%\0\0 S 0\000 -rlf-00 0000 010
0-CIOCIO 0~~Cr 00 ciol~ C
102

i:7
ITI
____ IC Ici L"o16 j6 106 Cc -Z .. Z'46 1. I, J..I %- r% IC-
EE
Cc iial
co
- ~-0
a 9.
00200 00 0 02 0c
f 0 22. 2 2 20 0 0 0 1 2 2 20 1 2 2 2 0 0
w00e ný 00 000000wN' 0100 00v 4n1nV MA oN 04 ,r r -r 00 00 0 7 ,0
3 77-7c4 c4 Icie 4Nc~4c s~slr 4e 4c,4ý4J4ý4C 4r
0%~~~~ ..... ..O~ u 0r-c 0 b
103

-1 : C' 1 2T
TNi-. I
00 r- 'D C -101 w l iq
C I I CL U C l
000000000 ar f -V-0000 00 00w0%0%
o- DC 0 CDo
T sma0-ten1-
10

e4 II
ALA
A CN0'I70 OrpE C0 f -~t.0'~ 0~.~
IC4 te IV) 1 "C IC'!O 0'a JG00 000 NU lN0 V
C0lC- I'YNC', ~i E~.
75NENE-.'~
i5<-l'
CL ENL EN.
* ~ ~ S C4 r4 o r-~l eq C4-i~ .E 0 ~ ~0 4CI 47 1
2 ~ mrD
K-C ___5
C4I 4CN qC C-4C C4 4 " 4T
e) O 0 00 0 00 r40 0lf NO0-0 ,C41FI 4 4C4agw- i
a-05

7-c
00 0
0. -ýN ý
I- U't
'f11i=I~c 'en' I- iD 0 ict A
-T -R IfIf-- -Ienc IN~I IN IN CI'4
2, r'cIc I -) N VN IV,).~i -% -r too'N0
ig [ v i7 ria 1- p-T Rr~ioi-c a ' ~ ' -
* ' r4
!717 -- I
C.. 010 ( 011111{ 001 000010i C10 -0160too,
. . . . . . . . . . . . . . .......
CL c' ___ Ic Iq ;ccCc 10 q' IO0 100 00 0t 0 00C 0iqIN IN IN N IN IN c4 c c4 INN te, ý r40 le-a w4 e c-4Ne r N ik-i I N c4 c4 jc
too it--isiti-ccIf- io0 0foli ijO. 00 0110 000C= 0 cl= IC
Irir~ ..0..01 ... -
i- It- rf- ir-It Ifr- - ir- le- Pr- r-
:Q wI Q:
Q ý!ýiQ IQR'.Qg Q; QW
106
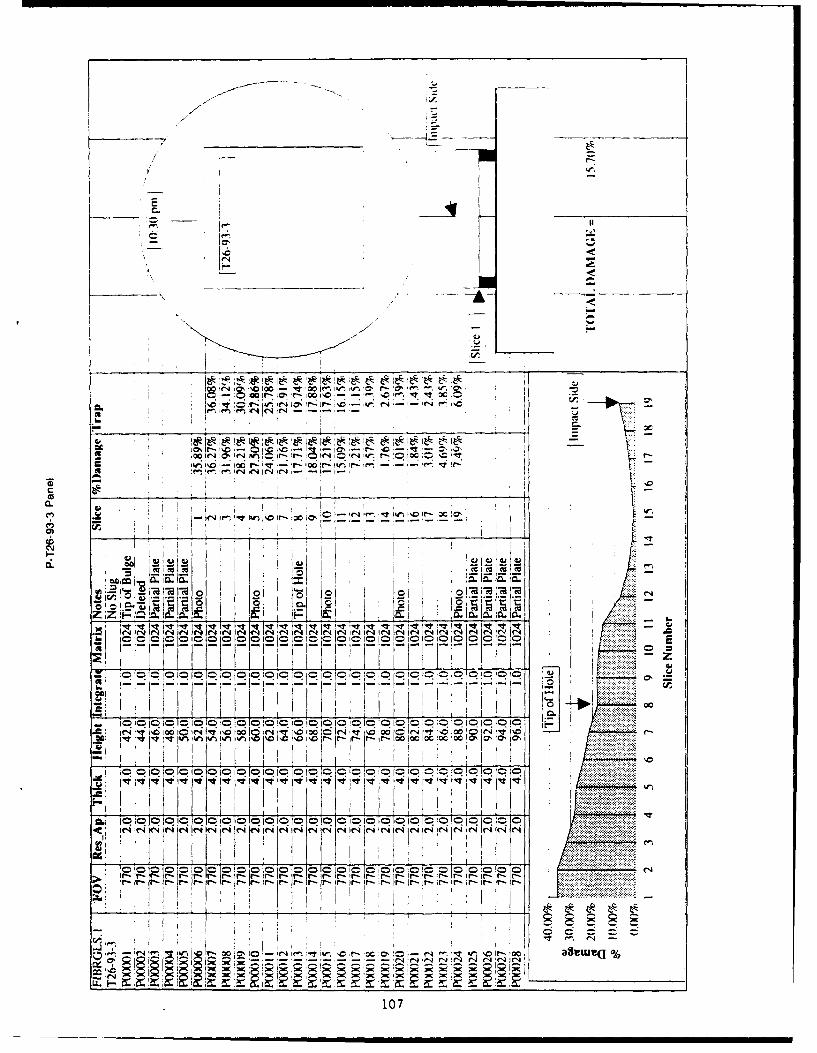
7 4 iDto -- r0 ml),n a -t-r.' -
610 cý :- 0: '
z~ lz
T- 7` -1 -. .
6.
ITI
qo toi~ .ip~ C qpIofoq
q .q Iq Ic q.I-....- 1? -c toCqI qP q(I
;oIIr- liR- I I r -C)ý, 0 o..
`- l rI I-
im 'v. 0 I r -! oc c, Iý-q I-C
107
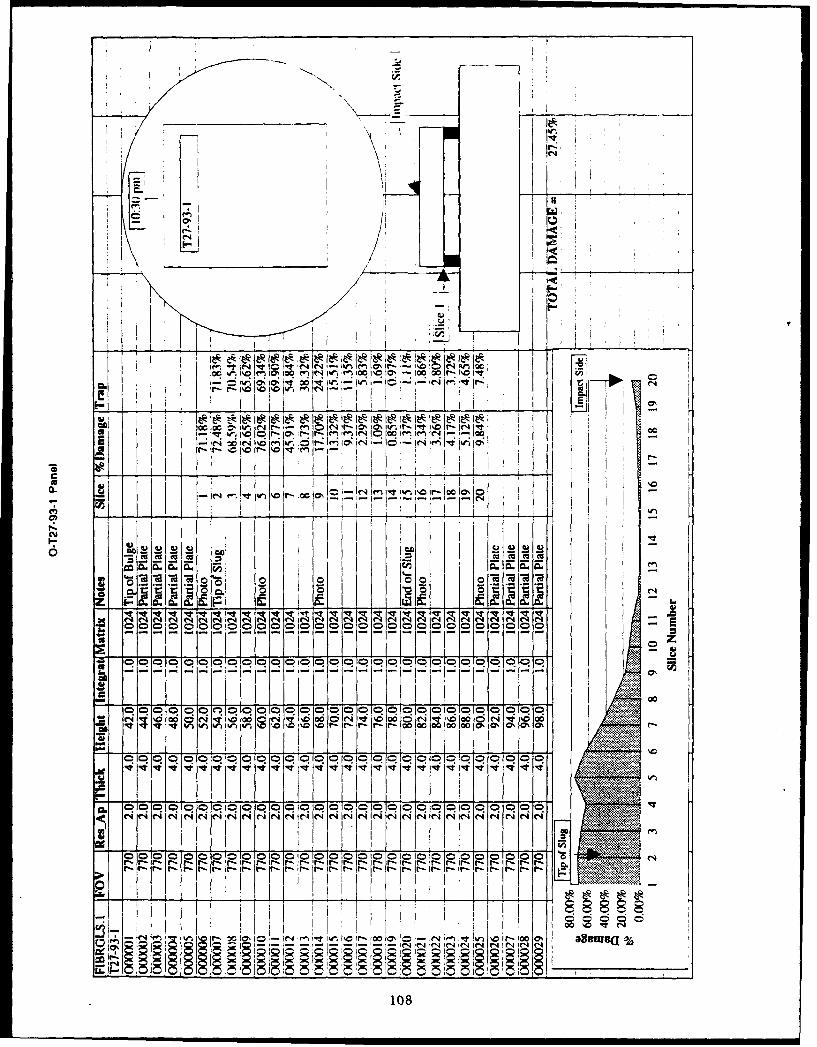
10 I m ImIN
'n r "~~ 4 fI , I II
IN " 1% 'r, o 1 '-. c",i~e
IN.
6 IIMZ, 101 10
A AAAAl A I11
Do 'c o ID r r-r00*0 00 000 ca" 01
.... . ...-- - - - -.- -- -- - - - -
N4 IN F N e4 NC4 NNNNN IN N~ N (NN N (N N (N N (N
r-- I- r- I -. r r- r - r - r- t- -~ r-ir*-. Ir- rr- t-r-. ir- r-r- c
ICr.C RIO OWWC
108
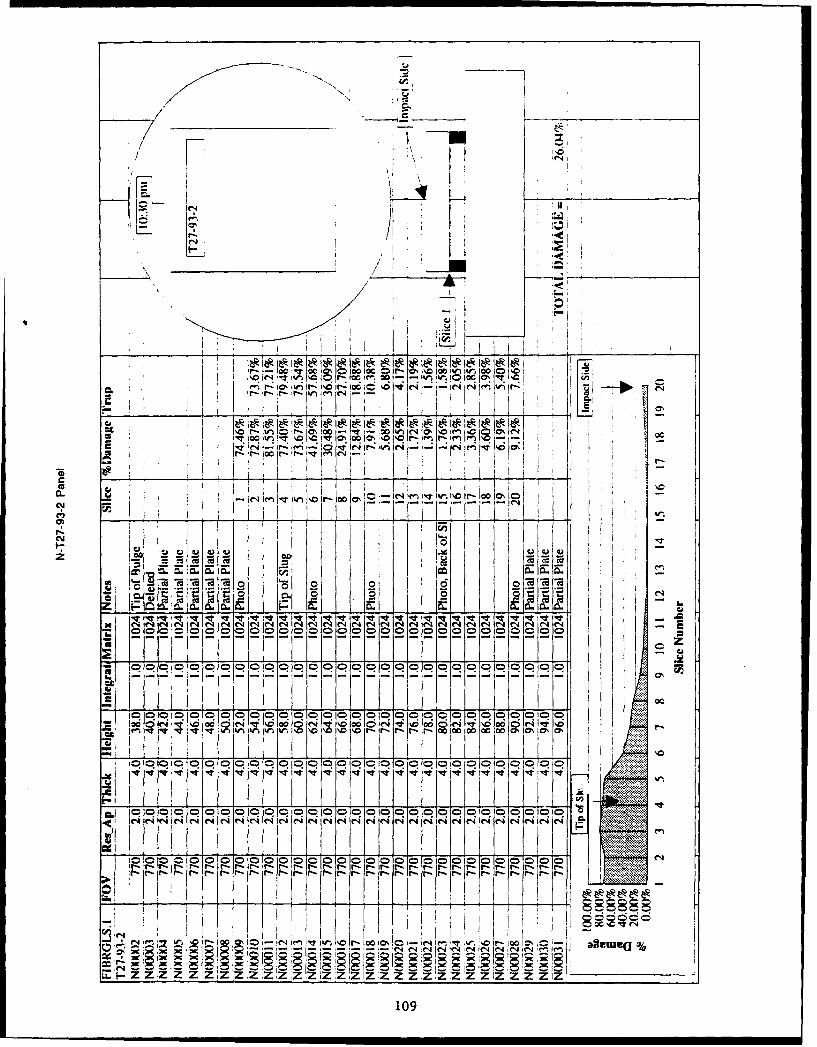
im ir
I)t- 'r o; %
Nlr41'W
CL~N 'W.- -0CC-
7 IN
CII
'~ - "'' I, V. V0 Vt VC -0 I I e I - -, - p
II 00 0 O'
ICT
I I., .cr- 0 1 IN Im I .'M0/
_1 CD CI,
I- I' - LillZ -ZZZ 'tIz2 2ýZZZzzzZ
~ I~i109
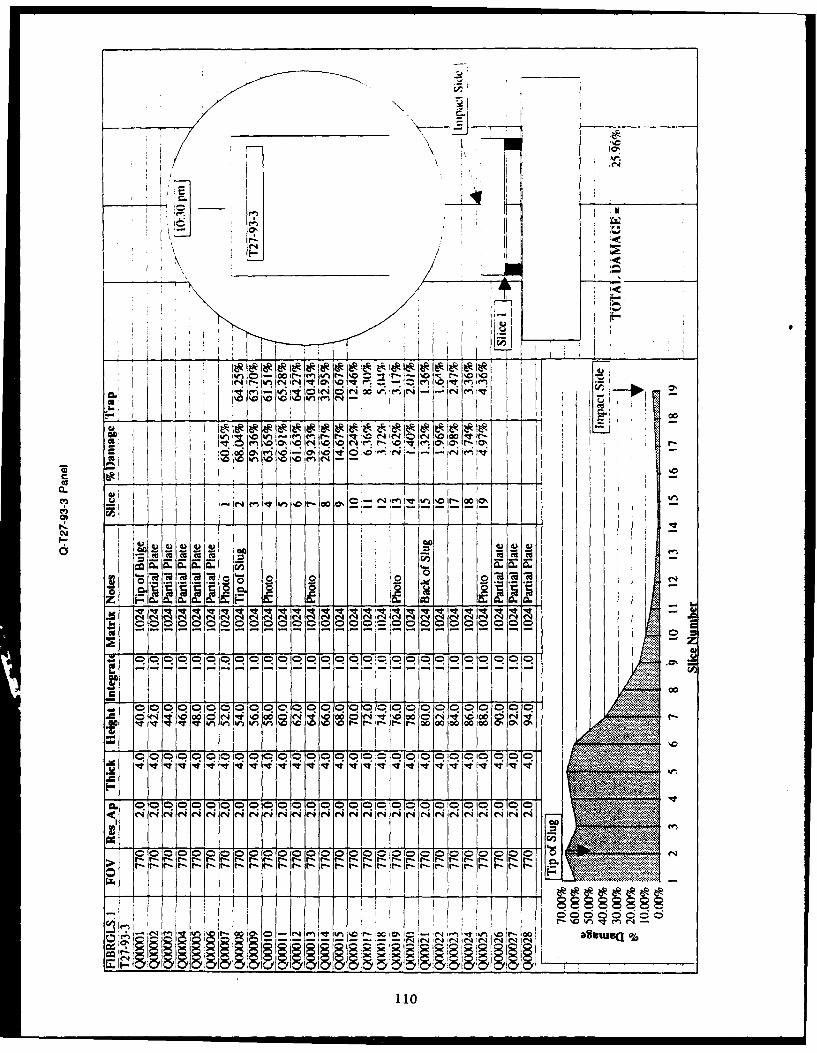
I r
I kf!4 * ciC r 0 " Ci- e IV
I d~~~' '0 ti 1\6 .C .~ .' ..O O f. r' .'i....a.
0-I
- *1V
13 3 :R 3 w
eq ell C4 7, AI 7,NN N A CS CS e4 N N
~~Z3% 000000 00 V2 O OIo 00 co &D eq01^ W) lin %n d! 'c oo r- .1 w
00
q qNc q q ql qj q C? q q q q q NN NN NN
~I IV V2002020020V0V20202IV202v q
CI 0 0 .o 0a'- lo ... .~wu .
110

I r. C,4 %nJ lr I-r ' J7V r-
I - 100 0 Go - r- r- 00r'
W1 __ 1w)
91; A !,o ,i0.Cuei'ilý C 0*1* r iýi6 l-:ý - c
-e im "VI!
41 I- o 1 ,I
z z
00 0 Cu.
TVC?~~~~~~~e (4 C 00000 000 :
.~~ ~ ci ooeooooo Ec~cOa'-------------- --------------------- -rr - rl----- -----------------
99910.t9999990.099999!1490 IC N!I KW.,r~
H _1 U_<: <199 9I

;If c'
r- 0w I. I 'D IV~' t'- c O%' a 00 IC' r'C r)I le ;cr;.`!IC =;00 jv0 IN0IO .1 0 'o0m f-, "0 u:0'1~ oc c -
i-i (n 'CC- '000 17 4JIn 4 i N? , .-
IL0.00 cI I
N ' 41 1' ` N o ,ýI~
ch~
7 00 0 0 0 0 00 0 0 0 0 00 0 0 0 0
In IC -C- I- ' ten'- C7v V) en C IV IT C- C- C- Lý N o 01 r* - Cr - iC - 00 0 00 a 01 0 00i0 0 5
01C2

.. ... ' . .. .
.. . ... ..
(14
zf-.
C'
(N4
fq
....
I I '* m(
.~ ..
.I ......
.1 . .
IIts
0000: c m t-0~MERE
0c100 m00 00 c
O~~~Oe N190H .
0101010000ut %.*.
(N (N ("11(

DISTRIBUTION LIST
No. ofCopies To
I Office of the Under Secretary of Defense for Research and Engineering,The Pentagon, Washington, DC 20301
Director, U.S. Army Research Laborataory, 2800 Powder Mill Road,Adelphi, MD 20783-1145
1 ATTN: AMSRL-OP-CI-AD, Technical Publishing BranchAMSRL-OP-CI-AD, Records Management AdministratorAMSRL-SS
Commander, Defense Technical Information Center, Cameron Station,Building 5, 5010 Duke Street, Alexandria, VA 22304-6145
2 ATTN: DTIC-FDAC
Commander, Army Research Office, P.O. Box 12211, Research TrianglePark, NC 27709-2211
1 ATTN: Office of Research and Technology Integration AMXRO-RT1 Dr. Andrew Crowson, AMXRO-MS1 Dr. Kailasam Iyer, AMXRO-MS1 Dr. Gary Anderson, AMXRO-EN
Commander, U.S. Army Materiel Command, 5001 Eisenhower Avenue,Alexandria, VA 22333-0001
1 ATTN: AMCSCI, Dr. R. Chait
Commander, U.S. Army Materiel Systems Analysis Activity, AberdeenProving Ground, MD 21005
1 ATTN: AMXSY-CR1 AMXSY-RM
Commander, U.S. Army Missile Command, Redstone Arsenal, AL 358091 ATTN: AMSMI-RD-ST, Dr. L.C. Mixon
Commander, U.S. Army Armament, Research, Development and EngineeringCenter, Picatinny Arsenal, NJ 07806-5000
1 ATTN: SMCAR-AET, Dr. W. Ebihara
Commander, U.S. Army Natick Research, Development and EngineeringCenter, Natick, MA 01760-5010
I ATTN: Technical Library1 STRNC-ICA, R.F. Kinney
Commander, U.S. Army Tank-Automotive Command, Warren, MI 48397-50001 ATTN: AMSTA-ZEI AMSTA-TSL, Technical Library1 AMSTA-RSK, Samuel Goodman1 AMSTA-RS, J. Thompson1 AMSTA-RTC, R.A. Brynsvald1 AMSTA-RTC, S. Kramer1 AMSTA-RTC, D. Ostberg1 AMSTA-RTC, L. Hinojosa
115
No. ofCopies To
Commander, White Sands Missile Range, NM 88002-50001 ATTN: AMSRL-VA-DV, J.J. Wade
(SLCVA-DV)
Director, U.S. Army Research Laboratory, Aberdeen Proving Ground, MD21005-5066
1 ATTN: AMSRL-WT, Dr. J. Fraiser1 AMSRL-WT-TA, W. Gooch1 AMSRL-WT-TA, G.L. Filbey, Jr.1 AMSRL-WT-TC, W. de Rosset1 AMSRL-WT-TD, Thomas W. Wright1 AMSRL-WT-PD, B. Burns1 AMSRL-WT-WA, B.R. Moore
Director, Defense Intelligence Agency, Washington, DC 20340-60531 ATTN: ODT-5A (Mr. Frank Jaeger)
Air Force Armament Laboratory, Eglin Air Force Base, FL 32542-54341 ATTN: J.C. Foster, Jr. , AFATL/DLJW1 W.H. Cook, AFATL/DLJW
Naval Post Graduate School, Monterey, CA 93943-5100, Dept. ofAeronautics
1 ATTN: Prof. E.M. Wu, Code NC4 (67WT)
Naval Research Laboratory1 ATTN: Dr. R. Badaliance, Code 6380, Washington, DC 20375
Naval Surface Warfare Center, Silver Spring, MD 20903-50001 ATTN: F.J. Zerilli, Code R131 R.H. Garrett, Jr.
Southwest Research Institute, 6220 Culebra Road, San Antonio,TX 78238
1 ATTN: Dr. C.E. Anderson
Director, Benet Weapons Laboratory, Army Armament RDE Center,Watervliet, NY 12189-4050
1 ATTN: SMCAR-CCB, Dr. W. Kitchens1 SMCAR-CCB, Dr. J. Vasilakis
Commander, U.S. Army Foreign Science and Technology Center, 220 7thStreet, N.E., Charlottesville, VA 22901-5396
1 ATTN: AIFRTC, Applied Technologies Branch, Gerald Schlesinger
Commandant, U.S. Army Quartermaster School, Fort Lee, VA 238011 ATTN: Quartermaster School Library
Materials Directorate, Wright Laboratory, Wright-Patterson Air ForceBase, OH 45433-7718
1 ATTN: WL/MLSA, Mr. W.E. Berner, (Bldg. 652)
1 Committee on Marine Structures, Marine Board, National Research
Council, 2101 Constitution Avenue, NW, Washington, DC 20418
116

No. ofCopi Ps To
Plastics Technical Evaluation Center, PLASTEC, ARDEC, Bldg. 355N,Picatinny Arsenal, NJ 07806-5000
1 ATTN: Harry Pebly
Department of the Army, Vehicle Structures Directorate, MS-266,Langley Research Center, Hampton, VA 23665-5225
1 ATTN: AMSRL-VS, W. Elber1 AMSRL-VS-S, F. Bartlett1 AMSRL-VS-S, G.L. Farley1 AMSRL-VS-S, K. O'Brien1 AMSRL-VS-L, J. Pritchard
RARDE, Fort Halstead - Sevenoaks, TN14 7BP Kent, England1 ATTN: Dr. Phillip Church
Department of FV&S7, DRA (Chertsey), Chobham Lane, Chertsey, Surrey,KT16 OEE, England
1 ATTN: Dr. Anthony Hawkins1 Dr. I.G. Crouch1 Dr. L.T. Greaves
Institute for Advanced Technology, 4030-2 West Braker,Austin, TX 78759-5329
1 ATTN: Stephen Bless
University of Dayton, Building JPC 201, Dayton, OH 454691 ATTN: Mr. David J. Grove
Sandia National Laboratories, P.O. Box 5800, Albuquerque, NM 871851 ATTN: E.P. Chen, Div 15611 P. Yarrington, Div 1533
ARPA/Materials Science Office, 1400 Wilson Boulevard,Arlington, V.A 22209-2308
1 ATTN: B. Wilcox
ARPA/TTO, 3701 North Fairfax Drive, Arlington, VA 22203-17141 ATTN: Robert Kocher
Director, U.S. Army Research Laboratory, Watertown, MA 02172-00012 ATTN: AMSRL-OP-WT-IS, Technical Library
10 AMSRL-MA-PD, E. DeLuca
117