Glaciers Liss M. Andreassen Section for glaciers, snow and ice Norwegian Water Resources and Energy...
19
Glaciers Liss M. Andreassen Section for glaciers, snow and ice Norwegian Water Resources and Energy Directorate [email protected]
-
Upload
gary-short -
Category
Documents
-
view
217 -
download
0
Transcript of Glaciers Liss M. Andreassen Section for glaciers, snow and ice Norwegian Water Resources and Energy...
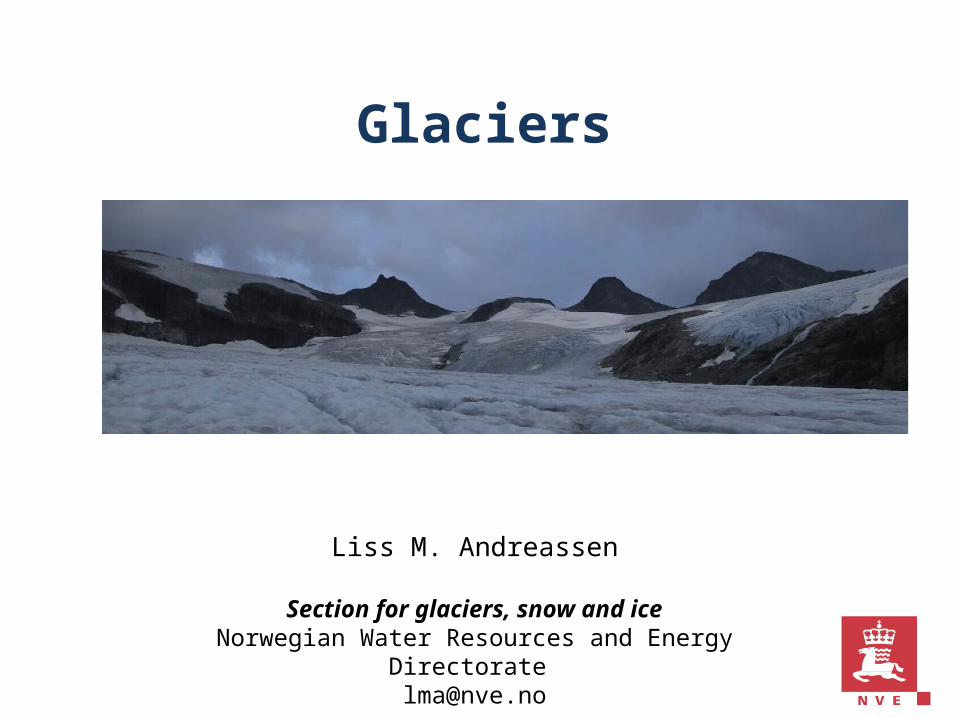
Glaciers
Liss M. Andreassen
Section for glaciers, snow and iceNorwegian Water Resources and Energy Directorate

Glaciers in Norway are changing too
~1900: Library of congress 2011: Hallgeir ElvehøyEngabreen

About NVE■ NVE is a directorate under the Ministry of
Petroleum and Energy with responsibility for the management of the nation’s water and energy resources
■ NVE central in flood and accident control planning and responsible for maintaining the national power supply
■ National flood warning services
Research & Development■ Ensure that NVE is a major R&D force in
the energy and water resource sector■ Hydrology Department carries out research within field of expertise
■ Section for glaciers, snow and ice responsible for snow avalanche forecasting, snow, ice & glacier monitoring +++
Rundvassbreen. Photo: M. Jackson
Figure: NVE
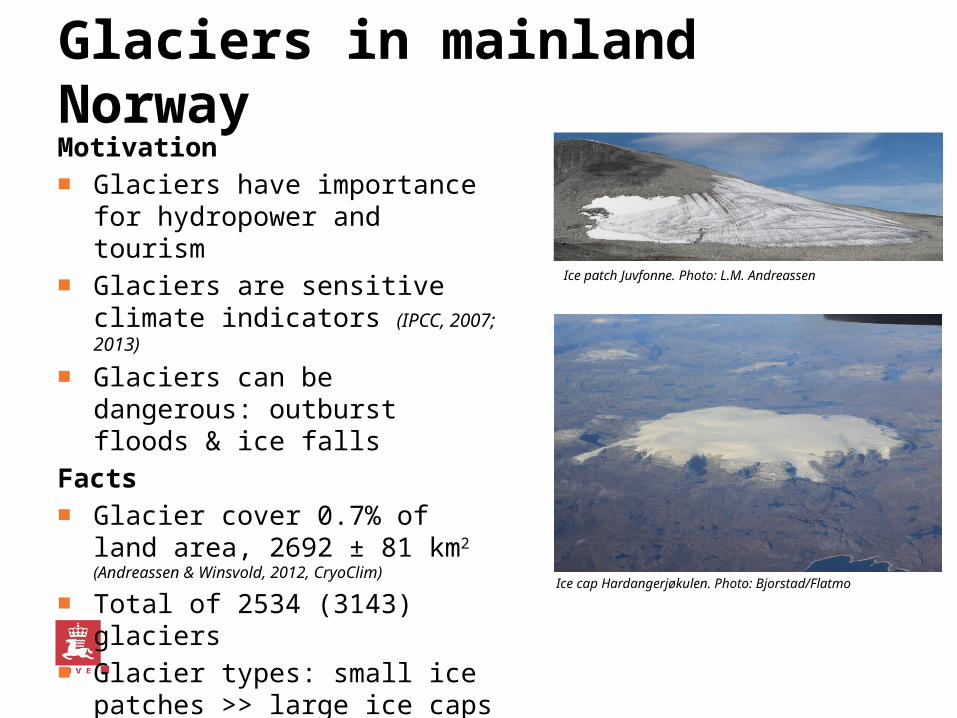
Glaciers in mainland NorwayMotivation■ Glaciers have importance for
hydropower and tourism■ Glaciers are sensitive climate
indicators (IPCC, 2007; 2013)
■ Glaciers can be dangerous: outburst floods & ice falls
Facts■ Glacier cover 0.7% of land area,
2692 ± 81 km2 (Andreassen & Winsvold, 2012, CryoClim)
■ Total of 2534 (3143) glaciers■ Glacier types: small ice patches
>> large ice caps Ice cap Hardangerjøkulen. Photo: Bjorstad/Flatmo
Ice patch Juvfonne. Photo: L.M. Andreassen
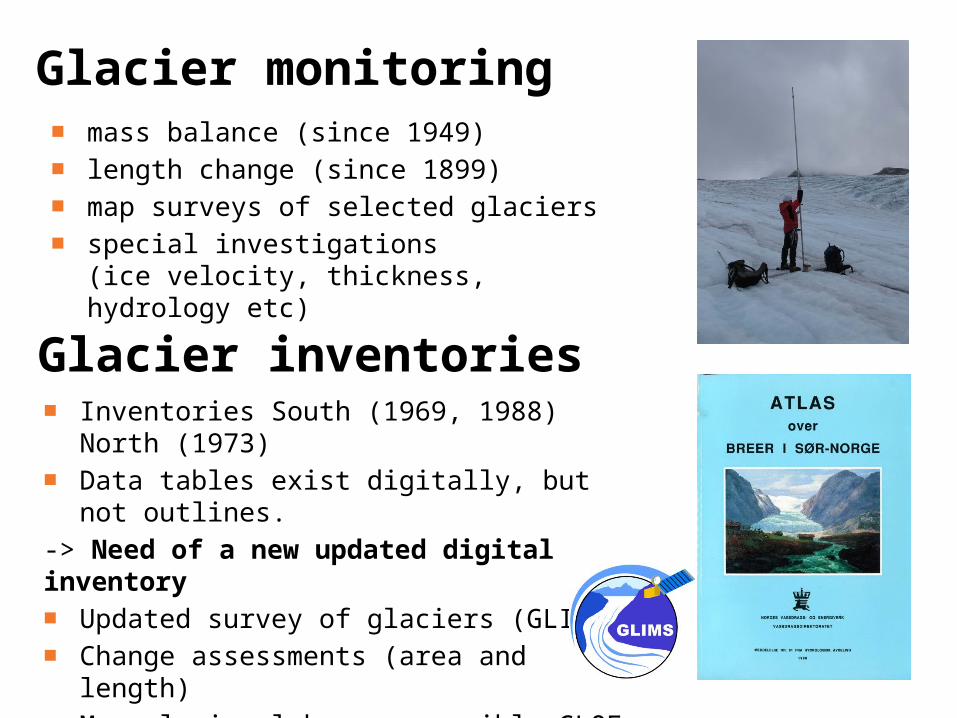
Glacier monitoring■ mass balance (since 1949) ■ length change (since 1899)■ map surveys of selected glaciers■ special investigations
(ice velocity, thickness, hydrology etc)
Glacier inventories■ Inventories South (1969, 1988) North (1973) ■ Data tables exist digitally, but not outlines.
-> Need of a new updated digital inventory■ Updated survey of glaciers (GLIMS)■ Change assessments (area and length)■ Map glacier lakes -> possible GLOF sites■ Baseline for modelling & access future
changes
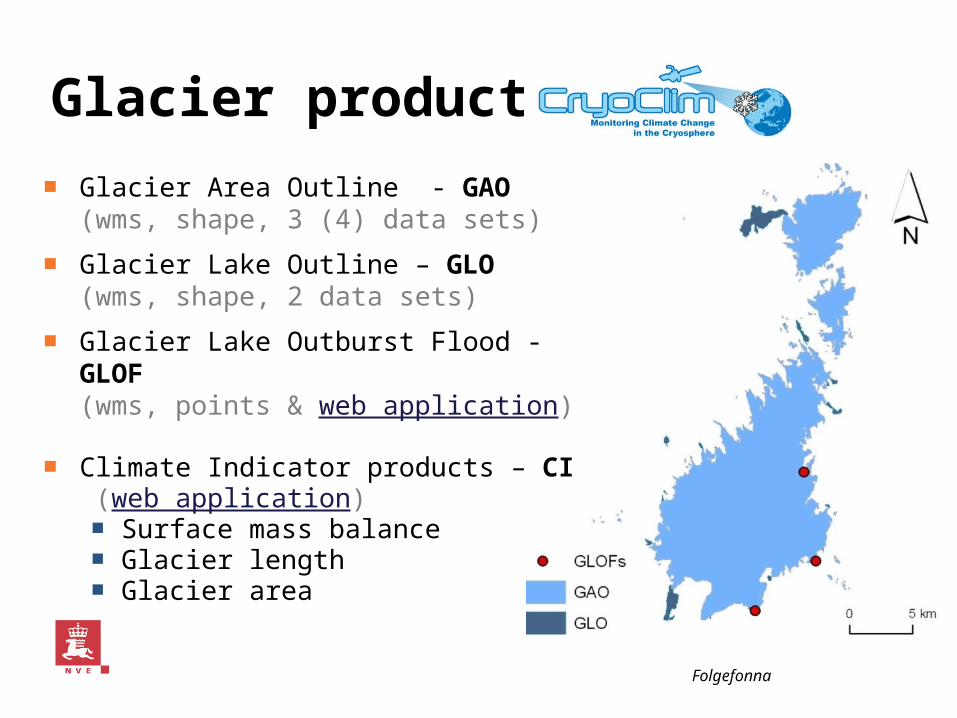
Glacier products
■ Glacier Area Outline - GAO (wms, shape, 3 (4) data sets)
■ Glacier Lake Outline – GLO (wms, shape, 2 data sets)
■ Glacier Lake Outburst Flood - GLOF (wms, points & web application)
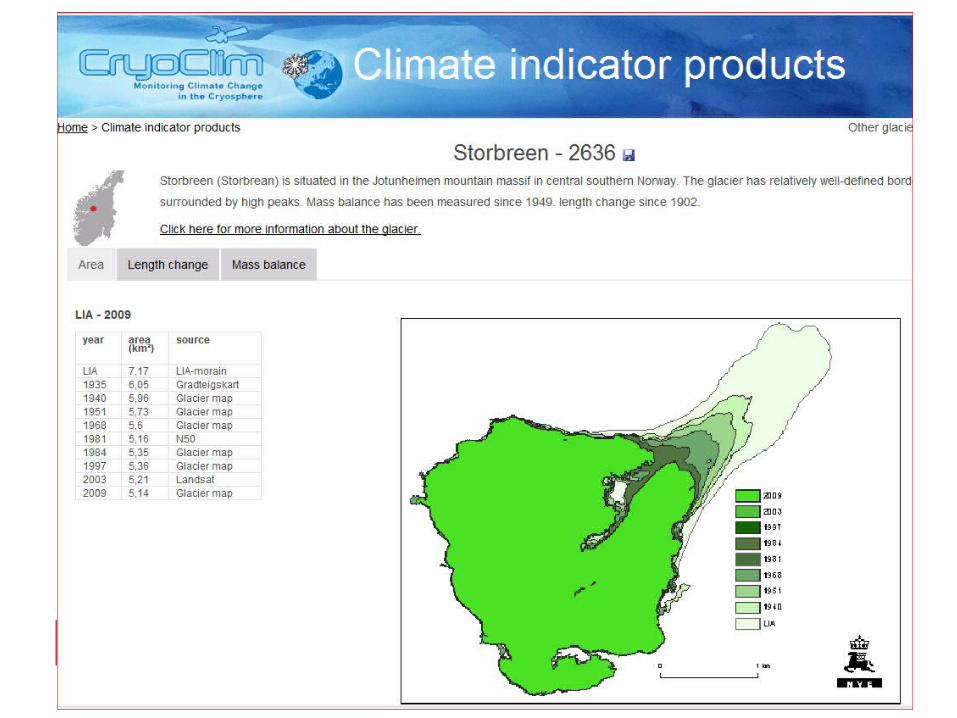
■ Climate Indicator products – CI (web application)
■ Surface mass balance ■ Glacier length■ Glacier area
Folgefonna

GAO and GLO time series Norway1950-1985
1988-1997
1999-2006
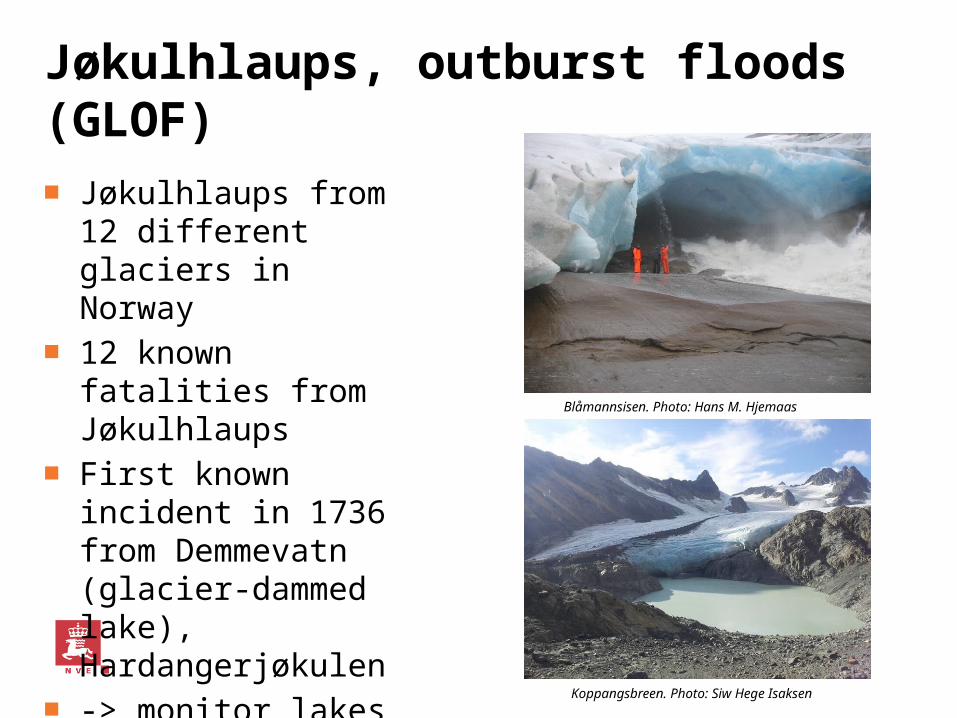
Jøkulhlaups, outburst floods (GLOF)
■ Jøkulhlaups from 12 different glaciers in Norway
■ 12 known fatalities from Jøkulhlaups
■ First known incident in 1736 from Demmevatn (glacier-dammed lake), Hardangerjøkulen
■ -> monitor lakes & their changes & detect possible new
sites
Blåmannsisen. Photo: Hans M. Hjemaas
Koppangsbreen. Photo: Siw Hege Isaksen

Glacier lake outlines & GLOFs
Glacier lakes: defined as water bodies that intersected or within 50 m of GAO
GLO 1999-2006: NDWI (Normalized Difference Water Index)
GLO 1988-1997: man. digitization (Only locations where glacier lakes were detected in GLO 1999-2006)
Point layer of observed GLOFs

CryoClim applications■ Climate indicators■ Glacier periodic photos■ Glacier lake outburst floods
http://glacier.nve.no/viewer/CI/en/cchttp://glacier.nve.no/viewer/GPP/en/cchttp://glacier.nve.no/viewer/GLOF/en/cc

Example 1: Area & length changes ■ Considerable interest from hydropower companies: Present extent
and changes, future changes. Outlines
■ Change assessmentsAndreassen et al 2008, Paul and Andreassen, 2009, Paul et al., 2011, Andreassen et al, 2012; 2014; Winsvold et al. subm
Length determination Length change
Winsvold, Andreassen & Kienholz submitted.
Area change Hardangerjøkulen

Example 2. Little ice age mapping■ Satellite imagery can be an efficient tool for mapping of maximum LIA
extents of glaciers on a regional scale
■ A Landsat image from 2003 were used to map LIA maximum extent (~1750) -> area and length shrank by 35% and 34% from LIA to 2003
Baumann, Winkler & Andreassen, TC, 2009
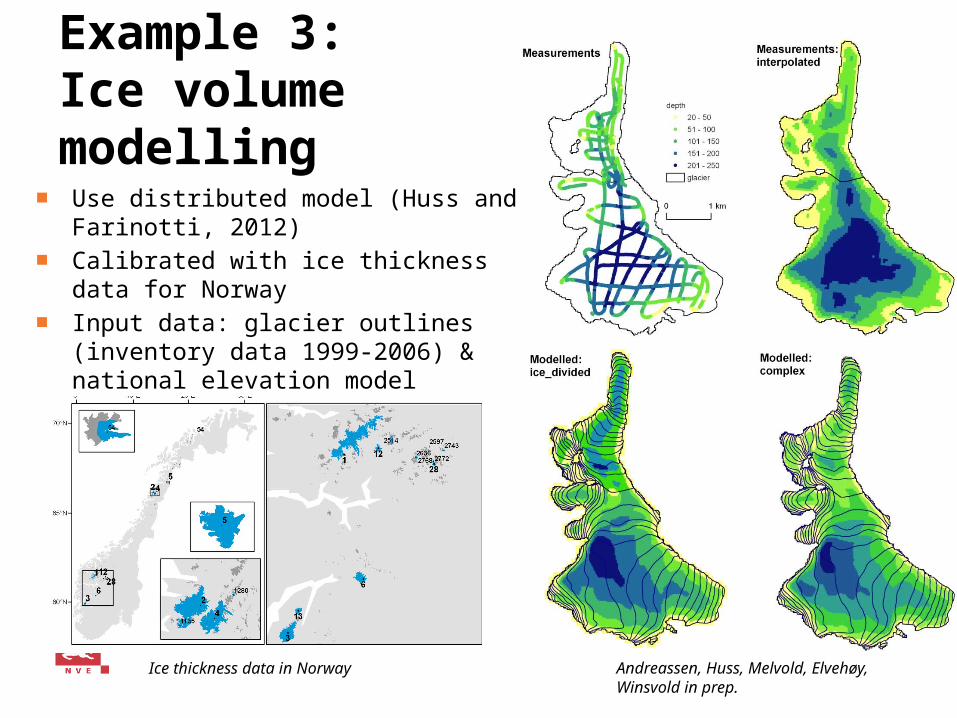
Example 3: Ice volume modelling
■ Use distributed model (Huss and Farinotti, 2012)
■ Calibrated with ice thickness data for Norway
■ Input data: glacier outlines (inventory data 1999-2006) & national elevation model
Ice thickness data in Norway Andreassen, Huss, Melvold, Elvehøy, Winsvold in prep.
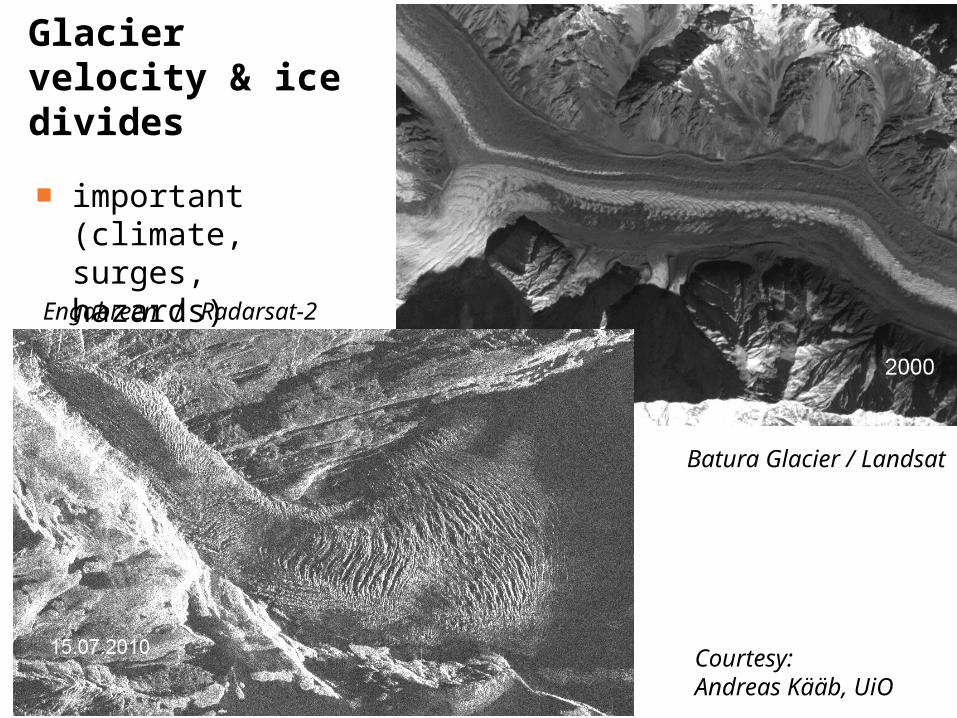
Glacier velocity & ice divides
15
Engabreen / Radarsat-2
Batura Glacier / Landsat
■ important (climate, surges, hazards)
Courtesy:Andreas Kääb, UiO
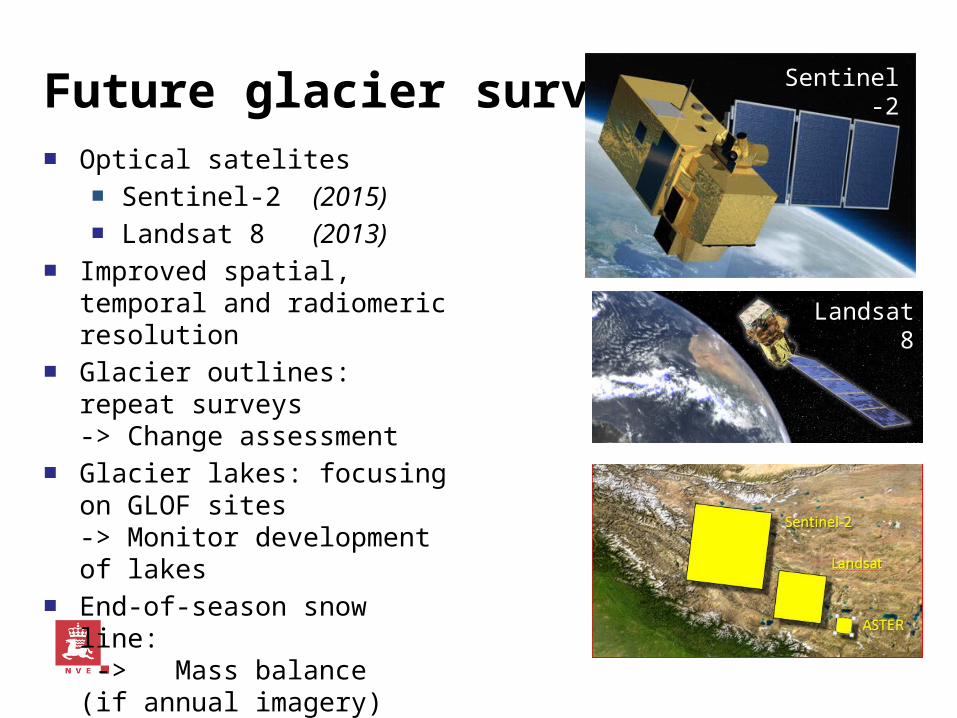
Future glacier survey■ Optical satelites
■ Sentinel-2 (2015)■ Landsat 8 (2013)
■ Improved spatial, temporal and radiomeric resolution
■ Glacier outlines: repeat surveys -> Change assessment
■ Glacier lakes: focusing on GLOF sites -> Monitor development of lakes
■ End-of-season snow line: -> Mass balance(if annual imagery)
■ Ice velocity & ice divides ++
Sentinel-2
Landsat 8

Mapping end-of-season snowline
■ End-of-season snowline ‘=‘ equilibrium line altitude (ELA)
■ Annual series -> mass balance estimate of unmeasured glaciers
■ So far: lack of imagery to provide such a product (clouds, frequency)
■ Future: Both optical (L-8, S-2) and radar (S-1) can be used

Conclusions■ Glacier satellite derived products
valuable for local, regional, national and global scales:
■ Inventories of land ice■ Glacier changes (area, length)■ Ice thickness modelling■ Glacier lake detection / surveys■ Ice dynamics / ice divides
■ Collaboration with Frank Paul & Glaciers_cci (state of the art) very useful for NVE’s work

Photo: Ragnar Ekker
Thank you for the attention