Glacier elevation and mass changes over the central ... · –0.09 0.12 m a–1 on average or mass...
9
Glacier elevation and mass changes over the central Karakoram region estimated from TanDEM-X and SRTM/X-SAR digital elevation models Melanie RANKL, Matthias BRAUN Institute of Geography, University of Erlangen–Nuremberg, Erlangen, Germany Correspondence: Melanie Rankl <[email protected]> ABSTRACT. Snow cover and glaciers in the Karakoram region are important freshwater resources for many down-river communities as they provide water for irrigation and hydropower. A better understanding of current glacier changes is hence an important informational baseline. We present glacier elevation changes in the central Karakoram region using TanDEM-X and SRTM/X-SAR DEM differences between 2000 and 2012. We calculated elevation differences for glaciers with advancing and stable termini or surge-type glaciers separately using an inventory from a previous study. Glaciers with stable and advancing termini since the 1970s showed nearly balanced elevation changes of –0.09 � 0.12 m a –1 on average or mass budgets of –0.01 � 0.02 Gt a –1 (using a density of 850 kg m –3 ). Our findings are in accordance with previous studies indicating stable or only slightly negative glacier mass balances during recent years in the Karakoram. The high-resolution elevation changes revealed distinct patterns of mass relocation at glacier surfaces during active surge cycles. The formation of kinematic waves at quiescent surge-type glaciers could be observed and points towards future active surge behaviour. Our study reveals the potential of the TanDEM-X mission to estimate geodetic glacier mass balances, but also points to still existing uncertainties induced by the geodetic method. KEYWORDS: glacier mass balance, glacier surges, mountain glaciers, remote sensing INTRODUCTION Meltwater from snow and ice originating from High Moun- tain Asia serves about 800 million people by supplying, for example, drinking water and hydropower (Immerzeel and others, 2010; Kaser and others, 2010). A warming climate accelerates glacier melt, threatening the supply of local communities at a small scale and influencing global sea- level rise at a large scale (e.g. Radić and Hock, 2011; Kääb and others, 2012; Marzeion and others, 2012; Gardner and others,2013).MosthighmountainglaciersinAsiahavebeen affected by mass loss (Bolch and others, 2012). However, in some regions glaciers show anomalous behaviour: glaciers across the Pamir–Karakoram range showed stable or even positive glacier mass balances during recent years (Kääb and others, 2012; Gardelle and others, 2013; Gardner and others, 2013) which have fostered stable or advancing glacier termini (Scherler and others, 2011; Bolch and others, 2012; Rankl and others, 2014). Gardelle and others (2013) found geodetic glacier mass balances of +1.9 � 3.1Gta –1 for the Karakoram (19024km 2 ) and +1.3 � 1.3 Gta –1 for the Pamir(9369km 2 )between1999and2010(usingadensityof 850kgm –3 ). Another study estimated balanced mass budgets between October and November (0.0 � 0.8Gta –1 using a zonally variable conversion factor for a glacier area of 21750km 2 ) in the Karakoram using Ice, Cloud and land Elevation Satellite (ICESat) time series between 2003 and 2008 (Kääb and others, 2012). Furthermore, Kääb and others (2015) and Neckel and others (2014) suggested that the glacier mass-balance anomaly extends further east towards the Tibetan Plateau. The Karakoram is known for a large number of surge-type glaciers (Hewitt, 1998; Copland and others, 2011; Rankl and others, 2014). These glaciers show accelerated surface flow by as much as an order of magnitude and advancing termini during an active surge phase, which lasts a few months to years (Meier and Post, 1969). The active surge phase is accompanied by surface characteristics such as looped and folded medial moraines, crevassed surfaces or ice foliation (Hewitt, 1969; Meier and Post, 1969). Subse- quently, flow velocities stagnate and glacier tongues remain stable. The so-called quiescent phase typically endures several years to decades (Meier and Post, 1969). An inventory of surge-type glaciers in the Karakoram was presented by Copland and others (2011) and refined and extended by Rankl and others (2014). The latter contained 1219 glaciers, of which 101 were classified as surge-type glaciers, 969 showed stable termini, 56 were advancing and 93 retreating between 1976 and 2012. In this study, the bistatic TanDEM-X mission is evaluated in regard to its suitability for calculating glacier elevation changes and geodetic glacier mass balances for parts of the central Karakoram region (Fig. 1). Elevation differences are calculated from interferometrically derived TanDEM-X and SRTM/X-SAR digital elevation models (DEMs). We analyse the elevation differences with respect to glacier type (surge- type, stable, advancing) using the inventory by Rankl and others (2014) and we provide results for different volume-to- mass conversion approaches including a consideration of surface and glacier types. Surge-type glaciers are analysed in more detail, differentiating between quiescent or actively surging glaciers in the period 2000–12. DATA AND METHODS The Shuttle Radar Topography Mission (SRTM) acquired interferometric synthetic aperture radar (InSAR) data simul- taneously in the C-band and X-band frequencies between 11 and 22 February 2000. Data were acquired between Annals of Glaciology 51(71) 2016 doi: 10.3189/2016AoG71A024 273
Transcript of Glacier elevation and mass changes over the central ... · –0.09 0.12 m a–1 on average or mass...

Glacier elevation and mass changes over the central Karakoramregion estimated from TanDEM-X and SRTM/X-SAR digital
elevation models
Melanie RANKL, Matthias BRAUNInstitute of Geography, University of Erlangen–Nuremberg, Erlangen, Germany
Correspondence: Melanie Rankl <[email protected]>
ABSTRACT. Snow cover and glaciers in the Karakoram region are important freshwater resources formany down-river communities as they provide water for irrigation and hydropower. A betterunderstanding of current glacier changes is hence an important informational baseline. We presentglacier elevation changes in the central Karakoram region using TanDEM-X and SRTM/X-SAR DEMdifferences between 2000 and 2012. We calculated elevation differences for glaciers with advancingand stable termini or surge-type glaciers separately using an inventory from a previous study. Glacierswith stable and advancing termini since the 1970s showed nearly balanced elevation changes of–0.09� 0.12 m a–1 on average or mass budgets of –0.01�0.02 Gt a–1 (using a density of 850 kg m–3).Our findings are in accordance with previous studies indicating stable or only slightly negative glaciermass balances during recent years in the Karakoram. The high-resolution elevation changes revealeddistinct patterns of mass relocation at glacier surfaces during active surge cycles. The formation ofkinematic waves at quiescent surge-type glaciers could be observed and points towards future activesurge behaviour. Our study reveals the potential of the TanDEM-X mission to estimate geodetic glaciermass balances, but also points to still existing uncertainties induced by the geodetic method.
KEYWORDS: glacier mass balance, glacier surges, mountain glaciers, remote sensing
INTRODUCTIONMeltwater from snow and ice originating from High Moun-tain Asia serves about 800 million people by supplying, forexample, drinking water and hydropower (Immerzeel andothers, 2010; Kaser and others, 2010). A warming climateaccelerates glacier melt, threatening the supply of localcommunities at a small scale and influencing global sea-level rise at a large scale (e.g. Radić and Hock, 2011; Kääband others, 2012; Marzeion and others, 2012; Gardner andothers, 2013). Most high mountain glaciers in Asia have beenaffected by mass loss (Bolch and others, 2012). However, insome regions glaciers show anomalous behaviour: glaciersacross the Pamir–Karakoram range showed stable or evenpositive glacier mass balances during recent years (Kääb andothers, 2012; Gardelle and others, 2013; Gardner andothers, 2013) which have fostered stable or advancingglacier termini (Scherler and others, 2011; Bolch and others,2012; Rankl and others, 2014). Gardelle and others (2013)found geodetic glacier mass balances of +1.9�3.1Gt a–1 forthe Karakoram (19 024 km2) and +1.3�1.3 Gt a–1 for thePamir (9369 km2) between 1999 and 2010 (using a density of850 kgm–3). Another study estimated balanced mass budgetsbetween October and November (0.0� 0.8Gt a–1 using azonally variable conversion factor for a glacier area of21 750 km2) in the Karakoram using Ice, Cloud and landElevation Satellite (ICESat) time series between 2003 and2008 (Kääb and others, 2012). Furthermore, Kääb and others(2015) and Neckel and others (2014) suggested that theglacier mass-balance anomaly extends further east towardsthe Tibetan Plateau.
The Karakoram is known for a large number of surge-typeglaciers (Hewitt, 1998; Copland and others, 2011; Rankland others, 2014). These glaciers show accelerated surfaceflow by as much as an order of magnitude and advancing
termini during an active surge phase, which lasts a fewmonths to years (Meier and Post, 1969). The active surgephase is accompanied by surface characteristics such aslooped and folded medial moraines, crevassed surfaces orice foliation (Hewitt, 1969; Meier and Post, 1969). Subse-quently, flow velocities stagnate and glacier tongues remainstable. The so-called quiescent phase typically enduresseveral years to decades (Meier and Post, 1969). Aninventory of surge-type glaciers in the Karakoram waspresented by Copland and others (2011) and refined andextended by Rankl and others (2014). The latter contained1219 glaciers, of which 101 were classified as surge-typeglaciers, 969 showed stable termini, 56 were advancing and93 retreating between 1976 and 2012.
In this study, the bistatic TanDEM-X mission is evaluatedin regard to its suitability for calculating glacier elevationchanges and geodetic glacier mass balances for parts of thecentral Karakoram region (Fig. 1). Elevation differences arecalculated from interferometrically derived TanDEM-X andSRTM/X-SAR digital elevation models (DEMs). We analysethe elevation differences with respect to glacier type (surge-type, stable, advancing) using the inventory by Rankl andothers (2014) and we provide results for different volume-to-mass conversion approaches including a consideration ofsurface and glacier types. Surge-type glaciers are analysed inmore detail, differentiating between quiescent or activelysurging glaciers in the period 2000–12.
DATA AND METHODSThe Shuttle Radar Topography Mission (SRTM) acquiredinterferometric synthetic aperture radar (InSAR) data simul-taneously in the C-band and X-band frequencies between11 and 22 February 2000. Data were acquired between
Annals of Glaciology 51(71) 2016 doi: 10.3189/2016AoG71A024 273
56° S and 60°N. However, the X-band system operated witha swath width of �50 km (C-band �225 km), which did notallow for global data coverage (Hoffmann and Walter,2006). The SRTM/X-SAR (X-SRTM) DEM is distributed viathe German Aerospace Center with a spatial resolution of1 arcsec. The SRTM/SIR-C DEM is available in a gap-filled3 arcsec resolution (http://srtm.csi.cgiar.org) or in a 1 arcsecresolution which still contains data gaps (available at USGeological Survey (USGS)).
The TanDEM-X (TerraSAR-X-Add-on for Digital ElevationMeasurements) mission was launched in 2010 by theGerman Aerospace Center (DLR). TanDEM-X and its twinsatellite TerraSAR-X fly in a close helix formation (Kriegerand others, 2007). Either the TanDEM-X or TerraSAR-Xsatellite transmits the radar signal to the ground (the so-calledactive master). The other satellite then records the back-scattered signal (the so-called slave) as does the mastersatellite (Krieger and others, 2007). The time lag between
satellite overpasses during the global DEM mode acquisi-tions accounts for 3 s only. Hence, the bistatic acquisitionsare very suitable for interferometric processing since tem-poral and spatial decorrelation are minimized (Krieger andothers, 2007; Fritz and others, 2011). We used four TanDEM-X/TerraSAR-X StripMap scenes for this study, which wereacquired between January and March 2012 (Table 1).
Both missions (X-SRTM and TanDEM-X) operated in theX-band frequency (9.65GHz) and data takes were acquiredduring winter in the Northern Hemisphere. Due to the highelevation, surface conditions are expected to be similar in2000 and 2012, with temperatures predominantly belowfreezing point. Fine-grained, cold winter snow of a fewdecimetres to metres does not induce a change in the phase-scattering centres, i.e. it is transparent for the X-band signalunder such cold conditions (Mätzler and Schanda, 1984).Hence, effects of varying, hardly quantifiable penetrationdepths of the radar signal (Rignot and others, 2001; Gardelle
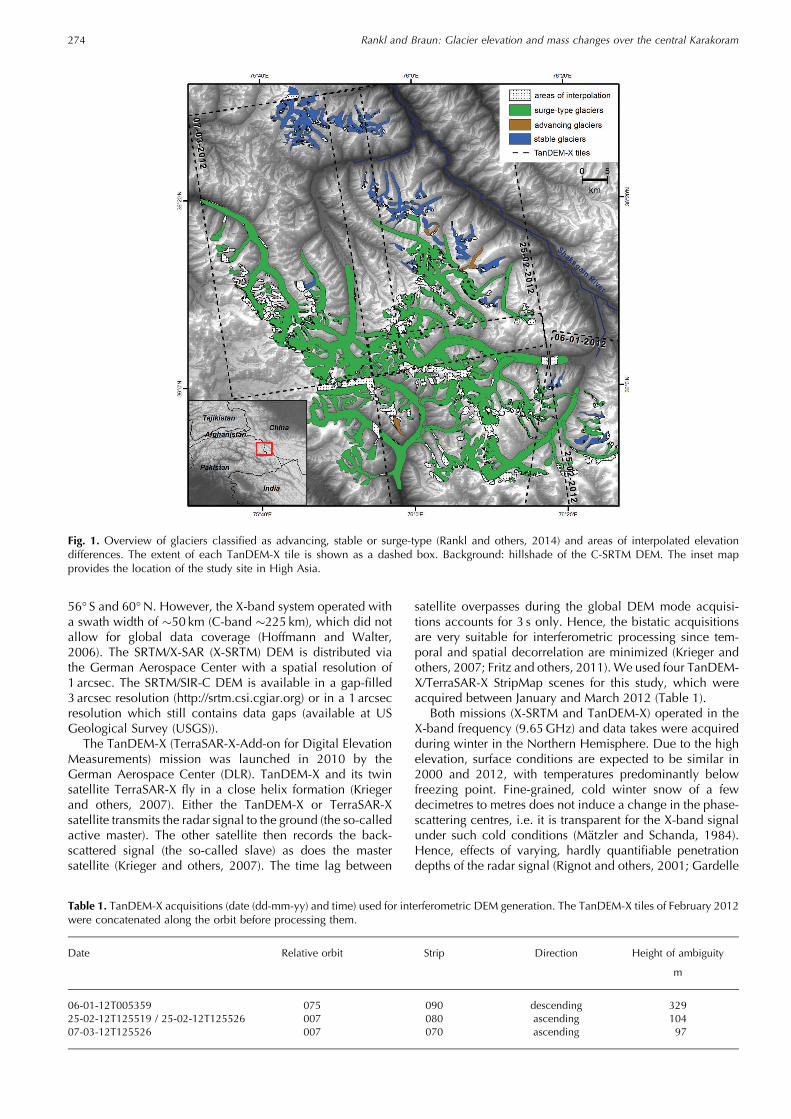
Fig. 1. Overview of glaciers classified as advancing, stable or surge-type (Rankl and others, 2014) and areas of interpolated elevationdifferences. The extent of each TanDEM-X tile is shown as a dashed box. Background: hillshade of the C-SRTM DEM. The inset mapprovides the location of the study site in High Asia.
Table 1. TanDEM-X acquisitions (date (dd-mm-yy) and time) used for interferometric DEM generation. The TanDEM-X tiles of February 2012were concatenated along the orbit before processing them.
Date Relative orbit Strip Direction Height of ambiguity
m
06-01-12T005359 075 090 descending 32925-02-12T125519 / 25-02-12T125526 007 080 ascending 10407-03-12T125526 007 070 ascending 97
Rankl and Braun: Glacier elevation and mass changes over the central Karakoram274

and others, 2012) on the geodetic elevation differences areassumed to be small.
Each image pair of the TanDEM-X mission consists of twoalready co-registered Single-Look Complex files (CoSSC).The TanDEM-X/TerraSAR-X acquisitions were processed bydifferential interferometry (DInSAR) (Neckel and others,2013) using Gamma Remote Sensing Software (Werner andothers, 2000). After initial interferogram formation andcoherence estimation the baseline was determined usingthe precise satellite orbits delivered with the data. Subse-quently, we subtracted the gap-filled SRTM/SIR-C DEM(C-SRTM). This processing step was introduced in order toimprove the phase-unwrapping procedure and minimizeerrors due to, for example, phase jumps in the steepmountainous terrain. The C-SRTM was favoured since itcovers the entire Karakoram range, so no additionalgeometric artefacts are introduced (the X-SRTM is notavailable gap-filled and with full coverage of the TanDEM-X/TerraSAR-X scenes). To generate the differential inter-ferogram the C-SRTM DEM and the TanDEM-X/TerraSAR-Xacquisitions were co-registered to each other. For this, aninitial look-up table was calculated which was based on therelation between the map coordinates of the C-SRTM DEMsegment covering the TanDEM-X/TerraSAR-X master file,and the SAR geometry of the respective master file. Gaps inthe look-up table resulting from areas of radar shadows orlayover in the TanDEM-X/TerraSAR-X interferogram werefilled using linear interpolation between the gap edges ineach line of the look-up table (Gamma Remote Sensing,2007). The co-registration was refined in a subsequent stepby calculating the offsets between the master scene and thesimulated intensity of the C-SRTM DEM using an intensitycross-correlation algorithm. The corresponding segment ofthe C-SRTM DEM was then transformed into the SARgeometry of the respective TanDEM-X/TerraSAR-X masterscene. The simulated phase of the co-registered C-SRTMDEM and the interferogram of the TanDEM-X/TerraSAR-Xbistatic scene were used to generate a differential inter-ferogram. This contains all deviations from the TanDEM-X/TerraSAR-X interferogram as well as any systematic biasesand errors in the C-SRTM DEM. The differential inter-ferogram was filtered using an adaptive filtering approach(Goldstein and Werner, 1998), and areas of low coherence(<0.3) were masked out (Fig. S1 in Supplementary Materialat http://igsoc.org/hyperlink/71a024_supp.pdf). Phase un-wrapping was then pursued using a minimum-cost flowalgorithm. The initial starting point of the unwrappingprocess was chosen to be on flat, non-glaciated terrain. Theunwrapped differential phase was converted to absolutedifferential heights according to the computed phase-to-height sensitivity. Finally, the differential heights were addedback to the C-SRTM DEM in order to achieve the finalTanDEM-X elevations for each scene. This last step ensuresthat the final DEM surface is the one mapped by the X-bandphase centres. Assuming that surface conditions werecomparable between 2000 and 2012, and that phasecentres of the radar return from the same depth, noadditional correction for differential radar penetration in2000 and 2012 was applied. Next, the TanDEM-X DEM tileswere corrected for tropospheric path delays according toFritz and others (2011).
The resulting TanDEM-X DEM tiles were mosaicked bychoosing the February 2012 DEM as a reference. Weadjusted the DEM of March 2012 to the reference DEM in
regard to the relative height offset by randomly distributingseveral hundred points over stable, flat and non-glaciatedground in the overlapping areas of the DEMs (Fig. S2 (http://igsoc.org/hyperlink/71a024_supp.pdf)). The fitting wasbased on a linear regression analysis using the corres-ponding points in the overlapping areas. The constant valueof the y-axis intercept was added to the respective TanDEM-X DEM during mosaicking (Fig. S2a (http://igsoc.org/hyperlink/71a024_supp.pdf)). When mosaicking the sceneof January 2012 to the reference DEM, only samples overglaciated areas could be chosen, because no stable, flat andnon-glaciated ground was available in the overlapping part.The resulting TanDEM-X DEM mosaic was finally resampledto 30m � 30m pixel spacing.
In order to obtain absolute TanDEM-X DEM heights, wecalibrated the TanDEM-X DEM mosaic to the X-SRTM DEMusing samples over non-glaciated, low-slope (<15°) groundassuming no elevation differences in these areas between2000 and 2012. The fitting is again based on the y-axisintercept of a linear regression analysis of the samples used.
Finally, we calculated the difference between the X-SRTM and the mosaicked TanDEM-X DEMs over glaciers.No further correction of horizontal offsets between theTanDEM-X DEM mosaic and X-SRTM DEM was neededbefore DEM differencing, since the TanDEM-X DEMs wereco-registered to the C-SRTM DEM during interferometricprocessing (see above) and no systematic horizontal offsetsbetween the C-band and X-band SRTM DEMs are known(Hoffmann and Walter, 2006). Due to the use of two X-bandDEMs, errors resulting from different radar penetration aredeemed negligible for winter conditions. Since the coverageof the X-SRTM DEM was sparse, we excluded glaciers where<50% of the catchment was covered. The X-SRTM DEM isaffected by inaccuracies in steep terrain at high altitudes,introduced by shadows and layover effects inherent to theSAR geometry (Ludwig and Schneider, 2006). Thus, weremoved elevation differences greater than �50m locatedabove the firn line from the analysis. The threshold of �50mwas verified over completely covered glacier catchments,where the elevation differences followed a smooth pattern.Smaller data gaps were iteratively filled by a mean filter witha 5�5 pixel window. The interpolated areas account for�19% of the glaciated area covered by the analysis (Fig. 1).
The mean error in the elevation differences was estimatedover non-glaciated ground assuming that these areas did notchange in height between 2000 and 2012 and thatelevations should be equal in both the X-SRTM andTanDEM-X DEMs (Fig. S3 (http://igsoc.org/hyperlink/71a024_supp.pdf)). However, Figures S4 and S5 (http://igsoc.org/hyperlink/71a024_supp.pdf) show large biases inelevation between the two DEMs at altitudes above5700ma.s.l. and in areas steeper than 50° slope. Addition-ally, we plotted the distribution of gridcells on-glacier foreach 100m altitude bin and for each 5° slope bin (Figs S6and S7). Over 80% of the gridcells on-glacier were locatedbelow a threshold of 5700ma.s.l. (84%; see also Fig. S6(http://igsoc.org/hyperlink/71a024_supp.pdf)) and 50° slope(99%; see also Fig. S7 (http://igsoc.org/hyperlink/71a024_supp.pdf)). Thus, the error estimation was restrictedto non-glaciated gridcells located below these altitude andslope thresholds following the distribution of gridcells on-glacier (Fig. S3 (http://igsoc.org/hyperlink/71a024_supp.pdf)). Additionally, elevation differences off-glacier whichexceeded the range of elevation change on-glacier were
Rankl and Braun: Glacier elevation and mass changes over the central Karakoram 275

removed from the analysis. Further, we excluded samplesused for referencing with the X-SRTM DEM and mosaickingof the TanDEM-X DEM tiles. We used the mean of theelevation differences on those resulting off-glacier areas(25 899 gridcells) as an error measure for our elevationchange analysis (Shuman and others, 2011). The sampleswere distributed over the whole mosaic including potentialuncertainties introduced during the various processing steps.Hence, the error accounts for relative height differenceswhich were not eliminated during the mosaicking and fittingprocesses. The resulting systematic error was –0.12ma–1 onaverage, the median of the elevation differences off-glacierwas 0.06ma–1 and the standard deviation 1.90ma–1.
For the conversion of the observed glacier volumechanges into mass changes a density of ice/firn/snow needsto be assumed. We applied three different density scenariosin order to simplify the comparison to other studies and toshow the influence of different conversion approaches ongeodetic glacier mass balances. Scenario A uses a fixeddensity of 900 kgm–3 and scenario B uses a density of850 kgm–3 (Gardelle and others, 2013; Huss, 2013) for theentire glacier. Scenario C uses 900 kgm–3 for ice below thefirn line and 600 kgm–3 for snow/firn above the firn line (e.g.Schiefer and others, 2007; Moholdt and others, 2010). Thestandard error of the detected elevation change wasconverted into mass assuming the corresponding densitiesof scenarios A and B. For scenario C we chose a meandensity of 750 kgm–3 in order to convert the error estimateinto mass. The altitude of the firn line was determined usingmultispectral imagery. Based on a Landsat-8 summer scene(30 July 2013) and the combination of bands 6, 5 and 4, weclassified the glaciated areas into snow/firn, ice and debriscover. The transition between snow/firn and ice wasassumed to show the firn line. Changes in the firn-lineposition between 2000 and 2012 were neglected.
The glacier outlines are based on the manually improvedglacier inventory of the Karakoram region presented byRankl and others (2014). Therein, 1219 glaciers wereclassified as either surge-type, advancing, retreating orstable using Landsat time series between 1976 and 2012and SAR-based surface velocities. Based on this classifi-cation, we separated glacier elevation changes and glaciermass balances for surge-type glaciers and glaciers withadvancing or stable termini (Fig. 1). Frontal advances wereclassified as such when a threshold of 2 pixels (�60m) wasexceeded during the observation period 1976–2012 (Rankland others, 2014). The threshold arose from uncertaintiesduring the digitization of glacier outlines using Landsat timeseries. Glaciers with stable termini did not show frontalchanges outside the error bars. The identification of surge-type glaciers was based on several glacier inventories (e.g.Hewitt, 1998; Barrand and Murray, 2006; Copland andothers, 2011) which were updated with our own obser-vations based on Landsat time series, surface features andsurface velocities (Rankl and others, 2014). Glaciersshowing frontal advance, increased surface velocities closeto the snout and characteristic surface features wereclassified as surge-type. Glaciers identified as advancingpresented evidence of frontal position changes only, withoutfurther evidence to support a surge identification. Within thestudy area presented here, no retreating glaciers wereobserved. Glacier centre lines were generated automaticallybased on the method developed by Kienholz and others(2014).
RESULTS AND DISCUSSION
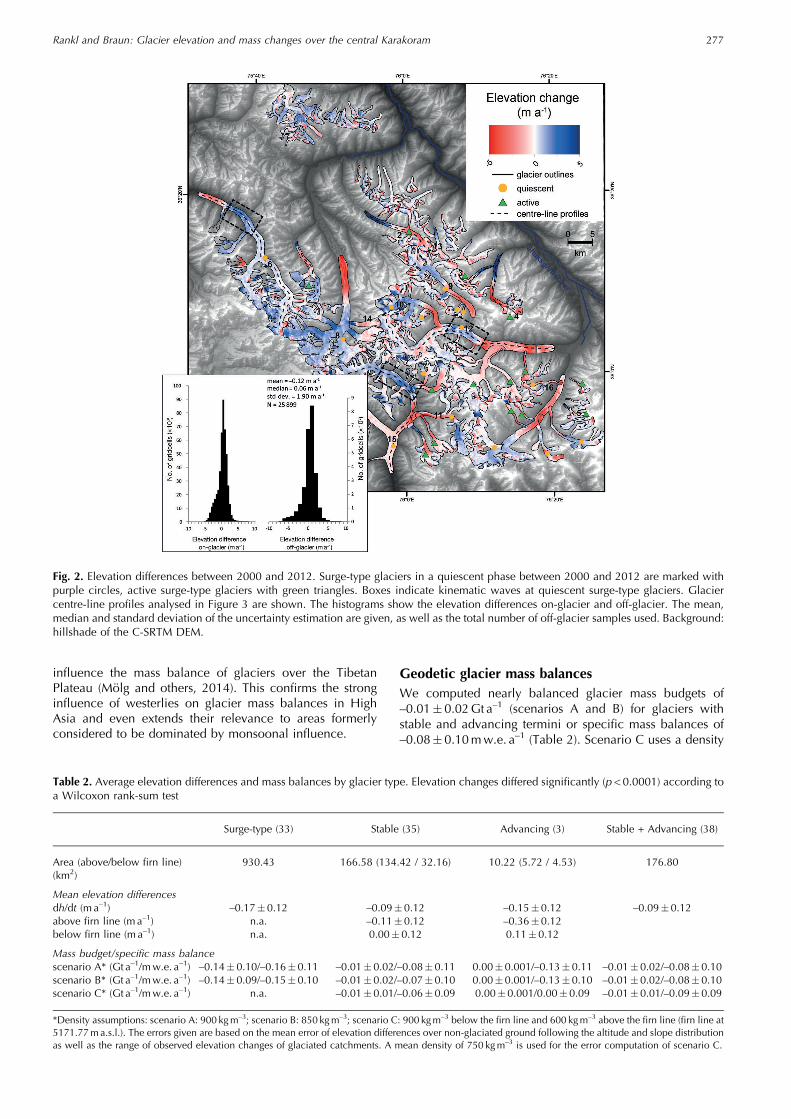
Glacier elevation changesWe calculated glacier elevation changes for 71 glaciers witha total area of 1107.23 km2 (Fig. 2). Out of 71 glaciers, 33showed surge-type behaviour (area 930.43 km2), 35 re-mained stable (area 166.58 km2) and 3 showed advancingtermini (area 10.22 km2) between 1976 and 2012 accordingto Rankl and others (2014) (Fig. 1; Table 2). Average elev-ation changes of glaciers with stable frontal positions wereestimated to be –0.09�0.12ma–1. Glaciers classified asadvancing showed, on average, slight thinning within errorbars (–0.15� 0.12 m a–1) as did surge-type glaciers(–0.17�0.12ma–1). Frontal advances of several hundredmetres between 1976 and 2012 were found for glaciers withadvancing termini (Rankl and others, 2014). Further evidenceof surge-type behaviour (e.g. looped and folded moraines,increased surface flow) was not found for advancing glaciersin previous studies using observations not accompanied byelevation change measurements (Hewitt, 1998; Copland andothers, 2011; Rankl and others, 2014).
Previous studies including surge-type and non-surge-typeglaciers reported both positive and negative elevationchanges in the Karakoram region: Kääb and others (2012)showed negative elevation difference trends of –0.07�0.04ma–1 on average using time series from ICESat autumncampaigns between 2003 and 2008. Gardner and others(2013) observed comparable mean changes of –0.12�0.15ma–1 (2003–09) derived from Gravity Recovery andClimate Experiment (GRACE) satellite gravimetry and ICESataltimetry measurements (including the Hindu Kush moun-tains). However, Gardelle and others (2013) presented posi-tive elevation differences of +0.12� 0.19ma–1 on averagefor a longer time period (2000–10) using the geodetic methodbased on SPOT5 (Satellite Pour l’Observation de la Terre)and C-SRTM DEMs. They had to account for the spatiallyvariable C-band radar penetration in order to compare theirDEMs derived from optical imagery. Considering glacierswith stable and advancing termini only, we showed averageglacier elevation changes of –0.09� 0.12ma–1 for the 2000–12 period.We covered a smaller glaciated area than previousstudies, but for a 12 year period. Our high-resolutionmeasurements comprehensively mapped the glaciated areaswith a detailed representation of small-scale features (e.g.kinematic waves at surge-type glaciers (glaciers No. 6, 12and 15 in Fig. 2); thickening and thinning in ice-receivingand ice-reservoir areas, respectively; and differentiated flowpatterns at confluence zones (glacier No. 11; Fig. 2)). Therewas no need for interpolation except in areas of shadows andlayover introduced by the SAR geometry.
Stable and advancing glacier termini and only slightglacier thinning in the central Karakoram represent the so-called Pamir–Karakoram anomaly (Gardelle and others,2013). This glacier mass-balance anomaly was recentlyfound to extend further northeast to the west Kunlun Shan orTarim basin, and the centre of the anomaly was suggested tobe located on the Tibetan Plateau (Neckel and others, 2014;Kääb and others, 2015). An increase in winter precipitationin the Karakoram and eastern Pamir (Archer and Fowler,2004; Yao and others, 2012) was related to a strengtheningof the westerlies in these regions (Bolch and others, 2012).Annual snow accumulation in the Karakoram is dominatedby non-monsoonal winter precipitation (Kapnick and others,2014). In addition, mid-latitude westerlies considerably
Rankl and Braun: Glacier elevation and mass changes over the central Karakoram276
influence the mass balance of glaciers over the TibetanPlateau (Mölg and others, 2014). This confirms the stronginfluence of westerlies on glacier mass balances in HighAsia and even extends their relevance to areas formerlyconsidered to be dominated by monsoonal influence.
Geodetic glacier mass balancesWe computed nearly balanced glacier mass budgets of–0.01� 0.02Gt a–1 (scenarios A and B) for glaciers withstable and advancing termini or specific mass balances of–0.08� 0.10mw.e. a–1 (Table 2). Scenario C uses a density
Fig. 2. Elevation differences between 2000 and 2012. Surge-type glaciers in a quiescent phase between 2000 and 2012 are marked withpurple circles, active surge-type glaciers with green triangles. Boxes indicate kinematic waves at quiescent surge-type glaciers. Glaciercentre-line profiles analysed in Figure 3 are shown. The histograms show the elevation differences on-glacier and off-glacier. The mean,median and standard deviation of the uncertainty estimation are given, as well as the total number of off-glacier samples used. Background:hillshade of the C-SRTM DEM.
Table 2. Average elevation differences and mass balances by glacier type. Elevation changes differed significantly (p<0.0001) according toa Wilcoxon rank-sum test
Surge-type (33) Stable (35) Advancing (3) Stable + Advancing (38)
Area (above/below firn line)(km2)
930.43 166.58 (134.42 / 32.16) 10.22 (5.72 / 4.53) 176.80
Mean elevation differencesdh/dt (m a–1) –0.17�0.12 –0.09� 0.12 –0.15�0.12 –0.09�0.12above firn line (ma–1) n.a. –0.11� 0.12 –0.36�0.12below firn line (m a–1) n.a. 0.00� 0.12 0.11� 0.12
Mass budget/specific mass balancescenario A* (Gt a–1/mw.e. a–1) –0.14� 0.10/–0.16�0.11 –0.01�0.02/–0.08� 0.11 0.00�0.001/–0.13� 0.11 –0.01� 0.02/–0.08� 0.10scenario B* (Gt a–1/mw.e. a–1) –0.14� 0.09/–0.15�0.10 –0.01�0.02/–0.07� 0.10 0.00�0.001/–0.13� 0.10 –0.01� 0.02/–0.08� 0.10scenario C* (Gt a–1/mw.e. a–1) n.a. –0.01�0.01/–0.06� 0.09 0.00�0.001/0.00� 0.09 –0.01� 0.01/–0.09� 0.09
*Density assumptions: scenario A: 900 kgm–3; scenario B: 850 kgm–3; scenario C: 900 kgm–3 below the firn line and 600 kgm–3 above the firn line (firn line at5171.77ma.s.l.). The errors given are based on the mean error of elevation differences over non-glaciated ground following the altitude and slope distributionas well as the range of observed elevation changes of glaciated catchments. A mean density of 750 kgm–3 is used for the error computation of scenario C.
Rankl and Braun: Glacier elevation and mass changes over the central Karakoram 277

of 600 kgm–3 for the conversion of volume changes abovethe firn line and 900 kgm–3 for volume changes locatedbelow the firn line (e.g. Schiefer and others, 2007; Moholdtand others, 2010). This scenario was applied to glaciers withstable and advancing termini only (Table 2). Due to therelocation of mass during an active surge phase, a zonallyvariable conversion factor, which changes with altitude,might be inapplicable to these glaciers. We assume that thedynamic relocation, which is also clearly reflected in theelevation differences, is dominated by glacier ice.
The conversion from volume to mass is a crucial factorwhen assessing glacier mass changes using the geodeticmethod (Huss, 2013). Different densities need to beapplied for snow/firn and ice coverage. Additionally,changes in a glacier’s mass balance over time involvechanges in the firn density profile. Hence, surface loweringin the accumulation areas expressed using the geodeticmethod does not necessarily imply a loss of mass, butmight be strongly influenced by firn compaction. Due to alack of in situ measured density profiles, most studies useconstant factors when converting ice volume to mass. Huss(2013) found an overestimation of mass changes of 2–15%when assuming the density of ice for entire glaciercatchments. The author recommended applying a densityof 850�60 kgm–3 for investigation periods >5 yearsprovided that stable glacier mass-balance gradients arepresent and also that firn area and volume changes aresignificantly different from zero. In consequence, wesuggest scenario B (850 kgm–3) and scenario C to be most
appropriate to reflect mass changes of non-surge-typeglaciers in the Karakoram.
Surge-type glaciers and small-scale surface featuresGlaciers classified as surge-type showed average surfacethinning of –0.17� 0.12ma–1 and slightly negative massbudgets within the error bars (–0.14�0.09Gt a–1; scenarioB). Elevation-change measurements are a suitable tool formapping and monitoring surge-type glaciers. The re-location of mass from the ice reservoir to the ice-receivingarea during an active surge phase can be quantified. Insubsequent years, these ice masses can downwaste fasterdue to the higher ablation rates in these lower areas.Figure 2 illustrates the relocation of mass: actively surgingglaciers (between 2000 and 2012) gained mass close to thesnout and lost mass in the ice reservoir area. The mostprominent examples are glaciers No. 1 to No. 5 (Fig. 2). Forthese glaciers, the elevation differences were extractedalong their centre lines and plotted against altitude (Fig. 3a).Elevation gain and loss as well as the respective change withaltitude become visible in more detail. The combinationwith other observations based on remote sensing enablesthe identification of surge-type glaciers in an active surgecycle and the quantification of the relocation of masswithout the need for in situ measurements. Glaciers No. 13and No. 14 (Fig. 2) could not be identified as activelysurging glaciers without elevation change measurements oradditional multitemporal velocity datasets as in previousstudies (e.g. Copland and others, 2011; Rankl and others,
Fig. 3. Averaged glacier elevation differences of (a) five surge-type glaciers in an active surge phase and (b) three glaciers in a quiescentsurge cycle between 2000 and 2012. The dashed ellipse marks the formation of a bulge or kinematic wave at quiescent glacier tongues(refer also to dashed boxes in Fig. 2). The error bar of �0.12ma–1 holds for each value given here. The location of the profiles is shown inFigure 2.
Rankl and Braun: Glacier elevation and mass changes over the central Karakoram278

2014). Yet the relocation of mass from the ice-reservoir areato the ice-receiving area is visible in Figure 2, where aconcentrated mass gain close to the glacier snouts isobservable. A previous study investigating glacier elevationchanges using the geodetic method came to the sameconclusion for both glaciers (Gardelle and others, 2013).Thus, we suggest that thinning and thickening at glaciersNo. 13 and No. 14 was independent of climatic forcing,since the elevation change was driven by surge-typebehaviour. These findings stress the importance of includingelevation-change measurements when analysing glaciers inregard to surge-type behaviour.
Quiescent surge-type glaciers thinned considerably alongtheir lower tongues between 2000 and 2012 (e.g. glaciersNo. 6 and No. 12 in Figure 2: �–6� 0.12ma–1 on average).However thickening is visible between �4100 and �5000ma.s.l. (dashed labelling in Fig. 2 on glaciers No. 6, No. 12,No. 15; Fig. 3b). Upstream of these areas, elevation changeswere nearly zero or increased slightly towards the glaciers’origins. We think that the elevation gain visible in Figure 3b(see dashed ellipse, glaciers No. 6, No. 12, No. 15 in Fig. 2)represents the formation of a bulge (Clarke and others, 1984)or kinematic wave (Mayer and others, 2011). An activesurge cycle will be initiated provided that the size of thebulge exceeds a threshold and the thermal regime of theglacier or the meltwater supply changes. In a previous study,SAR-based surface velocities were analysed for Skamriglacier (No. 12 in Fig. 2; Rankl and others, 2014). Theglacier was in an active surge phase prior to 1990, sped upin 1992 (�0.8md–1) and slowed down again. It remainedquiescent until 2009 with surface velocities of �0.1–0.2md–1. However, surface flow rose again in 2011,reaching velocities of up to 1.5md–1 (Rankl and other,2014). The area of increased surface speed coincides withthe area of thickening between �4500 and �5000ma.s.l.(dashed box at glacier No. 12 in Fig. 2). Hence, there arestrong indications that Skamri glacier has entered a newactive phase of the surge cycle. The same might be true forNobande Sobonde glacier (No. 15) or Virjerab glacier (No.6). Multitemporal information on surface flow (e.g. Quinceyand others, 2011) or repeated observations of the TanDEM-X mission could confirm this interpretation and evenprovide a better understanding of the processes involved.
High-resolution elevation differences allow for a detailedanalysis of ablation/accumulation patterns at confluencezones. Glacier No. 11 (Chiring glacier; Fig. 2) is fed by threetributaries. The main trunk of Chiring glacier thinned duringthe observation period after its last active surge phase endedin 1995 (Hewitt, 2007). However, its northernmost tributaryshowed hardly changed surface elevations and is identifiableas a northern branch even below the point of confluence.Another interesting small-scale feature is visible at the glaciertongue (Fig. 2). The glacier surged between 1995 and 2000and ran into the heavily debris-covered tongue of SarpoLaggo glacier. During the advance of its tongue, mass wasshifted down-glacier and was subsequently affected by melt.After the surge, the largest part of the advanced glaciertongue was debris-free. In contrast, the surrounding tongueof Sarpo Laggo glacier hardly thinned (Fig. 2), which can beattributed to the thicker debris cover. This demonstrates theutility of high-resolution DEM comparison as small-scaleablation patterns became apparent. Further analysis of suchpatterns could help to better quantify the degree of protectiondebris provides against surface melt.
Accuracy assessmentElevation differences between the X-SRTM and TanDEM-XDEMs off-glacier were plotted as a function of altitude(Berthier and others, 2006) and slope over non-glaciatedground (Figs S4 and S5 (http://igsoc.org/hyperlink/71a024_supp.pdf)). We detected elevation biases both withincreasing altitude (>5700ma.s.l.; Fig. S4 (http://igsoc.org/hyperlink/71a024_supp.pdf)) and slope (>50°; Fig. S5 (http://igsoc.org/hyperlink/71a024_supp.pdf)). This is in agreementwith Ludwig and Schneider (2006), who found an increasedmean error of the X-SRTM DEM for slopes larger than 35°.Highest deviations of up to 30m were reported for slopes of50°. Additionally, due to the effect of radar shadows, maxi-mum height errors of 30m were found in the X-SRTM DEMon north- and west-facing slopes (Ludwig and Schneider,2006). In the present study, uncertainties in glacier elevationdifferences were estimated only for altitudes �5700ma.s.l.and slopes shallower than 50°. Height biases at altitudes>5700ma.s.l. and in very steep terrain were excluded fromthe error estimation. Additionally, the values used for theuncertainty estimation were restricted to the range of elev-ation differences measured on-glacier. We hypothesize thatinaccuracies in themeasured elevation differences on-glacierat high altitudes (>5700ma.s.l) were mainly influenced bythe X-SRTM DEM, which resulted in an overestimation ofthinning in these altitudinal bands. An overestimation ofthinning in accumulation areas in our study would furtherstrengthen the evidence for anomalous behaviour of Kara-koram glaciers with positive or balanced glacier massbudgets (Kääb and others, 2012; Gardelle and others,2013). Additional height errors might be induced by themosaicking of the TanDEM-X DEM tiles. However, the corre-lation coefficients between the TanDEM-X DEM referencetile (25 February 2012) and the tiles to be calibrated are veryhigh (R2 =�1; Fig. S2 (http://igsoc.org/hyperlink/71a024_supp.pdf)). In consequence, height differences in the finalmosaic in overlapping areas are assumed to be negligible.
Due to the use of the same radar frequency, we did notapply a correction for the spatially and temporally variablepenetration depths of the SAR signal from different wave-lengths or as necessary when comparing optical with SAR-derived DEMs. Half of the mountain range is located above5000ma.s.l. (Copland and others, 2011). Thus, dry snowconditions can be assumed resulting in no change in thephase-scattering centres of the X-band SAR signal. Yet theoccurrence of melt events before image acquisitions cannotbe ruled out completely, so the layering of the snowpackmight have changed in time. The penetration of the signals’phase centres between image acquisitions would then havebeen different. However, we do not think that the radarpenetration would be affected in the 12 year observationtime to a magnitude that would significantly bias themeasurements. Accounting for the penetration depths (e.g.when comparing optical data to the C- or X-band SRTMDEMs) implies detailed knowledge of the surface and snow-cover conditions that is not available for the region. ForC-band, penetration was estimated to range between 9�2and 1�2m for frozen firn and ice in Greenland (Rignot andothers, 2001); under dry snow conditions it can be evenmore. Penetration of the X-band frequency into snow, firnand ice is assumed to be smaller (Ulaby and others, 1986;Gardelle and others, 2012). Groh and others (2014) found aheight bias of �5m when comparing interferometric X-bandheights and NASA IceBridge laser altimetry over dry snow in
Rankl and Braun: Glacier elevation and mass changes over the central Karakoram 279
Antarctica. Seehaus and others (2015) showed a seasonallychanging X-band signal phase centre depth in the range 2–3m. In consequence, elevation change measurements ofprevious studies using different sources of elevation data(Berthier and others, 2007; Gardelle and others, 2013) areaffected by uncertainties resulting from the correction of theradar penetration depth.
CONCLUSIONSWe have shown glacier elevation differences between 2000and 2012 for parts of the central Karakoram range using thegeodetic method based on TanDEM-X and X-SRTM DEMs.Our measurements are mostly independent of temporaldecorrelation between image acquisitions due to the bistaticTanDEM-X imaging mode. We suggest that there is littleinfluence of differential X-band penetration on the elevationchange measurements. We applied different approaches inorder to convert glacier volume changes to glacier masschanges. Based on the classification in Rankl and others(2014), we showed elevation changes for surge-type, stableand advancing glaciers separately. Surge-type glaciersindicated slight surface lowering within error bars between2000 and 2012 as did advancing glaciers. The majority ofthe studied glaciers showed stable termini during theobservation period and only slight thinning of –0.09�0.12ma–1 on average, corresponding to a mass change of–0.01� 0.02Gt a–1 (scenario B). Our analysis is in accord-ance, within error bars, with previous studies investigatingglacier elevation and mass changes in the Karakoram (e.g.Kääb and others, 2012; Gardelle and others, 2013) andconfirms the anomalous behaviour of glaciers there, termedthe Pamir–Karakoram anomaly (Gardelle and others, 2013).The high resolution of both the TanDEM-X and X-SRTMDEMs revealed small-scale features of glacier behaviour(e.g. the relocation of ice from the reservoir to the receivingarea during an active surge event, kinematic waves anddifferences of surface lowering under debris cover and onbare glacier tongues). The combination of SAR-basedsurface velocities and elevation change measurementsseems to bear high potential to better understand the glaciersurge processes in the Karakoram.
We have demonstrated the suitability of the bistaticTanDEM-X Mission to study glacier volume changes oflarger regions but also consider individual glacier catch-ments. The advantages against optical DEM differencingwith respect to SRTM are that no additional corrections arerequired in order to account for the differential signalpenetration. Sparse point-based measurements derivedfrom, for example, laser altimetry (e.g. ICESat) are com-plemented by a sound statistical sampling density, even insmaller catchments. Unfortunately, globally comprehensivecoverage of the X-SRTM DEM is not available due to thelimited swath width.
We want to stress the importance of monitoring surge-type glaciers in the Karakoram and other high mountainareas using repeat remote sensing. Rapidly advancing glaciertongues might dam river valleys and hence threaten localcommunities. Failure of the moraine-dammed rivers mightresult in glacial lake outburst floods, which are very commonin the Karakoram (Hewitt, 2014). The study demonstrates thepotential of satellite missions like TanDEM-X to remap suchregions regularly (e.g. annually or twice a year) in order toreveal change and provide early warnings.
ACKNOWLEDGEMENTSThis study was kindly supported with TanDEM-X data underDLR AO mabra_XTI_GLAC0264. Landsat data were kindlyprovided by USGS and SRTM/X-SAR data by DLR, whileSRTM/SIR-C data were obtained from the Consortium forSpatial Information of the Consultative Group on Inter-national Agricultural Research (CGIAR-CSI). The researchwas financially supported by the University of Erlangen–Nuremberg, the Helmholtz-Alliance ‘Remote Sensing andEarth System Dynamics’ and DLR/BMWi grant FKZ50E1414.
REFERENCESArcher D and Fowler H (2004) Spatial and temporal variations in
precipitation in the Upper Indus Basin: global teleconnectionsand hydrological implications. Hydrol. Earth Syst. Sci. 8(1),47–61 (doi: 10.5194/hess-8-47-2004)
Barrand NE and Murray T (2006) Multivariate controls on theincidence of glacier surging in the Karakoram Himalaya. Arct.Antarct. Alp. Res., 38(4), 489–498 (doi: 10.1657/1523-0430(2006)38[489:MCOTIO]2.0.CO;2)
Berthier E, Arnaud Y, Vincent C and Rémy F (2006) Biases of SRTMin high-mountain areas: implications for the monitoring ofglacier volume changes. Geophys. Res. Lett., 33(8) (doi:10.1029/2006GL025862)
Berthier E, Arnaud Y, Kumar R, Ahmad S, Wagnon P and ChevallierP (2007) Remote sensing estimates of glacier mass balances inthe Himachal Pradesh (Western Himalaya, India). Remote Sens.Environ., 108(3), 327–338 (doi: 10.1016/j.rse.2006.11.017)
Bolch T and 11 others (2012) The state and fate of Himalayanglaciers. Science 336(6079), 310–314 (doi: 10.1126/science.1215828)
Clarke GK, Collins S and Thompson D (1984) Flow, thermalstructure, and subglacial conditions of a surge-type glacier. Can.J. Earth Sci., 21(2), 232–240 (doi: 10.1139/e84-024)
Copland L and 7 others (2011) Expanded and recently increasedglacier surging in the Karakoram. Arct. Antarct. Alp. Res. 43(4),503–516 (doi: 10.1657/1938-4246-43.4.503)
Fritz T, Rossi C, Yague-Martinez N, Rodriguez-Gonzalez F,Lachaise M and Breit H (2011) Interferometric processing ofTanDEM-X data. In IGARSS 2011, International Geoscience andRemote Sensing Symposium, 24–29 July 2011, Vancouver,B.C., Canada. Proceedings. Institute of Electrical and Elect-ronics Engineers, Piscataway, NJ, 2428–2431 (doi: 10.1109/IGARSS.2011.6049701)
Gamma Remote Sensing (2007) GAMMA Differential Interferom-etry and Geocoding Software (DIFF/GEO). Gamma RemoteSensing, Gumligen
Gardelle J, Berthier E and Arnaud Y (2012) Impact of resolution andradar penetration on glacier elevation changes computed fromDEM differencing. J. Glaciol., 58(208), 419–422 (doi: 10.3189/2012JoG11J175)
Gardelle J, Berthier E, Arnaud Y and Kääb A (2013) Region-wideglacier mass balances over the Pamir–Karakoram–Himalayaduring 1999–2011. Cryosphere, 7(4), 1263–1286 (doi: 10.5194/tc-7-1263-2013)
Gardner AS and 9 others (2013) A reconciled estimate of glaciercontributions to sea level rise: 2003 to 2009. Science,340(6134), 852–857 (doi: 10.1126/science.1234532)
Goldstein RM and Werner CL (1998) Radar interferogram filteringfor geophysical applications. Geophys. Res. Lett., 25(21), 4035–4038 (doi: 10.1029/1998GL900033)
Groh A and 11 others (2014) Mass, volume and velocity of theAntarctic ice sheet: present-day changes and error effects. Surv.Geophys., 35(6), 1481–1505 (doi: 10.1007/s10712-014-9286-y)
Hewitt K (1969) Glacier surges in the Karakoram Himalaya (centralAsia). Can. J. Earth Sci. 6(4), 1009–1018 (doi: 10.1139/e69-106)
Rankl and Braun: Glacier elevation and mass changes over the central Karakoram280
Hewitt K (1998) Recent glacier surges in the Karakoram Himalaya,South Central Asia. Eos, 79(8), 104–105
Hewitt K (2007) Tributary glacier surges: an exceptional concen-tration at Panmah Glacier, Karakoram Himalaya. J. Glaciol.53(181), 181–188 (doi: 10.3189/172756507782202829)
Hewitt K (2014) Glaciers of the Karakoram Himalaya: glacialenvironments, processes, hazards and resources. Springer, Berlin
Hoffmann J and Walter D (2006) How complementary are SRTM-Xand-C band digital elevation models? Photogramm. Eng.Remote Sens., 72(3), 261–268 (doi: 10.14358/PERS.72.3.261)
Huss M (2013) Density assumptions for converting geodetic glaciervolume change to mass change. Cryosphere 7(3), 877–887 (doi:10.5194/tc-7-877-2013)
Immerzeel WW, Van Beek LP and Bierkens MF (2010) Climatechange will affect the Asian water towers. Science, 328(5984),1382–1385 (doi: 10.1126/science.1183188)
Kääb A, Berthier E, Nuth C, Gardelle J and Arnaud Y (2012)Contrasting patterns of early twenty-first-century glacier masschange in the Himalayas. Nature 488(7412), 495–498 (doi:10.1038/nature11324)
Kääb A, Treichler D, Nuth C and Berthier E (2015) BriefCommunication: Contending estimates of 2003–2008 glaciermass balance over the Pamir–Karakoram–Himalaya. Cryo-sphere, 9(2), 557–564 (doi: 10.5194/tc-9-557-2015)
Kapnick SB, Delworth TL, Ashfaq M, Malyshev S and Milly PCD(2014) Snowfall less sensitive to warming in Karakoram than inHimalayas due to a unique seasonal cycle. Nature Geosci.,7(11), 834–840 (doi: 10.1038/ngeo2269)
Kaser G, Großhauser M and Marzeion B (2010) Contributionpotential of glaciers to water availability in different climateregimes. Proc. Natl Acad. Sci., 107(47), 20 223–20 227 (doi:10.1073/pnas.1008162107)
Kienholz C, Rich JL, Arendt AA and Hock R (2014) A new methodfor deriving glacier centerlines applied to glaciers in Alaska andnorthwest Canada. Cryosphere 8(2), 503–519 (doi: 10.5194/tc-8-503-2014)
Krieger G and 6 others (2007) TanDEM-X: a satellite formation forhigh-resolution SAR interferometry. IEEE Trans. Geosci. RemoteSens., 45(11), 3317–3341 (doi: 10.1109/TGRS.2007.900693)
Ludwig R and Schneider P (2006) Validation of digital elevationmodels from SRTM X-SAR for applications in hydrologicmodeling. ISPRS J. Photogramm. Remote Sens., 60(5),339–358 (doi: 10.1016/j.isprsjprs.2006.05.003)
Marzeion B, Jarosch AH and Hofer M (2012) Past and future sea-level change from the surface mass balance of glaciers.Cryosphere 6(6), 1295–1322 (doi: 10.5194/tc-6-1295-2012)
Mätzler C and Schanda E (1984) Snow mapping with activemicrowave sensors. Remote Sens., 5(2), 409–422 (doi: 10.1080/01431168408948816)
Mayer C, Fowler A, Lambrecht A and Scharrer K (2011) A surge ofNorth Gasherbrum Glacier, Karakoram, China. J. Glaciol.,57(205), 904–916 (doi: 10.3189/002214311798043834)
Meier MF and Post A (1969) What are glacier surges? Can. J. EarthSci., 6(4), 807–817 (doi: 10.1139/e69-081)
Moholdt G, Nuth C, Hagen JO and Kohler J (2010) Recent elevationchanges of Svalbard glaciers derived from ICESat laser altimetry.Remote Sens. Environ., 114(11), 2756–2767 (doi: 10.1016/j.rse.2010.06.008)
Mölg T, Maussion F and Scherer D (2014) Mid-latitude westerlies asa driver of glacier variability in monsoonal High Asia. NatureClimate Change, 4(1), 68–73 (doi: 10.1038/nclimate2055)
Neckel N, Braun A, Kropáček J and Hochschild V (2013) Recentmass balance of the Purogangri Ice Cap, central Tibetan Plateau,by means of differential X-band SAR interferometry. Cryosphere,7(5), 1623–1633 (doi: 10.5194/tc-7-1623-2013)
Neckel N, Kropáček J, Bolch T and Hochschild V (2014) Glaciermass changes on the Tibetan Plateau 2003–2009 derived fromICESat laser altimetry measurements. Environ. Res. Lett., 9(1),014009 (doi: 10.1088/1748-9326/9/1/014009)
Quincey DJ, Braun M, Glasser NF, Bishop MP, Hewitt K andLuckman A (2011) Karakoram glacier surge dynamics. GeophysRes. Lett., 38, L18504 (doi: 10.1029/2011GL049004)
Radić V and Hock R (2011) Regionally differentiated contributionof mountain glaciers and ice caps to future sea-level rise. NatureGeosci., 4(2), 91–94 (doi: 10.1038/ngeo1052)
Rankl M, Kienholz C and Braun M (2014) Glacier changes in theKarakoram region mapped by multimission satellite imagery.Cryosphere 8(3), 977–989 (doi: 10.5194/tc-8-977-2014)
Rignot E, Echelmeyer K and Krabill W (2001) Penetration depth ofinterferometric synthetic-aperture radar signals in snow andice. Geophys. Res. Lett., 28(18), 3501–3504 (doi: 10.1029/2000GL012484)
Scherler D, Bookhagen B and Strecker M. (2011) Spatially variableresponse of Himalayan glaciers to climate change affected bydebris cover. Nature Geosci., 4(3), 156–159 (doi: 10.1038/ngeo1068)
Schiefer E, Menounos B and Wheate R (2007) Recent volume lossof British Columbian glaciers, Canada. Geophys. Res. Lett.,34(16), L16503 (doi: 10.1029/2007GL030780)
Seehaus T, Marinsek S, Helm V, Skvarca P and Braun M (2015)Changes in ice dynamics, elevation and mass discharge ofDinsmoor–Bombardier–Edgeworth glacier system, AntarcticPeninsula. Earth Planet. Sci. Lett., 427, 125–135 (doi:10.1016/j.epsl.2015.06.047)
Shuman CA, Berthier E and Scambos TA (2011) 2001–2009elevation and mass losses in the Larsen A and B embayments,Antarctic Peninsula. J. Glaciol., 57(204), 737–754 (doi: 10.3189/002214311797409811)
Ulaby FT, Moore RK and Fung AK (1986) Microwave remotesensing, active and passive. Vol. III: From theory to applications.Artech House, Norwood, MA
Werner C, Wegmüller U, Strozzi T and Wiesmann A (2000)Gamma SAR and interferometric processing software. Proceed-ings of the ERS–ENVISAT Symposium, Gothenburg, Sweden,16–20 October 2000. European Space Agency, Noordwijk
Yao T and 9 others (2012) Different glacier status with atmosphericcirculations in Tibetan Plateau and surroundings. NatureClimate Change, 2(9), 663–667 (doi: 10.1038/nclimate1580)
Rankl and Braun: Glacier elevation and mass changes over the central Karakoram 281