GIZ – Thermal Power Plant Flexibility Improvements in Chile · PDF fileGIZ –...
133
www.laborelec.com LBE04118739 - 3.0 | 1 of 133 Restricted GIZ – Thermal Power Plant Flexibility Improvements in Chile 14 Mar 2017
Transcript of GIZ – Thermal Power Plant Flexibility Improvements in Chile · PDF fileGIZ –...

www.laborelec.com LBE04118739 - 3.0 | 1 of 133
Restricted
GIZ – Thermal Power Plant Flexibility Improvements in Chile
14 Mar 2017

© Laborelec www.laborelec.com Restricted LBE04118739 - 3.0 | 2 of 133
GIZ – Thermal Power Plant Flexibility Improvements in Chile
Prepared for
GIZ
In the framework of
WBS SPR04875
Written by
Arnaud Lambert / Thomas Grandry / Sebastián Michels / Xavier Degive / Julio González
This document is electronically signed.
Verifier
Demaude Olivier
Approver
Junge Cristian
Approver
Stockmans Pieter-Jan
Este estudio fue realizado para GIZ en el marco del proyecto “Fomento de la energía solar en Chile” por encargo del Ministerio de Medio Ambiente de Alemania y el Ministerio de Energía de
Chile como contraparte oficial.

© Laborelec www.laborelec.com Restricted LBE04118739 - 3.0 | 3 of 133
ENGIE Lab – Laborelec
ENGIE Lab Laborelec performs contract research and technical expertise services in electrical power
technology. Active in more than 100 countries, we enhance the business performance of our customers,
protect the value of their investments and drive innovation towards the energy systems of the future.
Benefitting from the skills of 240 specialists, our activities encompass the entire electrical power value chain,
including electricity generation, transmission, distribution, storage and end-use. We combine expert
knowledge and operational experience with state-of-the-art measurement and analysis capability. We
guarantee the independence and objectivity of our solutions and recommendations.
ENGIE Lab Laborelec is part of the Research and Technologies Department of the ENGIE group, a world
leader in energy. Backed by the international network of ENGIE Labs and by international partners, we
provide worldwide solutions to help our customers successfully come through the energy transition.
Laborelec Chile is an International Center of Excellence supported by CORFO.
ENGIE LAB
LABORELEC BELGIUM
Rodestraat 125
1630 Linkebeek
Belgium
ENGIE LAB
LABORELEC THE NETHERLANDS
Amerikalaan 35
6199 AE Maastricht-Airport
The Netherlands
ENGIE LAB
LABORELEC GERMANY
Bromberger Strasse 39-41
42281 Wuppertal
Germany
ENGIE LAB
LABORELEC CHILE SPA
Avenida Apoquindo 3721
3er piso, oficina 32
Santiago de Chile
ENGIE LAB
LABORELEC MIDDLE-EAST
Office 135-FD
Level1, Incubator Building
Masdar City
Abu Dhabi, UAE

© Laborelec www.laborelec.com Restricted LBE04118739 - 3.0 | 4 of 133
GIZ – Thermal Power Plant Flexibility Improvements in Chile
Version number Date Description and modification history
LBE04118739 - 3.0 14 Mar 2017 New report.
Abstract
Chilean electricity market has experienced an accelerated increase in the penetration of
variable renewable energies and they are expected to represent a significant part of the
energy mix in the coming years (~40% by 2030). Thermal plants will keep a key role in the
future to provide flexibility to the grid in order to integrate this new intermittent energy supply.
In this context, the Deutsche Gesellschaft für Internationale Zusammenarbeit (GIZ) GmbH
and the Chilean Ministry of Energy, jointly requested ENGIE Lab Laborelec support to define
standards in order to optimize the flexibility of the current and future fleet in Chile.
This report describes the organization of the power system in European countries and
summarizes typical benchmark performances. From those examples, a comparison is made
with the current situation in Chile and a set of recommendations is ultimately provided to
feed the discussion for the new regulatory framework in Chile.
Executive summary
The successful integration of intermittent renewable energy sources in the Chilean Energy
mix will require an increased degree of flexibility of the power system that will challenge the
operation of the conventional thermal fleet. In this scenario, the regulatory framework is a
key influencing factor to realize the objectives defined by the Chilean authority.
The evolution of the European thermal plants, initially designed for base load, to flexible
units was mainly driven by a very competitive market in a context of overcapacity. It
demonstrates that significant improvements can be realized when enough incentives exist.
This report begins with a review of the market mechanisms put in place by the authorities of
two European countries, namely Italy and Belgium, which fostered the improvement of the
operational parameters such as turn down, ramp rates and start up times to achieve more
system flexibility (Chapter 2). European context is taken into account. The organization of
the ancillary services in Italy and Belgium, which adopt different approaches on some topics,
can clearly be used as examples in Chile to develop a new regulatory framework while taking
into consideration the specificities of the country and the conceptual choices made by the
authorities.
The grid in Italy is somehow comparable to the Chilean one, with an antenna structure for
energy distribution, low exchange capacity with the neighbouring countries as well as limited
transport capacity from North to South within the grid. High percentage of conventional
thermal power plants (Gas, Coal) provides the energy. The share of renewable energy is
continuously increasing.

© Laborelec www.laborelec.com Restricted LBE04118739 - 3.0 | 5 of 133
Belgium, on the other hand, has a highly interconnected network, within the country as well
as with the neighbouring countries. A high share of non-flexible nuclear power provides the
energy, as well as a mix of Gas assets and one large energy storage (pumped hydro) system
of around 1GW. In this context CCGTs are requested to stop and start very frequently.
Beyond the specific attributes of Italy and Belgium markets, both ancillary services markets
are characterized by the clear definition of products and technical requirements plants
should meet in order to provide the services.
Chapter 2 also provides the technical definitions of the relevant concepts commonly used to
characterize the ancillary services, the technical operation of the plants and the electricity
market, which may be used as a reference.
The market review is followed by the analysis of the impact of power system requirements
on operational parameters of thermal plants, the technical/environmental limitations for
flexible operation and an international benchmark of operational parameters (Chapter 3).
To participate in the flexibility market, power plants have to comply with specific technical
requirements for the provision of the services, which at the plant level are met by challenging
operational parameters. This link between system requirements and operational parameters
is explained. It is also shown how in a highly competitive environment, plants were given
financial incentives to improve their parameters over the years in order to catch market
opportunities and remain profitable.
To characterize the limitations for the improvement of the operational parameters, three
categories were defined: Rankine Cycles, Combined Cycles (CCGTs) and Open Cycles
(OCGTs). For each category, the typical hurdles to improve the operational parameters that
are most important for the provision of ancillary services (focus on frequency control) are
explained. For instance ramp rate, Pmax increase and Pmin reduction among others are
analysed.
Same categories were considered in a performance benchmark, which includes more than
45 European thermal assets from 11 different countries. Values of relevant flexibility
parameters such as Pmin, Pmax, relative turndown, ramp rate, start up times, minimum up and
down time are provided in percentile ranges, to illustrate the average performance and
spread for each power plant category. The benchmark concludes the review of the
international best practices.
Chapter 4 describes the current situation in Chile, providing an overview of the electric
systems, market organization, regulatory framework and emission limits. This chapter is
followed by the gap analysis, where gaps are detected between the reference cases taken
in EU and the current situation in Chile.
First, gaps in the definition of operational parameters as defined in the NTSyCS with respect
to the definition proposed in the international review are detailed. The following was
identified:
Minimum power output definition: the incompatibility between DS N° 13/2011 and
the NTSyCS is highlighted.
Start-up time definition: the necessity of defining more types of start-up times is
pointed out and the concept of start-up curve is presented as a possibility.
Furthermore, the influence of the preparation time on the start-up time is explained.

© Laborelec www.laborelec.com Restricted LBE04118739 - 3.0 | 6 of 133
Ramp rate, minimum uptime and downtime are not defined in the NTSyCS but are
declared by power plants.
The second section of the analysis describes the gaps related to grid infrastructure and
energy and ancillary services markets. The main differences between Italy, Belgium and
Chile are summarized in comparison tables. Significant differences exist in the organization
of the power system between Europe and Chile, a main one being the central dispatching
of the plants in Chile. Regarding ancillary services, points of interest for Chile are listed
hereunder:
No bid market for ancillary services and no specific capacity payment: the selection
is made by the central authority based on a techno-economical choice
PFC approach is different in SIC and SING: like Belgium for SIC (selected units)
and like Italy for SING (de-rating on all thermal units)
No on-line testing of the PFC
Requirements are imposed at individual plants level (as for Italy)
Tertiary reserve is part of the central dispatching management (not a specific
“requirement”)
Next, gaps in the operational parameters are analysed in detail. For each technology the
start-up time, ramp rate, relative turndown, minimum uptime and minimum downtime of the
thermal assets in Chile are compared with the European thermal assets. Additional
international reference values from the literature are also taken into account. The report
points out several technical under performances of the current Chilean fleet which could be
improved. Main findings are described below:
Rankine cycles: In terms of ramp rate and turndown, the fleet of Rankine cycles in
Chile were found to be as flexible as the references in Europe (excluding USC
units), but much less flexible than some other international references.
Combined cycles: In Chile, the fleet of CCGTs were found to be less flexible in
comparison to the fleet of CCGTs taken in Europe, especially in terms of ramp
rates and turndown. The same observation is made with a comparison with
international references.
Open cycles: In Chile, the fleet of OCGTs are not found to be flexible in comparison
to the fleet of OCGTs in Europe, in particular in term of start-up time.
Finally, gaps found regarding the emission limit values point out that CO and NOx emission
limits play a key role on the definition on the Pmax and Pmin of OCGTs and CCGTs. While
NOx emission limits in Chile are found to be equivalent to the value of the IE-D (European
Industrial Emissions Directive) and to the P50 of the benchmark, there is no limit for CO
emissions defined. Additionally, in Chile the emission limits apply at part-loads, making the
regulation sometimes more stringent than in Europe. In Europe, the IE-D set minimum
emission limits for an operation above 70% of the load. The emission limit for an operation
below 70% are set by the local authorities, which can introduce more flexibility in the
emission limit for part load operation.
The report concludes with a series of proposals that Engie Lab Laborelec sees as
opportunities to support future grid flexibility, such as:

© Laborelec www.laborelec.com Restricted LBE04118739 - 3.0 | 7 of 133
Measures to increase the transparency in the grid balancing needs, by further
packaging the requirements for ancillary services in clear products
Measures to improve the verification of the real plant performances, e.g. by
online remote testing for PFC
Incentives for the supply of ancillary services, in order to push the plants to
improve their flexibility performances, e.g. with specific bid mechanism
A clear framework which assures that new plants are in line with best practices
All suggestions are summarized in the roadmap at the end of the report. The proposals are
based on a high level evaluation aiming at feeding the discussion on the new regulatory
framework for thermal power plants in Chile. Difference between the following scenarios is
made:
Measures which could be taken with the current organization of the ancillary
services (no market)
Measures applicable if an ancillary service market is put in place
Measures applicable if an energy market (decentralized dispatching) is put in
place

© Laborelec www.laborelec.com Restricted LBE04118739 - 3.0 | 8 of 133
Contents
Abbreviations ................................................................................................................................... 11
1. Introduction and context .................................................................................................... 14
2. Study Cases and Analysis of International Best Practices................................................. 16 2.1. Technical Definitions .............................................................................................. 16
Ancillary Services ........................................................................................ 16 Operational Parameters (*) ......................................................................... 19 Electricity market ......................................................................................... 26
2.2. European context [11] ............................................................................................ 27 Evolution of the electricity market liberalisation in EU [12] .......................... 27 Overview of EU energy market ................................................................... 29
2.2.2.1. Grid management .................................................................................. 29 2.2.2.2. Electricity markets .................................................................................. 30
ENTSO-E technical requirements [3] .......................................................... 32 2.2.3.1. Ancillary services ................................................................................... 32 2.2.3.2. Other requirements ................................................................................ 34
Emissions .................................................................................................... 36 2.3. Description of the Italian Flexibility Market ............................................................. 37
Overview of the Italian market [15] .............................................................. 37 Market organization [16] .............................................................................. 38
2.3.2.1. Day ahead market .................................................................................. 39 2.3.2.2. Intraday market ...................................................................................... 40 2.3.2.3. Ancillary Services Market ....................................................................... 41 2.3.2.4. Forward market MTE, IDEX and CDE platform ...................................... 41 2.3.2.5. Capacity payments for planned shortage (“essential plants”) ................ 42
Extra considerations about the Italian system ............................................. 42 Detailed information about the Ancillary Services ....................................... 42
2.3.4.1. Primary Frequency Control – PFC (R1) ................................................. 43 2.3.4.2. Secondary Frequency Control (R2)........................................................ 44 2.3.4.3. Tertiary Frequency Control (R3) ............................................................ 45 2.3.4.4. Black start .............................................................................................. 46 2.3.4.5. Reactive power supply ........................................................................... 47
Energy imbalance penalties ........................................................................ 47 Summary table and key highlights .............................................................. 48 Market evolution [23] ................................................................................... 48
2.4. Description of the Belgian Flexibility Market ........................................................... 49 Overview of the Belgian Market [24] ........................................................... 49 Market Organization [25] ............................................................................. 49
2.4.2.1. Day ahead market .................................................................................. 50 2.4.2.2. Intraday market ...................................................................................... 51

© Laborelec www.laborelec.com Restricted LBE04118739 - 3.0 | 9 of 133
2.4.2.3. Ancillary service market ......................................................................... 51 2.4.2.4. Forward market ...................................................................................... 51 2.4.2.5. Capacity payment for planned shortage (“strategic reserve”) ................ 51
Extra considerations about the Belgian system........................................... 52 Detailed information about the Ancillary Services ....................................... 52 Imbalance penalties .................................................................................... 56 Summary table and key highlights .............................................................. 57 Market evolution .......................................................................................... 57
2.5. Comparison tables ................................................................................................. 58
3. Impact of flexibility on thermal plants and technical limitations .......................................... 59 3.1. Conventional Power Plant Categories .................................................................... 59 3.2. Impacts of the power system requirements on the technical parameters of thermal
plants ...................................................................................................................... 60 3.3. Technical limitations for each category (including emissions) ................................ 66
Rankine cycles ............................................................................................ 66 CCGTs ........................................................................................................ 69 OCGTs ........................................................................................................ 75 Emissions .................................................................................................... 76
3.4. Performance benchmark for each category............................................................ 77 3.4.1.1. Rankine cycles ....................................................................................... 78 3.4.1.2. CCGTs ................................................................................................... 79 3.4.1.3. OCGTs ................................................................................................... 80
4. Analysis of the current situation in Chile ............................................................................ 81 4.1. Overview of Chilean Electric Systems .................................................................... 81 4.2. Market Organization ............................................................................................... 83
4.2.1.1. Spot Market ............................................................................................ 83 4.2.1.2. Financial Market ..................................................................................... 84
4.3. Regulatory framework for Ancillary Services .......................................................... 85 4.3.1.1. Primary Frequency Control (PFC) .......................................................... 86 4.3.1.2. Secondary Frequency Control (PFC) ..................................................... 87 4.3.1.3. Voltage Control ...................................................................................... 87 4.3.1.4. Service Recovery Plans (SRP) .............................................................. 88 4.3.1.5. Load Shedding Schemes ....................................................................... 88 4.3.1.6. Evolution mechanisms in the regulatory framework for ancillary services
88 4.4. Emission limits in Chile for thermal power plants ................................................... 89
Evolution mechanisms related to emissions limits in Chile ......................... 90
5. Gap analysis ...................................................................................................................... 92 5.1. Gaps in Definitions for Operational Parameters ..................................................... 92
Minimum power output (Pmin) ...................................................................... 92 Start-up times .............................................................................................. 92 Ramp rate, minimum uptime and downtime ................................................ 94
5.2. Gaps in the grid organization, energy and ancillary markets .................................. 94 Grid infrastructure ....................................................................................... 94 Energy market organization ........................................................................ 96 Ancillary services ........................................................................................ 97
5.3. Gaps in the operational parameters of thermal power plants ................................. 99 Rankine cycles .......................................................................................... 100

© Laborelec www.laborelec.com Restricted LBE04118739 - 3.0 | 10 of 133
5.3.1.1. Relative turndown ................................................................................ 100 5.3.1.2. Ramp rate ............................................................................................ 101 5.3.1.3. Cold start-up time ................................................................................. 102
Minimum uptime ........................................................................................ 103 Minimum downtime ................................................................................... 104 CCGTs ...................................................................................................... 104
5.3.4.1. Relative turndown ................................................................................ 105 5.3.4.2. Ramp rate ............................................................................................ 106 5.3.4.3. Cold start-up time ................................................................................. 107
Minimum uptime ........................................................................................ 108 Minimum downtime ................................................................................... 109 OCGTs ...................................................................................................... 110
5.3.7.1. Relative turndown ................................................................................ 110 5.3.7.2. Ramp rate ............................................................................................ 111 5.3.7.3. Start-up time ........................................................................................ 112 5.3.7.4. Minimum uptime ................................................................................... 113 5.3.7.5. Minimum downtime .............................................................................. 113
5.4. Gaps in emission regulations ............................................................................... 114 Limit values ............................................................................................... 114 Application ................................................................................................ 115
6. Proposed Roadmap for the future ................................................................................... 116 6.1. Measures which could be taken with the current organization of the ancillary
services (no market) ............................................................................................. 116 6.2. Measures applicable if an ancillary service market is put in place........................ 120 6.3. Measures applicable if an energy market (decentralized dispatching) is put in place
............................................................................................................................. 122
Bibliography.......................................................................................................... 124
Overview of Chilean Thermal Fleet ...................................................................... 127
List of figures ........................................................................................................ 131

© Laborelec www.laborelec.com Restricted LBE04118739 - 3.0 | 11 of 133
Abbreviations
ACE Area Control Error
AEEGSI Italian Regulatory Authority for Electricity, Gas and Water
AGC Automatic Generation Control
ARP Access Responsible Parties
AS Ancillary Services
BAT Best Available Techniques
Belpex Belgian power exchange
BOP Balance Of Plant
BREF Best available techniques Reference document
CC, CCGT Combined-Cycle, Combined-Cycle Gas Turbine
CDE Consegna derivati energia - Market for Electricity Derivatives operated by the Borsa
Italiana
CDEC Centro de Despacho Económico de Carga - Load Dispatch Center (Chile)
CE Continental Europe
CFPP Coal-Fired Power Plant [1]
CHP Combined Heat and Power (aka. cogeneration)
CNE Comision Nacional de Energia – Chilean National Commission of Energy
CO Carbon Monoxide
DLN Dry Low NOx
DS Decreto Supremo - Supreme Decree
DSM Demand Side Management
DSO Distribution System Operator
ELIA Belgian TSO
ELL ENGIE Lab Laborelec
ELV Emission Limit Value
ENTSO-E European Network of Transmission System Operators
ESP Electrostatic Precipitator
ERNC Energías Renovables No Convencionales – Renewable Energy Sources (w/o large
hydro)
FF Fabric Filter

© Laborelec www.laborelec.com Restricted LBE04118739 - 3.0 | 12 of 133
FGT Flue Gas Treatment
GIZ Gesellschaft für Internationale Zusammenarbeit - German Corporation for
International Cooperation
GME Gestore dei Mercati Energetici – Load Dispatch Center (Italy)
GT Gas Turbine
HRSG Heat Recovery Steam Generator
ICE InterContinental Exchange
IDEX Italian Derivatives Energy Exchange
IE-D Industrial Emission Directive
IEM Infraestructura Energética Mejillones
ISO Independent System Operator, or International Organization for Standardization
when referring to RSC
LCP-D Large Combustion Plant Directive
LTSA Long-Term Service Agreement
MB Mercato del Bilanciamento - Real-time Balancing Market (Italy)
MCR Maximum Continuous Rating
MGP Mercato del Giorno Prima - Day-Ahead Market (Italy)
MI Mercato Infragiornaliero - Intraday Market (Italy)
MPE Mercato elettrico a pronti - Spot Electricity Market (Italy)
MRC Multi Regional Coupling
MSD Mercato dei Servizi di Dispacciamento - Ancillary Services Market (Italy)
MTE Mercato a Termine - Forward Electricity Market (Italy)
NOx Mono-nitrogen oxides
NRA National Regulatory Authority
NTSyCS Norma Técnica de Seguridad y Calidad del Servicio – Chilean Grid Code
OC, OCGT Open-Cycle, Open-Cycle Gas Turbine
OEM Original Equipment Manufacturer
P10, P50, P90 10th percentile, 50th percentile, 90th percentile
PC Pulverized Coal
PFC Primary Frequency Control
PM, PM10,
PM2.5
Particulate Matter, Particulate Matter 10 micrometres or less in diameter, Particulate
Matter 2.5 micrometres or less in diameter
Pmax Maximum net active power

© Laborelec www.laborelec.com Restricted LBE04118739 - 3.0 | 13 of 133
Pmin, Pmin_env,
Pmin_tech, Pmin
exceptional
Minimum net active power, Environmental Pmin, Technical Pmin, Exceptional Pmin
R1 Equivalent to “Primary Frequency Control”
R2 Equivalent to “Secondary Frequency Control”
R3 Equivalent to “Tertiary Frequency Control”
RC Rankine Cycle
RES Renewable Energy Sources
RM Region Metropolitana – Santiago Metropolitan Region
RSC Reference Site Conditions
RES Renewable Energy Sources (usually non dispatchable RES in this report)
RSC Reference Site Conditions
SADI Sistema Argentino de Interconexión – Interconnected System of Argentina
SCR Selective Catalyst Reduction
SFC Secondary Frequency Control
SIC Sistema Interconectado Central - Central Interconnected System
SIN Sistema Interconectado Nacional – National Interconnected System
SING Sistema Interconectado del Norte Grande - Interconnected System of Norte Grande
SRP Service Recovery Plan
TERNA Italian TSO
TFC Tertiary Frequency Control
TSO Transmission System Operator
USC Ultra-Super Critical
VSD, or VFD Variable Speed Drive, or Variable Frequency Drive

© Laborelec www.laborelec.com Restricted LBE04118739 - 3.0 | 14 of 133
1. Introduction and context
In the latest years, Chilean electricity market has experienced an accelerated increase in
the penetration of variable renewable energies and most challenging scenarios foresee that
their participation in energy production might scale up to approximately 40% in 2029 [mesa
ERNC] and even 60% towards 2050 [GIZ]. Given the fact that these energy sources are
variable and difficult to predict, the successful integration into the power system requires
certain degree of flexibility that challenges the operation of conventional thermal generation
fleet.
In this context, The Deutsche Gesellschaft für Internationale Zusammenarbeit (GIZ) GmbH
and the Chilean Ministry of Energy, jointly request support for defining standards for the
design, operation and maintenance of thermal power plants, so that the actual and the future
fleet in the Chilean electricity market is able to operate in a more flexible way.
The purpose of the study is to provide recommendations to the Chilean Regulatory Authority
CNE (Comisión Nacional de Energía) for establishing a regulatory framework for thermal
power plants, which fosters the increase in the flexibility of the power system.
The study is divided in three steps:
Fist, a review of the international best practice is performed comprising two countries: Italy
and Belgium, which were selected based on their geographic, grid and market
characteristics. General European context is also taken into account.
Italy, to some extent, has a comparable grid like in Chile, with an antenna structure for
energy distribution. Low interchange capacity with the neighbouring countries as well as
limited transport capacity from North to South within the grid. High percentage of traditional
power plants (gas, coal) provide the energy. The weight of renewable energy is continuously
increasing.
Belgium, on the other hand, has a highly interlinked network, within the country as with the
neighbouring countries. A high percentage of non-flexible nuclear power generation
provides the energy, as well as a mix of gas assets and one large energy storage (hydro)
system of around 1GW. In this context CCGTs are requested to stop and start very
frequently.
The review focuses on four topics:
Mechanisms employed by the TSOs and relevant authorities to foster system
flexibility, including the analysis of how technical improvement of plants was mainly
driven by market mechanisms.
International performance benchmark for the defined thermal power plant
categories: Rankine cycles, combined cycles and open cycles. Emissions limits are
also considered.
Technical and environmental aspects that might be a limitation for flexible
operation.
Technical definitions of the relevant concepts commonly used to characterize the
ancillary services, the technical operation of the plants and the electricity market.

© Laborelec www.laborelec.com Restricted LBE04118739 - 3.0 | 15 of 133
The international review is followed by the analysis of the current situation in Chile and the
corresponding gap analysis. Market/grid structure and technical performance of Chilean
thermal fleet are compared to the international best practice and the most important
differences are analysed.
Finally, based on the gap analysis findings the study is concluded by a series of proposals
that aim to feed the discussion on the new regulatory framework for thermal power plants.

© Laborelec www.laborelec.com Restricted LBE04118739 - 3.0 | 16 of 133
2. Study Cases and Analysis of International Best
Practices
2.1. Technical Definitions
This section provides the technical definitions of the relevant concepts commonly used to
characterize the ancillary services, the technical operation of the plants and the electricity
market.
When applicable, the reference to the European grid code or website from which the
definition was extracted is mentioned.
The other definitions are proposed by the authors based on Engie Lab Laborelec (ELL)
experience. They are marked with an asterisk (*).
Ancillary Services
Ancillary services [2]
Range of functions which TSOs contract so that they can guarantee system security. These
include black start capability (the ability to restart a grid following a blackout), frequency
response (Primary and Secondary frequency control), fast reserve/Tertiary Frequency
Control (which can provide additional energy when needed) and the provision of reactive
power.
Black start capability [3]
Capability of recovery of a power plant from a total shutdown through a dedicated auxiliary
power source without any electrical energy supply external to the power plant.
Control area [3]
A coherent part of the ‘Continental Europe’ of ENTSO-E Interconnected System (generally
coinciding with the territory of a country, a geographical area whose borders are physically
delimited by meters for power and energy exchanged with the remaining part of the
interconnected grid) where a single system operator is in charge, and on which the physical
loads and controllable generation are connected inside the same Control area.
Day ahead energy market [4]
The trading of bids for the purchase and supply of electrical energy for each period regarding
the next operating day following that of trading.
Droop [3]
Ratio of a steady-state change of frequency to the resulting steady-state change in active
power output, expressed in percentage terms. The change in frequency is expressed as a
ratio to nominal frequency and the change in active power expressed as a ratio to maximum
capacity or actual active power at the moment the relevant threshold is reached.
It can be expressed by the following formula:

© Laborelec www.laborelec.com Restricted LBE04118739 - 3.0 | 17 of 133
𝑆(%) =
∆𝑓𝑓𝑛
⁄
∆𝑃𝑃𝑚𝑎𝑥
⁄
Where 𝑆 is the droop, ∆𝑓 is the variation of frequency on the grid, ∆𝑃 is the corresponding
active power to be supplied. 𝑓𝑛 and 𝑃𝑚𝑎𝑥 are the nominal frequency and maximum capacity.
Frequency response deadband (Δfmin) [3]
Interval used intentionally to make the frequency control unresponsive (Figure 1).
Intra-day market (IDM) [4]
The trading of bids and offers for the purchase and supply of electrical energy for adjusting
injection and withdrawal programmes set on the Day Ahead Energy Market.
Max frequency deviation (Δfmax) (*)
Frequency deviation from which no extra reaction is awaited (Figure 1).
Primary Frequency Control (PFC) [3]
Capability of a power plant to adjust automatically its active power output in response to a
measured deviation of system frequency from a setpoint, in order to maintain stable system
frequency (Figure 1).
Figure 1. Primary frequency control. See below for ΔPmax definition.
The PFC is also called “R1” in this report (common denomination in Belgium and Italy).
Regulation zone [3]
A portion of the ENTSO-E Interconnected System “Continental Europe”, generally coinciding
with the territory of a country or of a geographical area, physically delimitated by the location
of measurement points for the exchange of energy and power with the remaining part of the
interconnected grid.
SFC half band [4]
The maximum variation in power which can be requested in increase or decrease, with
respect to the binding programme, for SFC. The value of the half band can be different
upwards and downwards. The agreed / sold half-band amplitude can vary during the day
(Figure 2).

© Laborelec www.laborelec.com Restricted LBE04118739 - 3.0 | 18 of 133
Figure 2. SFC Half band. The set point from the TSO is expressed in % of the half-band (α): positive values upwards, negative values downwards.
Primary Voltage Control [4]
Automatic voltage control function of a generator which aims at regulating the reactive
energy production, following a voltage variation, in order to maintain the voltage at its
reference value at the generator terminals or at the high voltage connection point of the
power station.
Secondary Frequency Control (SFC) [4]
Automatic, centralised load and frequency control which aims at regulating the production
of generators within a Control area, in order to maintain the scheduled power programmes
at the interconnection and to bring the system frequency back to its reference value.
The SFC is also called “R2” in this report (common denomination in Belgium and Italy).
Synchronous area [3]
An area covered by interconnected systems whose control areas are interconnected in a
synchronous way. The system frequency is equal for the entire synchronous area.
Tertiary Frequency Control (*)
Production capacity made available to the Transmission System Operator, representing the
provided amount of production that can be activated as increasing production (upward
tertiary reserve) or decreasing production (downward tertiary reserve) for the purpose of
balancing.
After the reaction of the PFC and SFC, it allows the TSO to reconstitute the reserve of power
available on the grid. Units participating to the tertiary Control are requested to start within
a very short time (15 to 30 min in Western Europe) and to produce a certain amount of MW
previously agreed with the TSO (Figure 3).

© Laborelec www.laborelec.com Restricted LBE04118739 - 3.0 | 19 of 133
Figure 3. Tertiary Frequency Control
The TFC is also called “R3” in this report (common denomination in Belgium and Italy).
Very Fast Reserve - VFR (ΔPmax) [4]
Production capacity [MW] made available to the Transmission System Operator,
representing the provided amount of production that can be regulated subject to the Primary
Frequency Control.
The VFR should be produced/removed in a very short time (typically 30s in Europe),
proportionally to the frequency deviation.
Operational Parameters (*)
Reference Site Conditions (RSC)
Reference ambient temperature, relative humidity and atmospheric pressure of a power
plant. They can be ISO or site average conditions.
In practice, correction curves are applied on the heat rate and the power output of the unit
to represent a situation in reference conditions. For example in Figure 4, correction factor
are applied for ambient temperature on heat rate and power output to represent a situation
at 19°C.
Figure 4: Example of a correction factor for ambient temperature applied on the power output and the heat rate of a GT

© Laborelec www.laborelec.com Restricted LBE04118739 - 3.0 | 20 of 133
Net power output
Net active power injected into the high voltage grid and useful from a market point of view
(i.e. after removal of the auxiliary and power losses in the step up transformer, among
others).
Figure 5: Definition – Gross and net active power
In general, gross power is measured at the terminal of the generator, and net power at the
terminal of the step-up transformer (Figure 5).
Maximum capacity (Pmax)
Maximum net active power that could be produced, transmitted or distributed continuously
throughout an unlimited period of operation at RSC (Figure 6).
Figure 6: Definition - Pmax
In some literature, such as [5], Pmax is also named Maximum Continuous Rating (MCR).
Maximum capacity in exceptional conditions (Pmax exceptional)
Maximum net active power that could be produced, transmitted or distributed in exceptional
operating conditions for a limited time at RSC (Figure 7).
Time limitation can be due to technical and/or economic reasons.

© Laborelec www.laborelec.com Restricted LBE04118739 - 3.0 | 21 of 133
Figure 7: Definition Pmax exceptional
Minimum power output (Pmin)
Minimum net active power that a unit can produce, transmit or distribute continuously
throughout an unlimited period of operation in defined technical circumstances (e.g. while
complying, or not, to emission limitations) and at RSC (Figure 8).
Figure 8: Definition - Pmin
Environnemental minimum power output (Pmin_env)
Minimum net active power that a unit can produce, transmit or distribute continuously at
RSC and for which the power plant complies with the emission limits.
Technical minimum power output (Pmin_tech)
Minimum active power down to which the power plant can control active power, without
necessarily complying with the emission limits.
Minimum power output in exceptional conditions (Pmin exceptional)
Minimum net active power that a unit can produce, transmit or distribute continuously in
exceptional operating conditions for a limited time at RSC (Figure 9).
Time limitation can be due to technical and/or economic reasons.

© Laborelec www.laborelec.com Restricted LBE04118739 - 3.0 | 22 of 133
Figure 9: Definition – Pmin exceptional
Pmin, Pmin_tech and Pmin_env are often the same but not systematically.
In a CCGT for example Pmin_env could correspond to an operation with the ST by-pass open.
In that case Pmin_env would be equal to “Pmin exceptional” (limited number of operating hours
considering the impact on the heat rate of the unit).
In this report, unless otherwise specified, Pmin refers to Pmin_env.
Turndown
Difference between maximum and minimum load (Figure 10). It can be defined in two ways:
Absolute turndown [MW]: Pmax – Pmin
Relative turndown [%] : 1 – (Pmin/Pmax)
The turndown represents the range of operation in normal conditions. The higher the
turndown, the higher the operating range.
Figure 10: Definition - Turndown
There is no convention for this definition. In some technical literatures, such as [5],
the relative turndown is defined as Pmin/ Pmax. 1 – (Pmin/Pmax) is preferred
definition for ELL since the higher the relative turndown the more flexible will be the
power plant.
De-rating on Pmax for PFC (ΔPR1)
Decrease of power output from Pmax at nominal frequency which is required to supply the
VFR in compliance with the requirements of the TSO.

© Laborelec www.laborelec.com Restricted LBE04118739 - 3.0 | 23 of 133
Up-rating on Pmin for PFC (ΔPR1)
Increase of power output from Pmin at nominal frequency which is required to supply the VFR
in compliance with the requirements of the TSO.
Figure 11: Definition – Derating on Pmax and uprating on Pmin
Standard ramp rate
Maximum allowable power output gradient (expressed in MW/min) on the full operating
range (i.e.: which can be considered for the load changes).
Some gas turbines may be limited in specific load ranges (e.g. at very high load).
Higher values are usually allowed for Primary Frequency Control, and sometimes for
Secondary Frequency Control.
Figure 12: Definition - Ramp rate
In some technical literatures, such as [5], ramp rates can also be expressed in percent of
Pmax per minute (% Pmax/min). This is called relative ramp rate.
(Minimum) downtime and uptime
The downtime is the time between a shutdown and the moment a unit is restarted.
The uptime is the time between the synchronization and the moment a unit is shut down.
These parameters are usually referred as minimum downtime and minimum uptime, which
are respectively the minimum time a unit shall be kept offline, and the minimum time a unit
shall be kept online.
There is no convention for these definitions. There may be differences from one
manufacturer to another, or from one grid code to another.

© Laborelec www.laborelec.com Restricted LBE04118739 - 3.0 | 24 of 133
Start-up
A start-up is a process which typically leads a thermal plant from the state “Ready to start”
to Pmin. A typical start-up consists in the following sequences:
■ Boiler purging (Rankine and CCGTs only)
■ Run up: ignition to synchronization
■ Load increase: from synchronization to Pmin
The thermal plant should be able to provide power at the standard ramp rate as from the
end of the start-up.
Typical start-up are represented in Figure 13 for Rankine cycles, Figure 14 for CCGTs and
Figure 15 for OCGTs.
Figure 13: Definition - Start-up process (Rankine)
Figure 14: Definition - Start-up process (CCGT)

© Laborelec www.laborelec.com Restricted LBE04118739 - 3.0 | 25 of 133
Figure 15: Definition - Start-up process (OCGT)
There is no convention for this definition. There may be differences from one
manufacturer to another, or from one grid code to another. Besides, the time scale in
the figures are not representative.
The duration of a start-up strongly depends on the physical state of the unit, in particular the
temperature and pressure in the different components of the unit, and more specifically the
boiler and the steam turbine. Power plants with a short downtime will keep higher
temperature and pressure and will be able to return to service more quickly [6].
Different categories of start-ups can thus be defined, according to the downtime preceding
the re-start of the unit, the temperature, or the pressure in the different components of the
unit. This is usually defined either by the power utilities, the manufacturers, or the grid codes.
In this report, the convention used for the power plants of ENGIE in Europe is taken:
■ Cold start-up: 72h+ after shutdown
■ Warm start-up: between 12h and 72h after shutdown
■ Hot start-up: less than 12h after shut down for a CCGT, and 8h for Rankine cycles.
In the definition proposed by ELL the preparation time is not included in the start-up time
since it strongly relies on the operational state of the power plant at the moment of the
request to start from the TSO.
For example, for a CCGT, in case of an unexpected request to start from the TSO, typical
preparation times are represented in Figure 16.

© Laborelec www.laborelec.com Restricted LBE04118739 - 3.0 | 26 of 133
Figure 16: Typical preparation times for a CCGT. Preparation times vary from a few dozen of minutes for a hot start-up with the vacuum kept in the condenser to more than 10 hours for a cold start-up,
after an overhaul of the boiler (i.e. boiler dry)
Electricity market
Aggregator [7]
An Aggregator is a buyer's agent that joins customers together as a single purchasing unit
and negotiates on their behalf for the purchase of electricity service.
Implicit Auctions [8]
In implicit auctions (also known as market coupling) electricity and capacity are traded
together, enabling electricity to be moved from one power exchange to another power
exchange.
Installed capacity (*)
Installed capacity or rated capacity, is the maximum capacity that a system is designed to
run at.
Merit Order [9]
The merit order is a way of ranking available electrical generation, based on ascending order
of price (which may reflect the order of their short-run marginal costs of production) together
with amount of energy that will be generated. In a centralized management, the ranking is
so that those with the lowest marginal costs are the first ones to be brought online to meet
demand, and the plants with the highest marginal costs are the last to be brought on line.
Dispatching generation in this way minimizes the cost of production of electricity.
Sometimes generating units must be started out of merit order, due to transmission
congestion, system reliability or other reasons.
Pay-as-bid [10]
“Pay-as-bid” or “discriminatory price” auction is an auction where all suppliers receive the
price they bided for the offered electricity. Hence, suppliers receive different prices for the
same commodity.
In pay-as-bid system, the suppliers are incentivized to estimate the cost of the “marginal bid”
(most expensive supplier balancing supply and demand) and ask more than their own

© Laborelec www.laborelec.com Restricted LBE04118739 - 3.0 | 27 of 133
marginal cost. Some suppliers are not selected because they made a wrong estimation of
the marginal bid.
Pay-as-cleared [10]
“Pay-as-cleared” or “uniform price” auction is an auction where all suppliers receive the
same price for the offered electricity (market price). The price is determined by the balance
between supply and demand (i.e. most expensive unit selected in the merit order). See
Figure 17.
In pay-as-cleared system, the suppliers are incentivized to bid at their own marginal cost in
order to maximize the probability of being selected. Welfare is maximized: the cheapest
suppliers are selected.
Figure 17 – “pay-as-bid” vs “pay-as-cleared” [10]. Same average price is assumed in this illustration but it is not the case in reality.
Spark spread
Theoretical gross margin of a power plant from selling a unit of electricity, having bought the
fuel required to produce this unit of electricity.
A difference is typically made between “clean” spark spread for gas plants and the “dark”
spark spread for coal plants.
2.2. European context [11]
Evolution of the electricity market liberalisation in EU [12]
During the 1990s, most national electricity and natural gas markets were still monopolies.
The European Union and the Member States decided to open these markets to competition
gradually. In particular, the European Union decided to:
distinguish clearly between competitive parts of the industry (e.g. supply to
customers) and non-competitive parts (e.g. operation of the networks);
oblige the operators of the non-competitive parts of the industry (e.g. the networks
and other infrastructure) to allow third parties to have access to the infrastructure;
free up the supply side of the market (e.g. remove barriers preventing alternative
suppliers from importing or producing energy);

© Laborelec www.laborelec.com Restricted LBE04118739 - 3.0 | 28 of 133
remove gradually any restrictions on customers from changing their supplier;
introduce independent regulators to monitor the sector;
The first liberalisation directives for the electricity market were adopted in 1996 (96/92/EC
Directive) and had to be transposed into Member States' legal systems by 1998. The logic
was a price unification and the integration of different national markets, laying the foundation
of the creation of a common European power market.
The 96/92/EC Directive established, for the first time in Europe, common rules for the
generation, transmission and distribution of electricity, creating a common body of laws
relating to the organization and functioning of the electricity sector, the access to the market,
the criteria and procedures applicable to calls for tender and the granting of authorizations
and the operation of systems.
The Directive provided that every Member State had to designate a system operator (TSO),
to be responsible for managing their national transmission system, in order to ensure the
transmission of electricity, the security of supply and the connections between different
national systems. This system operator had to avoid discriminations between users or
classes of users.
The main goal of the 96/92/EC Directive was to ensure the opening of EU electricity market,
giving the possibility to “eligible” customers to choose their own electricity supplier (both
national and foreign suppliers). In practice, only some industrial customers were able to
select their suppliers. The Directive also obliged Member States to control and, if necessary,
weaken local or national monopolists by giving the possibility to other competitors to enter
the market.
The application of the directive in the different countries was quite diverse, as the situations
were very different: some countries were already facing market competition (e.g. Spain,
Germany, Belgium or UK). In other countries, the governments were still major shareholders
of the main utilities. And in some countries, the power sector was in the hands of monopolies
(e.g. Italy, France).
The second liberalisation directives were adopted in 2003 (2003/54/EC Directive) and
were to be transposed into national law by Member States by 2004, with some provisions
entering into force only in 2007.
Despite the innovation introduced by the first directive, there were still too many differences
between different national markets. Although Directive 96/92/EC had allowed a step forward
for the creation of an internal electricity market, it was also clear that there were many
improvements to apply. In particular, Member States were worried about market dominance
in national markets.
The main consequences of the directive was that every consumer (not only the “eligible”
ones) was entitled to choose its supplier by July 1st 2004 for industrial customers and July
1st 2007 for domestic customers.
It also imposed to the Member States to unbundle the transmission systems and the
transmission system operators.
Although significant progress had been made, competition was slow to take off, with markets
remaining largely national (relatively little cross-border trade), and highly concentrated.
Companies trying to enter the market, business leaders, parliamentarians, and consumer
groups were concerned about the slow development of wholesale gas and electricity

© Laborelec www.laborelec.com Restricted LBE04118739 - 3.0 | 29 of 133
markets, high prices and limited choice for consumers. The Commission therefore launched
a sector inquiry in 2005 to identify the barriers preventing more competition in these markets.
The results were published in 2007.
Based on the Commission's energy package of January 2007, including the results of the
sector inquiry, the Commission brought forward in September 2007 legislative proposals
(third liberalisation package) to strengthen competition in the electricity and gas markets.
It also integrates the 20-20-20 Policy requirements (reduce consumption of primary energy
by 20%, reduce by 20% gas emissions and include at least 20% of renewable energies in
energy consumption by 2020).
This package entered into force in 2009 (2009/72/EC Directive).
Core elements of the third package include ownership unbundling, which stipulates the
separation of companies' generation and sale operations from their transmission networks,
and the establishment of a National Regulatory Authority (NRA) for each Member State. It
also supported the creation of the ENTSO-E.
In recent years electricity wholesale markets have developed in most Member States which
allow the electricity producers, the large suppliers and some customers to trade standard
contracts in electricity (e.g. a base load contract for the following calendar year whereby a
constant amount of electricity is supplied every hour for the whole year to come; or base
load contracts for the days, weeks or months ahead; or peak load contracts, etc.). The
wholesale markets play a key role in the electricity sector as they set the prices that are then
passed on in some way to the retail customers.
Overview of EU energy market
2.2.2.1. Grid management
The development of the European internal electricity market leads to increasing long-
distance and inter-area power flows as the interconnected transmission systems serve as
the wholesale market platform. Combined with the development of RES, it pushed the
system to operate closer to the security and stability limits.
In Europe, the responsibility for transmission security and reliability is assigned to the TSOs
for their Control Areas, as defined by the national regulation. The TSOs are responsible for
all measures to preserve the system security and improve system adequacy to the new
electricity market.
The ENTSO-E was founded in 2008 and represents 42 TSOs from 34 countries (828 GW
generation). It can be considered as the “TSO of TSOs” and issued a grid code in April 2016
which is legally binding at European level (“Commission Regulation 2016/631”) [3]. This grid
code has now to be translated into the national grid codes, which can impose more stringent
requirements (specific approaches and parameters like threshold values).
The grid code should make sure that generation facilities connected to the transmission grid
contribute to a safe system operation but also supply ancillary services in order to preserve
system security (balancing) and improve system adequacy (i.a. RES variations).
The main requirements to generation facilities can be summarized as follows:
- Provisions of information for system management;
- System balancing / frequency stability;

© Laborelec www.laborelec.com Restricted LBE04118739 - 3.0 | 30 of 133
- Voltage stability;
- Robustness of generating units against perturbations (stable operation);
- System restoration after a disturbance;
In the current context of larger RES integration, these requirements are focused on more
“flexibility”, which can be defined as the capability of the system to adapt to foreseen and
unforeseen changes. Table 1 shows examples of the mentioned changes and mechanisms
that may be used by TSOs to ensure system stability.
Table 1. Examples of foreseen and unforeseen changes of load and demand sides
Foreseen changes Unforeseen changes
Examples Projection on load Residual demand steep change Normal start-up time of a power plant
Prediction error on supply/demand Trip of a plant
Levers Merchant energy markets (day-ahead, intraday, forwards) Strategic reserve (TSO)
Regulated ancillary market (TSO)
Renewables both affect the foreseen changes (“duck curve”) with higher residual load
changes as well as the unforeseen changes (bad predictions, quick change of wind or
irradiation). As an example of the foreseen changes (“duck curve”), Figure 18 shows a
prediction of the demand in Chile for 2021 [13]. This figure eloquently shows the expected
residual demand variation during a day.
Figure 18 - "Duck curve" on the residual load for Chile in 2021 [13]
2.2.2.2. Electricity markets
Role of markets
The adequacy between the energy supply and demand is mainly managed by merchant
markets (Day Ahead and Intraday). The residual imbalance (starting 1h before real time) is

© Laborelec www.laborelec.com Restricted LBE04118739 - 3.0 | 31 of 133
then managed by the TSOs with contracted ancillaries that can be activated curatively (e.g.
frequency change) but also preventively (anticipation of power shortage). Figure 19 shows
graphically the roles of merchant and regulated markets.
Figure 19 - merchant vs regulated markets (source: ENGIE – CEEME)
For foreseen unbalances which cannot be solved by the markets (e.g.: large unbalances on
the day-ahead market), an additional (regulated) capacity market managed by the TSO
might also be required to ensure system stability (e.g. “strategic reserve” in Belgium).
Market coupling
In order to improve the integration of their energy markets, most of the European TSOs have
coupled their day-ahead markets. The result is a larger platform where market offers and
demands can meet, provided that sufficient cross-border capacity is available. Figure 20
shows an example of cross-border power exchanges between countries in a single day. In
colours are highlighted the countries which are exporters, importers and those who are in a
balance situation.
The market coupling mechanism means that the market players of a country have direct
access to the other countries markets. The mechanism leads to price convergence on all
markets, as far as possible. However, price differences may still occur if the capacity
available for cross-border trades is insufficient to meet the total demand.
With market coupling, the daily cross-border transmission capacity between the various
areas is not explicitly auctioned among the market parties, but is implicitly made available
via energy transactions on the power exchanges on either side of the border (hence the
term implicit auction). It means that the buyers and sellers on a power exchange benefit
automatically from cross-border exchanges without the need to explicitly acquire the
corresponding transmission capacity.
The primary aim of the mechanism is to improve market liquidity and consequently, to induce
lower and more stable electricity prices. The power exchanges Belpex (Belgium), APX (The
Netherlands), EPEX Spot (Germany and France), Nord Pool Spot (Norway, Sweden,
Finland, and Denmark), OMIE (Spain and Portugal) and GME (Italy) are currently coupled.
With market coupling, purchase bids in one country are matched up with sales bids in
another country, where the price may be lower. The purchase/sales bids made in the
different markets are pooled and then matched up by financial merit order. As a result, less
expensive energy produced in one country can be used to meet high demand in another
country. If there are no cross-border capacity constraints, the market coupling mechanism
will promote the emergence of a single price for all markets. The coupling mechanism
therefore makes a significant contribution to improving energy market liquidity. In practice

© Laborelec www.laborelec.com Restricted LBE04118739 - 3.0 | 32 of 133
there are currently still price differences across the European market when the
interconnections capacity is reached.
Price Coupling of Regions (PCR) is the project of European Power Exchanges to develop a
single price coupling solution to be used to calculate electricity prices across Europe
respecting the capacity of the relevant network elements on a day-ahead basis.
The PCR-coupled area now covers 19 countries, standing for about 85% of European power
consumption. It is called “Multi-Regional Coupling” (MRC).
Figure 20: Example of cross-border exchanges between different power markets (source: ENTSO-E)
ENTSO-E technical requirements [3]
2.2.3.1. Ancillary services
This section provides an overview (not exhaustive) of the main ENTSO-E requirements for
“type D” generators. These requirements are then translated by the local TSOs on the grid
code for their own Control Areas (they can be more stringent).
The requirements applicable to type D power-generating modules should be specific to
“higher voltage connected generation with an impact on control and operation of the entire
system. They should ensure stable operation of the interconnected system, allowing the use
of ancillary services from generation Europe-wide”. For Continental Europe, the minimum
power threshold for type D generators is 75MW.
Other requirements (less stringent) exist for lower capacity generators (types “A”, “B” and
“C”).
There are currently no requirements for the RES in ENTSO-E grid code. However, ENTSO-
E pushes the TSOs to create specific ancillary services products which allow their
participation.
Primary Frequency Response
The following limits are imposed by ENTSO-E:
- Maximum frequency deviation (Δfmax): 200 mHz for Continental Europe (CE)

© Laborelec www.laborelec.com Restricted LBE04118739 - 3.0 | 33 of 133
- VFR (ΔPmax): 1.5 - 10% of the nominal capacity
- Droop: 2 – 12%
- Time to supply the VFR: 30s max
- Frequency response deadband: 0 – +/- 500 mHz (for CE: +/-10 mHz)
- Activation delay: max 2 sec (or to be justified)
For downward frequency deviations, the power plant shall be able to provide a power
increase up to its maximum capacity. In addition, stable operation shall be ensured.
The power plant shall be capable of providing full active power frequency response for a
period of between 15 and 30 minutes as specified by the relevant TSO.
Signals shall be foreseen to enable real-time monitoring of the PFR by the TSO.
Secondary Frequency Response
The power plant control system shall be capable of adjusting an active power setpoint in line
with instructions given by the TSO.
The TSO shall specify a tolerance (subject to the availability of the prime mover resource)
applying to the new setpoint and the time within which it must be reached.
With regard to frequency restoration control, the power plant shall provide functionalities
complying with specifications specified by the relevant TSO, aiming at restoring frequency
to its nominal value or maintaining power exchange flows between Control Areas at their
scheduled values.
Voltage control
The relevant system operator in coordination with the relevant TSO shall specify the reactive
power provision capability requirements in the context of varying voltage.
The ENTSO-E gives minimum requirements on the operating area for reactive power supply
profile at Maximum Capacity (“U-Q/Pmax”) which should be agreed with the TSO. When
operating at an active power output below the Maximum Capacity (P < Pmax), the power
plant shall be capable of operating at every possible operating point in the P-Q-capability
diagram of the alternator of that plant.
ENTSO-E also specifies the requirements for the Automatic Voltage Regulator (AVR).
Ramp rates
The relevant system operator shall specify, in coordination with the relevant TSO, minimum
and maximum limits on rates of change of active power output (ramping limits) in both an up
and down direction of change of active power output for a power plant, taking into
consideration the specific characteristics of prime mover technology.
Black start
Black start is not mandatory.
A power plant with black start capability shall be capable of starting from shutdown without
any external electrical energy supply within a time frame specified by the relevant system
operator in coordination with the relevant TSO. A power plant with black start capability shall
be capable of automatically regulating dips in voltage caused by connection of demand.

© Laborelec www.laborelec.com Restricted LBE04118739 - 3.0 | 34 of 133
2.2.3.2. Other requirements
In addition to the requirement on ancillary services, ENTSO-E also describes requirements
which guarantee the robustness of the generating units on the grid to transient events. They
are briefly described in this section.
Minimum frequency range
The ENTSO-E imposes a frequency band for which the units shall remain connected on the
network. The values imposed for Continental Europe are shown in Table 2.
Table 2 imposed operation time for each frequency range
Maximum active power reduction by falling frequency
The TSO may impose a maximum active power reduction in case of falling frequency
included in the following area:
Figure 21. Active power reduction area
Fault ride through capability
Each TSO shall specify a voltage-against-time-profile in line with Figure 22 at the connection
point for fault conditions, which describes the conditions in which the power plant is capable
of staying connected to the network and continuing to operate stably after the power system
has been disturbed by secured faults on the transmission system.
© Laborelec www.laborelec.com Restricted LBE04118739 - 3.0 | 35 of 133
Figure 22 - ENTSO-E fault ride through requirement. Table for synchronous generator (> 110kV).
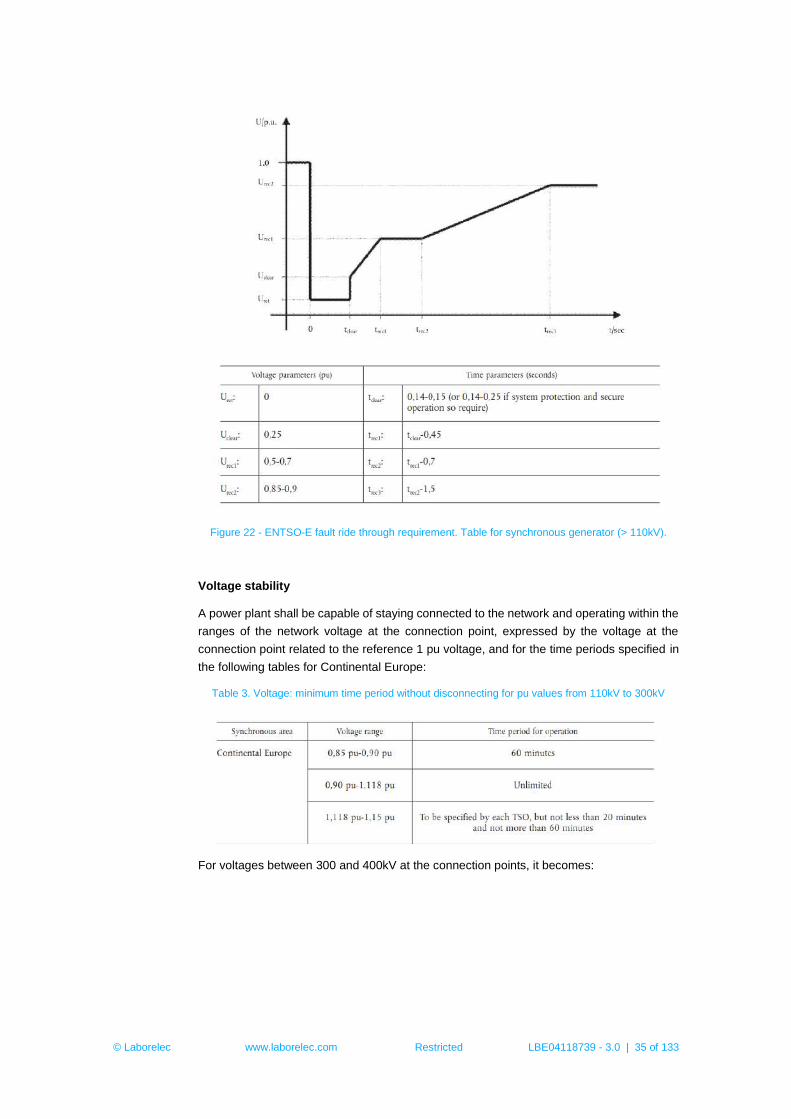
Voltage stability
A power plant shall be capable of staying connected to the network and operating within the
ranges of the network voltage at the connection point, expressed by the voltage at the
connection point related to the reference 1 pu voltage, and for the time periods specified in
the following tables for Continental Europe:
Table 3. Voltage: minimum time period without disconnecting for pu values from 110kV to 300kV
For voltages between 300 and 400kV at the connection points, it becomes:

© Laborelec www.laborelec.com Restricted LBE04118739 - 3.0 | 36 of 133
Table 4. Voltage: minimum time period without disconnecting for pu values from 300kV to 400kV
Simulation models and tests
The TSO has the right to request that the power plant owner carries out compliance tests
which aim at demonstrating that the plant complies with the requirements of the grid code
and ancillary services. A set of simulations can replace the compliance tests if they are
reliable enough.
For the PFR, the tests can include a simulation of frequency steps to trigger the whole active
power frequency response range.
Emissions
The applicable directive at EU level is currently the IE-D (Industrial Emissions Directive)
which came into force on 01/01/2016. It replaces the LCP-D (Large Combustion Plants
Directive) which was applicable between 1990 and 2016 (with an update in 2008).
The minimum requirements on the emission limit values (ELV) are defined in the Annex V
of the IE-D. However, the “Best Available Techniques” defined in the “BREF” document
(BAT Reference Document for Large Combustion Plants [14]) should also be taken into
consideration by the authorities when granting the permits (deviations to be justified).
“BREF” document is currently in “Final Draft” version. It provides ranges of emissions which
are more stringent than the IE-D and will become mandatory as from 2021. Each Member
State will have to define its interpretation of the BREF and the selected value within the
suggested range.
The limits are summarized in Table 5 for existing Rankine units with a thermal input
>300MWth, CCGTs with a thermal input between 50 and 600 MWth and existing OCGTs.
More stringent limits are applicable for new plants.
The tables are only applicable for “normal conditions”. Hence they exclude start-up and shut-
down phases. In addition, the limits for OCGT and CCGT do not apply below 70% load.
The directive is minimum requirement for the Member States. More stringent requirements
are usually imposed at local level by the relevant authority (case-by-case requirements
specified in the permit). Additional requirements can also be imposed at regional or national
level (e.g. VLAREM for the Flemish region in Belgium). They can include a limitation on the
concentration or on the total emitted mass of pollutants.

© Laborelec www.laborelec.com Restricted LBE04118739 - 3.0 | 37 of 133
Table 5. Emission limit values for units with thermal input > 300MWth in mg/Nm³
Technology IED1 Final Draft BREF LCP
(day/year)
Coal (pulverized coal)
@6% O2
NOx: 200 SO2: 200 PM: 20 CO: -
NOx: 80-165 / 65-150 SO2: 25-165 / 10-130 PM: 3-20 / 2-12 CO: - / 1-100
CCGT
@15% O2
NOx: 50 SO2: - PM: - CO: 100
NOx: 35-55 / 10-45 SO2: - PM: - CO: - / 5-40
OCGT
@15% O2
NOx: 50 SO2: - PM: - CO: 100
NOx: 7-75 / 6-50 SO2: - PM: - CO: - / 3-40
The two documents set emission levels for dust, or total PM which is the total
particulate matter emitted into the air. The diameter of the PM (e.g. PM10 or
PM2.5) is not specified.
2.3. Description of the Italian Flexibility Market
Overview of the Italian market [15]
Italy is located in Southern Europe. To the North, Italy borders France, Switzerland, Austria,
and Slovenia, and is roughly delimited by the Alps chain. To the South, it consists of the
complete Italian Peninsula and the two Mediterranean islands of Sicily and Sardinia.
The population of Italy is ~60 million inhabitants for a total area of ~300 000 km².
The “antenna” structure of the electrical network is a
consequence of the particular shape of the country.
Moreover the Alps barrier limits the potential for
interconnections with the border countries. The
geographical configuration of Italy makes it quite
comparable with the Chilean System.
TERNA is the unique TSO for the whole country. According to the latest statistics available
on the ENTSO-e web site, the installed capacity in Italy was around 103 GW in 2014 with
the breakdown detailed in Table 6.
1 The condition of application of the ELVs in the IE-D are the following: • Monthly average emission values shall not exceed the ELVs • Daily average emission values shall not exceed 110% of the ELVs • 95% of all the hourly emission average values over the year shall not exceed 200% of the ELVs

© Laborelec www.laborelec.com Restricted LBE04118739 - 3.0 | 38 of 133
Table 6. Installed capacity breakdown - Italy
Production Type - IT 2014 [MW]
Biomass 934 Fossil Coal-derived gas 407 Fossil Gas 20796 Fossil Hard coal 1360 Fossil Oil 5017 Geothermal 869 Hydro Pumped Storage 4714 Hydro Run-of-river 10719 Hydro Water Reservoir 6362 Other 37816 Solar 4980 Waste 116 Wind Offshore 2 Wind Onshore 8455
Total Grand capacity 102547
Market organization [16]
Figure 23. Italian Market organization
As shown in Figure 23, the Italian Electricity Market is organized in two main markets:
MPE: a Spot Electricity Market covering a short term horizon
MTE: a Forward Electricity Market covering a longer term horizon
The Spot Electricity Market (MPE) consists of the following submarkets:
Day-Ahead Market (MGP, Mercato del Giorno Prima), where producers,
wholesalers and eligible customers can sell/buy electricity for the next day;
Intraday Market (MI, Mercato Infragiornaliero), where producers, wholesalers and
eligible customers can modify their injection/withdrawal schedules resulting from
the Day-Ahead Market;
Italian Electricity Market
MPE
Spot
MGP
Day-Ahead
MI
Intraday
MSD
Ancillariy services
MTE
Forward
MTE IDEX

© Laborelec www.laborelec.com Restricted LBE04118739 - 3.0 | 39 of 133
Ancillary Services Market (MSD, Mercato dei Servizi di Dispacciamento), where
TERNA, the TSO, procures the ancillary services which are necessary for the safe
management and control of the power system (regulated market).
The Forward Electricity Market (MTE) is organized as:
Forward market MTE: forward electricity contracts where physical delivery and
withdrawal obligation are traded
IDEX Market and CDE platform: market for Electricity Derivatives operated by
Borsa Italiana
GME (Gestore dei Mercati Energetici) carries out dispatching activities on behalf of TERNA,
the TSO.
2.3.2.1. Day ahead market
In the Day-Ahead Market (MGP), which hosts most of the electricity sale and purchase
transactions, hourly energy blocks are traded for the next day. In this market, participation
is optional. In 2015 a volume of 235 TWh was traded in this market.
The price offered on this market are based on the marginal costs of the plants.
Organisation:
Participants submit offers/bids where they specify the quantity of energy and the
minimum/maximum price at which they are willing to sell/purchase electricity.
Supply offers may only refer to injection points and demand bids only refer to withdrawal
points.
The MGP is an auction market and not a continuous-trading market, in which bids/offers are
accepted by GME under the economic merit-order criterion and taking into account the
transmission capacity limits between Italian market zones.
To solve the market, the GME sort bids by ascending price for sellers and by descending
price for buyers.
Intersection between supply curve and demand curve is the system equilibrium: it defines
both the equilibrium price (system marginal price, that is equal to the price of the last bid
accepted, based on the economic merit order) and the awarded quantity for sellers and
buyers.
In Italy, the market price is mostly driven by gas assets which are called in the merit order
ranking even for low residual demands. It is not expected to change in the near future.
Particularities:
Due to its configuration in antenna, the Italian electrical system is divided in six areas:
Northern, Central Northern, Central Southern, Southern, Sicilia and Sardinia (islands)
(Figure 24). These market zones are defined on the basis of three main criteria:
1. transmission capacity towards or from other zones is constrained
2. there is no intra-zonal congestion
3. location of injection and withdrawal points within a zone does not affect transport
capacity between zones

© Laborelec www.laborelec.com Restricted LBE04118739 - 3.0 | 40 of 133
Figure 24 – Market zones and prices on January 12th 2017 12:00 ( [17])
A pricing algorithm takes into account the maximum transport capacity between market
zones, as identified by the TSO. When the maximum capacity is not exceeded, a single
price emerges on the market. When the maximum capacity is exceeded, the market splits
into separate market zones: for each of them a supply and a demand curve are determined
by GME and a different equilibrium is set (“Zonal Clearing Price”).
Three of the five borders of the Italian Borders are coupled with the Multi-Regional Coupling
(MRC).
Market scheduling:
Accepted offers/bids on MGP determine the preliminary “injection and withdrawal
schedules” of each injection/withdrawal point for the next day. The MGP session opens at
8:00 AM of the ninth day before the day of delivery and closes at 12:00 PM of the day before
the day of delivery. The results of the MGP are available by 12.55 PM of the day before the
day of delivery.
2.3.2.2. Intraday market
The Intraday Market (MI) allows market participants to modify the injection and withdrawal
schedules defined in the MGP by submitting additional supply offers or demand bids. As for
the MGP, the participation to the MI is also optional and GME acts as a central counterparty.
In 2015 a volume of 25 TWh has been traded in this market
Supply offers and demand bids are selected under the same criterion applied to the MGP.
Therefore, GME accepts offers/bids submitted into the MI by Merit Order, taking into account
the transmission limits remaining after the Day-Ahead Market. In the MI all accepted
offers/bids are remunerated at the Zonal Clearing Price.
Accepted offers/bids in the MI modify the preliminary schedules and determine the
revised/updated injection and withdrawal schedules of each offer point for the day of
delivery.
In order to simulate a frequency similar to that of continuous trading, the MI takes place in
five sessions which are organized in the form of Implicit Auctions. In practice exchanges on
this market occur up to 2-3 hours before the delivery. After that time, the balancing is
performed by the TSO with the ancillary services (fully centralized dispatching).

© Laborelec www.laborelec.com Restricted LBE04118739 - 3.0 | 41 of 133
2.3.2.3. Ancillary Services Market
In the Ancillary Services Market (MSD), TERNA procures the resources that it requires for
managing, operating, monitoring and controlling the power system (relief of intra-zonal
congestions, creation of secondary and tertiary reserve margins, real-time balancing). In this
market TERNA enters into purchase and sale contracts in order to procure the resources
for dispatching services and acts as a central counterparty.
Participation in the MSD is optional for «relevant producers» (i.e. programmable producers
with generating capacity higher than 10 MW), after obtaining a specific «qualification» from
TERNA to supply ancillary services. However, for «relevant producers» which are
«qualified» by TERNA to participate to the MSD, it is mandatory to offer/bid all up/down
control energy left over from injection schedules resulting from the MI.
In the MSD, offers/bids are accepted by economic Merit Order, taking into account the need
for ensuring the proper operation of the system, and valued at the offered price (Pay-as-bid
pricing). More precisely, TERNA accepts bids/offers in this market by minimizing the cost of
selection, which is representative not only of the procurement costs, but also of the expected
costs for the use of resources for dispatching on a daily horizon and taking into account the
efficiency and reliability of the available resources.
The MSD consists of a programming phase (ex-ante MSD) and of a real-time Balancing
Market (MB). In the ex-ante MSD, TERNA accepts energy demand bids and supply offers
in order to relieve residual congestions and to create secondary and tertiary reserve
margins. In the MB, TERNA accepts energy demand bids and supply offers in order to
activate its service of secondary control and to balance energy injections and withdrawals
into/from the grid in real time.
The ex-ante MSD and the MB take place in multiple sessions, as specified in the dispatching
rules.
Detailed remuneration principles are developed in section 2.3.4. The market is based on a
“pay-as-bid” system.
2.3.2.4. Forward market MTE, IDEX and CDE platform
Trading in the MTE takes place on the basis of continuous trading during which the
conclusion of contracts is done through the automatic matching of offers of opposite signs
present on the order book and ranked according to priority criteria.
In this market, GME acts as a central counterparty and records on the “OTC Registration
Platform” (PCE) the net position to be physically delivered, corresponding to the purchase
and sales transactions concluded by the operator in the MTE.
In the MTE, the tradable contracts are of the following types: base load and peak load with
monthly, quarterly and yearly delivery periods.
The CDE is the platform where financial electricity derivatives contracts, concluded on
“Borsa Italiana” exchange for electricity (IDEX), are executed. The contracts executed on
CDE are those for which the market participant has requested to exercise the option of
physical delivery of the underlying electricity in the Italian Electricity Market.

© Laborelec www.laborelec.com Restricted LBE04118739 - 3.0 | 42 of 133
2.3.2.5. Capacity payments for planned shortage (“essential plants”)
There is currently no remuneration for the capacity in Italy neither on the energy markets,
nor on the ancillary markets.
However, the TSO has the right to nominate some power plants as “essential”.
The so‐called essential plants for power system security are those plants identified as
technically and structurally required for the resolution of network congestions and the
maintenance of adequate levels of security of the national electricity system, for significant
periods of time.
The essential units have to be always committed and available. They can ask a
compensation for part of their costs if they are able to demonstrate “unlikelihood that they
are capable of ensuring an adequate return on invested capital in the absence of integration
of the extra costs” [18].
A new capacity payment mechanism is being implemented, as described in section 2.3.7.
Extra considerations about the Italian system
As of February 2015 automatic coupling between Northern zone of Italy and France (3000
MW), Slovenia and Austria allow the foreign players to bid on the Italian market up to the
saturation of the available capacity.
The TSO has installed battery storage in specific areas, whereas it may normally not bias
the market with own production capability (free competition). TERNA justifies this by security
needs (balancing adjustments) and by its willingness to limit the influence of power plants
abusing of their position.
Each asset is individually responsible for its own imbalances (not at fleet nor pool of plants
level).
Unlike Belgium, industrial customers cannot participate to ancillary services yet. However,
this is currently being discussed.
Detailed information about the Ancillary Services2
As described above, TERNA operates the system in a context of very open market.
Moreover the penetration rate of RES strongly increases, making the system more difficult
to manage. Ancillary services are levers helping the TSO to ensure the correct balancing
between energy supply and demand.
The total volume exchanged on the MSD market in 2014 was 13.98 TWh up and 13.26 TWh
down. The total capacity of the plants active on this market is 70 GW, including 56 GW of
thermal plants. [19]
As a general principle, there is no compensation based on capacity (€/MW) for the ancillary
services in Italy.
The costs of the ancillary services (resulting from the remuneration schemes described in
this section) are ultimately born by the final consumers. A specific item of the electricity bills
identifies the transmission costs (including the cost of the Ancillary Services) which are
added to the cost of the energy resulting from the energy markets.
2 More details can be found in [4] Chapter 4.

© Laborelec www.laborelec.com Restricted LBE04118739 - 3.0 | 43 of 133
As a general principle, the plants may choose to participate to the MSD for specific services,
with the important exception of the Primary Frequency Control which is mandatory. If the
plant complies with the requirements of a service (which can include a certification by a
Notified Body), it becomes an “enabled unit” for the service. The enabled units are listed in
the “Register of Production Units” which is used by the TSO and market operator for the
management of the electric system.
2.3.4.1. Primary Frequency Control – PFC (R1)
Description
The aim of the PFC, also called R1, is to quickly stabilize the frequency to a new value when
production and consumption are unbalanced. The addition of the PFC provided by all power
plants (and sometimes consumers) ensures the proportional response of an equivalent grid
controller.
In Italy, the participation to the PFC is mandatory for all types of assets, except RES.
At a technical point of view:
Only symmetrical +/- 200 mHz PFC
profile is requested
A dead band of +/- 10 mHz is foreseen
For a frequency deviation of +/- 200mHz,
a unit has to produce/retrieve 50% of its
reserve within 15 seconds and 100%
within 30 seconds
The effort has to be sustained for at least
15 minutes
These requirements are in line with ENTSO-E.
The volume of PFR is +- 1.5% of the power output of each plant3. This volume is imposed
by TERNA in order to match the ENTSOE requirements at country level. The total
participation required for each country in the European synchronous area is fixed on a yearly
basis based on the evolution of the grid capacity. The total volume is 3 GW (output of 2
major plants) and is distributed between the countries following the ratio of their total energy
generation. The total PFR reserve for continental Italy is ~320 MW. An additional 200 MW
is foreseen on Sardinia Island (isolated area). [20]
The activation of the PFC is automatic, based on the frequency deviation (no intervention
from TSO). PFC stabilizes the frequency but SFC is required to recover the nominal
frequency (50 Hz). At 50 Hz (no frequency deviation), the PFC reserve activation is 0 MW.
The TSO can report failures in the obligation to supply the reserve to the National Regulatory
Authority which can take “appropriate measures”4.
3 The minimum volume of PFR is +-10% for the plants located in Sardinia and Sicily (islands). 4 See [4] Chapter 4, section 4.4.2.3.
-200 -100 100 200 Frequency deviation [mHz]
Very Fast Reserve [MW]
0
SYMMETRICAL 200 mHz

© Laborelec www.laborelec.com Restricted LBE04118739 - 3.0 | 44 of 133
Remuneration
Financial compensation can be received for the PFC if the Power Plant complies with several
TSO requirements: compliance tests performed by a Notified Body, installation of a quick
events recorder and possibility for the TSO to send online simulated frequency deviations.
Only the energy provided (respectively not produced) by the asset for the PFC is paid5
(respectively compensated), not the available capacity for the service itself.
Penalties
Real performances are compared online with a PFC simulation model provided by the Power
Plant and approved by the TSO (Figure 25). Financial scenarios are the following:
PFC energy provided by the power plant matches with the PFC model: in this case
a financial compensation is paid by the TSO on a quarterly hour basis;
PFC energy provided is lower than calculated: no financial compensation is offered
by the TSO for the quarterly hour considered;
PFC energy provided is systematically lower: the power plant has to provide a more
realistic model of PFC to the TSO;
In the worst cases, the power plant can lose its PFC agreement;
Figure 25. Quantification of deviation of PFC response
A financial compensation is offered for the imbalances penalties (when compared to the
injection/withdrawal schedules and R2 setpoint) caused by the PFC.
2.3.4.2. Secondary Frequency Control (R2)
Description
The aim of the R2 control is to recover the nominal frequency by rebalancing supply and
demand after the R1 action. It can be compared to the integral action of a virtual grid
controller.
The plants “enabled” for the Secondary Frequency Control service have the obligation to
bid the available capacity on the MSD.
The volume of this service was 4.8 TWh up in 2014 [21]. The typical available SFC reserve
is 800 MW (activated power is lower). [19]
5 The payment scheme is described in [4] Chapter 7, section 7.3.1.10. It is based on the Day Ahead zonal price increased by a “bonus” corresponding to 50% of the average difference between MSD offers for SFC and Day Ahead prices on an annual basis.
MODELISED PFC
REAL PFC
-200 -100 100 200 Frequency deviation
[mHz]
Very Fast Reserve [MW]
0
SYMMETRICAL +/- 200 mHz
-200 -100 100 200 Frequency deviation
[mHz]
Very Fast Reserve [MW]
0
SYMMETRICAL +/- 200 mHz
FREQUENCY DEVIATION
+
-
D MODELISED/REAL PFC

© Laborelec www.laborelec.com Restricted LBE04118739 - 3.0 | 45 of 133
To participate to the Secondary Frequency Control (i.e. become an “enabled” plant) a power
plant shall:
comply with several TSO requirements certified by a Notified Body;
follow an automatic signal sent by the TSO modulating the power between two
limits (from α = 1 corresponding to the max upward limit to α = -1 corresponding to
the max downwards limit);
be able to fully cover the half R2 band (both upward and downward) made available
to TERNA, within maximum 100 seconds;
The R2 band is not necessarily symmetrical (defined by market and technical limitations
around the set point for energy supply). In practice, the plants should be able to follow a
load set point defined by the TSO (inside the offered band) with the maximum gradient.
The TSO has to make sure that enough reserve is available for the SFC. After the closing
of the Intraday Market sessions, the TSO can instruct the plants to modify the program
resulting from the energy markets (“updated cumulated program”) to increase/decrease the
available SFC reserve (“planning phase”). The program of enabled units is fixed for each
quarter of an hour.
The load set point is adjusted continuously. Hence the plant should be able to sustain the
requested load for an unlimited time.
Remuneration
The plants have the obligation to make bids for the increase (“selling offers”) / decrease
(“buying offers”) of power from the “updated cumulative program” on the full operating range
of the plant (Pmin to Pmax). In addition, they have to offer the full available half-band.
From a financial point of view, there are two mechanisms of remuneration both based on a
“Pay as Bid” principle:
Reservation of the R2 band: if the unit is requested to reserve its R2 band
(planning phase) and modify the “updated cumulated program”, it is compensated
in line with the bid price (“selling” or “buying” offers) for the affected period of time.
Activation of the reserve (automatic signal α ≠ 0): energy injection increase /
decrease is compensated.
The bids are typically based on the plants marginal costs.
The TSO selects the bids “with the objective of minimizing the charges and maximizing the
returns resulting from activities of providing for resources for dispatching” [4].
Penalties
R2 imbalance (deviations between set point and actual power output) is penalized with the
same mechanism as for energy imbalance (see section 2.3.5).
2.3.4.3. Tertiary Frequency Control (R3)
Description
The goal for the TSO is to reconstitute its reserve once PFC and SFC have rebalanced
supply and demand.

© Laborelec www.laborelec.com Restricted LBE04118739 - 3.0 | 46 of 133
The available tertiary reserve is offered by the plants with bids on the MSD (upwards and
downwards). The plants enabled for TFC have the obligation to bid the available capacity.
This reserve is activated manually by the TSO.
The volume of this service was 8.99 TWh up in 2014 ( [21]) and the total TFC reserve
amounts to approximately 3.5 GW [20] [21].
A difference is made between the Tertiary Fast Reserve (Riserva Terziaria Pronta) and the
Tertiary Replacement Reserve (Riserva Terziaria di Sostituzione).
The former is mainly provided by pumped hydro plants and has to start within 15’. Its
capacity is around 1.5 GW [22], [19].
The latter is mainly constituted by thermal plants (mostly gas plants). The technical
constraints are to provide a contractual load within a contractual time limit (case by case
and not necessarily 15’), the maximum start-up time being 120 min. In practice, the start-up
time of thermal plants is not key for this service.
Remuneration (thermal plants)
Auction/biding on the day ahead market:
The supplier is allowed to bid at a price reflecting the willingness to be called if no
capacity is selected in the day ahead energy market;
Only energy produced is paid, not the capacity nor the availability;
Remuneration consists in:
Token: linked to availability to restart a power plant following a specific ramp up /
ramp down defined by the TSO (compensation for the start-up);
Pay-as-bid price (compensation for the energy);
For R3, the plant is only paid if it is called, based on the energy provided at a pay-as-bid
price (and/or possible token). Hence, there is no compensation for the “stand-by” time and
related costs if the plant is not called. The pay-as-bid price can be very high (willingness to
be called).
Penalties
R3 imbalance is penalized with the same mechanism as for energy imbalance (see section
2.3.5).
2.3.4.4. Black start
Description
The purpose is to rebuild the grid in case of blackout (without external supply).
These units are part of the “Essential plants”.
Remuneration
The payment is based on a specific “fee” which is not communicated (bilateral negotiation
between the TSO and owner of a plant).

© Laborelec www.laborelec.com Restricted LBE04118739 - 3.0 | 47 of 133
2.3.4.5. Reactive power supply
Description
The purpose is to maintain the grid voltage. Minimum ENTSO-E requirements are given in
section 2.2.3.1.
Remuneration
No specific remuneration is foreseen for this service.
A Power Plant can be called to sustain voltage. It will be paid for the energy provided, not
for the service.
Energy imbalance penalties
Imbalances are penalized, including those caused by the PFC (R1) but the TSO takes into
consideration its own situation regarding the Area Control Error (ACE): penalties will be
heavy if the effect reinforces the ACE imbalance, they will be reduced if the result helps the
TSO to maintain the system balanced.
Figure 26. Energy Imbalance penalties
In case of undersupply in a grid shortage configuration (“short” unit, in a “short” area), the
missing energy is paid at the cost of the most expensive activated energy supply on the
ancillary market.
In case of oversupply in a grid oversupply configuration (“long” unit, in a “long” area), the
additional energy is paid at the cost of the cheapest activated energy supply on the ancillary
market (down to zero).
All imbalances are computed at the level of individual power plants.
The resulting unbalancing fees are directly invoiced by the TSO to the plant owners.

© Laborelec www.laborelec.com Restricted LBE04118739 - 3.0 | 48 of 133
Summary table and key highlights
Table 7. Italian flexibility market summary table
Product Description Requirements Payment
Energy Day ahead and Intraday markets
Forward market
Balancing supply/demand
At plant level (no pooling)
Bid mechanism and “Pay-as-clear” market price
Ancillary - R1 Automatically activated
100% < 30s
Available for 15min
Certified by a Notified Body + online tests
No link with R2
Applicable to all plants, excepted RES
Symmetric
Not for capacity
Energy: fixed compensation
Ancillary - R2 Set point from the TSO
100% of ½ band < 100s
Unlimited time
Certified by a Notified Body
Upwards and downwards (can be asymmetric)
Not for capacity
Energy: pay-as-bid (if activated)
Ancillary - R3 Manually activated
Contractual start-up time
Upwards and downwards
Not for capacity
Energy: pay-as-bid (if activated)
Essential plants
Grid security for possible power shortage (active/reactive supply) or congestions
Contractual agreement
“extra costs” compensation
Other key highlights:
All grid requirements and energy balancing are imposed at plant level
Penalties are always applied in case of imbalance with respect to the plant
production schedule
Zonal prices are applied when the inter-zonal capacities are saturated
No capacity remuneration is foreseen for ancillary services
Black start is remunerated but not voltage control
Market evolution [23]
In Italy, the 96/92/EC Directive was adopted in 1999, through the passage of the law
79/1999, also called “Decreto Bersani”.
ENEL (the historical state utility) was legally forced to sell part of its capacity, in order to
sustain new operators' entry. The power plants that ENEL was obliged to sell (15 000 MW
over a total capacity of 57 000 MW) were grouped in three societies, the so called “GenCos”
(Generation Company). These firms were Eurogen, Elettrogen and Interpower and were
made of thermoelectric and hydroelectric plants. In the two-year period 2001-2002 the
government sold the GenCos to private companies.
After the liberalisation, the network and dispatching management were transferred from
ENEL to TERNA which has been listed in the Italian Stock Exchange since 2004.
A new capacity market mechanism, open to foreign producers, should be implemented as
from 2017 (AEEGSI resolution ARG/elt 98/11). The plants would receive a yearly premium

© Laborelec www.laborelec.com Restricted LBE04118739 - 3.0 | 49 of 133
(pay as bid) and would be obliged to submit the contracted capacity on the Day Ahead or
Ancillary markets. The revenues on the energy market will be capped at a “strike price”
corresponding to the variable costs of peak technology (the plants would not benefit from
peak prices on electricity spot market as they are remunerated for their capacity). This
mechanism will also integrate the active participation of the demand side, RES and
distributed generation (currently not involved in ancillary services). This scheme shall
receive the approval of the European Commission for the conformity to the rules of the
common energy market (one of the condition being the participation of foreign plants).
2.4. Description of the Belgian Flexibility Market
Overview of the Belgian Market [24]
Belgium is a country in Western Europe surrounded by France, the Netherlands, Germany,
Luxembourg, and the North Sea. It is a small, densely populated country which covers an
area of ~30 500 km² and has a population of about 11 million
people.
ELIA, the TSO of the country, has to manage a highly meshed
electrical network. The area constituted by France, Belgium,
and the Netherlands is called “copper plate” thanks to the
strong interconnections, exchanges and transit capacities
between the countries.
According to the latest statistics available on the ENTSO-e website, the installed capacity in
Belgium is around 19 GW in 2016 with the following breakdown:
Fuel Type - BE 2016 [MW]
Biomass 710 Fossil Gas 5373 Fossil Hard coal 470 Fossil Oil 145 Hydro Pumped Storage 1308 Hydro Run-of-river 117 Nuclear 5919 Solar 2953 Waste 368 Wind Offshore 712 Wind Onshore 1249
Total Grand capacity 19324 Figure 27. . Installed capacity breakdown – Belgium
Market Organization [25]
The responsibility of ELIA, the Belgian TSO, is to permanently ensure the balance between
production and consumption. However Access Responsible Parties (ARPs) are appointed
at every grid access point (injection or offtake point) to support it in this mission.
An ARP:

© Laborelec www.laborelec.com Restricted LBE04118739 - 3.0 | 50 of 133
is in charge of maintaining on a quarter-hourly basis the balance between all grid
users (injections and offtakes), for which he is contracted;
may be an electricity producer, a major consumer, an electricity supplier or a trader;
can use a hub (common platform) to exchange energy with other ARPs for the
same day or the following day in order to maintain the balance in its area of
responsibility; The platform is provided to the market players free of charge.
ARPs may use the different plants in their scope as a “pool” in order to fulfil their obligations
towards the grid (balancing, ancillary services, etc.).
Besides the ARP, the overall market organization in Belgium is similar to Italy.
2.4.2.1. Day ahead market
In the day-ahead hub, any market player having the role of ARP has to maintain the quarter-
hourly balance between the offtakes and injections in its perimeter. Quarter-hourly balance
is needed in both real time and in the forecast phase. There are different types of offtakes
and injections depending on whether:
the ARP is responsible for physical offtake at an access point (in the Elia grid or
Distribution System Operators’ grids (DSOs grids);
the ARP is responsible for physical injection at an access point (in the Elia grid or
DSOs’ grids);
the ARP is exchanging energy with another ARP in the Elia control area;
the ARP is importing or exporting energy across the border with France, Germany
or the Netherlands.
As mentioned above, one of the possibilities for an ARP is to make energy transfers with
another ARP in the ELIA Control Area. Transactions may be made between parties which
do not have generation assets in Belgium (e.g. foreign traders).
The ARPs operating on the day-ahead hub use it to perform various types of energy
exchange operations. They can, for example:
make purchases or sales (i.e. bilateral trading contracts);
distribute volumes of energy amongst various subsidiaries in a single group of
companies;
act as a relay in the European energy transit (France – Belgium – the Netherlands);
share with another ARP the energy taken off the grid by an industrial customer or
injected into the grid by a production unit. They do this without having to sign a
specific access contract with Elia relating to the access to the network (mandatory
for direct off-takes and/or injections);
submit bids for energy purchases or sales on the Belgian power exchange
(Belpex);
Foreign producers are recorded as “ARPs” in Belgium for cross-border energy exchanges.
An important feature of the Belpex is its strong coupling with other Power Exchanges in the
region. Belgium was one of the first markets to be coupled as the system has been used
since 2006 (trilateral market coupling between the Netherlands, Belgium and France).

© Laborelec www.laborelec.com Restricted LBE04118739 - 3.0 | 51 of 133
In practice, the price on the “copper plate” market (Benelux, France, Germany) are currently
very similar most of the time. They get “uncoupled” (totally or partially) only when the cross-
border lines get saturated (it can happen during a limited period at specific time of the day).
The total volume traded on the Belgian day-ahead market was ~24 TWh in 2015. The day-
ahead prices are basically proposed on a cost + margin approach.
In Belgium, the market price is mostly driven by gas assets which are called in the merit
order ranking. For very low demand, the pump storage hydro plants can be used to manage
flexibility instead of the gas plants (“Coo” power plant).
2.4.2.2. Intraday market
The principles of the Belgian intraday market are similar to Italy (see section 2.3.2.2).
However only the ARPs are active on this market in Belgium and exchanges can happen
until a very short time before the supply.
The system of ARP tends to optimize in real-time the use of the assets from a cost point of
view (welfare optimisation). This is not always the case in more rigid systems (like Italy)
where the plants have to follow their production schedule. Nevertheless there is also more
volatility on the Belgian Intraday market.
The total volume traded on this market was ~640 GWh in 2015.
2.4.2.3. Ancillary service market
The Belgian market organization is very similar to Italy (see section 2.3.2.3).
The main difference in Belgium is that all ancillary services are remunerated for the capacity
(“availability”), in addition to the generated energy (“activation”).
2.4.2.4. Forward market
The principle of the exchanges are similar to Italy.
The forward market for Belgium is the ICE Endex (“BE power baseload forwards”), which is
the leading energy exchange in continental Europe.
2.4.2.5. Capacity payment for planned shortage (“strategic reserve”)
The “strategic reserve” can be used by the TSO if the grid imbalance becomes very critical.
It can be activated in two circumstances:
1. Market disruption: if at the end of the day-ahead period of the European
Platform and after an ultimate procedure of auction/bidding the TSO fails to
obtain a balanced position (“uncoupled markets”);
2. Technical difficulties: the TSO anticipates major technical concerns;
In 2016, the Belgian Strategic reserve was fixed at 600 MW. An asset taking part to this
service has to be capable to start-up in a time delay of maximum 3 hours.
The selected units are contracted on a yearly basis following a bidding/auction process. The
remuneration of these assets takes two forms:
1. A capacity fee for the duration of the contracted period – 1 year
2. If started, a very interesting activation revenue corresponding to the highest
unbalance fee: ~3500-4500 €/MWh

© Laborelec www.laborelec.com Restricted LBE04118739 - 3.0 | 52 of 133
In Belgium the Strategic Reserve has never been activated by the TSO so far. Units
proposed by the ARPs for the strategic reserve are most of the time at the end of their
lifetime or considered as no longer profitable on the other markets.
Extra considerations about the Belgian system
The system of ARPs resulted from the large market share of the former main utility on the
production at the time of the liberalisation of the market. It tends to give more “power” to the
producers which can control their balancing in a flexible way.
The ARPs, combined with the system of imbalance remuneration (see section 2.4.5), tend
to optimize the generation source with respect to a centralized dispatching (welfare
maximisation) but also causes more volatility on the imbalances.
Detailed information about the Ancillary Services
2.4.4.1. Primary Frequency Control
Description
Delivery of PFC is not (formally) mandatory but based on a bidding/auction market. In
Belgium, the TSO proposes four types of PFC contracts (or products) to the ARPs:
1. Symmetrical +/- 200 mHz: PFC starts at +/- 10 mHz; fully activated at +/- 200 mHz.
This profile fully matches with ENTSO-e requirements;
2. Symmetrical +/- 100 mHz: PFC starts at +/- 10 mHz; fully activated at +/- 100 mHz.
There is no technical difficulty for any thermal asset to follow such a profile;
3. Asymmetrical Down + 100 mHz: PFC starts at + 100 mHz; fully activated at + 200
mHz. This profile is interesting for assets running mainly at maximum load, no
derating on Pmax being needed. It corresponds to the typical load profile of Nuclear
Power Plants or CHPs;
4. Asymmetrical Up – 100 mHz: PFC starts at - 100 mHz; fully activated at -200 mHz.
Industrial clients capable to “buffer” their production are interested in such a profile
because the activation of the service (reduce/modulate their consumption) occurs
statistically rarely;
In addition to the first profile (1), the combination of the other profiles (2), (3), (4) allows the
TSO to build a global profile fully matching with ENTSO-e requirements. This original way
to proceed causes more competition between bidders. Bid prices in Belgium have been
decreasing in the past few years.
-200 -100 100 200 Frequency deviation
[mHz]
Very Fast Reserve [MW]
0 -200 -100 100 200 Frequency deviation
[mHz]
Very Fast Reserve [MW]
0 -200 -100 100 200 Frequency deviation
[mHz]
Very Fast Reserve [MW]
0-200 -100 100 200 Frequency deviation
[mHz]
Very Fast Reserve [MW]
0
SYMMETRICAL +/- 200 mHz
SYMMETRICAL 100 mHz
ASYMMETRICAL UP
100 mHz
ASYMMETRICAL DOWN
100 mHz
= + +
Figure 28 - PFC products in Belgium

© Laborelec www.laborelec.com Restricted LBE04118739 - 3.0 | 53 of 133
As for Italy, the total participation is fixed yearly by ENTSO-e. In 2016, Belgian participation
was fixed at 73 MW. In Belgium, plants installed in foreign countries can bid on this market
according to the following ratio:
up to 50 MW (symmetrical +/- 200 mHz) from a “Regional Procurement Platform”
regrouping Belgium, Germany, The Netherlands, Switzerland, Austria and France
(as from 2017);
the rest from assets located in Belgium;
The full PFC reserve should be provided within 30s and the plant should be able to deliver
it for minimum 15min.
Of course, Belgian ARPs can play on both local and regional platforms, meaning also the
possibility for them to sell PFC to the external countries part of this platform. Biddings are
made on a weekly basis. The PFC capacity is typically offered in combination with SFC
capacity (see hereunder). In addition, the ARPs should be prequalified by ELIA.
The PFC is automatically activated (based on frequency deviation) on the activated plants.
Remuneration
Remuneration is given on the capacity only, on a “pay-as-bid” basis. The energy is not
remunerated.
Penalties
Two types of penalties are applied by the TSO:
Availability penalties: if the amount of R1 sold doesn’t match with the theoretical
stacking of assets participating to the R1 (it can be the case if an asset becomes
unavailable and cannot be replaced by another)
Activation penalties: due if an ARP didn’t react in a proper way to frequency
“incidents”. The TSO performs post-incidents analysis (generally for frequency drops
> 100 mHz) and identifies those for which the contracted reserve was not correctly
provided (in term of amplitude and/or time delay). Penalties are fixed after (limited)
negotiations with the ARP.
2.4.4.2. Secondary Frequency Control
Description
In 2016, the total participation required for Belgium was fixed at 140 MW. This volume is
calculated by the TSO and validated by the regulator.
From a technical point of view:
Planned energy exchanges at the country borders are continuously compared with
real measurements installed on the interconnection points. An unbalancing signal (in
MW) is issued, called Area Control Error (ACE);
ELIA sends this signal to the ARPs in the limits they have contracted;
ARPs are free to dispatch this set point between their production units in the most
appropriate way (technical/economical);
A supplier must be able to fully cover the half R2 band (both upwards and
downwards) made available to ELIA, within maximum 7,5 minutes;

© Laborelec www.laborelec.com Restricted LBE04118739 - 3.0 | 54 of 133
Figure 29. SFC activation requirements
In practice, the imbalances at a country level (deviation between scheduled supply /
demand) are detected by the TSOs on the cross-border flows. As Belgium is part of a large
synchronous area, frequency deviations do not give any indication on the national situation.
Remuneration
R2 is not (formally) mandatory but based on a weekly bidding/auction market. The following
principles are applicable:
Valid bid consists in offering a volume for the Service, being upward and/or
downward Secondary Frequency Control half band (R2), combined with a type of
Primary Control (R1);
The permitted number of capacity bids is unlimited. When participating, the supplier
will make its best efforts to introduce the largest number of combinations of
capacity bids possible (combinations of R1 and R2). Capacity bids will be at least
1MW and additional capacity offered in minimum increments of +/- 1 MW;
For the duration of the entire applicable delivery period, the provision of Secondary
Frequency Control capacity is portfolio based (not a specific power plant);
Once a capacity bid is awarded, the award decision is communicated to the
supplier by ELIA. ELIA will publish relevant, aggregated and anonymised
information regarding the awarded volumes and prices on its website;
A supplier has the possibility to transfer part or all of its R2 obligations to one or
several counterpart supplier(s), for instance in case of forced outage.
The remuneration of the service consists of a remuneration for the contracted R2 capacity
(reservation - availability) and a remuneration for the energy supply (upwards or downwards)
resulting from the activation of the service. The remuneration is based on a pay-as-bid
principle (weekly bid for the capacity, day-ahead bid for the energy).
As a general principle, the R2 selection (availability and activation) are based on the bids
merit order.
Penalties
As for R1, availability and activation penalties can be applied.
2.4.4.3. Tertiary Frequency Control
Description
The aim of the tertiary control is for the TSO to reconstitute its reserve once R1 and R2
have rebalanced supply and demand.
ACE [MW]
LOW LIMIT
HIGH LIMIT
0
ACTIVATION
7.5 min
7.5 min

© Laborelec www.laborelec.com Restricted LBE04118739 - 3.0 | 55 of 133
In principle, the R3 volume has to cover the loss of the biggest unit of the country (in Belgium
~1000 MW – nuclear unit). Part of this reserve is supplied by the ARP owner of the asset
(N-1 reserve). The rest (~510 MW in 2016) is under the responsibility of the TSO.
Participants to the R3 have to be capable to produce the contracted load in a time delay of
15 minutes when they are requested to start by the TSO.
Downwards R3 participation exists but is not offered in practice (plants should operate above
their minimum load).
The TSO can also activate “Free Bids”. Free Bids have to be proposed by the ARPs on all
assets for the available power, without limitation of price (they can be very high). It is another
way (frequently used) for the TSO to reconstitute the Secondary Frequency reserve. The
TSO prefers to activate “Free Bids” (in practice, change of the load of a running asset) rather
than R3 capacity (in practice, it can mean the start-up of an expensive plant) as it is usually
cheaper and it keeps enough reserve in case of “incident”. Free Bids are only activated as
an alternative to R3 to reconstitute the R2 reserve (no active role of the TSO on the intraday
market).
Remuneration
The R3 service is based on a monthly bidding/auction market for the capacity.
The remuneration of the Service consists of a remuneration for the contracted R3
(availability), a remuneration for the energy requested resulting from the activation of the
service and a remuneration for the Start-Up of a Production Unit.
Energy is compensated based on Day-Ahead bids.
Participants are mainly power plants but aggregators or industrial clients with interruptible
contracts (ICH) can also take part to this service. For 2017, the awarded capacity of ICH is
200MW in Belgium (in addition to the ~510 MW mentioned here above).
As a general principle, the R3 selection (availability and activation) are based on the bids
merit order.
Penalties
The units can be penalized in case of “missing” MWs on the R3 reserve (priced at day-ahead
price) or in case the supplier used the reserve for its own use.
A plant can lose its qualification for Tertiary reserve if the plant fails 2 consecutive start-ups.
2.4.4.4. Black Start
Description
Five units located in five specific areas of production are needed to rebuild the grid in case
of blackout. Units performing a black start have to be capable to produce energy as soon
as possible on a “dead” network.
Remuneration
These units are contracted on a multiyear basis following a bidding/auction process. The
remuneration is based on the capacity.

© Laborelec www.laborelec.com Restricted LBE04118739 - 3.0 | 56 of 133
Penalties
As these units must also be able to operate smoothly at any time, regular tests are carried
out. The owners are paid for the service and penalties are imposed if the tests are not
passed.
2.4.4.5. Reactive power supply
Description
A major responsibility of the TSO is to maintain the voltage within certain limits at any point
of the grid. The development of Renewable Energies makes this task increasingly sensitive
and difficult.
To increase flexibility, ELIA contracts from generators a positive and negative control band
for each unit (centralized control). If the system has a high load, ELIA asks for extra MVARs
to be generated.
Since reactive power cannot be transmitted over long distances, ELIA selects the units
participating in this service on their location.
Remuneration
The contract for this service provides two compensations:
1. a fixed rate to remunerate one-time expenses (IT implementation, technical
adaptations to the unit to expand the technical band)
2. an activation price remunerating the produced and absorbed reactive energy
providing a minimum level of MW injection by the concerned unit
Penalties
Penalties are applied if the automatic or centralized control are not well executed.
Production/absorption of reactive power is mandatory for the electricity producers.
Imbalance penalties
In case of imbalance between injections and offtakes
at a set of access points under the responsibility of an
ARP, the TSO:
applies penalties if the effect makes worse the
ACE signal
offers incentives if this imbalance helps the
TSO to maintain ACE balanced
From a practical point of view, it is not easy for an ARP to anticipate the TSO needs as it is
already difficult to assess accurately the balance within its scope of responsibility on-line
(metering on demand / clients side is not easy).
The unbalances can be solved by ARPs with their pump-storage hydro plants, when
available.
In the same time, ELIA concludes agreements for mutual assistance with other TSOs
allowing to exchange some volumes of energy in case of need. Prices are contractually fixed
on a yearly basis. The volume of this mutual assistance is continuously increasing, allowing
the TSO to reduce the incentives offered to the ARPs (judged more expensive).
ARP0
ACE
+-
+
-
ARP helps the TSO
Incentives
ARP helps the TSO
Incentives
ARP upsets the TSO
Penalties
ARP upsets the TSO
Penalties

© Laborelec www.laborelec.com Restricted LBE04118739 - 3.0 | 57 of 133
Summary table and key highlights
Table 8. Belgian flexibility market summary table
Product Description Requirements Payment
Energy Day ahead and Intraday markets
Forward market
Balancing supply/demand
At ARP level (pooling)
Bid mechanism and “Pay-as-clear” market price
Ancillary - R1 Automatically activated
100% < 30s
Available for 15min
R1/R2 combination offers
At ARP level
Shared with border countries
Asymmetric offers accepted
Capacity: pay-as-bid (availability)
No energy payment when activated
Ancillary - R2 Set point from the TSO based on ACE
100% of ½ band < 7.5 min
Unlimited time
At ARP level
Upwards and downwards products
Capacity: pay-as-bid (availability)
Energy: pay-as-bid (if activated)
Ancillary - R3 Manually activated
Start-up time < 15 min
Only upwards product for plants
Industrial customers can participate for load shedding (ICH)
Capacity: pay-as-bid (availability)
Energy: pay-as-bid (if activated)
Strategic reserve
Selected plants – volume set by Minister of Energy
Start-up time < 3h
Contractual agreement on a yearly basis
Capacity: pay-as-bid
Energy: very high rate (~3500 - 4500 €/MWh)
Other key highlights:
All grid requirements and energy balancing are imposed at ARP level (pooling)
R3 accessible to industrial customers (ICH)
Regional prices (“copper plate”) are applicable most of the time, same price for
Belgium
Capacity remuneration for all ancillary services (but voltage control)
Volume of strategic reserve and other services: defined each year by the TSO and
approved by the regulator.
Black start and voltage control are remunerated.
Market evolution
In Belgium, the 96/92/EC Directive was translated in a national law in 1999 (29 April 1999
law on the organisation of the electricity market). The second and third liberalisation
directives were then respectively transposed in 2005 and 2012.
At the time of the liberalization, the market was highly concentrated in the hands of
Electrabel (now ENGIE Electrabel). Its market share was still ~65% for the generation and
~51% for the supply in 2014. Hence the company still keeps a strong position.
The Belgian TSO (ELIA) was created in 2001. It is on the stock market since 2005 and
ENGIE sold its last shares in the company in 2010.
The structure of the ancillary services contracts between the TSO and the suppliers was
defined at the time of the liberalisation of the market. The technical properties of the ancillary

© Laborelec www.laborelec.com Restricted LBE04118739 - 3.0 | 58 of 133
services have not changed significantly since then. However, new products were introduced
on the market (like asymmetric participation) in order to increase competition as well as
international bids.
The energy exchange platforms did not exist at the beginning and they were put in place
progressively. The exchanges started with the communication of generation “programs” with
the TSO (often by phone, then fax). A national day-ahead exchange was then created,
followed by the intraday. The coupling with international energy exchange platforms was
also developed in parallel.
2.5. Comparison tables
A comparison of Belgium and Italy is provided together with the gap analysis with Chile
(section 5.2).

© Laborelec www.laborelec.com Restricted LBE04118739 - 3.0 | 59 of 133
3. Impact of flexibility on thermal plants and technical
limitations
3.1. Conventional Power Plant Categories
The following types of power plants are considered in this study:
Rankine cycles (fuels: coal and fuel oil)
Combined cycle GTs (fuels: gas and diesel fuel oil)
Open cycle GTs (fuels: gas and diesel fuel oil)
Rankine Cycles (RC) are composed of a boiler (with its auxiliaries and FGT devices), an
extraction steam turbine (with its preheaters) and a condenser.
Figure 30: Rankine cycle - Process diagram [1]
Combined Cycle Gas Turbines (CCGT) are composed of one or several gas turbines (GT),
one or several heat recovery boilers (HRSG), a steam turbine (ST) and a condenser.
Figure 31: CCGT – Process Diagram ( [1] with modifications)

© Laborelec www.laborelec.com Restricted LBE04118739 - 3.0 | 60 of 133
Open Cycle Gas Turbines (OCGT) are composed of a gas turbine only with its auxiliaries.
The exhaust gases are rejected directly to the atmosphere via a stack.
Figure 32: OCGT - Process diagram [1]
In the following sections, the applicability of the text to each technology will be specified.
The impact of the fuel or of some specific components will also be highlighted when
appropriate.
3.2. Impacts of the power system requirements on the technical
parameters of thermal plants
This section describes the impact of the energy market rules or ancillary services
requirements on the technical parameters of the power plants. It is a way to evaluate the
technical consequences on the power generation resulting from grid management choices.
Energy market
The implementation of an energy market tends to increase the flexibility of the power plants
in order to catch market opportunities. The technical impacts of a more competitive market
can be the following:
Increase Pmax to benefit from high spark spread in case of shortage on the market;
Incentive to shut down the units (including RES) when the spark spread (thermal
plants) or the prices (RES) are negative;
Incentive to improve the efficiency at all loads (and not just baseload) in order to
increase the spark spread (keeping a plant profitable or increasing the profit);
Reduce start-up / shut-down cost and time, to catch more opportunities (e.g. In UK,
CCGT plants stop and start twice a day, performing the so-called two shifting
operation – so they are able to capture very high spark spreads);

© Laborelec www.laborelec.com Restricted LBE04118739 - 3.0 | 61 of 133
Figure 33: Catching more market opportunities: Examples of different typical modes of operation for power plants
At system level, an energy market does not always take into consideration the physical
constraints of the grid (congestions) and the risk of black-out (structural under-capacity).
Hence, the merchant market failures have to be compensated by regulated markets
(managed by the TSOs). In addition, energy markets require a trading structure (with related
costs).
RES integration
The integration of RES tends to shift the merit order due to the priority given to the RES
(nearly zero marginal cost).
Figure 34 - merit order illustration
Hence the penetration of the RES causes a decrease of the operating hours and load factors
of thermal plants. Figure 35 shows the evolution of the load factor of individual CCGT plants
in Europe with and without participation to the Ancillary Services (AS). The general trend is
a strong decrease of the load factor on a few years, excepted for the plants which are
enough flexible to participate to the ancillary services market.

© Laborelec www.laborelec.com Restricted LBE04118739 - 3.0 | 62 of 133
Figure 35 - load factor evolution
The second effect of the increased RES capacity is a lower wholesale price on the market.
The consequence is that the profitability of some plants cannot be reached with energy
supply (they cannot compensate the fixed costs) and other sources of revenues are vital
(e.g.: ancillary services, strategic reserve, etc.). The need for additional revenues for
profitability has shown to be the main driver for the plants to improve their flexibility.
In many EU countries, a regulated capacity market was put in place to secure the electricity
supply (strategic reserve in Belgium, “essential plants” in Italy). However, the selection of
the plants is always based on a bid system and has to be approved by the European
Commission.
Capacity market
A capacity market may be required to guarantee the adequacy between the supply and the
demand on the mid – long term and mitigate the risk of black-out. However, it should reflect
as much as possible the real contribution of the power plants to the security of the system
in order to provide enough incentives for the maximization of the technical performances.
A capacity market on energy, regardless of the real contribution to the system stability, may
not give enough incentives to the plants to increase their flexibility.
Besides, granting a fixed feed-in tariff can push the plants to declare a Pmin higher than the
technical capability and/or give no incentive to decrease it.
Ancillary market
The introduction of a market for ancillaries with clear products gives incentives to the plants
to increase their technical performances in order to increase their profits.
In Europe this effect was emphasized by the overcapacity, as the revenues from the ancillary
market are often the only way for the plants to remain profitable. This is illustrated on Figure
36 for Italy (x-axis corresponds to different CCGTs and y-axis to the margins in €/MW when
considering only the variable costs) which shows that the contribution of the ancillary
services (“MB” and “MSD”) to the plants margins is very large (often >50% of the margin).
Some plants lose money on the Energy markets (negative margin on “MI” and “MGP”) but
can be profitable thanks to the ancillary services.

© Laborelec www.laborelec.com Restricted LBE04118739 - 3.0 | 63 of 133
Figure 36 – Historical results on the Italian CCGTs in 2015 for each market. Y-axis represents the margin after discount of the variable costs, in €/MW. X-axis represents the different CCGT units.
Ancillary services are traded on “MB” and “MSD”. “MI” and “MGP” are the energy markets (cf. section 2.3.2). Horizontal dotted line corresponds to the average margin. [20]
The introduction of asymmetric services or international exchanges (if permitted) can
increase the competition between the suppliers.
Primary Frequency Control (R1)
The primary frequency control (PFC) should be delivered in a very short period of time
(typically 30s) and sustained for a reasonable time (typically 15 min). In addition, the very
fast reserve (VFR) should always be available for the power plant participating to the
frequency control.
The sensitivity of the load change to a change in frequency is defined by the droop. A lower
droop will cause much higher load changes (even for limited frequency changes) and
ultimately a higher “cycling” on the components (fatigue issues).
The maximum VFR is mainly limited by the allowed ramp rate (MW/min) for PFC (usually
higher than the standard ramp rate: typically 20MW on 30s for PFC ramp rate vs 10MW on
30s for standard GT ramp rate).
As the VFR should always be available when the plant participates to PFC, the power plant
output should be lower than Pmax (or higher than Pmin) when the frequency is at its nominal
value (see Figure 37). The difference (ΔPR1) can be higher or lower than VFR, depending
on the following:
- ΔPR1 can be decreased if an exceptional operating mode is allowed for PFC (Pmax
and Pmin exceptional). This is very dependent on the time to be sustained (e.g. 15
min)
- ΔPR1 may be required to increase if one of the components is too “slow” in order
to provide the power output change in compliance with VFR requirements (typically
HRSG+ST6, GT with lower ramp rate close to base load)
6 On a CCGT, the response of the ST is too slow for R1 requirements (unless ST participation with inlet valve throttling is implemented). Hence 10MW of reserve on CCGT would require 10MW de-rating on the GT, which means ~15 MW de-rating on the CCGT.

© Laborelec www.laborelec.com Restricted LBE04118739 - 3.0 | 64 of 133
Figure 37 - Derating on Pmax (ΔPR1) or uprating on Pmin. ΔPR1 is the difference between “Pmax” and “Derating on Pmax” lines. Green band: possible range of power variation on de-rated Pmax due to
frequency variation (upwards / downwards).
ΔPR1 can have a major impact on the energy production (loss of opportunity at base load or
additional fuel use at low load) and plant efficiency, and hence a financial impact on the
plants.
Increasing the power output (during under frequency events) is typically more difficult than
decreasing it. Hence asymmetric frequency response can be a way to increase the number
of actors able to provide PFC and bring more competition to the market (if any).
From a TSO point of view, imposing PFC participation to all plants brings more reliability to
the system. However, it increases the overall system operating costs as the technical
impacts on the plants are high (i.a. de-rating). Hence VFR pooling (including sharing it with
foreign countries) can be considered when the grid interconnections are strong enough and
the amount of assets is large enough.
The PFC is fully automatic (based on frequency deviation) and does not require any specific
communication with the TSO for its activation. However, a signal is needed to switch on/off
the participation of the plant to the PFC. Additional signals can also be foreseen for an on-
line adaptation of the settings (droop, max frequency deviation, deadband).
The trend in Europe is to enable an on-line testing of the R1 capability (which requires
specific communication signals) for the TSO to check the capability of the plants to fulfil their
obligations.
Secondary Frequency Control (R2)
The Secondary Frequency Control (SFC) should be delivered in a short period of time (a
few minutes) and sustained for an unlimited time.
Limitations on the provision of SFC can be low ramp rates (technology related limitation) or
very high requirements on SFC regulation band delivery time (country-specific). On flexible
CCGTs and on OCGTs, the ramp rates are usually not the limitation of the extent of the half
bands unless the time for power delivery is short (e.g. Italy).
However, for many plants the maximum half bands are defined by the absolute turndown
(Pmax – Pmin). Hence, the main levers to extend the half bands are an increase of the Pmax
and/or a decrease of the Pmin.
Asymmetric SFC can increase the competition for the supply of SFC (more units able to
supply it).
As for the PFC, the SFC has an impact on the energy production as the load set point is
defined by the system operator.

© Laborelec www.laborelec.com Restricted LBE04118739 - 3.0 | 65 of 133
Secondary Frequency Control is performed only on the selected units (based on the ancillary
capacity market). The activation of the service is then done when required (energy bid merit
order).
The SFC is requested based on an automatic external signal (set point) sent by the TSO or
another balancing entity. This signal is computed from the unbalances at the limits of the
Control Area (typically cross-border exchanges). Hence a specific communication signal
should be foreseen.
SFC is particularly important to compensate the unexpected/sudden power variation of RES.
Tertiary Frequency Control (R3)
The Tertiary Frequency Control should provide power in a time frame of typically 15 min to
reconstitute quickly the SFC. It is applicable to plants which are not connected to the grid
and should start-up (“cold reserve” or “offline”) or to plants in operation with available spare
capacity (“online”).
The main lever to provide R3 services is the optimization of the start-up time. In addition,
the plant operators can also optimize the stat-up fuel consumption to limit the costs.
Pooling effect
The pooling effect (as in Belgium) has an impact on the number of plants affected by the
PFC and SFC. The ARPs can select the plants in charge of the PFC/SFC management and
optimize the overall costs.
This means that most of the plants can operate at their Pmax / Pmin, without any provision for
PFC/SFC, or can even be shut down if this minimizes the costs (typically for the week-ends).
In some extreme cases, the turndown of a unit can be “artificially” extended by degrading its
efficiency and therefore decreasing its Pmin in a controlled way (Pmin exceptional). It allows
to concentrate the R1/R2 services on this unit and to realize the economy of another “must
run” unit.
Internationalization of the market
When the electrical interconnections are strong enough, the PFC can be distributed between
several Control Areas. In case of incident on one part of the grid, the frequency response is
shared between all Control Areas in the Synchronous Area.
The SFC is used to re-balance the planned exchanges between the Control Areas.
Black start
Black start implies specific requirements on the design of the power plant. It mainly consists
in the installation of a diesel generator able to restart the plant without external supply.
Penalty on imbalances
If TSO increases the penalty on imbalances, the plants are incentivized to implement the
following:
- Increased ramp rates to compensate quicker their imbalances;
- Increased online corrective actions:
o At asset level: correction of the MW setpoint to balance the ¼ h production
(as in Italy);

© Laborelec www.laborelec.com Restricted LBE04118739 - 3.0 | 66 of 133
o At pool level: corrective actions through hydro storage units (as in Belgium);
- Improved calculation of Pmax and Pmin (correction curves taking into account
atmospheric and process conditions);
- Increased reliability:
o Improved control loops to avoid mismatches and/or trips (i.e. “Model based
control” to anticipate plant reaction);
o Increased level of automation ensuring the repeatability of the start-ups and
avoiding human mistakes;
o Improved training of the operators;
o Improved Root Cause Analysis and troubleshooting, and perform immediate
corrective action in case of incident/trip;
- On a longer term, power plant performance follow-up procedures allowing to identify
deviations and take corrective actions;
Voltage control
Voltage control has a limited impact on the power plants but it requires specific control loops.
Very high reactive power demands can create some limitations on the supplied active power
(P-Q diagram).
Since reactive power cannot be transmitted over long distances, the units participating in
this service are selected based on their location.
3.3. Technical limitations for each category (including emissions)
This section details the main technical limitations faced by the plants to improve their
flexibility.
Most units are originally designed for base load operation (efficiency is also optimized for
baseload). This leaves some potential margins towards more flexible thermal units. For
example, the number of opportunities that involve low CAPEX expenditures is limited for
Pmax (baseload). But the potential for Pmin reduction is quite attractive.
Apart from the technical limits of the unit, power plants may not allow or limit flexible
operation for other reasons, such as contractual motives (LTSAs, guarantee of the
OEM) or asset management strategies. Even if these reasons may be justified, they
are not detailed in this study.
Rankine cycles
For Pmax increase, CCGTs and Rankine cycles share most technical limitations, mainly
related to the water-steam cycle. These limitations are described hereafter:
1. Maximum steam temperature and pressure within the boiler and/or
admitted at the steam turbine: Usually, design values are reached at
current Pmax,

© Laborelec www.laborelec.com Restricted LBE04118739 - 3.0 | 67 of 133
2. Steam flow limitation on the steam turbine: the design of the turbine
does not allow to handle the additional steam flow at increased Pmax,
3. Feedwater pump capacity: As a Pmax increase, usually means higher
water flow rate from the feedwater tank,
4. Contractual limitation: the transmission system might reach the
maximum energy transport capacity. TSO will therefore waive the Pmax
increase potential as the additional energy could not be pushed onto the
grid.
Figure 38: Pmax evolution of a subcritical Rankine cycle in Poland
Regarding Pmin reduction, the following technical limitations apply:
1. Circulation in the water-steam cycle: This needs to be maintained to
sufficient levels to ensure that the quality of the live steam (i.e. minimum
superheating of +50°C) will be kept acceptable. Furthermore:
a. The SCR7 inlet temperature is kept high enough to avoid the
formation of ammonium salts in the catalysts and the preheaters,
which can lead to fouling and corrosion
b. The inlet temperature of the air preheaters is kept sufficiently
high to avoid the formation of highly corrosive sulfuric acid in the
preheaters [26], [27]
2. Minimum steam flow through the turbine: Steam flow needs to be kept
above a certain limit in order not to move upstream the Phase Transition
Zone in the LP turbine (i.e. where steam starts to condense). Also, to
avoid temperature increase in the turbine. Detrimental operational
conditions leading to steaming and flashing should be prevented as well
to avoid erosion in the tubes and valves.
3. Fluttering: At low load, last stage(s) steam turbine blades may
experience liquid-droplet erosion issue and dynamic excitation so-called
(fluttering). These phenomena have been responsible for blade failures
7 Selective Catalyst Reduction (SCR) systems are flue gas treatment devices to absorb the NOx emissions

© Laborelec www.laborelec.com Restricted LBE04118739 - 3.0 | 68 of 133
and design modifications are necessary for sustained operation under
these conditions.
4. Coal Mills: the general consensus is that Pmin can often be reduced up to
70-80% turndown, depending on the design of the installation. The load
reduction requires to switch-off some burners and coal mills (up to two
mills in operation in general, sometimes one mill for new design) but not
beyond the point where gas or diesel injection is required to sustain the
flame. The minimum capacity of the coal mills in operation sets the Pmin
of the unit. In some case the speed of the induced- and forced-draft fan
might be a limiting factor as well.
Figure 39: Pmin evolution of a subcritical Rankine cycle in Germany
Rankine cycles have different technical limitations on ramp rates. The main limitations are
detailed below:
1. Benson-type, forced circulation boilers offer more flexibility than
natural circulation boiler since drum-related limitations, especially on
temperature gradients, are not applicable,
2. Coals mills with indirect combustion, i.e. with storage capabilities,
respond faster than coals mills with direct combustion as increased
pulverized coal demand can be rapidly supplied from the storage.
However, the response is generally delayed by 1.5-minute dead time
which detrimentally affects the ramp rate initially. The
responsiveness of the coal mills is moreover very complex to predict
as it depends on many other process parameters.
3. The burner configuration, i.e. number and position of in-service
burners,

© Laborelec www.laborelec.com Restricted LBE04118739 - 3.0 | 69 of 133
Figure 40: Maximum ramp rates evolution of a subcritical Rankine cycle in Germany
Figure 41: Evolution of a warm start-up time (Rankine in Poland) and fuel consumption (Rankine in Germany)
Whereas there are no technical limitations related to minimum up time, some exist for
minimum down time.
1. Stress in the boiler parts. To avoid stressing the boiler parts, especially headers
and tube arrays, natural cooling during a design-specific duration is advised and
can preclude fast restart of the unit. Some plants have tried to shorten this minimum
down time by accelerated cooling, but they came back to natural cooling after
structural integrity issue on the boiler.
2. Water chemistry. Water steam chemistry treatments during the shutdown
procedure may require some time and, as such, be a limitation for the minimum
down time.
CCGTs
Whether the combined cycle is based on a heavy-duty or aeroderivative gas turbine, one
can identify some technical limitations towards flexibility improvement of such plants.
Regarding Pmax increase, some technical limitations can be observed in the process. The
most important ones are listed hereafter:
1. Flame temperature on the gas turbine as the hot gas path components
operate under conditions of high stress and temperature, nearing material
resistance capabilities. Different ranges of flame temperature applies to

© Laborelec www.laborelec.com Restricted LBE04118739 - 3.0 | 70 of 133
the GT technologies available on the market: 1020 to 1100°C for E-class,
1230 to 1360°C for F-class and +1400°C for H-class.
2. NOx limitations: the higher the flame temperature, the faster the NOx
formation.
3. Maximum steam temperature and pressure within the heat recovery
steam generator and/or the steam turbine. The maximum temperature
and/or pressure8 allowed by design can be reached.
4. Steam flow limitation or power limitation on the steam turbine, which
actually means that the steam turbine might become undersized to handle
the steam flow as Pmax is increased,
5. Feedwater pump capacity as a Pmax increase practically means higher
water flow rate from the feedwater tank or from the LP drum to the HP
and IP drum,
6. Reactive power that is demanded by the grid can impose some
limitations on the active power, hence forcing Pmax down,
7. The cooling capacity of the generator, which relates to the cooling
water temperature, can become the limiting factor
8. Contractual limitation on fuel capacity or gradients. For instance, if
both the power plant and residential heating use the same gas lines, local
authority may impose a maximum off-take to the plant to avoid
disturbance or even shortage at residential level. In addition, in case of
high gas consumption, the pressure on the gas grid can drop below the
minimum pressure required by the GT (defined by the combustion
chamber pressure) and force a power de-rating (up to a certain limit).
9. Contractual limitations as the transmission system might reach the
maximum energy transport capacity. TSO will therefore waive the Pmax
increase potential as the additional energy could not be pushed onto the
grid.
10. Special constraints when using liquid fuel in the GT: The exhaust
gases temperature and flow are increased due to the higher steam
content following water injection. Any further increase of temperature or
flow might not be possible if design limits are already reached on the
HRSG, e.g. temperature and pressure conditions in the HP drum. Water
injection might be also limited by the maximum flow the demin water plant
can deliver.
11. Hot ambient conditions: Pmax increase potential can be limited if no inlet
air cooling system is installed. Depending on the inlet cooling system, the
lifetime of the first compressor blade rows can be impacted due to liquid
droplet erosion.
8 In sliding pressure mode, the pressure at ST inlet is almost proportional to the steam flow. Hence the maximum pressure (on ST or HRSG) is actually a limitation on the steam flow.

© Laborelec www.laborelec.com Restricted LBE04118739 - 3.0 | 71 of 133
12. Commercial limitations such as imbalance issues that can occur at the
end of a load variation due to ramp rate limitation, because Pmax is defined
in steady state conditions.
Figure 42 provides an example of the evolution of the Pmax on a F-class CCGT in Europe
thanks to a GT upgrade.
Figure 42 - Pmax evolution on a F-class CCGT
Pmin reduction in CCGTs technical limitations are outlined below:
1. CO limitations: As long as the flame remains in premix mode, the
lower the flame temperature, the faster the CO formation.
2. NOx limitations: Also applicable as high-temperature pilot flame is
required at low load to maintain the stability of the flame9. Compliance
with emissions is also the limiting factor when Pmin is reduced by
controlled degradation of the efficiency.
3. Low steam pressure on the HRSG, which can cause erosion in the
lines and flashing in the valves (sudden evaporation) due to
excessive steam velocity.
4. Temperature increase in the steam turbine due to a too low steam
flow (hence lower expansion ratio),
5. With Air Cooled Condenser systems, the cooling capacity might
become oversized. This can lead to the formation of ice inside the
lines while operating at low ambient temperatures,
6. Compressor instabilities may be triggered. This can lead to
catastrophic blade failures,
7. Combustion instabilities: When the load is decreased, the
operating point of the machine can move closer to CO limit and to
frequencies where combustion instabilities occur. The actual tuning
9 In premix mode, the fuel gas and air are premixed before the burner. This combustion mode generates less NOx emissions but is less stable. In a pilot flame, the premix is very low or even zero (pure fuel), which gives a much more stable combustion but generates higher NOx emissions.

© Laborelec www.laborelec.com Restricted LBE04118739 - 3.0 | 72 of 133
and physical limits of the gas turbine can prevent further reduction of
Pmin.
Figure 43 - combustion stability area and instability frequencies. “TTRF” corresponds to the turbine inlet temperature. “Split” corresponds to the gas distribution between premix and pilot flame.
8. Gas turbines are basically tuned for baseload operation. Some
types of gas turbines, e.g. SGT5-2000E, feature asymmetrical
thermocouples distribution in the exhaust duct to measure the
exhaust temperature in the hot spots. However, at lower load, the hot
spots change position and can be out of reach of the thermocouples.
Error on measurements of the turbine outlet temperature can lead to
regulation issue.
9. Fluttering: At low load, last stage(s) steam turbine blades may
experience liquid-droplet erosion issue and dynamic excitation so-
called (fluttering). These phenomena have been responsible for
blade failures and design modifications are necessary for sustained
operation under these conditions.
Figure 44 provides an example of the evolution of the Pmin on an F-class CCGT. Most
improvements were reached by implementing a better combustion tuning and a control loop
optimization.
Figure 44 - Pmin evolution on a F-class CCGT

© Laborelec www.laborelec.com Restricted LBE04118739 - 3.0 | 73 of 133
Ramp rates are key contributors towards increasing the flexibility of the power plants. They
allow a closer tracking of the load variation. During start-ups, they contribute to the reduction
of the start-up time. Ramp rates play an active role when providing SFC. However,
increasing ramp rates have some process limitations, including but not limited to:
1. Temperature and pressure increase in the HRSG, especially in the
drums and the array of tubes exposed to the hottest exhaust gases,
which could be irreversibly damaged by too high rates. The wall
thickness of the HP drum plays a predominant role in the limitation of
the ramp rates. The pressurization ramps in the HRSG can be
controlled and optimized with the use of a stress evaluator model.
2. The quality of the control loops which need to be robust against
perturbations and deliver a fast response. For instance, increased
ramp rates were achieved by ELL intervention, manly solving
instabilities of control loops dedicated to steam turbine control valves,
drum level oscillations or attemperation in the HRSG.
3. The availability of advanced controller libraries to program
advanced control loops (i.e. Model Based Control).
4. Stress induced in the rotor of the steam turbine by the thermal
transient in addition to the centrifugal force. In this case, the
maximum ramp rates are controlled by stress calculator/stress
computer.
Figure 45 provides an example of the evolution of the ramp rate on a F-class CCGT thanks
to a control loop optimization and the release of OEM limitations.
Figure 45 - ramp rate evolution of a F-class CCGT
At part load, the efficiency of both the gas and steam turbine is lower. Nevertheless, it can
be improved in some ways. Some examples are turning off auxiliaries not needed at part
load, installing Variable Speed Drives (VSD) or by optimizing the set point of the
backpressure in the condenser.
Whatever the ramp rate of the unit, the start-up time is primarily impacted by the preparation
time which mainly consists of:

© Laborelec www.laborelec.com Restricted LBE04118739 - 3.0 | 74 of 133
Conditioning the gland steam, if gland steam is not immediately available from the
HRSG, or an auxiliary boiler
Creating the vacuum in the condenser, if vacuum was not kept during the
downtime
Apart from this, during the GT acceleration phase, the start-up time is also impacted by the
purging time, which vary from a plant to another (volume of the HRSG), but also from an
OEM to another (compressor flow). The degree of automation of the start-up sequences
plays an important role in the total start-up time.
Figure 46 provides an example of evolution of the start-up time and fuel consumption on an
F-class CCGT thanks to the optimization of the start-up strategy, sequence and control
loops.
Figure 46 - Start-up time (<12h shut down) and fuel consumption for a F-class CCGT
Whereas there are no technical limitations related to minimum up time, some exist for
minimum down time.
1. Thermo-mechanical constraint of the HRSG. The heavy, thick-walled parts from
the HRSG and, eventually, of the steam turbine, are subject to high thermo-
mechanical constraints during a shutdown of the unit. A minimum time can be
necessary to let these critical parts cool down properly and to avoid to affect their
integrity with time.
2. Thermo-mechanical constraint of the GT. In some cases, the rotor of the gas
turbine may be a limiting factor as well.
3. Water chemistry. In some cases reported to ELL, water steam chemistry
treatments during the shutdown procedure can take some time and impact the
minimum down time of the unit.
Frequency control, both PFC and SFC, have technical limitations. For PFC, the delivery of
VFR has a commercial benefit but also technical drawbacks, e.g. risk of combustion
instabilities on GT burners and excessive temperature and pressure gradient on the water-
steam cycle upon reduction of the droop. For SFC, depending on the plant, either the ramp
rates or the turndown (hence Pmax and Pmin) can become the limiting factor, each with their
own technical limitations already developed above.
Figure 47 provides the evolution of the PFC and SFC reserves on two different F-class
CCGTs respectively, thanks to the decrease of the allowable GT droop and the increase of
the turndown.

© Laborelec www.laborelec.com Restricted LBE04118739 - 3.0 | 75 of 133
Figure 47 - PFC and SFC reserve evolution on 2 F-class CCGT
OCGTs
Operation in open cycle offers a high level of flexibility as the HRSG, BoP and steam turbine
and related technical limitations are not involved, but it is done at the expenses of efficiency
and moreover cannot be necessarily sustained for a long time due to emissions.
Pmax increase is limited by similar factors as for CCGT:
1. Flame temperature on the gas turbine as the hot gas path
components operate under conditions of stress and temperature
nearing material resistance capabilities whilst still preserving a
sufficient lifetime
2. NOx limitations: the higher the flame temperature, the faster the
NOx formation,
3. Reactive power demanded by the grid can impose some limitations
on the active power, hence forcing Pmax down,
4. Contractual limitation on fuel capacity or gradients imposing a
maximum gas off-take to the plant to avoid disturbance or even
shortage at residential level.
5. Contractual limitation since transmission system might reach the
maximum energy transport capacity. TSO will therefore waive the
Pmax increase potential as the additional energy could not be
pushed onto the grid.
The following technical limitations apply to Pmin reduction for OCGT:
1. CO limitations: As long as the flame remains in premix mode, the
lower the flame temperature, the faster the CO formation.
2. NOx limitations: Also applicable as high-temperature pilot flame is
required at low load to maintain the stability of the flame10.
Compliance with emissions is also the limiting factor when Pmin is
reduced by controlled degradation of the efficiency.
3. Compressor instabilities may be triggered and can lead to
catastrophic blade failures.
4. Combustion instabilities (see CCGT section).
10 In premix mode, the fuel gas and air are premixed before the burner. This combustion mode generates less NOx emissions but is less stable. In a pilot flame, the premix is very low or even zero (pure fuel), which gives a much more stable combustion but generates higher NOx emissions.

© Laborelec www.laborelec.com Restricted LBE04118739 - 3.0 | 76 of 133
For ramp rates, some technical limitations still remain:
1. Expansion and thermal stresses on the heavier components of the
gas turbine (e.g. casing). This is less a problem for OCGT running
aeroderivative gas turbine because of their lighter, thin-walled
construction.
2. Temperature and thermal stresses induced by the electrical
loading in the copper core of the rotor and stator of the generators.
This limitation also relates to the cooling capacity of the generator.
Minimum up and down time are not usual for OCGTs. Sometime, and for specific GT
manufacturers, a minimum down time after shutdown is set to avoid excessive thermo-
mechanical constraint on the GT.
Emissions
European regulations (see section 2.2.4) define threshold values for the emissions which
have to be transposed into national and even regional laws in order to deliver a local permit
to the power plants.
Different emissions directives exist in Europe, each with own specific rules and exceptions,
which then need to be aligned and transposed into limits by the local authorities. Local limits
are generally more stringent than the generic limits defined at European level.
The emission limits are defined as hourly, daily, monthly and yearly compliance. Table 9
shows the percentile 10, 50 and 90 of daily-compliance emission limits for a representative
fleet of thermal assets in Europe, for respectively Rankine cycles, CCGTs and OCGTs.
Table 9: Emission limits for a representative fleet of thermal assets in Europe Daily compliance P10, P50 and P90 in normalized ambient conditions and O2 content
mg/Nm³
Rankine cycles - coal and biomass
6% O2
CCGT - gas 15% O2
OCGT - gas 15% O2
P10 P50 P90 P10 P50 P90 P10 P50 P90
SO2 50 277 400 10 11.6 120 - - -
NOx 100 200 400 41 50 93 33 50 75
CO 50 100 198 53 100 100 29 92.5 100
PM 10 25 56 2 5 8 - - -
At the date of this report, not all the environmental permits received by ELL comply
with the regulatory limits of the IE-D (in red in Table 9). This may be due to the delay
between the date of the entry into force of the IE-D, and the date on which the
environmental permits will be re-written.
The transposition of the emission limits by local authorities on a case-by-case basis can lead
to limitations for the flexibility potential of power plants. Some examples are given below for
CCGTs and OCGTs. When dealing with emissions, one have to pay particular attention to
the unit in which emission limits are expressed. Indeed, limits expressed as concentration
are more stringent than volume. A given volume on yearly-basis can be respected with large
fluctuations in concentration over the year.
- The maximum CO concentration is not always applicable to some plants, but can
impose some limitations on the Pmin of other plants.

© Laborelec www.laborelec.com Restricted LBE04118739 - 3.0 | 77 of 133
- Limitation on emitted volumes can impact the allowable number of start-ups and the
operation time at low load. As example, the total volume of NOx produced during start-
up must be below 7% of total yearly volume of NOx, which leads to restrictions on the
number of starts. Plants can work around this type of restrictions by adopting start-up
sequences reducing the number of NOx produced during start-up (e.g. start-up as
OCGT) but ultimately resulting in a bad emission - produced power ratio up to
reaching combined cycle mode.
- When the plant is operated below a certain load (e.g. 60-70% of Pmax), the NOx and
CO emission limits can be multiplied by a factor (e.g. x2),
- For plants operated less than a given number of hours per year, either no NOx
emission limits apply (e.g. <150 hours/year) or the NOx emission limits is increased
to a certain level, e.g. the NOx concentration limit of 50 mg/Nm³ above 70% load
becomes 150 mg/Nm³ for whatever load if the plant is operated less than 1500
hours/year as per moving average calculated over a period of 5 years.
- Specifically for Rankine cycles,
o Emissions limits might be exceeded if the DeNOx temperature is too low
(e.g. during start-up or at Pmin). Emissions are normally not a concern when
the plant operates at baseload and if the flue gas treatment devices are
operating correctly,
o Rankine cycles without flue gas treatment may face some difficulties to
control the emissions in case of load variation,
For OCGT and CCGT, when fuel oil is burnt, the emission limits are modified. For example,
NOx limits can be doubled but the CO emission limit value remains the same as for natural
gas, but only applies to a smaller power range, e.g. from 75 to 100% instead of 60 to 100%.
The ambient temperature can also affect the minimum load where to be compliant with the
emission limits. For example, below 15°C, the lower limit of the emission compliant GT load
range can be increased up to 80% for fuel oil and from 50 to 56% for natural gas. For other
plants, the GT load range is the same for both natural gas and fuel oil and changes with the
temperature as well, i.e. 50-100% below 37°C and 62-100% above.
The aforementioned limitations show how the regulatory context as applied in Europe can
lead to large discrepancies on the emission allowance of two identical units and is often
subject to interpretation and workaround the imposed limits. In most cases, one can state
that emissions were generally not a limiting factor for flexibility.
3.4. Performance benchmark for each category
In this part, ELL selected a representative fleet of thermal assets in Europe, and looked at
the operational parameters of each of them. Some characteristics of the fleet are mentioned
in Table 10.
Table 10: Representative fleet of thermal assets in Europe, some characteristics
Category # units
Rankine Cycle 16

© Laborelec www.laborelec.com Restricted LBE04118739 - 3.0 | 78 of 133
CCGT 26
OCGT 5
Country of origin 11
The performances of the different thermal assets chosen by ELL are presented for each
category of plants in Table 11 to Table 13. 10th percentile (P10), 50th percentile (P50) and
90th percentile (P90) are calculated to illustrate the average and the spread in terms of
performance in each power plant category.
Figure 48: Definition of P10, P50 and P90
3.4.1.1. Rankine cycles
Since both subcritical and ultra-supercritical (USC) boilers are currently installed in Europe,
a benchmark is provided with USC (Table 11) and without the USC units (Table 12).
The performance benchmark with the USC units is more representative of the current
situation in Europe, while the performance benchmark without USC is found more
comparable with the situation in Chile, where only subcritical units are installed.
Table 11 : benchmarking of Rankine power plant performances, USC included
10th percentile 50th percentile 90th percentile
Pmin (MW) 109 120 191
Pmax (MW) 207 224 661
Relative turndown (%) 37.26 46.99 76.49
Ramp rate (MW/min) 2 2 17
Ramp rate (% Pmax/min) 0.74 0.90 3.00
Start-up times for following downtime (min)
<8 hours 90 151 151
8-32 hours 204 225 326
32-72 hours 354 480 522
>72 hours - 660 -
Minimum uptime (min) 270 720 720
Minimum downtime (min) 90 120 360

© Laborelec www.laborelec.com Restricted LBE04118739 - 3.0 | 79 of 133
Table 12 : benchmarking of Rankine power plant performances, USC excluded
10th percentile 50th percentile 90th percentile
Pmin (MW) 105 119 195
Pmax (MW) 206 223 435
Relative turndown (%) 35.17 46.70 68.43
Ramp rate (MW/min) 2 2 3
Ramp rate (% Pmax/min)
0.70 0.90 1.03
Start-up times for following downtime (min)
<8 hours 150 151 151
8-32 hours 198 225 320
32-72 hours 324 420 516
>72 hours - - -
Minimum uptime (min) 318 720 720
Minimum downtime (min)
120 120 360
3.4.1.2. CCGTs
For CCGT, both 1+1 (1 GT + 1 ST) and 2+1 (2 GT + 1 ST) configurations are
installed in Europe. For a coherent benchmark between 1+1 and 2+1 CCGTs, the
performance of the 2+1 installations are compared in 1+1 mode only.
Table 13 : Benchmarking of CCGT power plant performances (1+1 configuration)
10th percentile 50th percentile 90th percentile
Pmin (MW) 118 163 210
Pmax (MW) 338 390 438
Relative turndown (%) 43.6 58.9 70.6
Ramp rate (MW/min) 11 20 29
Ramp rate (% Pmax/min) 2.89 5.10 7.29
Start-up times for following downtime (min)
<12 hours 41 66 85
12-32 hours 58 80 116
32-56 hours 76 99 141
56-72 hours 87 113 153
>72 hours 103 199 279
Minimum up time (h) 0 1 10
Minimum downtime time (h) 0 3 6
Black start capacity 2 out of 26 plants
Very Fast Reserve (MW) 11 25 36
SFC maximum power (MW) 20 78 150

© Laborelec www.laborelec.com Restricted LBE04118739 - 3.0 | 80 of 133
3.4.1.3. OCGTs
Table 14 : performance of OCGT power plant
10th percentile 50th percentile 90th percentile
Pmin (MW) - 40 -
Pmax (MW) 22 75 130
Ramp rate (MW/min) 10 13 39
Ramp rate (% Pmax/min) 13 36 75
Start-up time up to Pmax (min) - 30 -
For OCGTs, ELL did not find representative values for minimum up and down times.

© Laborelec www.laborelec.com Restricted LBE04118739 - 3.0 | 81 of 133
4. Analysis of the current situation in Chile
4.1. Overview of Chilean Electric Systems
Chile’s geographical characteristics make it a very particular environment to the
development of electric infrastructure. Chile is in the middle of two important geographical
features: the Pacific Ocean and the Andes mountain range, one of the tallest and longest
ranges in the world. Both are separated by an average of 177 km, opposing to the near
4.300 km long of the country, which accounts for an approximate land area of ~743 800
km2.
Chile‘s wide spatial distribution has allowed to count with a privileged position in terms of
renewable energy resources. While the extreme north highlights because of the dry climate
and extremely high irradiance conditions, the south, in contrast, has exceptional water and
biomass resources. Geographical distribution of the resources and people’s distribution over
the territory have been key factors and they have highly conditioned the development of the
electricity grids. Whereas the resources are distributed in the north and the south of the
country, consumptions centres are mainly located in the central zone of Chile, which
imposes some constraints in the planning and development of the electricity infrastructure.
Chilean electricity market is structured in two main grids: The SIC and SING (along with two
medium isolated systems - Aysen and Magallanes - and two small isolated systems - Los
Lagos and Isla de Pascua- which are out of the scope of this report). The origin of both
systems was the interconnection of several smaller subsystems which aimed at supplying
cities and big industries (particularly true for the mining industry in the SING). The final
coordinated operation of each system was achieved in 1968 for SIC and in 1993 for SING.
SIC is characterized for being a hydrothermal system (40% Hydro, 45% Thermal, 15%
RES), which concentrates near a 75% of Chile’s electricity demand (estimated in 70 TWh
for 2017) and a 92% of Chilean population (whose residential consumption is estimated in
aprox 34 TWh). The grid has a very extensive length, but is barely meshed, with a total
length of transmission lines of 20 058 km (in Oct-2015). As a reference, the maximum hourly
average demand reached 7 800 MW in 2016.
On the other hand, the SING is mainly an industrial system that has developed around the
mining sector. The SING has an eminently thermal composition (90% of its installed capacity
is thermal) and concentrates 6% of total Chilean population. The mining sector is the major
consumer of energy in the SING, accounting for 90% of the energy demand. The industrial
sector with a flat load profile and 24/7 energy requirements have relied mainly in thermal
power plants as the cornerstones of their supply. The intrinsic development of the grid has
resulted in a transmission system with the main power plants in the coastline (for raw
materials reception and refrigeration needs), meanwhile mining consumptions are located
towards inlands, close to the mines and industries. As a reference, the maximum hourly
average demand reached near 2 400 MW in 2016, which were produced along the 8 391
km of transmission lines that compose the grid (according Oct-2015 information).
Nowadays, Chile is not electrically interconnected with any neighbor, with the exception of
a low capacity (770 MVA) to Argentina (Sistema Argentino de Interconexión - SADI), at the
SING. This interconnection line was initially foreseen to provide energy from a combined
cycle located in Argentina to the SING, making profit of the economical Argentinian gas.

© Laborelec www.laborelec.com Restricted LBE04118739 - 3.0 | 82 of 133
However, SADI’s undercapacity has reversed the situation and since 2015 the owner of the
line has authorization to export 200 MW from Chile to Argentina has been provided. In any
case, the interconnection helps stabilizing the frequency and provides a bigger inertia and
primary reserve in case of contingencies.
Each of the electric systems has its own independent system operator (ISO), which plays
coordinates the operation of the grid. ISO’s do not own any generation, transmission nor
distribution assets. In Chile, ISOs have been called the CDECs, whose acronym stands for
Centro de Despacho Económico de Carga (or Economic Load Dispatch Center). In the case
of SIC this responsibility relapse in CDEC-SIC, while in SING it relapses in CDEC-SING. At
the beginning of 2017, both CDECs were merged, creating the CEN (Independent
Coordinator of the National Electric System – SEN), in anticipation of the merging of the
systems which is expected to be carried out between 2018 – 2020.
According December statistics, available in both CDECs sites, the installed capacity in each
system is of 17 GW in the SIC, and of 5.5 GW in the SING, with the following breakdown:
Production Type – North CL (SING)
2016
[MW]
Coal 2650
Cogeneration 18
Fossil Oil 326
Hydro Run-of-the-river 11
Natural Gas 1942
Solar PV 346
Wind Onshore 202
Total SING Grand capacity 5495
Production Type – Central CL (SIC)
2016
[MW]
Biogas 57
Biomass 426
Coal 2571
Fossil Oil 2670
Hydro Run-of-the-river 2576
Hydro Water Reservoir 4046
Natural Gas 2526
Solar PV 1192
Wind Onshore 1087
Total SIC Grand capacity 17152
SING –
5495 MW
SIC –
17152 MW
Other isolated
systems –
188 MW
Figure 49: Breakdown of installed capacity by technology - SIC and SING (source: CDEC-SIC and CDEC-SING website)

© Laborelec www.laborelec.com Restricted LBE04118739 - 3.0 | 83 of 133
4.2. Market Organization
Chilean electricity activities are structured among three main sectors: Generation,
Transmission and Distribution and they are all held by private companies, the State being
an entity with a regulatory, prosecutorial and subsidiary role. While generation is
characterized by being an open access sector (liberalized) with the possibility to any
company to enter the market, transmission and distribution are regulated because of their
natural monopoly characteristic. Under current Chilean regulation, the figure of the
Supplier/Buyer does not exist, taking that role the actors of the generation and distribution
segment. The main regulatory framework of the electric sector is provided by the DFL No.
4, “General Law of Electric Services”, meanwhile technical framework is specified in the grid
code or NTSyCS (Acronym for “Technical Standards of Safety and Quality of Service”, in
spanish).
Chilean electricity market is organized in two main markets: the wholesale market (physical/
spot market) with a pool structure, whose coordination is in charge of the CDECs, and a
financial market, where generators carry out supply contracts with clients (big consumers,
distribution companies or other generators) for a certain period of time (Figure 50).
Figure 50. Chilean electricity market organization
Products involved in Chilean electric market comprises two main products: Energy and
Capacity. Ancillary services does not represent a tradable product, but their provision is
mandatory and coordinated by the CDECs. In fact, under the current regulation, generation
companies do not consider the provision of Ancillary Services as a source of revenues or
as part of their core business.
The CDEC is the entity in charge of carrying the central dispatch of the generators pool,
ensuring to achieve the minimum economical technical operation and secure operation,
among others. The Chilean electricity market is structured as follows:
4.2.1.1. Spot Market
In the spot market, central dispatch is carried out by the CDEC and participation is
mandatory. Under the central dispatch scheme, generators are required to declare their
true variable costs (power plants can be audited), and the ISO balances the offer and the
demand in the spot market, setting the system’s marginal cost equal to the highest variable
cost that matches the offer and the load. Marginal cost is calculated for each node of the
system.
The pricing scheme in the Chilean electricity market, includes an energy component
calculated as explained above, and a capacity payment for all the plants in the system,
proportional to their contribution in system’s adequacy. The price at which capacity is paid,
is determined by a study done every 4 years by the regulator (CNE). As of 2017, the capacity
Chilean Electricity Market
Pool Market
(Spot Market)
Financial Market
(Bilaterial Contracts)

© Laborelec www.laborelec.com Restricted LBE04118739 - 3.0 | 84 of 133
price is set every six months, as the cost of the optimal capacity expansion through a
calculation called “nodal capacity price”. This pricing scheme, named peak load pricing,
ensures (in theory) that with an energy payment and a capacity payment, the investments
and operation costs will be fully recovered by plant owners in systems with the offer adapted
to the demand. Both payment mechanisms, energy and capacity, are balanced by the
CDECs. The CDECs also manage other payments derived from the operation of the system
such as ancillary services payments (compensations), transmission capacity payments,
among other.
The spot market operation is executed according to two schedules: the weekly schedule
(medium term) and the daily schedule (short term). The CDEC solves the optimization
problem that defines the schedule (pre-dispatch) of all the generation units of the system
taking into account system constraints such as hydrology, availability of the power plants &
transmission lines, fuel availability, etc. Weekly schedules are based in long-term economic
optimizations of the system in order to estimate the future cost of water (for reservoir hydro
power plants). Companies involved in the process (mainly generators) are responsible for
providing true information about their infrastructure and foreseen conditions, which can be
audited by the ISO.
The ISO, sorts the pool of generators according to their variable cost, defining a merit order
of the power plants to supply the demand. From this procedure, a priority list of the power
plants is obtained for each day together with a summary of the operation of the reservoirs
and thermal power plants of the system. Daily schedule is developed each business day, in
order to adapt the pre-dispatch to foreseen conditions for the next business day (e.g.
weather forecast, demand deviations, affluent flows, operational constraints, contingencies,
etc.). After checking all the information, CDEC defines the final operating policies of the
system.
The real-time operation of the system is carried out by a specific department of the CDEC,
the Dispatch and Control Center (CDC), which follows and coordinates the real-time
operation of the system. CDC communicates with a Control Center of each coordinated
company, issuing instructions on how to operate their power plants.
4.2.1.2. Financial Market
Generators can be participant of a financial energy market, where supply contracts are freely
agreed between the parties (bilateral agreements). The existence of the financial market
allows the generators to accommodate their commitments (energy contracts) within the
economic operation determined by the CDEC. Commitments (financial market) and real
operation (centralized dispatching) are then balanced. Under this scheme, a generator
whose produced energy is higher than its commitments or withdrawals (Surplus situation) is
going to receive payments from other generators whose produced energy is less than its
withdrawals (Deficit situation).
Supply contracts are confidential, although the involved demand and the supply node must
be informed to CDEC to program the operation (Demand estimation). Main clauses of the
contracts comprises the agreed quantity and the transaction price of the product (energy,
capacity). Measurements are typically carried out on an hourly basis.
Generators can agree supply contracts with distribution companies through public supply
tenders or with big consumers (called “free clients”) through private contracts/tenders.

© Laborelec www.laborelec.com Restricted LBE04118739 - 3.0 | 85 of 133
It is responsibility of the CDEC to calculate the payments between generators, due the
energy injection and withdrawals of their contracts they have carried out. For example, if a
generator needs 100 MWh to satisfy a client’s demand it has contract with, and it doesn’t
operate (because of the nature of centralized dispatching), it will require to purchase those
100 MWh from the wholesale market (at spot price).
4.3. Regulatory framework for Ancillary Services
Even though the first formal distinction between the concepts of adequacy and security of
the system was made in 2004 (Law 19.940), Chilean law has recently included ancillary
services in the regulation.
Adequacy is defined as the attribute of the electricity system whose installations are
adequate to supply demand. Adequacy concept is under capacity payments. On the other
hand, service security is defined as the response capability of the system, or a part of it, to
withstand contingencies and minimize consumption loss through the action of backups and
ancillary services. Therefore, ancillary services are related to system security.
The Chilean law states does not link payments for the security of the system to energy, nor
capacity payments. The Supreme Decree No. 130 (DS130) was enacted in 2011 and
provided the framework for the payment (the so-called compensation of incurred costs) of
ancillary services. Its first application was carried out on March, 2016.
According Law 20.936 (enacted in 2016), ancillary services are defined as: “Features that
allow the coordination of the operation of the system under the terms stipulated in article 72-
1 of DFL No. 4 (i.e. according the coordination principles of the operation). Ancillary services
are at least, the frequency control, the voltage control and service recovery plans, both under
normal conditions and under contingencies“
The law establishes that the ISO shall require the participants to comply all the technical
regulations, including the provision of ancillary services. Hence, the provision of ancillary
services is mandatory for the installations that are enabled to do so (therefore, an enabling
process is carried out). Enabling installations to provide ancillary services is in charge of the
ISO (sometimes with the use of third-party qualifying bodies). In fact, the determination,
administration and operation of ancillary services is determined by the ISO, as well as the
pricing and remuneration of them. Every generator must provide the necessary means (and
infrastructure) to exercise an adequate provision of services. In the case of lack of means
for correctly providing those ancillary services, the ISO has the power to apprise the
implementation of necessary resources or infrastructure.
The 4 main ancillary services contemplated by the ISO, are:
Frequency Control
Voltage Control
Service Recovery Plans (Installation and Operation)
Load Shedding Schemes
At the moment, ancillary services provision is not a market. In fact, power plants do not see
incentives to make a business case on the provision of ancillary services (and therefore
indicatives to flexibilize the assets remain quite limited). The supply of ancillary services
results from the centralized dispatching carried out by the ISO. However, the creation of a

© Laborelec www.laborelec.com Restricted LBE04118739 - 3.0 | 86 of 133
formal ancillary services market is under development, and is expected to have all the
necessary regulation by 2020. The regulator is already working on this topic, considering
the importance due to the merging of both systems and the continuously increasing RES
penetration in the system.
4.3.1.1. Primary Frequency Control (PFC)
According to grid code and ISO reports, Primary Frequency Control can be defined as:
“Control action performed by the load/speed controllers of synchronous generators and by
the frequency/power controllers of wind farms, solar parks and active energy compensation
equipment, enabled to automatically modify their active power production, with the aim to
correct the imbalances between generation and load in the interconnected system, thus
correcting the frequency deviations of the system”.
In practice, depending on the grid, the Primary Frequency Control is carried out in a different
way.
In the case of SIC, PFC is mainly provided by hydro power plants (water reservoir). The so-
called pilot plant. This pilot plant, has a near zero droop, and is supported with other hydro
plants with low values of droop (~3%). This pilot plant is set by the ISO. Under certain
hydrology conditions of the system (droughts), OCGT plants (e.g. Candelaria or Taltal) can
also be used to provide primary reserve.
In the case of SING, the PFC is carried out by leaving a spinning reserve in every enabled
unit, working at a de-rated power (7% reserve) to provide the required primary reserve.
In a similar way to Europe, primary reserves are annually determined in a techno-
economical study called: “Frequency control and reserve determination study”. The following
amounts were estimated for 2017, broken down into Primary Reserves used for normal
demand deviations, and Primary Reserves used under contingencies (e.g. outage of a
power plant).
Table 15. Estimation of reserve for primary frequency control – Year 2017
All installations to be qualified to carry out the PFC, must comply with given requirements,
specified in the grid code (Chapter 5). The main requirements for speed controllers of each
synchronous machine are the following:
Adjustable droop under load conditions. Units driven by steam turbines may require
to stop the prime mover to change droop’s value. Droop settings are the following:
o Hydro: 0% – 8%
o Thermal: 4% – 8%
Max Deadband of ±25 [mHz] (0.1% of nominal frequency: 50 Hz).
Initial delay of load/speed system action under 2 seconds.
Max establishment time:
o Hydro: 120 seconds
o Thermal: 30 seconds
Oscillations must be damped under all operating regimes (Pmin, Pmax, other values).
System PFC (Demand
Variations) PFC
(Contingencies) Total PFC
SIC 57 MW 221 MW 278 MW
SING 42 MW 98 MW 140 MW

© Laborelec www.laborelec.com Restricted LBE04118739 - 3.0 | 87 of 133
Solar and wind plants are obliged to perform PFC during over-frequency situations. Of
course, their participation in is always limited by the availability of the primary resource and
mainly in downwards direction.
4.3.1.2. Secondary Frequency Control (PFC)
According to grid code and ISO reports, Secondary Frequency Control can be defined as:
“Manual or automatic action destined to correct the permanent frequency deviation resulting
of the action of PFC performed by the load/speed controllers of the generators and/or by the
frequency/power controllers of the active energy compensation equipment arranged with
that purpose.
SFC action must be maintained during the necessary time to maintain the frequency within
an admissible range, referred to its nominal value. This action can be performed in the order
of several seconds to a few minutes, according to the response capability of the generation
unit determined in its qualification to provide this service, and without exceeding 15 minutes.
It is SFC’s task to re-establish system’s frequency to its nominal value, allowing PFC
participants to re-establish their active power value to reference values at the nominal
frequency”.
In Chile, SFC actions are mainly carried out manually (called manual re-dispatch) since
Automatic Generation Control (AGC) systems are currently being implemented. Depending
on the grid, Secondary Frequency Control is carried out in a different way.
In the SIC, SFC is provided together with the PFC by the pilot unit, plus the manual re-
dispatch of other generation units. Normally, pilots units are reservoir hydro units such as El
Toro, Pehuenche, Colbún and Rapel.
In the SING, the control is usually carried out by CCGT units. Most of the time the unit
performing SFC is the Tocopilla U16 unit.
Secondary reserves are determined together with the primary reserves. The following
amounts were estimated for 2017, specifying the values for two different time blocks
(different in SIC and SING).
Table 16. Estimation of reserve for secondary frequency control – Year 2017
System SFC (SFC Offpeak) SFC (SFC Peak)
SIC 124 MW 188 MW
SING 112 MW 132 MW
AGC is under implementation, the grid code outlines some technical requirements that the
power plants should meet (so they can be eligible for AGC participation). For instance,
individual units (or power plants as a whole) participating in SFC must have a minimum
ramp-rate higher than 4 MW/min.
4.3.1.3. Voltage Control
According to NTSyCS and ISO reports, Voltage Control can be defined as:
“Set of actions destined to maintain operating voltage within an allowed band”.

© Laborelec www.laborelec.com Restricted LBE04118739 - 3.0 | 88 of 133
Voltage control is carried out by equipment that can inject/absorb reactive power
(generators, reactive compensators, reactors, condensers, converters from RES) and other
voltage control elements like on-load tap changer transformers. As in Europe, RES are
required to provide certain capability curves (PQ diagrams) and to perform voltage control if
required by the TSO.
When making the voltage control, two actions can be distinguished:
Automatic local action through an Automatic Voltage Regulator (AVR), included
local static compensators.
Automatic or manual centralized action to coordinate the control actions of local
regulators.
Remuneration of Voltage Control is regulated in the same way than primary and secondary
frequency control (same study), but taking into account the particularities of reactive power.
Besides power plants, other equipment is used to control (SVC, STATCOM, etc.).
4.3.1.4. Service Recovery Plans (SRP)
According to NTSyCS and ISO reports, Service Recovery Plans can be defined as:
“Set of actions oriented to re-establish the electric supply in a safe, reliable and organized
way, in the shortest time possible, after a total or partial blackout”.
Service Recovery Plans include at least the following services: Black Start, Fast Isolation,
and Synchronization Equipment for synchronization of electric islands. The SIC has an
additional service designed to avoid blackouts in extreme situations: Defense Plan against
Extreme Contingencies.
Remuneration of Service Recovery Plans is regulated through same study than the other
services. Additionally, in case of an event, the real operating cost of Service Recovery Plans
installations must be compensated such as the fuel consumption from an aeroderivative
Gas Turbine used during black-start (e.g. Tocopilla TG3).
4.3.1.5. Load Shedding Schemes
According to NTSyCS and ISO reports, Load Shedding Schemes can be defined as:
“Set of control schemes that release the trip order of a certain switch supplying a load, prior
operation of a local relay or the remote decision of tripping”.
This ancillary service is provided by clients, and its implementation is based on a techno
economical evaluation. Payments are per event and are in function of the ‘short-run failure
cost’.
Load shedding must be carried out only at abnormal conditions of the grid which can cause
stability risks. It also does not represent a control strategy of a certain variable, but a way to
avoid a major damage or problem in the grid.
4.3.1.6. Evolution mechanisms in the regulatory framework for ancillary services
Before Supreme Decree No.130 (DS N°130) enactment, ancillary services were considered
as part of the capacity payment, under the concept of security of service. Half of the security
of service payment was directly related with ramp rates of the power plants and the other

© Laborelec www.laborelec.com Restricted LBE04118739 - 3.0 | 89 of 133
half was related with startup times. Power plants had incentives to improve their operational
parameters, as part of their capacity payments depended on them. The DS N° 130
regulation took out the security component of capacity payments (which started to be
remunerated according Supreme Decree No.62), and eliminated payments associated with
it. Hence, incentives to power plants to improve their operational parameters disappeared.
In order to promote flexibility in the system, it is important to find mechanisms to incorporate
these operational parameters in payments that generators receive.
4.4. Emission limits in Chile for thermal power plants
In Chile, the main legal framework applicable to power plant emissions is the DS N° 13/2011,
also known as the Norma de Emisiones para Centrales Termoeléctricas, the emission
standard for thermal power plants.
As of 2016, all the power plants in the country with a thermal input equal or greater than 50
MWth have to comply with emissions limit values for PM, SO2, NOx and Hg, with the
exception made for cogeneration installations.
The emission limits values are summarized in Table 17 and Table 18. Values are for normal
ambient conditions which are, according to the DS N° 13/2011, ambient temperature of 25°C
and ambient pressure of 1 atm.
Table 17: Emission limit values for power plants built or declared under construction before 2011
Fuel Particle matter
– PM
(mg/Nm3)
Sulfur Dioxide
- SO2
(mg/Nm3)
Nitrogen
Oxides - NOx
(mg/Nm3)
Mercury – Hg
(mg/Nm3)
Solid (6% O2) 50 400 500 0.1
Liquid (15% O2) 30 30 200 -
Gas (15% O2) - - 50 -
Table 18: Emission limit values for power plants built or declared under construction after 2011
Fuel Particle matter
– PM
(mg/Nm3)
Sulfur Dioxide
- SO2
(mg/Nm3)
Nitrogen
Oxides - NOx
(mg/Nm3)
Mercury – Hg
(mg/Nm3)
Solid (6% O2) 30 200 200 0.1
Liquid (15% O2) 30 10 120 -
Gas (15% O2) - - 50 -
The DS N° 13/2011 does not specify the particulate diameter for the PM limit. ELL
understands that the ELVs applies for the total particulate matter emitted into the air.

© Laborelec www.laborelec.com Restricted LBE04118739 - 3.0 | 90 of 133
Emission limit values are applicable 95% of the time in operation11, whatever the load of the
power plant. The 5% of non-compliance are related to start-up and shut down periods (for
OC-, CCGTs and Rankine, emissions level are usually exceeded at start-up and shutdown),
as well as eventual trip of the unit, or malfunctioning of the FGT devices.
At date of publication of this report, there is no ELV at a national level and specific for
thermal power plants for Carbon Monoxide (CO).
Apart from the DS N° 13/2011, it is important to mention that all the power plants in Chile
with a power output equal or greater than 3 MW are subject to a local environmental permit
also known as Resolución de Calificación Ambiental – RCA.
There are examples of power plants, such as the site of Guacolda (Region III), where the
local permit is stricter in term of emissions than the DS N° 13/2011.
Evolution mechanisms related to emissions limits in Chile
In the Figure 51 below ELL represented a timeline of the main regulatory changes related
to power plant emissions in Chile, for the past three decades.
Figure 51: Main changes in the legal framework for power plant emissions in Chile, for the past threethree decades
Before the entry into force of the DS N°13/2011, most of the technologies for emission
abatement for Rankine cycles were de-dust devices, either electrostatic precipitator (ESP)
or fabric filters (FF). For gas turbines, de-NOx devices were in service, either water injection
or Dry Low NOx Burners (DLN) [28].
11 With the exception of NOx ELV for power plant built before 2011: 70% of the time in operation.

© Laborelec www.laborelec.com Restricted LBE04118739 - 3.0 | 91 of 133
When the DS N°13/2011 came into force in 2011, most of the Rankine power plants either
closed (U10 & 11), or retrofitted their flue gas treatment system to comply with the new ELVs
within the deadlines set by the D.S.
At the date of publication of this report, the majority of the Rankine plants are now equipped
with de-dust devices (ESP / FF), de-SOx devices (either wet, semi-wet, seawater or dry).
Besides, the Rankine plants built after 2011 are equipped with SCR for NOx capture.
Most of the OCGTs and CCGTs are equipped with water injection system or DLN.
In 2017, the emission taxation, also known as Impuesto Verde – the green taxation, came
into force. All the power plants with a thermal input equal or greater than 50 MWth have to
pay a tax based on CO2, PM, SO2 and NOx emissions. The first payment of this tax is due
in April 2018 [29].

© Laborelec www.laborelec.com Restricted LBE04118739 - 3.0 | 92 of 133
5. Gap analysis
In this section, ELL develops a gap analysis between the current situation in Chile and the
reference cases taken in Europe. Gaps in the definition of the operational parameters in the
NTSyCS and in the performance of the fleet of thermal assets were identified and are
presented below.
5.1. Gaps in Definitions for Operational Parameters
In this first part, ELL compares the definition of the operational parameters as they are
defined in the NTSyCS, to the definition of the operational proposed in the part 2.1.2 and in
the European, Italian and Belgian grid code.
The major gaps in the definitions are commented below.
Minimum power output (Pmin)
In Chile, the Pmin is defined as the minimum gross active power in which the unit can operate
permanently and deliver power to the grid without introducing disturbances to the system,
at RSC.
This Pmin is only based on the technical capacity of the plant and does not take into account
the ELVs. As of 2017, there is no environmental compliant Pmin (Pmin, env) defined in the
NTSyCS. However and as presented in the part 4.4, the DS N° 13/2011 which governs the
emission limits for thermal power plants clearly states that the ELVs are applicable 95% of
the time in operation12, whatever the load.
The power plants are asked to declare the technical Pmin (Pmin, tech) which, for the case of
OCGTs and CCGTs for example, is not necessarily equal to Pmin, env. This was clearly shown
by DNV GL in [30] for the power plant of Gas Atacama. For Gas Atacama13, at the date of
this report, the Pmin value reported in the database of the CDEC SING was the Pmin, env, and
not the Pmin, tech.
The incompatibility between the DS N° 13/2011 and the NTSyCS for power plants operating
at low load creates confusion on which Pmin shall be declared to the CDECs.
Start-up times
In Chile, the start-up time is defined as the time necessary to transit from standstill to
minimum power (Pmin). In practice, this corresponds to the time between the start request
from the TSO and the moment the power plant reaches Pmin as represented in Figure 52.
Two types of start-ups are defined: cold and hot. A cold start up is a start-up during which
the power plant shall carry out all the thermal processes in order to warm up the boiler and
reach Pmin. This is typically a start-up coming after an overhaul of the unit. Inversely, a hot
start up is defined as a start-up during which all the thermal processes are not necessary to
bring the unit to Pmin (coming typically after a trip).
12 With the exception of NOx ELV for power plant built before 2011: 70% of the time in operation. 13 And based on the information made available in [29].

© Laborelec www.laborelec.com Restricted LBE04118739 - 3.0 | 93 of 133
Figure 52: Definitions of start-up processes for a Rankine cycle: According to ELL (green) and according to the NTSyCS (pink)
Gap 1:
The NTSyCS does not foresee a warm start-up, which would better represent a start-up
coming just after a weekend shutdown.
As presented in 2.1.2 and 3.3, a definition based on the previous downtime is preferred
convention for ELL since it enables to define more start-ups depending of the physical state
of the unit. Some manufacturers also define different types of start-up depending on the
temperature of the tubes of the boiler. Lastly, some power utilities use start-up curves as a
function of the shutdown time, such as the one in Figure 53.
Figure 53: Example of a start-up curve for a CCGT

© Laborelec www.laborelec.com Restricted LBE04118739 - 3.0 | 94 of 133
Gap 2:
The preparation time can change a lot depending on the operational state of the power plant
at the start request. As a reminder, Figure 16 is re-presented below:
Figure 54: Typical preparation times for a CCGT. Preparation times vary from a few dozen of minutes for a hot start-up with the vacuum kept in the condenser to more than 10 hours for a cold start-up,
after an overhaul of the boiler (i.e. boiler dry)
In particular, if the boiler of the unit is dry, which is typically the case after an overhaul of the
boiler, the preparation time can exceed 12 hours. Inversely, if the boiler is already filled, and
if the vacuum was kept in the condenser, the preparation time can last, for the same plant,
a few dozen of minutes only (between 10 and 30 min).
The operational state of the power plant at (t = 0) is not mentioned in the NTSyCS. Therefore,
it is up to the power plants to include or not the filling process of the boiler, and/or the creation
of the vacuum in the condenser, which strongly impact in the end the total start-up time. This
is probably the reason of the high spread in the cold start-up times that one can observe in
Chile, in particular for the Rankine cycles (see Figure 58).
Ramp rate, minimum uptime and downtime
These three operational parameters have not been formally defined in a technical annex of
the NTSyCS. However they are declared by each of the units to the CDECs [31].
5.2. Gaps in the grid organization, energy and ancillary markets
This section provides a comparison between Belgium, Italy and Chile, with the main
highlights.
Grid infrastructure
This section compares the three countries for the power grid infrastructures. The latter can
be considered as specificities that cannot be changed at short term, since they are linked to
investments.

© Laborelec www.laborelec.com Restricted LBE04118739 - 3.0 | 95 of 133
Table 19. Grid infrastructure comparison
Belgium Italy Chile TSO Single TSO: ELIA Single TSO: TERNA Two main grids: SIC &
SING (connection in progress). Two TSOs.
Grid configuration
Meshed grid Antenna grid with 6 zones (reflecting transmission
bottlenecks)
Large extension, barely meshed and some
bottlenecks.
International connections
Large cross-border capacities with shared
ancillary services
Limited cross-border capacity without sharing of
ancillary services (excepted PFC)
Almost no cross-border capacity. “Stand alone”
grids.
Market coupling Fully coupled with MRC Yes, partly coupled with MRC
Not applicable
Electricity price Most of the time the same as NL, FR and DE unless the international lines are
saturated.
Different prices with border countries and even
between national “zones”, due to the saturation of the
capacity.
Different between border countries and 2 grids.
Merit order – most expensive
generator (Low/High
residual demand)
Nuclear + hydro / CCGT (old)
CCGT and Cogen / CCGT (old)
SIC: Coal + Hydro / Hydro + CCGTs (+OCGTs) SING: Coal + CCGT /
CCGT + Engines
Installed power 19 GW 102 GW SING: 5.5 GW SIC: 17.2 GW Total: 22.7 GW
Peak load ~13 GW ~54 GW SING: 2.4 GW SIC: 7.5 GW Total: 9.9 GW
Wind and solar capacity (%
installed capacity)
10% w/o decentralized solar PV
25% w/ decentralized solar PV
13% SING: 10%; SIC: 13%
Mainly due to the shape of the country and the presence of islands, the Italian grid shows
more bottlenecks than in Belgium and less international connections. This is reflected in the
price differences not only between Italy and the surrounding countries but also between the
different zones in Italy.
The situation in Chile is even more complicated than Italy due to the very extended shape
of the country. It explains the existence of 2 separate grids which are currently being
connected. In addition, grids are almost stand-alone as the cross-border are almost
inexistent. This is a major difference with Italy and Belgium which are part of the large
European synchronous area and explains the larger reserve needed for the ancillary
services.
The penetration of non dispatchable RES (wind and solar) is similar in the 3 compared
countries when considering large scale plants (10-13%). However, it is significantly higher
in Belgium when considering the rooftop PV (25%).
Belgium is a small country with strong international exchanges and pumped hydro capacity.
Hence this gives more flexibility for the grid management and should be taken into
consideration in the comparisons with Italy and Chile.

© Laborelec www.laborelec.com Restricted LBE04118739 - 3.0 | 96 of 133
Energy market organization
This section compares the organization of the energy market in the different countries.
These market rules could possibly change on a short period of time but strongly depend on
the political / conceptual choices of the countries.
The organization of the energy market is also strongly influenced by the “power balance”
between the TSO and producers, congestion in some areas and the strength of the
interconnections.
Table 20. Energy market comparison
Belgium Italy Chile TSO – producers “power balance”
More balanced power between TSO and ARPs
Strong TSO position wrt producers
Very strong TSO position wrt producers (central
dispatching) Dispatching Market until few minutes
before delivery. High responsibility for “ARPs”.
Market up to 1-2h before delivery. TSO takes the
lead afterwards.
Centralized dispatching
Imbalance responsibility
ARPs are in charge of the balancing of their “pool” of
plants
Each asset has to follow its scheduled load curve
Each asset has to follow its scheduled load curve
Energy payments Bid mechanism and “pay-as-cleared” price (Day Ahead and Intraday).
Close to marginal cost but no obligation.
Bid mechanism and “pay-as-cleared” price (Day Ahead and Intraday).
Close to marginal cost but no obligation.
Audited cost mechanism and “pay-as-cleared” price.
Merit order based on marginal costs (to be
justified). Capacity payment Not for “standard” energy
supply. See next section for
ancillaries.
Not for “standard” energy supply.
See next section for ancillaries.
New rules in discussion.
Yes, for all plants based on system adequacy
(independently of ancillary services)
Imbalance penalties
TSO provides incentives if the imbalance
compensates international imbalances (ACE).
Consequence: ARPs try to anticipate trend.
Imbalances are always penalized. Amount
depends on international imbalances. Consequence:
all plants try to follow the load curve.
Non existent
Preventive system security action of TSO
“Strategic Reserve”. Not activated so far.
“Essential plants”. Regular activation where the
interconnections are weak.
Inherent to centralized dispatching
Following the different liberalisation directives, Europe made the choice of a deregulated
energy market with minimum intervention from the TSO for the dispatching (except Poland).
This strongly differs from Chile and its centralized dispatching.
Even though Belgium and Italy have to comply with the same European Directives, major
differences exist in the organization of the electricity market:
Generally speaking, the obligations are given for a pool of plants (ARPs) in Belgium
and individual plants in Italy
Exchanges on the Intraday market (between ARPs) are allowed up to the last
moment in Belgium whereas the TSO takes the lead in the last 1-2 hours in Italy.
Incentives are given in Belgium to support the grid for the cross-border balancing.
This tends to optimize the production costs but makes the evolution of the
imbalance more volatile on a day. TSOs tend to increase the volume of inter-TSO
exchanges to decrease the costs and volatility. In Italy, the plants follow their load
curves as much as possible due to the large penalties on imbalance.

© Laborelec www.laborelec.com Restricted LBE04118739 - 3.0 | 97 of 133
In Chile, the dispatching is managed by a central authority which imposes the load set point
to the individual power plants. Cross-border exchanges are almost inexistent for Chile.
The remuneration of the energy supply is managed by the market in Europe and a
centralized authority in Chile but both organizations result in a payment close to the marginal
costs, with the major difference that the plant costs are audited in Chile. The energy price is
supposed to include the costs related to the investment in Europe but this under pressure
due to the overcapacity.
Capacity payments are not easy to implement in Europe as they could bias the market.
There are currently no capacity payments in Italy but a new system is being implemented
(see section 2.3.7). In Belgium, a kind of capacity payment is foreseen for the Strategic
Reserve. Such mechanisms have to be approved by the European Commission.
In Chile, the capacity payments are a cornerstone of the system as they cover the
investment costs of the plant operators. They are provided based on the “system adequacy”,
which currently does not give many incentives for performance improvements.
Ancillary services
This section compares the organization of the ancillary services in the different countries.
They are particularly important to provide flexibility to the system.
Table 21. Ancillary services comparison
Belgium Italy Chile PFC (R1) Applicable to selected
plants. International bids
accepted.
Applicable to all plants. International bids not
accepted.
Applicable to selected plants. SIC: One near zero
droop unit (pilot unit) + other low droop plants (~3%). SING: Selected
units operate at a derated power (7%).
PFC volume definition
3000 MW for European synchronous area. Shared between countries based on energy generation (ENTSO-e).
Defined annually by CEDEC
PFC reserve14 73 MW (0.6% peak) 520 MW (1.0% peak) SING: 140 MW (5.8% peak)
SIC: 278 MW (3.7% peak) On-line PFC
testing As from 2017 Already applied No
SFC (R2) Applicable to selected ARP (pool of plants).
Applicable to selected individual plants.
Applicable to selected units. SIC: Together with R1 by pilot unit + manual
redispatch. SING: Manually carried out.
SFC reserve 140 MW (1.1% peak) 800 MW (1.5% peak) SING: 132 MW (5.5% peak)
SIC: 188 MW (2.5% peak) TFC (R3) 15’ start-up time.
Based on “true” costs. For thermal plant:
contractual start-up time (max 120’).
Based on “willingness to be called” bid.
Part of central dispatching management.
TFC reserve 1000 MW (7.7% peak) 3500 MW (6.5% peak) TFC used by CDEC but not declared in the norm
Reactive power Paid Mandatory and not paid Paid
14 % defined as a percentage of peak load

© Laborelec www.laborelec.com Restricted LBE04118739 - 3.0 | 98 of 133
Other services Strategic Reserve, black start
Black start, Essential Plants
Service Recovery Plan (including black start),
Load Shedding Schemes
Selection for the service
Based on a bid process Optional participation
Based on a bid process Obligation to bid the
available reserve
Based on central dispatch scheme
Need for verification by third party entity
Capacity payment
On all ancillary services (including R1, R2 and R3) and for strategic reserve.
Only for essential plants (compensated for “extra
costs” to be justified)
No capacity payments, but a compensation for the extra costs to provide
ancillary services (based on a study of costs).
Supervision & Penalties
ELIA verifies the non-compliance of power plants in terms of availability and
activation of ancillary services. Specific penalties
defined by ELIA apply to each ancillary service
TERNA verifies the performance of power
plants with respect to their frequency-control model. Penalties apply for any
deviation from the model.
ISO verifies the performance of power
plants according to grid code
No specific penalties defined for ancillary
services
Notified Body certification
No. But qualification to ELIA is required.
Yes for R1 and R2 No
Ancillary responsibility
ARP are responsible for delivering the service.
Obligations can be transferred to counterparts.
Plants are responsible for delivering the service. Obligations may not be
transferred.
Plants are responsible for delivering the service. Obligations may not be
transferred.
Participation of the DSM
Yes for all services. No No
Participation of the RES
No No Yes
International contracts
Yes, for R1. Discussions on-going for R2.
Discussions on-going for R1 and R2.
No
Ex-ante / ex-post mechanisms
Both applied by TSO Both applied by TSO Yes. Part of centralized dispatching
Even though Belgium and Italy have to comply with the same European Directives, major
differences exist in the organization of the ancillary services:
No capacity payment for the availability of ancillary services in Italy, whereas it is
applicable to all services in Belgium. A new system is being implemented in Italy
though.
Participation of all plants for the PFC in Italy
Obligations attributed to the ARP in Belgium (pool of plants) and individual plant
requirements in Italy
Start-up time is less important for the thermal plants participating to TFC in Italy
(thanks to the pump-storage hydro capacity)
Stricter verification of the plant performances in Italy (notified bodies)
Participation of DSM to the ancillary services in Belgium, not yet in Italy
In the context of the centralized dispatching in Chile, the contractualization of the ancillary
services between the TSO and plant operators is not as necessary as in Europe where a
similar situation used to exist before the liberalisation.
In addition, the total reserve for PFC and SFC is much higher in relative terms than in Europe
due to the smaller size of the grids (higher relative importance of the large units) and the
“stand-alone” situation (vs large synchronous area).
Other points of interest in Chile are listed hereunder:

© Laborelec www.laborelec.com Restricted LBE04118739 - 3.0 | 99 of 133
No bid market for ancillary services and no specific capacity payment: the selection
is made by the central authority based on a techno-economical choice
VFR approach is different in SIC and SING: like Belgium for SIC (selected units)
and like Italy for SING (de-rating on all thermal units)
No on-line testing of the PFC
Requirements are imposed at individual plants level (as for Italy)
Tertiary reserve is part of the central dispatching management (not a specific
“requirement”)
No participation of DSM but participation of the RES.
5.3. Gaps in the operational parameters of thermal power plants
In this section, ELL compares the start-up time, the ramp rate, the relative turndown, the
minimum uptime and downtime of the thermal assets in Chile to the P10, P50 and P90 of
the fleet of thermal assets taken in Europe and presented in the part 3.4.
As a reminder, P10, P50 and P90 are defined in the figure below:
Figure 55: Definition of P10, P50 and P90
Most of the numbers related to Chile come from the database of the CDECs, and information
provided by GIZ.
It is important to mention that the operational parameters which are compared in the
benchmark are according to the definition in 2.1.2 for the fleet in Europe, and
according to the NTSyCS for the fleet in Chile which are not always identical.
ELL estimates that the gaps due to differences in the definitions are negligible, with
the exception of the start-up times.
In the gap analysis, only the cold start-up times are compared for Rankine cycles and
CCGTs. In reality, this parameter does not reflect their real ability to participate in the
ancillaries services (mainly TFC). Hot or warm start-up time would have been more relevant
for flexibility, but the cold start-up times were the only start-up times published in the
databases of the SIC and the SING.

© Laborelec www.laborelec.com Restricted LBE04118739 - 3.0 | 100 of 133
Rankine cycles
All the Rankine cycles are subcritical units in Chile. For comparison, ELL used the
performance benchmark values of the European fleet of Rankine cycles without the USC
units.
5.3.1.1. Relative turndown
Figure 56: Rankine cycles – Benchmark on turndown
For the case of the Rankine cycles in Chile, and excluding the plants of Laguna Verde U1
and U215, relative turndowns range between 60.5% (P90) and 36.7% (P10), with a median
value (P50) of 46.7%.
With more than half of the fleet with relative turndown lower than 50%, Rankine cycle units
in Chile are found to be average. Top performers in Chile (Laguna 1 & 2 excluded) are the
units of Guacolda with a turndown of 60%. These units are subject to cycling operation due
to the relatively high penetration of renewables in the region. It is interesting to mention that
according to the experts of STEAG who conducted an audit of the Pmin on Guacolda 1 to 4,
the technical minimum were found “unusually high” [32].
The fleet of Rankine units taken in Europe is not much flexible neither. A high spread in
turndown values is observed between the base load units (P10) and the cycling units (P90).
For example, the turndown of base load power plants is between 42 and 46% only, but a
value of 65% or more is reached for cycling units.
Relative turndown between 50 to 60% are common values in literature for existing pulverized
coal boilers, depending on the type and generation, and the type of fuel [5], [33], [34]. As
mentioned before in this report, it is generally admitted that Pmin can be reduced up to reach
70 to 80% of relative turndown by switching off some burners and coal mills. Depending on
the cases, this can require some changes on mill and burner design, or operating ranges.
15 Laguna Verde U1 and U2 are (extremely) old PC boilers retrofitted to diesel / fuel oil combustion and dedicated to cold reserve.

© Laborelec www.laborelec.com Restricted LBE04118739 - 3.0 | 101 of 133
New and flexible boiler design can reach turndown higher than 80%, in particular if the power
plant can run in single-mill operation [5].
5.3.1.2. Ramp rate
Figure 57 : Rankine cycles – Benchmark on ramp rate
With a P50 of 1.84% Pmax/min, the median ramp rate in Chile is in the range of the value
found in the technical literature [33]. A relatively high spread is observed between best (and
cycling) units and worst performers (4 MW/min or 2.63% Pmax/min for Guacolda 4 to compare
to 0.75 MW/min or 0.47% Pmax/min for CTTAR).
In Chile, top performers for relative ramp rate are the smallest units (Tocopilla U12 and U13).
In absolute values, load ramps for these units are equivalent to the plant of Guacolda 3, 4
and 5 (2.6 % Pmax/min or 5 MW/min), but the smaller Pmax of U12 and 13 make their relative
ramp rate higher.
According to technical literature, such as [5] load ramps for conventional subcritical PC
boilers typically range between 2 and 5% Pmax/min. However in practice, ramp rates in the
ranges of 1.8 – 2% Pmax/min are more common for boilers with a capacity of 180 to 300 MW,
which are typically the PC boilers installed in Chile [33].
For the fleet of Rankine cycles in Europe, ramp rates are lower than ones mentioned in the
literature. It is interesting to mention that in the same way as turndown, the ramp rate of the
cycling units (typically 2.9% Pmax/min or 10MW/min) is much higher than for base load units
(0.64 % Pmax/min or 3MW/min).

© Laborelec www.laborelec.com Restricted LBE04118739 - 3.0 | 102 of 133
5.3.1.3. Cold start-up time
Figure 58: Rankine cycles – Benchmark on warm - cold start-up time
The cold start-up time varies from a factor of one to four across the fleet of Rankine cycles
units in Chile. As ELL previously mentioned, this could be due to the lack of precision in the
definition of the start-up process, regarding the state of the power plant at the start up
request.
According to technical literature [35], [34], [32], it takes roughly between 8 and 12 hours to
start-up a Rankine unit in cold conditions (from the notification to start to the Pmin, with the
assumption that there are little preparation works to perform on the boiler and on the
condenser). Most of units in Chile have considerable higher start-up times.
European fleet values are clearly lower, however the definition of start-up time is not the
same and this affects the direct comparability of the units.

© Laborelec www.laborelec.com Restricted LBE04118739 - 3.0 | 103 of 133
Minimum uptime
The minimum uptime of Rankine cycles ranges between 6:30 for the most recent unit
(Cochrane 1 and 2, commissioned in 2015) and up to 5 days for older installations (namely
CTM1 and 2, and Santa Maria) which are found much longer than the fleet in Europe. As a
comparison, minimum uptime in Europe typically ranges between 5 and 12 hours, but almost
never exceeds one day.
As mentioned in 5.1.3, there is no formal definition of the minimum uptime in the NTSyCS.
Besides, there is no technical limitation which justify a minimum time in operation. Minimum
uptime results from other reasons, contractual or strategical for example [31].

© Laborelec www.laborelec.com Restricted LBE04118739 - 3.0 | 104 of 133
Minimum downtime
The minimum downtime of Rankine cycles in Chile ranges between one and two days. This
is found much longer than for the fleet in Europe, where minimum downtimes are in the
range of 2 to 6 hours.
Just like minimum uptime, there is no formal definition of the minimum downtime in the
NTSyCS. As mentioned in 3.3.1, there are technical limitations which can limit the minimum
downtime for Rankine cycle, but rarely for more than a few hours.
CCGTs
Only the performance in 1+1configuration (i.e. 1 GT + 1 ST, also noted 1 GT + 0.5 TV in
CDEC SING – for Kelar and Gas Atacama) are considered in the benchmark. However,
these might not be fully be representative of the real performance of the units.

© Laborelec www.laborelec.com Restricted LBE04118739 - 3.0 | 105 of 133
5.3.4.1. Relative turndown
Figure 59: CCGTs – Benchmark on turndown
In Chile the top performer of the fleet is the unit U16, where an upgrade of the turbine has
recently been installed to enhance the load flexibility (so-known low park load mode, specific
to the GT26 gas turbine). With more than half of the fleet with relative turndown lower than
40%, and with the exception of the U16, the fleet of CCGTs in Chile is not found load flexible.
For CCGTs, turndown typically ranges around 60%. According to ELL, relative turndown
values lower than 40% are typically low for CCGTs, even for old units and even more for a
country where there is no restriction on CO emissions (see part 5.4).
It is important to mention that in the Figure 59, nearly all the CCGTs in Europe made efforts
the last years to reduce Pmin / increase Pmax and enhance the load flexibility.
Note that the Pmin tests performed during the audit of Gas Atacama showed that the relative
turndown of the site could be increased from about 20% to 45.3% while still complying with
emission limits (represented as CC*16 in Figure 59).
16 CC* turndown is calculated with the environmental compliant Pmin_env observed by DNV GL with natural gas

© Laborelec www.laborelec.com Restricted LBE04118739 - 3.0 | 106 of 133
5.3.4.2. Ramp rate
Figure 60: CCGTs - Benchmark on ramp rate
Load ramps in Chile are found conservative in comparison to technical literature and the
ramps of the CCGTs in Europe, where efforts were made to increase the ramps (see Figure
45 for example).
For CCGTs, technical literature says that ramp rates are typically in the range of 15 to 25
MW/min [35]. This range of load ramps is rather consistent with the values observed for the
CCGTs in Europe. In Chile, P10 for ramp rates only reaches 3.8 MW/min and the median
value, 10 MW/min.

© Laborelec www.laborelec.com Restricted LBE04118739 - 3.0 | 107 of 133
5.3.4.3. Cold start-up time
Figure 61: CCGTs - Benchmark on cold start-up time
CCGTs in Chile and in Europe have comparable cold start up times. As mentioned before,
not all units have optimized their start up time, probably due to the lack of incentives. Not all
the CCGTs in Europe do not always have incentives to reduce the cold start-up times, which
explains according to ELL the big gap between P10 and P90.
This would mean there is important room for improvement regarding the start-up times of
the worst performers in both, Chilean and European fleet.
For CCGTs, cold start-up time typically takes 4 hours or less [30]. The start-up time is a
flexibility lever that can be improved rather easily with low-to-moderate CAPEX initiatives.
For example, a CCGT in Italy has successfully managed to reduce the cold start-up time
from 3:20 to about 2:10 with a deep revision of the start-up procedures, challenge of the
ramp rates defined by the OEM and increasing the automation of the start-up, among others.

© Laborelec www.laborelec.com Restricted LBE04118739 - 3.0 | 108 of 133
Minimum uptime
Figure 62: CCGTs - Benchmark on minimum uptime
The minimum uptime for the combined cycles range between a few dozens of minutes for
Kelar (recently commissioned), and a day or more for CTM3, San Isidro 1 and Nueva Renca.
The values of the minimum uptime before (CC1 and CC2) and after the audit of Gas
Atacama (CC*) are mentioned in Figure 62.
This is found by ELL rather high. As a comparison, minimum uptime typically ranges
between 0 (P10) and 10 hours (P90) for the fleet of CCGTs in Europe. This is confirmed by
[30] where minimum uptimes between 1 and 2 hours are said to be common practice.
As mentioned in 3.3.2 and 5.1.3, and just like Rankine cycles, there is no formal definition
of the minimum uptime in the NTSyCS, and there is no real technical limitation which justifies
a minimum uptime. This parameter is more commonly established based on contractual
reasons (maintenance agreement for ex.) or based on the operation strategy, among others.
The minimum uptime for Nueva Renca Nehuenco 1 and 2 and San Isidro 1 were
provided by GIZ. They are not published on the website of the CDEC-SIC, so ELL could
not cross check these values.

© Laborelec www.laborelec.com Restricted LBE04118739 - 3.0 | 109 of 133
Minimum downtime
Figure 63: CCGTs – Benchmark on minimum downtime
The minimum downtime for CCGTs is between 2:15 for Kelar and up to 8 hours for
Nehuenco 1 and 2 and Nueva Renca. The values of the minimum downtime before (CC1
and CC2) and after the audit of Gas Atacama (CC*) are both mentioned in the figure above.
Present minimum downtimes for the CCGTs in Chile are found in the range of the values
observed in Europe which are typically between 0 and 8 hours. [30] mentions minimum
downtime between 1 and 2 hours.
Just like for the Rankine cycles, there is no formal definition of the minimum downtime in the
NTSyCS. As mentioned in 3.3.2, there are technical limitations which can limit the minimum
downtime for CCGTs, but not more than a few hours.
The minimum downtime for Nueva Renca, Nehuenco 1 and 2 were provided by GIZ.
They are not published on the website of the CDEC-SIC, so ELL could not cross check
these values.

© Laborelec www.laborelec.com Restricted LBE04118739 - 3.0 | 110 of 133
OCGTs
5.3.7.1. Relative turndown
Figure 64: OCGTs - Benchmark on relative turndown
It is difficult to make a fair comparison for the Pmin of an OCGT since is strongly impacted by
the technology of the turbine and by the possible successive upgrades installed in the
turbine (compressor, combustion hardware, among others).
Since the main limitations for the turndown of an OCGT are the emissions of CO and NOx,
environmental limits strongly affect the turndown. In Chile the Pmin declared shall be the
technical Pmin, but it was observed that some units were declaring the environmental Pmin to
remain compliant with the emission limit values at any load, resulting in lower turndown.
In some cases, declaring the real technical Pmin would increase the turndown of Chilean
units.
To explain this situation, in Figure 64 ELL compared the environmental Pmin for a standard
GE 9E unit (environmental Pmin declared by Gas Atacama in OC is used as benchmark).
The Pmin declared for the same type of unit ranges between 60% to less than 40%.

© Laborelec www.laborelec.com Restricted LBE04118739 - 3.0 | 111 of 133
5.3.7.2. Ramp rate
Figure 65: OCGTs - Benchmark on ramp rates
In Chile, with the exception of the sites of Yungay and Cardones, ramp rates are equal to or
below 10 MW/min. A third of the fleet including some aero derivative GTs, has ramp rates
equal to or below 5 MW/min.
In our experience, these values are found to be quite conservative. This impression was
confirmed after reviewing some datasheets communicated by the OEMs:
■ For aero derivative GTs, ramp rates are typically around 30 MW/min for GE LM2500
[36], and around 50 MW/min for GE LM6000 PC [37].
■ For heavy duty GTs, the ramp rate of a 9E.04 is normally around 16 MW/min [38].
Besides, ELL also knows a SIEMENS V94.2 used in OC in Europe with a ramp rate in
the range of 11 MW/min.

© Laborelec www.laborelec.com Restricted LBE04118739 - 3.0 | 112 of 133
5.3.7.3. Start-up time
Figure 66: OCGTs - Benchmark on start-up time
In Chile, three quarters of the fleet of OCGTs declare start-up time equal to or below 15
minutes. The last quarter of the fleet have start-up times above 30 minutes, and even above
1 hour for the worst performers.
Significant differences in start-up times are also observed for a same technology. For
example, for the GE 9E, the start-up times declared to the CDEC range between 12 minutes
to 1 hour.
In our experience, the start-up time for the last quarter of the fleet is high, all the OCGTs
shall be capable to start-up within 30 minutes or less, with (eventual) limited efforts.
Differences in start-up times for a same technology can be explained by different strategy
of operation (shorter start-up times usually require more maintenance).
For comparison:
■ In Belgium, both heavy duty and aero derivatives GTs participate in R3 reserve, which
consist in being capable to start up at any time and in a maximum of 15 minutes
(represented with a grey line on Figure 66)
■ According to the datasheets for GE 9E.03 / .04 [38], start-up time for conventional use
is in the range of 30 minutes, and 10 minutes only for peaking use (represented in
purple on Figure 66)

© Laborelec www.laborelec.com Restricted LBE04118739 - 3.0 | 113 of 133
5.3.7.4. Minimum uptime
Figure 67: OCGTs – Benchmark on minimum uptime
In Chile, minimum uptimes for OCGTs are between 0 hours (i.e. no minimum uptime) and
four to five hours for some units. Significant differences in minimum uptime are observed for
a same technology: Candelaria 1 and 2, and Los Guindos are three GE 9E, but the minimum
up time varies from 0 hours (i.e. no minimum uptime) to 4 hours.
5.3.7.5. Minimum downtime
Figure 68: OCGTs – Benchmark on minimum downtime

© Laborelec www.laborelec.com Restricted LBE04118739 - 3.0 | 114 of 133
In Chile, the minimum downtime for OCGTs is between 0 hours (i.e. no minimum downtime)
and 1:15. For the fleet of GE 9E configured in OCGT, the minimum downtime varies between
20 minutes and one hour.
5.4. Gaps in emission regulations
In the part 3.3, ELL showed that emission limits are not a technical limitation to enhance the
operational flexibility of Rankine cycles. Inversely, CO and NOx emission limits play a key
role on the definition on the Pmax and Pmin of OCGTs and CCGTs. This is why in this section,
a focus is made on the OCGTs and CCGTs, and the NOx and CO ELVs only.
First, a benchmark is made between the ELVs of the DS N°13/2011 together with the P10,
P50 and P90 of the ELVs from the environmental permits of a representative fleet of gas
fired OC- and CCGTs in Europe, as well as the ELVs set in the IE-D.
Then, a comparison of the application of these different ELVs is made.
The benchmark of the ELVs for OC- and CCGTs is only possible for installation firing
gas, because diesel is not fired in the fleet in Europe used for the comparison.
Limit values
In the Table 22, the ELVs of the DS N°13/2011 for gas fired OC- and CCGTs (built before
and after 2011) are compared to the IE-D for existing and new built OC- and CCGTs, as well
as to the P10, P50 and P90 of the ELVs in the environmental permits in Europe presented
in Table 9.
All the values are corrected in normalized ambient conditions and O2 content. The ELVs
mentioned for the environmental permits in Europe are the maximum average concentration
allowed on a daily basis.
Table 22: Benchmark of ELVs of NOx and CO, for OCGTs and CCGTs in normalized ambient conditions and O2 content (15%)
mg/Nm³ OCGT
P10 P50 P90 IED DS13
NOx 33 50 75 50 50
CO 29 92.5 100 100 -
Two comments can be made with this table:
■ The ELV for NOx of the DS N°13/2011 is equivalent to the value of the IE-D, and to the
P50 of the daylily ELVs imposed in the afore-mentioned environmental permits. This
remark applies both for OC- and CCGTs.
■ There is no limit on CO emission in Chile.
mg/Nm³ CCGT
P10 P50 P90 IED DS13
NOx 41 50 93 50 50
CO 53 100 100 100 -

© Laborelec www.laborelec.com Restricted LBE04118739 - 3.0 | 115 of 133
Application
In Chile, the NOx-ELV is applicable whatever the load. However, as presented in 4.4, new
power plants can exceed the NOx-ELV during a maximum of 5% of the time of operation
and existing power plant (built before 2011), 30% of the of the time of operation. The DS
N°13/2011 associates these non-compliance threshold to the start-up and shutdown times,
and eventual trips of the unit.
Besides, existing (i.e. built before 2011) OC- and CCGTs which operate less than 10% of
the year, or with a thermal input between 50 MW th and 150MWth are exempt from the NOx
ELV.
In Europe, the ELVs of the IE-D are only applicable in normal conditions of operation, which
do not include the start-up and shutdown nor the operation below 70% of the load. That
said and as mentioned in 3.3.4, nearly all the local environmental permits put restriction on
the emissions during the start-up and shutdown, or at part load which can be less strict than
the ELVs at base or near base load (for ex. NOx and CO ELVs = Base Load ELVs x 2).

© Laborelec www.laborelec.com Restricted LBE04118739 - 3.0 | 116 of 133
6. Proposed Roadmap for the future
The previous sections presented the differences between Chile and two European countries
(Belgium and Italy) on the following:
- Organization of the power system, with a focus on the ancillary services
- Technical performances of the power plants with a focus on flexibility
Based on the gap analysis, this section highlights several proposals identified by ELL in
order to improve the flexibility of the power system in Chile. These recommendations are
based on a high-level evaluation and do not aim at integrating all plant and grid code
specificities. Each measure should be analysed in details with the stakeholders to verify its
applicability to the Chilean context. The ambition of this section is to feed the discussion on
the future of the power system based on the return of experience (pros and cons) in
European countries.
Lastly, some recommendations in this section may already be evaluated or are a part of the
action plan of the different stakeholders in Chile (TSO, government). ELL approach was to
mention all the measures which were judged relevant as a result of the gap analysis
performed in this study.
ELL understands that changing the remuneration for the ancillary services is a considerable
change in the financing scheme of the power plants. In addition, the current power system
in Chile is organized around a centralized dispatching which is very different from Europe.
Hence, the roadmap makes a difference between the following cases:
- Measures which could be taken with the current organization of the ancillary services
(no market)
- Measures applicable if an ancillary service market is put in place
- Measures applicable if an energy market (decentralized dispatching) is put in place
6.1. Measures which could be taken with the current organization
of the ancillary services (no market)
I/ Improve verification of plant performances
In the current system, power plants have to be very transparent towards the TSO regarding
their technical performances (unlike in Europe). ELL considers that the verification of the
performances announced by the plants could be improved with the following measures:
- Improve the definition of the technical parameters requested to the plants17
The definition of the plant technical parameters should be clearer for some of them,
as there is currently a room for interpretation. In ELL’s opinion, the technical
definitions to be reviewed are, among others, the following:
17 These measures may not be required if enough incentives are given to the plants for improving their performances (see item VI/ hereunder).

© Laborelec www.laborelec.com Restricted LBE04118739 - 3.0 | 117 of 133
o The minimum power output Pmin. As of today, the Pmin declared by the power
plants to the CDECs is not always the Pmin as defined in the NTSyCS (i.e.
Pmin_tech). If they were asked to operate at Pmin_tech rather than Pmin_env,
OCGTs and CCGTs would not always comply with the emission limits of the
DS13.
o The start-up times. The trigger for the beginning of a start-up is not clear in
the definition of the NTSyCS. According to ELL, the “request to start” from
the TSO is the recommended trigger for the beginning of the start-up time.
The state of the power plant at the start request is not clear neither and could
strongly impact the preparation time (e.g. vacuum kept or not). Besides,
there are only two definitions of start-up (hot/cold). With:
More types of start-ups in the definitions or by using a start-up
curve for each units,
A clarification of the trigger,
The CDECs would have a better view on the necessary time for each plant
to start up after a short downtime, such as a weekend for example.
o The ramp rates. A clear definition of the ramp rate is not available in the
NTSyCS. A distinction can be made for standard ramp rates and maximum
ramp rates:
The standard ramp rate covers the whole operational range of the
unit, from Pmin to Pmax. It should be an average value and take into
account possible limitations close to some load set points, such as
Pmin or, Pmax. This ramp rate typically reflects the response of a unit
to load changes requested by the TSO.
The maximum ramp rates for specific operational ranges. This
ramp rate better represents the capability of a unit to provide PFC
and SFC.
o The minimum downtime and uptime. A clear definition of the minimum
downtime and uptime are not available in the NTSyCS.
- Implement on-line remote testing for PFC
The on-line testing of PFC-VFR (simulation of a frequency deviation) is already
applicable in Italy and is being implemented in Belgium. Since the spinning reserve
was identified as a possible weak point in the power system for large integration of
RES [13], it seems particularly relevant to verify regularly the real plant capabilities.
- Implement performance tests by an independent party
In the current system, regular performance tests are requested to the plants to
demonstrate Pmax. These tests could be extended to other technical performances
which are critical for the support to the grid: Pmin, start-up times, ramp rates, minimum
up and downtimes. The verification could be carried out with audits or with specific
performance tests executed by independent parties. In a central dispatch system,
plants may be tempted to declare a Pmin higher than reality as they could benefit from
additional revenues (higher energy generation).

© Laborelec www.laborelec.com Restricted LBE04118739 - 3.0 | 118 of 133
The costs of such tests / audits should not be underestimated. Hence, ELL
recommends to focus on the criteria which are the most relevant for the stability of
the power system in Chilean’s context.
The requirements could be imposed at a “high level” to verify that the contractual
clauses are verified (e.g.: provide the SFC reserve within 30”) on a pass/fail basis
without entering into the technical details (e.g.: ramp rate exact values). This
recommendation is linked to the definition of clear products (see II/). Clear guidelines
should also be defined for the tests.
- Use a model for the verification of the plants response
In Italy, the plants shall provide a model of the expected response for PFC. Deviations
with respect to the model have to be justified and can ultimately be penalized. This
measure provides more predictability of the plant behaviour to the TSO but imposes
significant constraints to the plant owners. The need of such measure in Chile should
be evaluated with care.
II/ Package the requirements for the ancillary services in products
ELL recommends the definition of clear “products” for the supply of ancillary services. This
would clarify the requirements imposed to the plants providing those services and simplify
the comparison between the different suppliers. Specific products could also be defined to
enlarge the participation to different kind of plants and increase the competition if a market
is put in place (see V/).
- Package the ancillary services in clear products with standard contracts
Standard products for PFC, SFC and TFC (e.g.: supply the reserve in xx sec,
asymmetric participation) enable a transparent comparison between the different
actors in order to select the cheapest or most efficient ones (merit order on capacity
fee for selection, merit order on energy for activation). In Belgium, the “General
Frameworks” are published on the website of the TSO (ELIA).
Since the liberalisation of the market, the type of products for the PFC was diversified
in Belgium to include the participation of different type of power plants, including
nuclear plants (with different remuneration). This was a way to increase the
competition and decrease the costs.
The products should be defined in line with the needs of the power system (e.g.:
required gradients, start-up times).
In Chile, specific “products” could be set for coal plants (vs CCGT plants), in line with
their technical limitations. The remuneration would be less than for more flexible
products.
- Diversify the participants to the ancillary services
RES and DSM should be included in the standard products as much as possible. In
some cases, DSM can be cheaper than the activation of the cold reserve.
- Allow asymmetric participation for SFC
III/ Improve speed and accuracy of the grid and ancillary services management
- Prediction model for RES supply

© Laborelec www.laborelec.com Restricted LBE04118739 - 3.0 | 119 of 133
The accuracy of the predictions of RES production is of utmost importance to
anticipate the variation of the residual demand and mitigate the effects on the thermal
plants. The continuous development / support of accurate models is key.
- Definition of the zone prices
As the configuration of the grid in Chile is similar to Italy, the best practice could be
exchanged with TERNA on the algorithm for the definition of the zone price. The Price
Coupling of Regions algorithm is also another reference. The right price signals are
needed to reflect grid congestion and provide suitable incentives for the ancillary
services.
- “ACE”- type system for the interconnection between the SIC/SING
After interconnection, the situation in Chile between the 2 grids will be very similar to
the different “Control Areas” in Europe. The best practices could be exchanged for
the definition and treatment of the “ACE” signal.
- Manage the hydro resource to keep enough flexibility
The management of the water resource is a constant balance between a cheap price
on the energy market and saving resources for the grid security. With the increased
penetration of RES, the participation of the hydro plants to the ancillary services may
increase, and could be used to strongly limit the consequences of the RES
penetration on the thermal plants.
- Finalize the implementation of the AGC on the SIC and SING (in progress)
- Maintain a good level of knowledge within the TSO staff regarding conventional power
plants processes:
Since TSO is in charge to verifying plant performance regarding provision of
ancillaries, it is recommended that the TSO has intermediate knowledge about
conventional power plant processes and operation. A sufficient level of knowledge is
necessary to support the successful implementation of some of the above
recommendations (definition of services, third-party verifications, use of models, etc.),
with an attention point on flexibility.
- Use penalties for imbalances as incentive for improvement
Penalties for imbalances can be a good driver to push the assets to work on
continuous improvement of their reliability and reactivity for the required grid support.
Penalties for power shortage (lower than the grid set point) should in principle be
lower than penalties for power excess (higher than the grid set point). Cancellation of
the penalties could even be considered if the plant imbalance “helps” the grid to
correct the overall imbalance (cf. system in Belgium).
IV/ Make sure the new plants are in line with best practices
Considering the ambitious targets of Chile for the development of RES (wind and
solar could represent as much as 40% of the energy mix by 2050), the new plants
should already anticipate the future needs for flexibility. The current grid situation or
an ancillary market (if put in place) may not give enough incentives. In Europe, some
plants built in the late 2000’s were still designed for base load operation whereas the
need for flexibility was already forecasted by many observers.

© Laborelec www.laborelec.com Restricted LBE04118739 - 3.0 | 120 of 133
Separate requirements should be imposed to new Rankine cycles, CCGT and OCGT.
In ELL opinion, these should mainly cover the turndown, start-up times and ramp
rates.
Some pieces of equipment are difficult to install in retrofits and should be foreseen
from the beginning. For example, it is now good practice to install a by-pass stack in
the design of new CCGTs (ex. Kelar) or to foresee a spare space for the OCGTs and
CCGTs for the installation of a SCR, in case the NOx emission limit are further
reduced.
International benchmarks, literature or OEM publications could be used to define
minimum technical requirements. The performances of the European fleet (mostly
existing units which were made flexible with retrofits and upgrades) could be a basis
of comparison.
As the plants also depend on the OEM technologies, deviations from the minimum
requirements may exist. The authorities may ask the plant developer to justify those
deviations by independent parties and/or an official report from the OEM. If several
projects are competing, the non-fulfilment of the flexibility requirements could be
addressed with a multi-criteria score evaluation (plants not fulfilling the minimum
requirements would receive a “0” score for those specific criteria).
V/ Foresee enough flexibility in the definition of emission levels
The emissions of the plants in transient modes (including start/stop) or at low load
can be much higher than for the “normal” operating conditions. Besides, the decrease
of the emissions is not easy to implement on existing plants or requires large
investments (e.g. SCR) which may not always be possible. Hence, this point should
be analysed carefully by the environmental authorities with the possible evolution of
the plant operating regime with the penetration of RES.
Enough flexibility should be considered in the definition of the emission limit values
and their application.
For example, less strict emission limit values can be applied in specific operating
modes (low load). Averaging the concentration limits on longer periods of time can
also give more latitude to the plants while keeping a maximum emission threshold.
6.2. Measures applicable if an ancillary service market is put in
place
VI/ Introduce incentives for ancillary services
The evolution of the flexibility in Europe was mainly driven by the market, resulting
from the lack of profitability of the thermal plants combined with the additional
revenues plant could obtain on the ancillary service market. The Chilean system is
different from the dispatching point of view but ELL strongly believes that more
incentives should be given to the plants towards flexibility (i.a. with a specific
remuneration for ancillary services).
An incentive system would also limit the audits required for the verification of the
detailed technical parameters by the TSO. With clear high level contracts and

© Laborelec www.laborelec.com Restricted LBE04118739 - 3.0 | 121 of 133
incentives, the plant would more “naturally” improve their technical performances to
get additional revenues.
The authors recognize that the financing of such market should be evaluated with
care in order to avoid / limit the overall increase of the system costs (i.e. the energy
price for the final customer). A shift of (part of) the current capacity payment to
ancillary services payment would be an ideal solution. Nevertheless, an increase of
the overall system costs due to the integration of the RES is also likely (its estimation
is currently a “hot” topic in many countries).
The definition of a “strike price” (i.e. maximum energy price in addition to the capacity
payment) as currently discussed for the new capacity payment mechanism in Italy
may also be a possibility to limit the costs of the current capacity payment scheme in
Chile.
- Bidding on PFC reserve
[13] indicates that the decrease of the spinning reserve will impose a distribution of
the PFC reserve on all thermal units (i.e. de-rating from Pmax). The verification of this
statement is beyond the scope of the current study.
Another approach would be to define the minimum number of units required for the
stability of the system and combine it with a “bidding” scheme for the PFC contribution
(capacity payment in CLP/MW) on standard products. The bids should be given by
the plants as a function of the set point received from the central dispatch for the
conventional “energy supply” (which they do not control). The grid would dispatch the
required VFR with a merit order based on the bids.
The most flexible units would be capable to offer more power in MW (compliant with
the requirements of the product) and get more capacity payments, which creates the
incentive.
Separate products could be foreseen to integrate the participation of the coal plants
(less flexible but their capacity payment may be cheaper) or DSM.
- Bidding on SFC reserve
Bids on SFC could be implemented even if the VFR is distributed on all running units.
The bidding system would be very similar to the one proposed for the PFC. Each
plant could make a bid, depending on the load set point received from the central
dispatch for the conventional “energy supply”. The plant operators could even provide
bids with the sum of the capacity available for PFC and SFC (system implemented in
Belgium) in order to make the comparison easier for the TSO.
The most flexible units would be capable to offer more MW (compliant with the
requirements of the product) and get more capacity payments, which creates the
incentive.
A specific product (with longer times for power supply, hence lower ramp rates) could
be foreseen to integrate the coal plants.
The bidding scheme could also foresee the possibility of starting-up a plant which is
not selected for the conventional energy supply in order to support the grid. In
Belgium, at specific times of the year, the SFC is provided by one CCGT which is not

© Laborelec www.laborelec.com Restricted LBE04118739 - 3.0 | 122 of 133
profitable solely on the energy market (the plant only runs thanks to the supply of
ancillary services).
- Bidding on TFC reserve
The TFC management makes part of the central dispatching in the current scheme
(cheapest unit considering the start-up and marginal costs).
A specific capacity payment could be foreseen for the plants fulfilling TFC criteria (e.g.
start-up less than xx min, fast or “standard” TFC) in order to give an incentive to the
plants to reduce their start-up time.
6.3. Measures applicable if an energy market (decentralized
dispatching) is put in place
Europe made the choice of a fully decentralized dispatching with minimum
intervention of the TSO on the energy market. This follows the decision to create a
continental energy market, as formalized in the successive liberalisation directives.
From a technical point of view, this system certainly increased the flexibility of the
power plants in a simultaneous context of overcapacity, high competition and reduced
profitability. However, for many observers, the current situation is not sustainable as
the market puts a huge pressure on the profitability of the European utility companies,
does not promote new investments and creates volatility. One of the consequences
is the development of new capacity payment schemes by many European countries.
The recommendations made in the previous sections are generally applicable to a
liberalized market as well. A few additional ideas are briefly18 developed hereunder
based on the Belgian and Italian examples.
- Creation of an Energy market (Day Ahead followed by the Intraday)
The implementation of an energy market is also an incentive for plant flexibility as the
latter can help them to catch market opportunities (peak prices, shifting modes, etc.).
Nevertheless, the following return of experience of the European case should be
considered:
o The market often fails to take into account properly the risk of black-out and
may increase the volatility of the prices.
o It does not always give the right price signals for the long term adequacy of
the power system and the investments to the future needs.
o The integration of the subsidized RES strongly biased the market for the
thermal plants with their quasi-zero marginal costs (2 combined effects
occur: decrease of the load factors and decrease of the wholesale energy
prices).
- Pooling of plants
18 ELL understanding is that the change of the centralized dispatching system is currently not considered as an option for the evolution of the grid management in Chile.

© Laborelec www.laborelec.com Restricted LBE04118739 - 3.0 | 123 of 133
The system of ARPs (as in Belgium) can be a way to keep a limited number of actors
in charge of the balancing of the grid. It could be a first step in case of liberalization
of the dispatching, even though it gives more “power” to the selected ARPs.
- Essential plants
In a fully free market, the plants should normally be allowed to decide if they are
dispatched. In congested area, power plants could abuse their position and create
power shortages on purpose to increase their profits. The system of “essential plants”
implemented in Italy in combination with battery storage could be an example to
mitigate this issue.
- Capacity markets
The system implemented in Italy fixes a “strike price” and obliges the plants to make bids on
the energy / ancillary markets. This is a way to limit the profits on the energy market of the
plants which receive capacity payments.

© Laborelec www.laborelec.com Restricted LBE04118739 - 3.0 | 124 of 133
Bibliography
[1] Wikimedia, “Wikimedia Commons,” 2017. [Online]. Available: https://commons.wikimedia.org/.
[2] ENTSO-E, “ENTSO-E website - Balancing and Ancillary Services Markets,” [Online]. Available:
https://www.entsoe.eu/about-entso-e/market/balancing-and-ancillary-services-
markets/Pages/default.aspx. [Accessed 21 12 2016].
[3] EU commission, “Commission regulation (EU) 2016/631,” 2016.
[4] TERNA, “Code for transmission, dispatching, development and security of the grid,” 2004.
[5] Colin Henderson, “Increasing the flexibility of coal-fired power plants,” IEA Clean Coal Centre, 2014.
[6] P. Brinckerhoff, "Technical Assessment of the Operation of Coal & Gas Fired Plants," 2014.
[7] Public Utility Commission of Texas, “PUC website - Certification and Licensing,” [Online]. Available:
https://www.puc.texas.gov/industry/electric/business/agg/agg.aspx. [Accessed 21 12 2016].
[8] BritNed, “BritNed website - Implicit auctions,” [Online]. Available:
http://www.britned.com/Participants%20portal/Implicit%20auctions. [Accessed 21 12 2016].
[9] Wikipedia, “Merit Order,” [Online]. Available: https://en.wikipedia.org/wiki/Merit_order. [Accessed 21
12 2016].
[10
]
S. &. M. Tierney, “Uniform-Pricing versus Pay-as-Bid in wholesale electricity markets: does it make a
difference?,” 2008.
[11
]
C. Neumann, “Development of a European Grid Code based on experience from German and
European Wind Integration Studies,” June 2010. [Online]. Available:
www.cwpc.cn/cwpp/index.php/download_file/view/297/233/.
[12
]
EU commission, “European commission - competition - energy,” 12 2016. [Online]. Available:
http://ec.europa.eu/competition/sectors/energy/overview_en.html.
[13
]
CDEC-SING, “Estudio ERNC - Flexibilidad y sistemas de almacenamiento en el Sistema Electrico
Nacional en el ano 2021,” 2016.
[14
]
Joint Research Center, “Best Available Techniques (BAT) Reference Document for Large
Combustion Plants - final draft,” European Commission, Brussels, June 2016.
[15
]
ENTSO-e, “Breakdown of electricity production by energy sources,” [Online]. Available:
http://www.tsp-data-portal.org/Breakdown-of-Electricity-Capacity-by-Energy-Source#tspQvChart.
[16
]
GME, “Electricity Market,” 2016. [Online]. Available:
https://www.mercatoelettrico.org/En/Mercati/MercatoElettrico/IlMercatoElettrico.aspx.
[17
]
“Mercato del Giorno Prima,” GME, [Online]. Available:
http://www.mercatoelettrico.org/It/Esiti/MGP/MGPCartina.aspx?tipo=mappa. [Accessed 1 2017].

© Laborelec www.laborelec.com Restricted LBE04118739 - 3.0 | 125 of 133
[18
]
Italian Regulatory Authority for Electricity and Gas (AEEG, “ANNUAL REPORT TO THE AGENCY
FOR THE COOPERATION OF ENERGY REGULATORS AND TO THE EUROPEAN COMMISSION
ON REGULATORY ACTIVITIES AND THE FULFILLMENT OF DUTIES OF THE ITALIAN
REGULATORY AUTHORITY FOR ELECTRICITY AND GAS,” 2012.
[19
]
Autorita per l'energia elettrica il gas, “RAPPORTO ANNUALE DELL’AUTORITÀ PER L’ENERGIA
ELETTRICA IL GAS E IL SISTEMA IDRICO IN MATERIA DI MONITORAGGIO DEI MERCATI
ELETTRICI A PRONTI, A TERMINE E DEI SERVIZI DI DISPACCIAMENTO: CONSUNTIVO 2014
(rapporto 630/2015/I/EEL),” 2015.
[20
]
V. C. (Ref4e), “Il mercato dei servizi di dispacciamento in Italia: analisi e approcci di simulazione,” 13
10 2016. [Online]. Available: http://unponte2016.stat.unipd.it/slides/Canazza.pdf. [Accessed 01
2017].
[21
]
Smart Energy Demand Coalition, “Mapping Demand Response in Europe Today,” 2015.
[22
]
Terna Rete Italia, “Review of the Italian Ancillary Service and Balancing Market,” 2012. [Online].
Available:
http://www.acer.europa.eu/en/electricity/regional_initiatives/meetings/eri_cse_ig/documents/1/5_msd.
pdf. [Accessed 01 2017].
[23
]
L. Busnello, “The evolution of the Italian power sector after its liberalisation,” 2014.
[24
]
ENTSO-e, “Breakdown of Electricity Capacity by Energy Source,” 2015. [Online]. Available:
http://www.tsp-data-portal.org/Breakdown-of-Electricity-Capacity-by-Energy-Source#tspQvChart.
[Accessed 2016].
[25
]
ELIA, “Electricity Market Players,” 2015. [Online]. Available: http://www.elia.be/en/about-
elia/electricity-market-players. [Accessed 2016].
[26
]
F. V. Dijen, “Ammonium Sulphate, Ammonium Bisulphate and the Air Preheater - LBE02282328 -
1.0,” Laborelec, 2012.
[27
]
F. V. Dijen, “Ammonium sulphate, ammonium bisulphate and the catalyst for reduction of NOx
emissions,” Laborelec, 2011.
[28
]
GEOAIRE & KAS Ingenería, “Análisis General del Impacto Económico y Social de una Norma de
Emisión para Termoeléctricas - Informe Final,” 2009.
[29
]
Electricidad, “Gobierno define las empresas generadoras afectas al impuesto verde,” 7 12 2016.
[Online]. Available: http://www.revistaei.cl/2016/12/07/gobierno-define-las-empresas-generadoras-
afectas-al-impuesto-verde/.
[30
]
S. v. Rijen, M. Jul, S. Blanco and J. I. Sánchez, “Informe Auditoría Técnica - Central Gas Atacama,”
DNV GL, 2015.
[31
]
GIZ, “Standards for operational parameters of the thermal generation fleet to improve the flexibility of
the Chilean power system”.

© Laborelec www.laborelec.com Restricted LBE04118739 - 3.0 | 126 of 133
[32
]
M. S. O. S. Hendrik Lens, “Final Audit Report - Guacolda Audit Final Report,” STEAG, 2015.
[33
]
K. D. Jimmy Lindsay, “Summary Report on Coal Plant Dynamic Performance Capability,” Renewable
Northwest Project , 2010.
[34
]
D. L. N. K. Jaquelin Cochran, “Flexible Coal - Evolution from Baseload to Peaking Plant,” NREL,
2013.
[35
]
. Steven Macmillan, “Gas to Coal Competition in the U.S. Power Sector,” IEA, 2013.
[36
]
GE, “Aeroderivative LM2500 Gas Turbines - GEA32245,” 2015.
[37
]
GE, “Aeroderivative LM6000 gas turbine - GEA32240,” 2015.
[38
]
GE, “9E & GT13E2 power plants - GEA32931,” 2016.
[39
]
J. Chamberlin, CPower, [Online]. Available: http://cpowerenergymanagement.com/author/jennifer-
chamberlin/. [Accessed 13 12 2016].

© Laborelec www.laborelec.com Restricted LBE04118739 - 3.0 | 127 of 133
Overview of Chilean Thermal Fleet
1. Distribution of the technologies and fuels used in the SING and the SIC
The market share for Rankine cycles units is more important in the North (SING) than in the
center of the country (SIC).
Most of the Rankine cycles use coal as primary fuel. Some units can also burn petcoke and
biomass. Old units using fuel oil / diesel are used for cold reserve only (namely, Renca 1 &
2 and Laguna Verde 1 & 2).
Nearly all the CCGTs in Chile use natural gas as primary fuel, with the exception of Gas
Atacama, since the power plant is not supplied in gas for the moment, and only operate with
diesel. Nearly all the CCGT units are dual-fuel and can either burn natural gas or diesel.
About 95% of the OCGTs are connected to the SIC. A quarter of the entire fleet of OCGTs
operates with natural gas, the others with diesel. Most of the OCGTs are peaking units, and
operate a few hours during the year.
Figure 69: Distribution of the types of technologies in the SIC and the SING
1188 MW
772 MW
126 MW
2723 MW
Installed Capacity – Thermal - SING - 2016
CCGT - Gas
CCGT - Diesel
OCGT - Diesel
Rankine - Coal
1923 MW
61 MW
619 MW
1593 MW71 MW
2570 MW
100 MW 47 MW
Installed Capacity – Thermal - SIC - 2016
CCGT - Gas
CCGT - Diesel
OCGT - Natural Gas
OCGT - Diesel
OCGT - CHP Natural Gas
Rankine - Coal
Rankine - Fuel Oil
Rankine - Diesel
Total: ~5GW
Total: ~7GW

© Laborelec www.laborelec.com Restricted LBE04118739 - 3.0 | 128 of 133
2. Rankine cycles
Figure 70: Rankine cycle - Age distribution
The fleet of Rankine units is relatively new: Half of the Rankine assets are less than 8 years-
old, and the first quantile is less than 5 years old. Besides, some Rankine cycles are still
under construction in the country (s.a. the IEM project in the North).
All the installation are subcritical units. Power output are relatively low compared to
international references, ranging between less than 100 MW for the oldest units (Laguna
Verde 1 & 2, Renca 1 & 2, Tocopilla U12 and U13) to a maximum of 350 MW (Santa Maria,
Bocamina 2).
CTA and CTH are the two only fluidized-bed type in Chile, the other Rankine units of the
fleet are PC-type. Besides, CTA and CTH can be partially fuelled with biomass.
Laguna Verde 1 & 2 and Renca 1 & 2 are really old assets. They operate with expensive
light fuel / diesel and are almost never running. They are dedicated to cold reserve.
With exception of these four units, all the Rankine units are equipped with end-of-pipe flue
gas treatment devices for DeSOx, including:
■ Wet (Guacolda 3 for ex.)
■ Semi-wet (Nueva Tocopilla for ex.)
■ Seawater (Santa Maria and Ventanas)
■ Dry systems (Tocopilla U12, U13, U14 and U15 for ex.)
For CTA and CTH, the desulfurization is performed with directly direct injection of limestone
in the fluidized-bed.
Some power plants are equipped with FFs, others with ESPs for the capture of fine particles.
All the new units come with a SCR for the DeNOx process (for ex. IEM, or Guacolda 5).
Several units share a common chimney, with a single CEMS to declare the emissions to the
authorities (ex. CTM1 together with CTM2, or Tocopilla U14 together with U15).

© Laborelec www.laborelec.com Restricted LBE04118739 - 3.0 | 129 of 133
A large majority of the Rankine assets were built near to the Pacific Ocean. As such, nearly
all the Rankine plants are cooled with seawater, through a once-through condenser. There
are two exceptions:
■ Renca 1 & 2 which is installed inland, in the region of Santiago where mechanical-
draught cooling tower are installed
■ Cochrane 1 & 2 which operate with an hybrid cooling system
3. CCGTs
Figure 71: CCGTs - Age distribution
The fleet of CCGTs in Chile is older than the Rankine fleet. Half of the CCGTs are less than
17 years-old, and the first quantile is less than 10.5 years-old. Kelar is about to enter in
operation in CC mode.
Gas Atacama 1 & 2 and Kelar are in 2+2+1 configuration (2 GTs, 2 HRSGs and 1 ST). All
the other CCGTs are in 1+1+1 configuration.
San Isidro 1 & 2, Gas Atacama 1 & 2, Nehuenco 2 and the Kelar project are equipped with
a bypass stack and are capable to operate in both OC and CC mode.
In general, CCGTs in Chile are dual-fuel, using natural gas as primary fuel and diesel as
secondary fuel, when natural gas is not available. Exception is made for the power plant of
Yungay U4 (61 MW) which only operates with diesel. Also, Gas Atacama is not supplied in
gas for the moment.
Nueva Renca, San Isidro 1 & 2, Nehuenco 1 & 2, and Yungay U4 are cooled with a
mechanical-draught cooling tower. The other installations are close by the Pacific Ocean
and are cooled with sea water through a once-through condenser.
4. OCGTs

© Laborelec www.laborelec.com Restricted LBE04118739 - 3.0 | 130 of 133
Figure 72: OCGTs - Technology distribution
GE is the major provider of GTs of the Chilean fleet of OCGTs.
About half of the fleet are GE Frame 9E design. The other half of the OCGTs are smaller
GE heavy duty designs (GE Frame 6B or 5) and GTs from other turbine manufacturers (ex.
SGT-2000E from SIEMENS).
About 15% of the feet are aero derivatives design including LM6000, LM2500 and Twin Pack
FT8-C3F, mainly.
Figure 73: OCGTs - Age distribution
Half of the OCGTs are less than 11.5 years-old, and the first quantile is less than 7.5 years.
Frame 5 or eq.; 212,93
Frame 6B; 161,3108
Frame 9B; 108
Frame 9E; 1026
LM6000; 150
SGT2000E; 153
Twin Pack FT8-C3F; 158 Others; 42,5
Capacity (MW) - OCGTs

© Laborelec www.laborelec.com Restricted LBE04118739 - 3.0 | 131 of 133
List of figures
Figures
Figure 1. Primary frequency control. See below for ΔPmax definition. 17 Figure 2. SFC Half band. The set point from the TSO is expressed in % of the half-band (α): positive
values upwards, negative values downwards. 18 Figure 3. Tertiary Frequency Control 19 Figure 4: Example of a correction factor for ambient temperature applied on the power output and the heat
rate of a GT 19 Figure 5: Definition – Gross and net active power 20 Figure 6: Definition - Pmax 20 Figure 7: Definition Pmax exceptional 21 Figure 8: Definition - Pmin 21 Figure 9: Definition – Pmin exceptional 22 Figure 10: Definition - Turndown 22 Figure 11: Definition – Derating on Pmax and uprating on Pmin 23 Figure 12: Definition - Ramp rate 23 Figure 13: Definition - Start-up process (Rankine) 24 Figure 14: Definition - Start-up process (CCGT) 24 Figure 15: Definition - Start-up process (OCGT) 25 Figure 16: Typical preparation times for a CCGT. Preparation times vary from a few dozen of minutes for a
hot start-up with the vacuum kept in the condenser to more than 10 hours for a cold start-up, after an
overhaul of the boiler (i.e. boiler dry) 26 Figure 17 – “pay-as-bid” vs “pay-as-cleared” [10]. Same average price is assumed in this illustration but it
is not the case in reality. 27 Figure 18 - "Duck curve" on the residual load for Chile in 2021 [13] 30 Figure 19 - merchant vs regulated markets (source: ENGIE – CEEME) 31 Figure 20: Example of cross-border exchanges between different power markets (source: ENTSO-E) 32 Figure 21. Active power reduction area 34 Figure 22 - ENTSO-E fault ride through requirement. Table for synchronous generator (> 110kV). 35 Figure 23. Italian Market organization 38 Figure 24 – Market zones and prices on January 12th 2017 12:00 ( [17]) 40 Figure 25. Quantification of deviation of PFC response 44 Figure 26. Energy Imbalance penalties 47 Figure 27. . Installed capacity breakdown – Belgium 49 Figure 28 - PFC products in Belgium 52 Figure 29. SFC activation requirements 54 Figure 30: Rankine cycle - Process diagram [1] 59 Figure 31: CCGT – Process Diagram ( [1] with modifications) 59 Figure 32: OCGT - Process diagram [1] 60 Figure 33: Catching more market opportunities: Examples of different typical modes of operation for power
plants 61 Figure 34 - merit order illustration 61 Figure 35 - load factor evolution 62 Figure 36 – Historical results on the Italian CCGTs in 2015 for each market. Y-axis represents the margin
after discount of the variable costs, in €/MW. X-axis represents the different CCGT units. Ancillary services
are traded on “MB” and “MSD”. “MI” and “MGP” are the energy markets (cf. section 2.3.2). Horizontal
dotted line corresponds to the average margin. [20] 63

© Laborelec www.laborelec.com Restricted LBE04118739 - 3.0 | 132 of 133
Figure 37 - Derating on Pmax (ΔPR1) or uprating on Pmin. ΔPR1 is the difference between “Pmax” and
“Derating on Pmax” lines. Green band: possible range of power variation on de-rated Pmax due to frequency
variation (upwards / downwards). 64 Figure 38: Pmax evolution of a subcritical Rankine cycle in Poland 67 Figure 39: Pmin evolution of a subcritical Rankine cycle in Germany 68 Figure 40: Maximum ramp rates evolution of a subcritical Rankine cycle in Germany 69 Figure 41: Evolution of a warm start-up time (Rankine in Poland) and fuel consumption (Rankine in
Germany) 69 Figure 42 - Pmax evolution on a F-class CCGT 71 Figure 43 - combustion stability area and instability frequencies. “TTRF” corresponds to the turbine inlet
temperature. “Split” corresponds to the gas distribution between premix and pilot flame. 72 Figure 44 - Pmin evolution on a F-class CCGT 72 Figure 45 - ramp rate evolution of a F-class CCGT 73 Figure 46 - Start-up time (<12h shut down) and fuel consumption for a F-class CCGT 74 Figure 47 - PFC and SFC reserve evolution on 2 F-class CCGT 75 Figure 48: Definition of P10, P50 and P90 78 Figure 49: Breakdown of installed capacity by technology - SIC and SING (source: CDEC-SIC and CDEC-
SING website) 82 Figure 50. Chilean electricity market organization 83 Figure 51: Main changes in the legal framework for power plant emissions in Chile, for the past threethree
decades 90 Figure 52: Definitions of start-up processes for a Rankine cycle: According to ELL (green) and according
to the NTSyCS (pink) 93 Figure 53: Example of a start-up curve for a CCGT 93 Figure 54: Typical preparation times for a CCGT. Preparation times vary from a few dozen of minutes for a
hot start-up with the vacuum kept in the condenser to more than 10 hours for a cold start-up, after an
overhaul of the boiler (i.e. boiler dry) 94 Figure 55: Definition of P10, P50 and P90 99 Figure 56: Rankine cycles – Benchmark on turndown 100 Figure 57 : Rankine cycles – Benchmark on ramp rate 101 Figure 58: Rankine cycles – Benchmark on warm - cold start-up time 102 Figure 59: CCGTs – Benchmark on turndown 105 Figure 60: CCGTs - Benchmark on ramp rate 106 Figure 61: CCGTs - Benchmark on cold start-up time 107 Figure 62: CCGTs - Benchmark on minimum uptime 108 Figure 63: CCGTs – Benchmark on minimum downtime 109 Figure 64: OCGTs - Benchmark on relative turndown 110 Figure 65: OCGTs - Benchmark on ramp rates 111 Figure 66: OCGTs - Benchmark on start-up time 112 Figure 67: OCGTs – Benchmark on minimum uptime 113 Figure 68: OCGTs – Benchmark on minimum downtime 113 Figure 69: Distribution of the types of technologies in the SIC and the SING 127 Figure 70: Rankine cycle - Age distribution 128 Figure 71: CCGTs - Age distribution 129 Figure 72: OCGTs - Technology distribution 130 Figure 73: OCGTs - Age distribution 130
Tables
Table 1. Examples of foreseen and unforeseen changes of load and demand sides 30

© Laborelec www.laborelec.com Restricted LBE04118739 - 3.0 | 133 of 133
Table 2 imposed operation time for each frequency range 34 Table 3. Voltage: minimum time period without disconnecting for pu values from 110kV to 300kV 35 Table 4. Voltage: minimum time period without disconnecting for pu values from 300kV to 400kV 36 Table 5. Emission limit values for units with thermal input > 300MW th in mg/Nm³ 37 Table 6. Installed capacity breakdown - Italy 38 Table 7. Italian flexibility market summary table 48 Table 8. Belgian flexibility market summary table 57 Table 9: Emission limits for a representative fleet of thermal assets in Europe Daily compliance P10, P50
and P90 in normalized ambient conditions and O2 content 76 Table 10: Representative fleet of thermal assets in Europe, some characteristics 77 Table 11 : benchmarking of Rankine power plant performances, USC included 78 Table 12 : benchmarking of Rankine power plant performances, USC excluded 79 Table 13 : Benchmarking of CCGT power plant performances (1+1 configuration) 79 Table 14 : performance of OCGT power plant 80 Table 15. Estimation of reserve for primary frequency control – Year 2017 86 Table 16. Estimation of reserve for secondary frequency control – Year 2017 87 Table 17: Emission limit values for power plants built or declared under construction before 2011 89 Table 18: Emission limit values for power plants built or declared under construction after 2011 89 Table 19. Grid infrastructure comparison 95 Table 20. Energy market comparison 96 Table 21. Ancillary services comparison 97 Table 22: Benchmark of ELVs of NOx and CO, for OCGTs and CCGTs in normalized ambient conditions
and O2 content (15%) 114