GIS D U T A B ONTOLOGY - pdfs.semanticscholar.org · International Journal of Managing Information...
9
International Journal of Managing Information Technology (IJMIT) Vol.4, No.1, February 2012 DOI : 10.5121/ijmit.2012.4102 15 GIS DRIVEN URBAN TRAFFIC ANALYSIS BASED ON ONTOLOGY Tazin Malgundkar 1 ,Madhuri Rao 2 and Dr. S.S. Mantha 3 1 Student, Computer Engineering, Thadomal Shahani Engineering College, Bandra, Mumbai, India. [email protected] 2 Assistant Professor, Information Technology, Thadomal Shahani Engineering College, Bandra, Mumbai, India. [email protected] 3 Professor, VeerMata JijaBai Technological Institute, Mumbai, India [email protected] ABSTRACT Geographic Information System (GIS) is designed to work with data referenced by spatial coordinates. The traffic is growing at a very high pace. Since there is a limit to geographical access, the growing vehicle volume has become difficult to control. GIS is the best way to manage traffic in a particular location. However, most traffic systems cannot share and exchange data with GIS because of incompatible spatial data format and the lack of unified data format definition. The proposed system concentrates on creating the ontology and carrying out the annotations. It will perform traffic analysis and highlight the different traffic zones. It will also suggest alternate path so that users can be diverted to different routes. The system will also divert traffic if the road is blocked. Notification about traffic diversion will be made using SMS gateway. KEYWORDS GIS, geospatial, ontology 1. INTRODUCTION GIS is an information system that works in perspective with geospatial data. GIS consists of a set of tools for collecting, storing, retrieving, transforming and displaying geospatial data from the real world. The term geospatial data refers to all kinds of data on objects and phenomena in the world that are associated with spatial characteristics and that reference some location on the Earth’s surface. Traffic congestion is aggravating due to increased growth rate, population, modernization and improved lifestyle. Not only do traffic bottlenecks increase due to these factors but weather conditions also intensify the situation. Transportation professionals use traffic analysis tools to find the best transportation solutions for their regions. However, as transportation solutions become more sophisticated and complex, so do traffic analysis tools [1]. As a result, many public agencies are facing new and difficult issues regarding traffic analysis and simulation tools for transportation decision making. The current state of art is using surveillance systems by manually placing traffic officers at signals for controlling the traffic.
Transcript of GIS D U T A B ONTOLOGY - pdfs.semanticscholar.org · International Journal of Managing Information...

International Journal of Managing Information Technology (IJMIT) Vol.4, No.1, February 2012
DOI : 10.5121/ijmit.2012.4102 15
GIS DRIVEN URBAN TRAFFIC ANALYSIS BASED ON
ONTOLOGY
Tazin Malgundkar1,Madhuri Rao
2 and Dr. S.S. Mantha
3
1Student, Computer Engineering, Thadomal Shahani Engineering College,
Bandra, Mumbai, India. [email protected]
2Assistant Professor, Information Technology, Thadomal Shahani Engineering College,
Bandra, Mumbai, India. [email protected]
3Professor, VeerMata JijaBai Technological Institute,
Mumbai, India [email protected]
ABSTRACT
Geographic Information System (GIS) is designed to work with data referenced by spatial coordinates. The
traffic is growing at a very high pace. Since there is a limit to geographical access, the growing vehicle
volume has become difficult to control. GIS is the best way to manage traffic in a particular location.
However, most traffic systems cannot share and exchange data with GIS because of incompatible spatial
data format and the lack of unified data format definition. The proposed system concentrates on creating
the ontology and carrying out the annotations. It will perform traffic analysis and highlight the different
traffic zones. It will also suggest alternate path so that users can be diverted to different routes. The system
will also divert traffic if the road is blocked. Notification about traffic diversion will be made using SMS
gateway.
KEYWORDS
GIS, geospatial, ontology
1. INTRODUCTION
GIS is an information system that works in perspective with geospatial data. GIS consists of a set
of tools for collecting, storing, retrieving, transforming and displaying geospatial data from the
real world. The term geospatial data refers to all kinds of data on objects and phenomena in the
world that are associated with spatial characteristics and that reference some location on the
Earth’s surface.
Traffic congestion is aggravating due to increased growth rate, population, modernization and
improved lifestyle. Not only do traffic bottlenecks increase due to these factors but weather
conditions also intensify the situation. Transportation professionals use traffic analysis tools to
find the best transportation solutions for their regions. However, as transportation solutions
become more sophisticated and complex, so do traffic analysis tools [1]. As a result, many public
agencies are facing new and difficult issues regarding traffic analysis and simulation tools for
transportation decision making. The current state of art is using surveillance systems by manually
placing traffic officers at signals for controlling the traffic.

International Journal of Managing Information Technology (IJMIT) Vol.4, No.1, February 2012
16
Traffic simulation is a technology that uses mathematical model to construct traffic flow
variations. It constructs the traffic motion process in a visualized way and has great superiority in
road network traffic flow description and evaluation. It attends to the design, analysis and
implementation of mathematical of traffic simulation. But it is necessary to efficiently store, edit,
analyze and manipulate data associated with spatial characteristics. Repeated amount of spatial
data processing reduces the efficiency of the traffic simulation system.
Nowadays GIS has obtained immense amount of traffic road network information due to
advanced technologies which is necessary for the traffic simulation and has been regarded as the
potential foundational data platform of traffic simulation. With an immense amount of data it
becomes necessary that it is presented in a hierarchical way. However, most traffic systems
cannot share and exchange data with GIS because of lack of compatibility of spatial data format.
Every part of data needs to have a relation with every other data that falls in the hierarchy. For
this purpose, the design of ontology has been created. Once ontology is created, it can be used to
carry out annotations on maps related to traffic information.
2. ONTOLOGY DESCRIPTION
Paper proposes developing a knowledge base of traffic information based on the ontology which
can be used for depicting the rich meaning of traffic data in formalization. Ontology can be used
to provide semantic knowledge of the concepts related to traffic domain. It expresses this
knowledge in terms of type, classification, constraints and properties. Ontology not only develops
semantics but also generates relation between each of these semantics [2].
Ontology is composed of conceptualization and relationship. Each of these denotes a set of
classes and a set of properties. A conceptualization is an abstract, simplified view of the world
that consists of name, relationship set and the description from natural language. The main
purpose of constructing ontology is to capture the knowledge for urban traffic.
Ontology consists of 6 elements,
O = {C, Ac, R, A
R, N, H}
where C represents a set of concepts. For example, C could represent a {Road}. Ac represents a
collection of attributes sets, one for each concept. For example, this may include attributes like
one way or two way roads and north bound or south bound directional road. R represents a set of
relationships. R could represent a {Crossroad} since Road has relation with Crossroad. AR
represents a collection of attributes sets, one for each relationship. Thus, AR can be {start
crossroad, end crossroad}. Each axiom in N is a constraint or restriction on the attribute values of
concept and relationship or a constraint on the relations between concept objects. For example, N
could be {cross road must have more than one road}. And hierarchy H represents crossroad to be
a part of road itself. Once ontology is built, it reduces the problems of data redundancy and
inefficient sharing problems.
3. SYSTEM ARCHITECTURE
The architecture can be formulated as shown in the Figure 1. The bottom layer is the data source
layer which is the traffic data in this application. The GIS data could be in different forms like
images, maps and textual data describing spatial characteristics.
This non structured data needs to be converted into structured data which is the function of the
semantic adapter. The semantic adapter thus produces virtual intermediate data. This intermediate
data is organized and stored in the semantic data layer. This data is organized in the form of
ontology which is nothing but the XML data.

International Journal of Managing Information Technology (IJMIT) Vol.4, No.1, February 2012
17
The Business logic consists of coding the logic for decision making. This includes finding the
route for reaching from a particular source to the destination. If there is high traffic found a
suggestion is made to the user for the alternate routes. The alternate path suggested will display
the routes that consist of high traffic, low traffic and medium traffic. Thus the business logic can
be used in real time decision making. Not only do we find the different types of zones we can
even divert the traffic if it is needed. Analysis can be done to divert the traffic to alternate routes
so that a particular traffic prone area can get free of the heavy traffic. The notification layer will
then be used to notify about the current status and the diversion of traffic to be performed. This
system will allow the traffic manager to notify the traffic police who is manually managing the
traffic. This information delivery will be carried out via the text message service. The traffic
analysis summary that has been generated can be texted by the traffic manager to the traffic
policemen to take immediate action. Thus, it can be used in real time decision making.
.
Figure 1. Architecture of the System
Semantic Annotation helps to bridge the ambiguity of the natural language when expressing
notions and their computational representation in a formal language. By telling a computer how
data items are related and how these relations can be evaluated automatically, it becomes possible
to process complex operations. Semantic annotations can be used in decision making process [3],
[6] and [7].
GIS Data 2 GIS Data n
Semantic Adapter layer
Analysis
Notification Layer
Business Logic
…………
…
GIS Data 1

International Journal of Managing Information Technology (IJMIT) Vol.4, No.1, February 2012
18
Annotated data can be used to highlight the high traffic zones. It can also be used to find the most
optimal path for reaching a particular destination [5]. Thus, the proposed system can be used in
real time decision making process.
4. ONTOLOGY DESIGN OF URBAN TRAFFIC
The entire ontology related to transportation needs to be considered. This would cover the roads,
bridges, routes, segment of the road, surveillance system, the traffic signal, sign, culvert systems,
centre line. Events could be of different types like collecting toll, meeting with an accident or any
project to be undertaken. The surveillance system includes the traffic signals, police officers, and
message boards.
Figure 2 indicates the OntoGraph created for part of the ontology created in Protégé 4.0. Protege
is an open source software used for generating ontology. Location includes a road element and a
road junction. Every location has a latitude and longitude property. Every road junction class has
a name property and left, right, up and down direction properties associated with it. In every road
element, path point is the individual routes. Several path points combine to form a road element.
This is done to accurately maintain the route information. Paths are predefined using defined path
class so that traversal is easily carried out.
Figure 2. OntoGraph created for part of the ontology
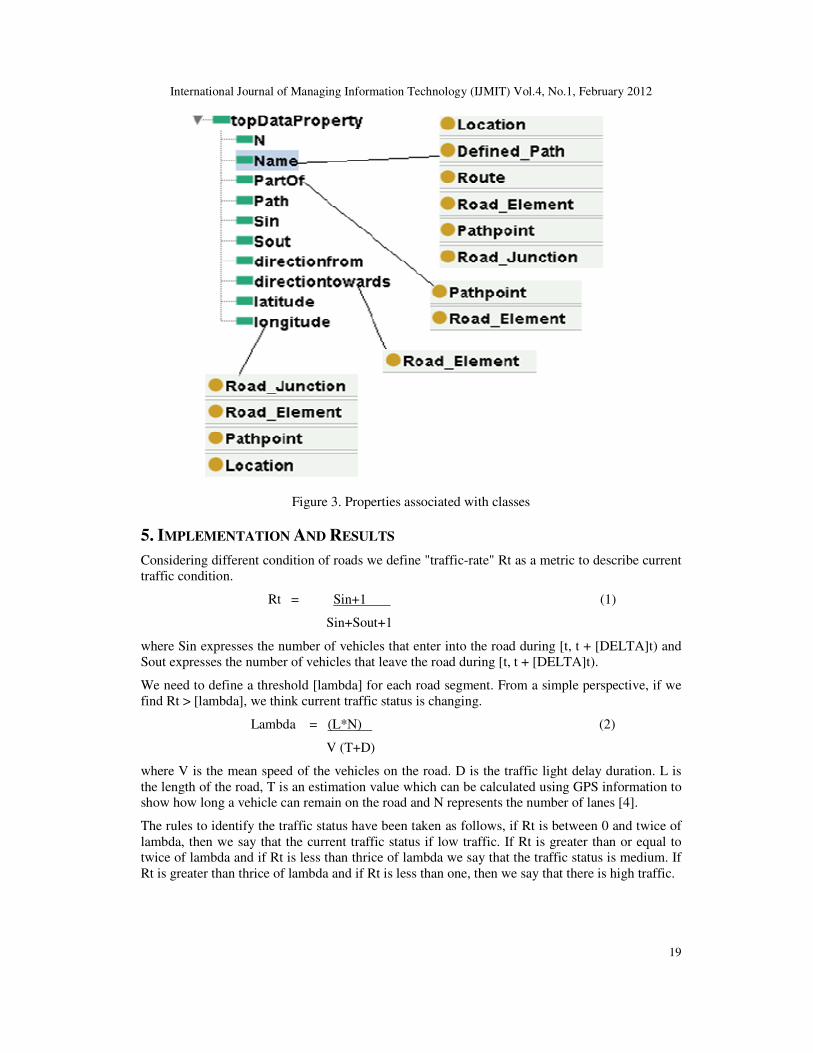
Figure 3 indicates a few properties and the classes to which they belong to. For example, Part Of
is a property of the class PathPoint and Road_element. Similarly, latitude and longitude property
is maintained for Road_Junction, Road_element, PathPoint and Location classes.
International Journal of Managing Information Technology (IJMIT) Vol.4, No.1, February 2012
19
Figure 3. Properties associated with classes
5. IMPLEMENTATION AND RESULTS
Considering different condition of roads we define "traffic-rate" Rt as a metric to describe current
traffic condition.
Rt = Sin+1 (1)
Sin+Sout+1
where Sin expresses the number of vehicles that enter into the road during [t, t + [DELTA]t) and
Sout expresses the number of vehicles that leave the road during [t, t + [DELTA]t).
We need to define a threshold [lambda] for each road segment. From a simple perspective, if we
find Rt > [lambda], we think current traffic status is changing.
Lambda = (L*N) (2)
V (T+D)
where V is the mean speed of the vehicles on the road. D is the traffic light delay duration. L is
the length of the road, T is an estimation value which can be calculated using GPS information to
show how long a vehicle can remain on the road and N represents the number of lanes [4].
The rules to identify the traffic status have been taken as follows, if Rt is between 0 and twice of
lambda, then we say that the current traffic status if low traffic. If Rt is greater than or equal to
twice of lambda and if Rt is less than thrice of lambda we say that the traffic status is medium. If
Rt is greater than thrice of lambda and if Rt is less than one, then we say that there is high traffic.
International Journal of Managing Information Technology (IJMIT) Vol.4, No.1, February 2012
20
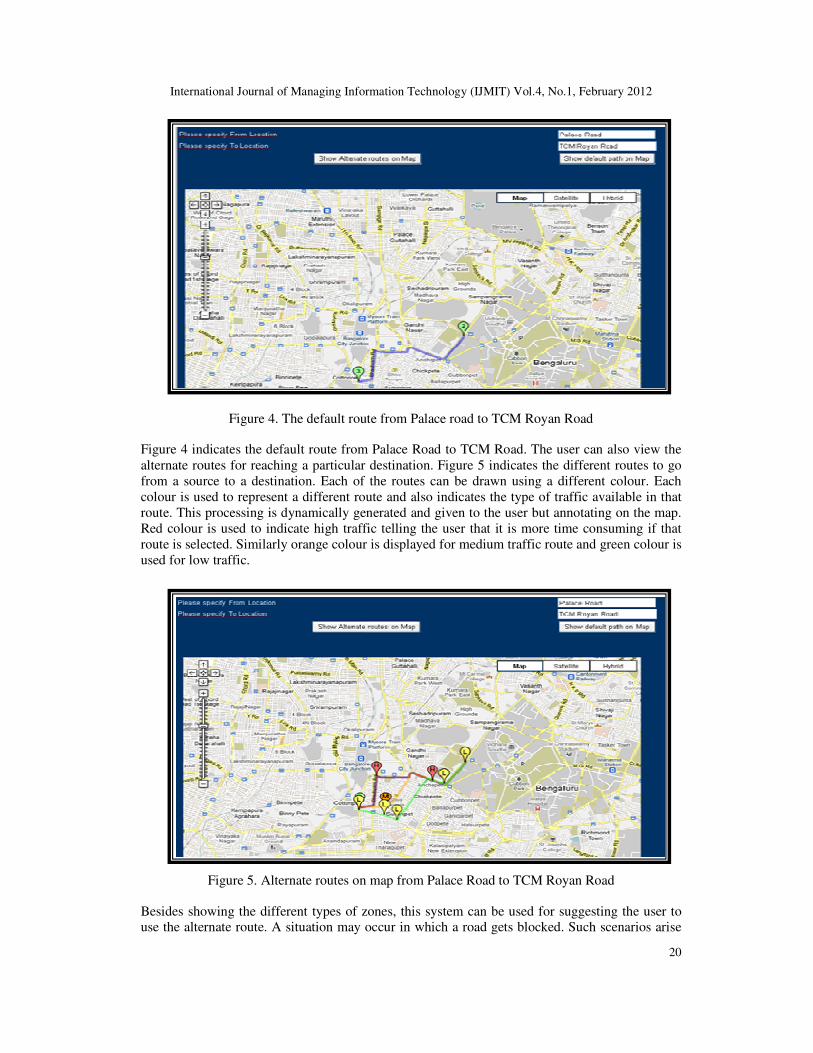
Figure 4. The default route from Palace road to TCM Royan Road
Figure 4 indicates the default route from Palace Road to TCM Road. The user can also view the
alternate routes for reaching a particular destination. Figure 5 indicates the different routes to go
from a source to a destination. Each of the routes can be drawn using a different colour. Each
colour is used to represent a different route and also indicates the type of traffic available in that
route. This processing is dynamically generated and given to the user but annotating on the map.
Red colour is used to indicate high traffic telling the user that it is more time consuming if that
route is selected. Similarly orange colour is displayed for medium traffic route and green colour is
used for low traffic.
Figure 5. Alternate routes on map from Palace Road to TCM Royan Road
Besides showing the different types of zones, this system can be used for suggesting the user to
use the alternate route. A situation may occur in which a road gets blocked. Such scenarios arise
International Journal of Managing Information Technology (IJMIT) Vol.4, No.1, February 2012
21
when vehicle accident takes place on the road. Other reasons for this may be due to some
construction or renovation work going on the road. It may also be due collapse of a bridge or a
building. In such situations, rather than jamming traffic on such route, it becomes necessary to
divert it to the available alternate routes. Thus, the first thing is to ask the user about the
percentage of traffic to be diverted. This would include both incoming and outgoing traffic. Each
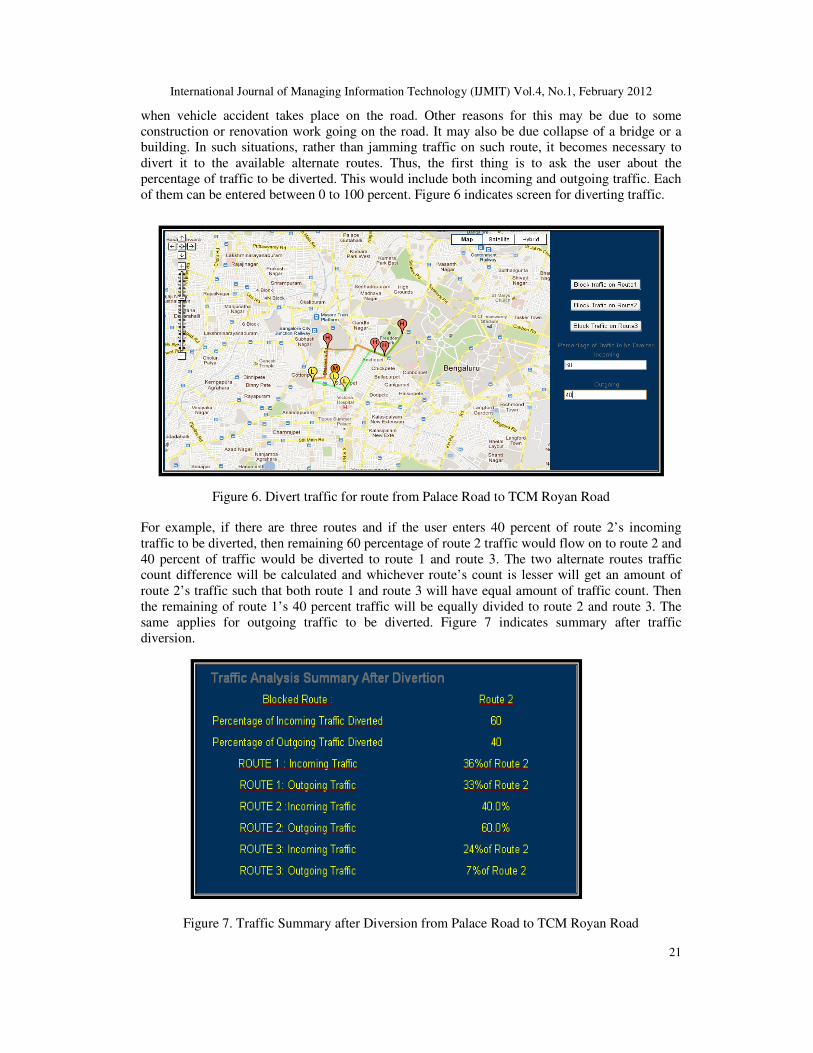
of them can be entered between 0 to 100 percent. Figure 6 indicates screen for diverting traffic.
Figure 6. Divert traffic for route from Palace Road to TCM Royan Road
For example, if there are three routes and if the user enters 40 percent of route 2’s incoming
traffic to be diverted, then remaining 60 percentage of route 2 traffic would flow on to route 2 and
40 percent of traffic would be diverted to route 1 and route 3. The two alternate routes traffic
count difference will be calculated and whichever route’s count is lesser will get an amount of
route 2’s traffic such that both route 1 and route 3 will have equal amount of traffic count. Then
the remaining of route 1’s 40 percent traffic will be equally divided to route 2 and route 3. The
same applies for outgoing traffic to be diverted. Figure 7 indicates summary after traffic
diversion.
Figure 7. Traffic Summary after Diversion from Palace Road to TCM Royan Road
International Journal of Managing Information Technology (IJMIT) Vol.4, No.1, February 2012
22
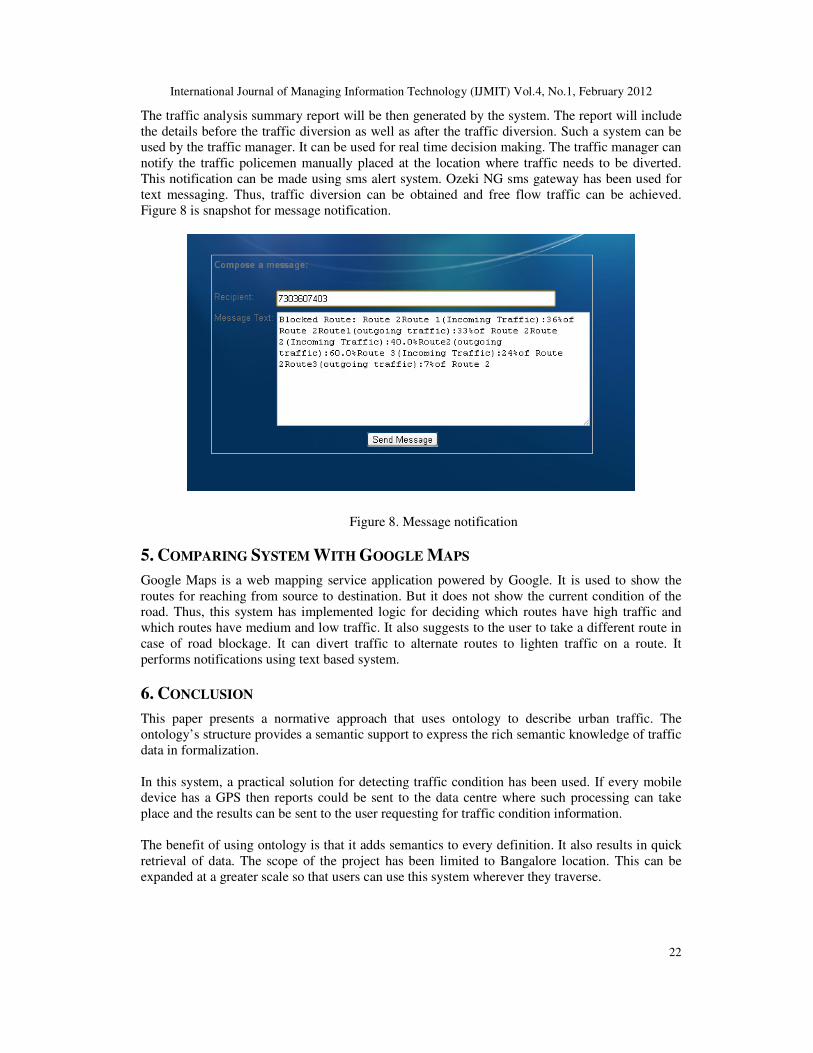
The traffic analysis summary report will be then generated by the system. The report will include
the details before the traffic diversion as well as after the traffic diversion. Such a system can be
used by the traffic manager. It can be used for real time decision making. The traffic manager can
notify the traffic policemen manually placed at the location where traffic needs to be diverted.
This notification can be made using sms alert system. Ozeki NG sms gateway has been used for
text messaging. Thus, traffic diversion can be obtained and free flow traffic can be achieved.
Figure 8 is snapshot for message notification.
Figure 8. Message notification
5. COMPARING SYSTEM WITH GOOGLE MAPS
Google Maps is a web mapping service application powered by Google. It is used to show the
routes for reaching from source to destination. But it does not show the current condition of the
road. Thus, this system has implemented logic for deciding which routes have high traffic and
which routes have medium and low traffic. It also suggests to the user to take a different route in
case of road blockage. It can divert traffic to alternate routes to lighten traffic on a route. It
performs notifications using text based system.
6. CONCLUSION
This paper presents a normative approach that uses ontology to describe urban traffic. The
ontology’s structure provides a semantic support to express the rich semantic knowledge of traffic
data in formalization.
In this system, a practical solution for detecting traffic condition has been used. If every mobile
device has a GPS then reports could be sent to the data centre where such processing can take
place and the results can be sent to the user requesting for traffic condition information.
The benefit of using ontology is that it adds semantics to every definition. It also results in quick
retrieval of data. The scope of the project has been limited to Bangalore location. This can be
expanded at a greater scale so that users can use this system wherever they traverse.

International Journal of Managing Information Technology (IJMIT) Vol.4, No.1, February 2012
23
REFERENCES
[1] Gang Cheng, Qingyun Du, Hongli Ma, (2008) “The Design and Implementation of Rules Based
Knowledge Base for Transportation”, IEEE International Conference on Computer Science and
Software Engineering, Vol. 3, pp 1035 – 1038.
[2] Tao Feng, Hong Liang, Jianping Wu, (2010) “Ontology Driven Data Sharing Between Microscopic
Traffic Simulation and GIS”, IEEE International Conference on Computer Simulation and GIS, Vol. 3,
pp 84-89.
[3] C.G.N. Macario and S.R. Desouza, (2009) “Annotating Geospatial data based on semantics”, ACM International Conference on Advances in Geographic Information Systems, Vol. 17, pp 81-90.
[4] Ke Zhang, Guangtao Xue, (2010) “A Real-Time Urban Traffic Detection Algorithm Based on Spatio-Temporal OD matrix” in Vehicular Sensor Network”, International Journal on Wireless Sensor Networks, Vol. 2,pp 668-674.
[5] Qingling Wang, Biao Yu, (2008) “UTISP: An Urban Traffic Information Portal based on Web GIS”, IEEE Internetational Conference on Internet and Web Application and Services, Vol. 3, pp 319-324.
[6] J. A. Santos and C.G.N. Macario, (2010), “Annotating data to support decision-making: a case study”, Proceedings of the ACM Workshop on Geographic Information Retrieval.
[7] Sydney Roberto Sousa, (2009) “Semantic Approach to Desrcibe Geospatial Resources”, Proceedings of the ER 2009 Workshops on Advances in Conceptual Modeling - Challenging Perspectives, pp. 327-336
Authors
Ms. Malgundkar Tazin, is currenty pursuing Masters in Computer Engineering from
Thadomal Shahani Engineering College, Bandra(W), Mumbai University, India. She
has teaching experience of two and half years. Her areas of interest are Data Mining,
GIS and security.
Ms. Rao Madhuri, is Assistant Professor in Information Technology Department
in Thadomal Shahani Engineering College, Bandra (W), Mumbai University, India.
She has teaching experience of fourteen years. She has guided around 25 graduates
and post graduate projects till date. She is currently pursuing her Ph.D in GIS from
Mumbai University.