
Entrepreneurial GIS Services: Innovative Practices at King County GIS, 2006 URISA Annual Conference

GIS Best Practices
GIS For Public Works
August 2006

Table of Contents
i
What Is GIS? 1
GIS for Public Works 3
GIS-Based Work Order Management System Tailors Workfl ows 5
West Springfi eld, Massachusetts, Builds Information 11Portals with GIS
Cambridge, Massachusetts, Community Trees Are 15 Managed with GIS
Gwinnett County, Georgia, Uses GIS for Traffi c Analysis 19

GIS BEST PRACTICES 1 WWW.ESRI.COM/PUBLICWORKS
What Is GIS?Making decisions based on geography is basic to human thinking. Where shall we go, what will it be like, and what shall we do when we get there are applied to the simple event of going to the store or to the major event of launching a bathysphere into the ocean’s depths. By understanding geography and people's relationship to location, we can make informed decisions about the way we live on our planet. A geographic information system (GIS) is a technological tool for comprehending geography and making intelligent decisions.
GIS organizes geographic data so that a person reading a map can select data necessary for a specifi c project or task. A thematic map has a table of contents that allows the reader to add layers of information to a basemap of real-world locations. For example, a social analyst might use the basemap of Eugene, Oregon, and select datasets from the U.S. Census Bureau to add data layers to a map that shows residents’ education levels, ages, and employment status. With an ability to combine a variety of datasets in an infi nite number of ways, GIS is a useful tool for nearly every fi eld of knowledge from archaeology to zoology.
A good GIS program is able to process geographic data from a variety of sources and integrate it into a map project. Many countries have an abundance of geographic data for analysis, and governments often make GIS datasets publicly available. Map fi le databases often come included with GIS packages; others can be obtained from both commercial vendors and government agencies. Some data is gathered in the fi eld by global positioning units that attach a location coordinate (latitude and longitude) to a feature such as a pump station.
GIS maps are interactive. On the computer screen, map users can scan a GIS map in any direction, zoom in or out, and change the nature of the information contained in the map. They can choose whether to see the roads, how many roads to see, and how roads should be depicted. Then they can select what other items they wish to view alongside these roads such as storm drains, gas lines, rare plants, or hospitals. Some GIS programs are designed to perform sophisticated calculations for tracking storms or predicting erosion patterns. GIS applications can be embedded into common activities such as verifying an address.
From routinely performing work-related tasks to scientifi cally exploring the complexities of our world, GIS gives people the geographic advantage to become more productive, more aware, and more responsive citizens of planet Earth.

GIS BEST PRACTICES 3 WWW.ESRI.COM/PUBLICWORKS
GIS for Public WorksPublic works departments must quickly respond to crises, manage high volumes of data, and streamline workfl ow. To meet the growing needs of their communities and to effectively work with other departments, public works professionals are turning to enterprise geographic information system (GIS) technology to improve effi ciency and productivity.
GIS organizes geographic data so a person can select data necessary for a job such as road repairs, tree trimming, or trash collection. An enterprise-wide GIS allows all sections within a department, even those with little or no GIS experience, to share and easily access data, which facilitates better communication, improves data integrity, and enhances productivity within a department and with other departments. Employees can tap into the public works department’s database to create maps, design new projects, build and maintain the infrastructure, and make decisions based on current and accurate information. GIS applications such as asset management, routing, traffi c analysis, mobile computing, pavement management, and work order management make it easier to understand a problem, participate in a project, and communicate ideas.
An enterprise GIS based on ESRI software technology integrates internal and external databases including CAD data. It also enhances business systems with spatial data for more informed decision making. Public works departments fi nd that using ESRI’s enterprise ArcGIS software
Shortens disaster response time and improves decision making
Enhances customer service
Increases technology return on investment
Improves data accuracy, accessibility, and integrity
Provides better resource and asset management
ESRI software is the number one choice of local governments worldwide for their mapping and analytical needs. Updating a department’s information technology system with GIS helps engineering, utilities, traffi c, building and safety, road and streets, and other divisions meet and exceed the demands placed on them and fosters better interactions with other local agencies. Using GIS software from ESRI, local government employees have discovered how to perform traditional tasks more effi ciently and how to accomplish tasks that were previously impractical or impossible.


GIS BEST PRACTICES WWW.ESRI.COM/PUBLICWORKS5
GIS-Based Work Order Management System Tailors Workfl owsCity of Philadelphia’s Streets Department Takes On New Business Systems
Implementing a complex computer system in a large organization is challenging. Ensuring that each work process is clearly understood and modeled accurately requires a lot of time and attention. Complex implementations often get delayed and sometimes completely stalled from lack of industry, product, and system experience. While public agencies are under increasing scrutiny to ensure investments in technology are worthwhile and cost-effective, they consider several methods to ensure success when implementing new business systems. One way to address the challenge is to hire outside consultants, integrators, and/or product vendors, though internal constraints sometimes preclude such expert assistance.
In Pennsylvania, the city of Philadelphia’s Streets Department faced such challenges in its implementation of a computerized work order management system. And being a strong user of GIS, the department specifi cally sought a system that could leverage and extend its investment in GIS data while meeting the specifi c needs of a wide array of departmental uses. The department sought an extensible, GIS-centric system that could be implemented easily and effi ciently using in-house Streets Department Information Technology staff and could be layered within the existing technology infrastructure.
Individually targeting specifi c groups within the Streets Department Information Services and Technology Unit (IS&T) tailored a methodical approach to ensure three key goals:
Provide end users with a system tailored to their specifi c needs.
Develop in-house confi guration and maintenance expertise.
Realize immediate results.
Project OverviewProject Overview
AUGUST 2006 GIS FOR PUBLICWORKS6
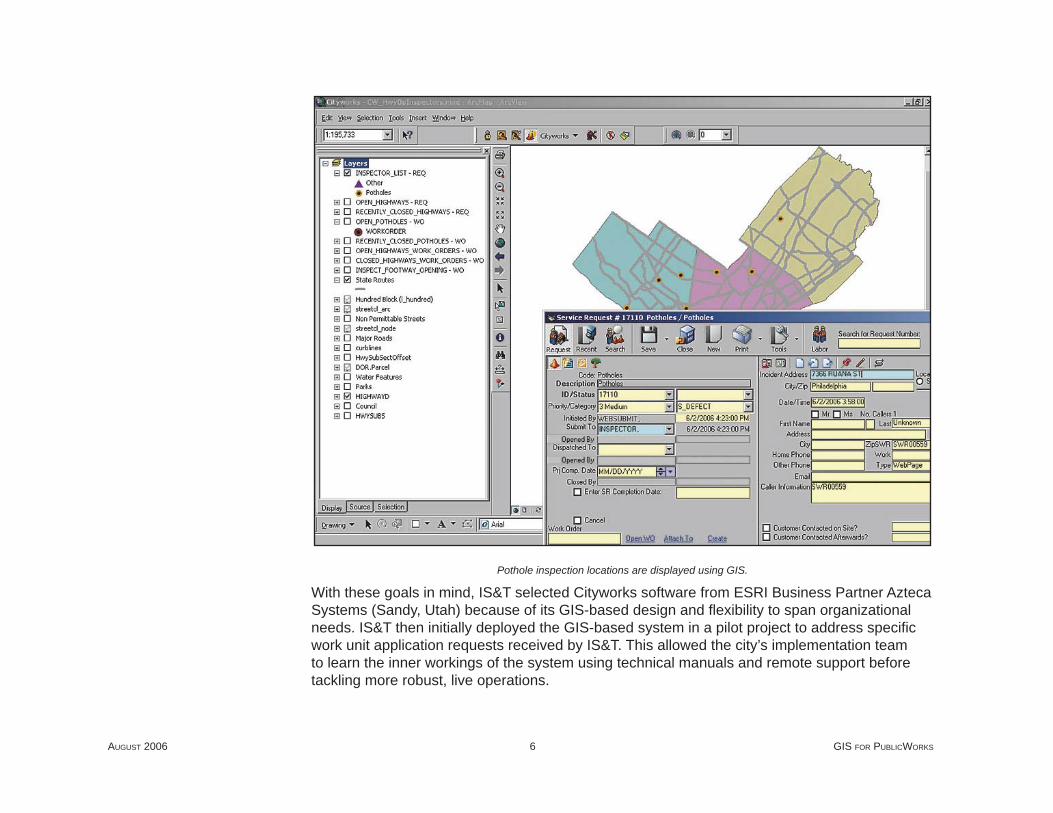
Pothole inspection locations are displayed using GIS.
With these goals in mind, IS&T selected Cityworks software from ESRI Business Partner Azteca Systems (Sandy, Utah) because of its GIS-based design and fl exibility to span organizational needs. IS&T then initially deployed the GIS-based system in a pilot project to address specifi c work unit application requests received by IS&T. This allowed the city’s implementation team to learn the inner workings of the system using technical manuals and remote support before tackling more robust, live operations.
GIS BEST PRACTICES WWW.ESRI.COM/PUBLICWORKS7
The Highway Division’s Concrete Operations Unit was the fi rst to be implemented. A discrete work unit that needed only one task in its workfl ow, they were looking for an easy-to-use system that could track crew productivity and material usage. Meeting with the Concrete Operations supervisor, IS&T developed a list of work order templates and created a single task, Pour Concrete, with the knowledge that a full-scale implementation for the Highway Division would require the addition of many more tasks to these same work order types.
The fi rst step was to set up the system environment. The Streets Department already had a Citrix server farm for the deployment of other applications, including ArcView. It was logical to implement Cityworks, an extension to ArcView, via Citrix as well, creating an ArcView document specifi cally tailored to Concrete Operations’ needs. The GIS data that would be used as assets was held in ArcSDE using Microsoft SQL Server. These assets were streets, stored in two feature classes—arcs (streets) and nodes (intersections). The actual work order management database was set up in SQL Server. Reports were designed using Crystal Reports and delivered to Concrete Operations’ users via a custom application deployed via Citrix. Real data entry began in January 2004.
IS&T then moved on to assist Street Lighting, upgrading its system for tracking alley light maintenance. This deployment required the ability to respond to customer calls along with the need to import fi ve years of existing data. This gave the city’s implementation team the opportunity to learn about using the system in a more comprehensive process. Meetings were held and workfl ow diagrams were created to analyze and enhance the business process before the maintenance management system was deployed. The assets used, in this case, are a subset of the GIS pole layer and, using an ArcSDE spatial view of this subset, allow street lighting users access to existing data without any changes to the data structure or maintenance process.
The implementation team next took on the Right-of-Way Unit, which is responsible for the inspection of work performed on city streets. The source of the majority of its work orders is the Streets Department’s permit system. This required the development of an import routine, to be run by the supervisor, that reads the Street Closure Permit System database and creates work orders in Cityworks. This was similar to the import routines developed to upload the existing data for alley lights, so the skill set was already available. The process also includes the
Concrete OperationsConcrete Operations
Alley LightsAlley Lights
Right-of-Way Inspections
Right-of-Way Inspections

AUGUST 2006 GIS FOR PUBLICWORKS8
creation of a digital copy of the permit as an attachment to the work order. Inspections are done using the custom inspection templates in the system. Photos and drawings are stored in an attached spreadsheet created by the inspectors.
These fi rst three implementations involved a small number of users, affording an excellent way to learn the system. In the summer of 2005, the Highway Division asked to expand Concrete Operations’ system to the full repair process for plumbers’ repair ditches and water ditches. This required the addition of fi ve additional standard tasks to the work order types used by Concrete Operations, plus many different alternate tasks to accommodate special situations. It also included nightly synchronization with data from the city’s Water Department. The implementation started out slowly, based on limited resources and other priorities.
In early 2006, the Mayor’s Offi ce announced a new initiative called Smooth Streets. This initiative required the acceleration of street repairs with the goal of repairing potholes the next business day and performing the permanent restoration of ditches within 30 days of their creation. The department realized that meeting and measuring these goals would require a full-scale implementation of the maintenance management system.
The implementation team rose to the challenge, adding all Highway Division service request and work order types, special event layers to display data, new reports, and custom ArcView documents for customer affairs representatives and inspectors who would determine the validity of citizen calls. The inspectors were also provided with wireless laptops, and the existing Citrix Secure Gateway was used to allow data entry in the fi eld. This process required the training of nearly 100 users. A Web-based application was also developed to allow citizens to report potholes. This application uses existing ArcIMS software-based Web services, provided by the Mayor’s Offi ce of Information Services GIS Services Group, to verify addresses and assign districts. This data is automatically imported into the system as part of the nightly inspection.
Smooth StreetsSmooth Streets

GIS BEST PRACTICES WWW.ESRI.COM/PUBLICWORKS9
The Streets Department fi xed about 2,000 potholes during the fi rst two months of the Operation Smooth Streets initiative.
The resulting implementation has provided Philadelphia’s Streets Department with a personalized confi guration that delivers exact and immediate results to end users, allowing system expansion and modifi cations to be quick and easy.
(Reprinted from the Summer 2006 issue of ArcNews magazine)


GIS BEST PRACTICES WWW.ESRI.COM/PUBLICWORKS11
West Springfi eld, Massachusetts, Builds Information Portals with GISEmployees and Citizens Both Benefi t from Effi cient Data Serving
The town of West Springfi eld is a small community located in western Massachusetts. Once a quiet agrarian community, it has seen major commercial development over the last few decades. Only 17 square miles in size with a population of 28,000, the town has a mixture of land uses—mostly residential with commercial development along the highways and in downtown regions. Like any other town, demand for its municipal services keeps growing as businesses expand and the population grows.
Realizing the importance of digital and interactive mapping for tax assessment, public works, planning, emergency management, etc., the town developed a GIS in 1998 using aerial fl yovers, fi eld surveys, deeds research, etc. Since then, GIS has been playing an important role in meeting the ever-growing demand on municipal services.
For example, in many instances, municipal and property data, though available in digital format, has nonetheless traditionally been spread among and maintained by multiple departments. This made it necessary to visit or call each department or use multiple applications to gather required data, which took time. Therefore, the answers to questions such as Who is the owner of a property? How is the property defi ned in the deed? Does a lot have any special permits? and Where are the closest fi re hydrants? required town employees to “run the gauntlet” to fi nd answers.
Case in Point
AUGUST 2006 GIS FOR PUBLICWORKS12
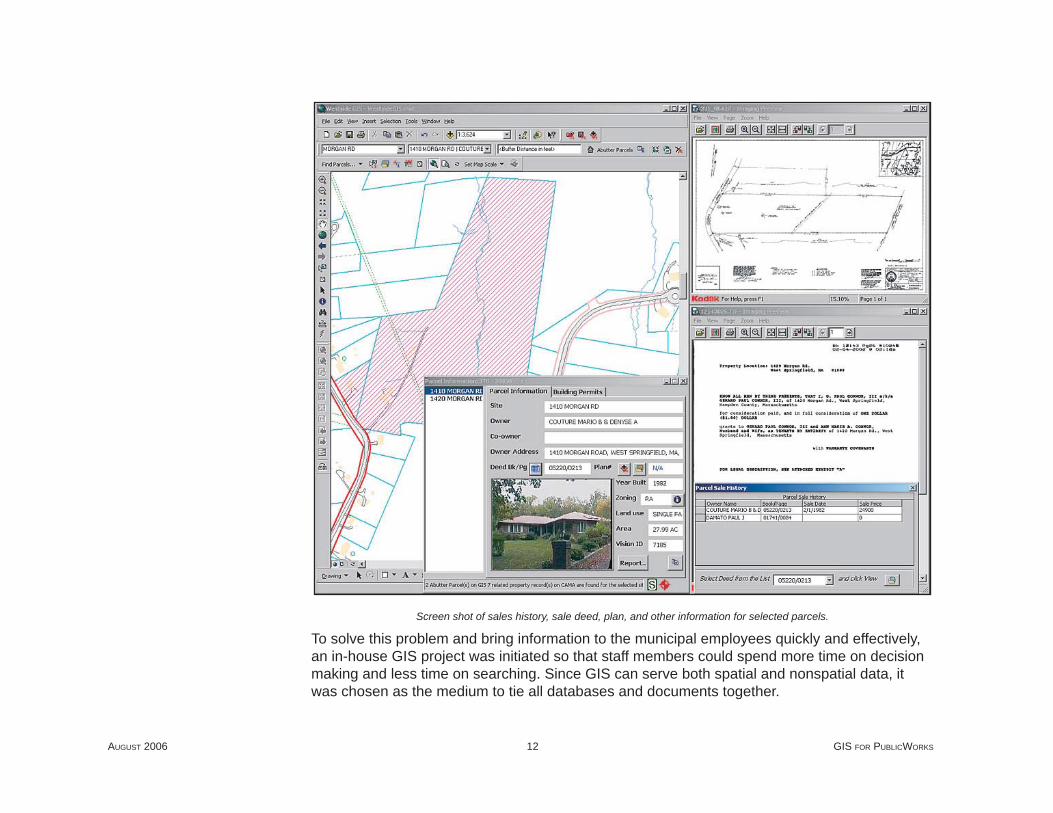
Screen shot of sales history, sale deed, plan, and other information for selected parcels.
To solve this problem and bring information to the municipal employees quickly and effectively, an in-house GIS project was initiated so that staff members could spend more time on decision making and less time on searching. Since GIS can serve both spatial and nonspatial data, it was chosen as the medium to tie all databases and documents together.

GIS BEST PRACTICES WWW.ESRI.COM/PUBLICWORKS13
Spatial data is stored in ESRI’s personal geodatabase to take advantage of object-oriented functionalities and fl exible topology. ArcGIS Desktop (ArcView, ArcEditor, ArcInfo) applications were chosen as the development platform for easier customization and seamless integration with other databases, such as Oracle, MySQL, and Microsoft Access. The ArcGIS Desktop products have been customized to provide options such as searching for parcels, closest hydrants, plans, streets, and engineering drawings; viewing sale deeds and drawings; report generation; and creating mail-merged letters for notifi cation. These applications are provided by one platform called the West Springfi eld Municipal Information System (WSMIS). WSMIS consists of three major components:
Customized ArcGIS Desktop for municipal offi cials
ArcIMS sites for public access
MapObjects and ESRI MapControl software-based 911 emergency management system
The most frequently used application is a customized ArcGIS Desktop ArcMap application with ArcObjects, ActiveX Data Objects, and Visual Basic for Applications codes for seamless integration with other databases. The town’s GIS is customized to retrieve updated information, such as owner name and sales history, for any parcel directly from the tax database. It removes the need to create a temporary table to be joined to the parcel layer. Its support for one-to-many and many-to-many relationships solves, for example, condominium issues in which one parcel polygon is linked with many condominium units.
In the customized application, users can search and view sale deeds or lot plans, receive them from the Registry of Deeds Offi ce in digital format, and overlay parcels on lot plans instantly.
Edward D. O’Brien, principal assessor, says, “Through the use of WSMIS, we have enhanced our ability to record real estate deeds from the Registry of Deeds and translate that data into an effective sales recording/valuation system. Assessors always had the data before, but it was not easily retrievable. WSMIS helps not only to retrieve it easily and effi ciently but also conveys it to other departments.”
Information Improves Effi ciencyInformation Improves Effi ciency
AUGUST 2006 GIS FOR PUBLICWORKS14
the incident location when a 911 call comes in and shows locations and distances to nearest fi re hydrants.
A Microsoft Access-based Fire Inspection Database, with embedded ESRI MapControl and a simple interface, lets fi re inspectors—without any GIS training or experience—easily add locations of shutoffs, hazardous materials, exit doors, etc., which was never possible before. It exports data to the E911 Incident Map directly so that fi refi ghters can view those locations on the computer instantly when a call comes in.
Fire lieutenant Steve Link says, “Utilizing the mapping system enables the fi refi ghters to quickly analyze the area before being dispatched. Being able to preview the location of these features on laptops, we can plan ahead how to approach the situation even while we are on the road.”
The town always wants to serve the community better. Disseminating public information over the Web means residents and businesses can get required information at their convenience. Two ArcIMS Web sites were developed to provide public access to tax- and survey-related information. To make the system less expensive yet more stable and robust, ArcIMS runs on an open source and free Apache Web server on Linux. Java, Java Database Connectivity (JDBC), and JavaServer Pages (JSP) technology are used for retrieving property information directly from an Oracle database. In addition to public use, ArcIMS sites can also be used by anyone in the town hall, saving the town money on licenses.
Kathy O’Brien-Moore, collector-treasurer, says, “Tax collections have been much less diffi cult as access to the deed is immediate. It has saved on trips to the Assessor’s Offi ce and the Registry of Deeds.”
(Reprinted from the Winter 2005/2006 issue of ArcNews magazine)
Serving Data to the Community
Serving Data to the Community
GIS BEST PRACTICES WWW.ESRI.COM/PUBLICWORKS15
Cambridge, Massachusetts, Community Trees Are Managed with GISValuable Natural Resources Managed with Modern Technology
One of the original puritan settlements of 1630, Cambridge, Massachusetts, is one of the most historic cities in the United States. The home of the United States’ fi rst university, it is a culturally diverse community of approximately 100,000 people where college students from around the world study at Harvard, Radcliffe, the Massachusetts Institute of Technology, and Lesley College. Despite containing some of the most technically and intellectually innovative industries, universities, and research facilities, Cambridge holds to its New England charm and beautiful tree-lined neighborhoods. Some of these trees might have even played important historical roles—for example, in the myth that George Washington took command of the army in Cambridge on July 3, 1775, under an elm tree. The myth of Washington and the elm is still widely known today, and the image of the tree remains a symbol of patriotism in Cambridge.
Today, thousands of trees, some of which date back to the 1800s, line the streets of Cambridge and someone has to manage these valuable assets. This responsibility falls to Kelly Writer, the city arborist for the Cambridge Department of Public Works (DPW). The challenge is that trees are living organisms and require maintenance; protection; and, eventually, replacement. Another constant issue for the urban arborist is the identifi cation of hazards—such as dead branches that overhang parking spots, streets, or sidewalks—and the remedy of these hazards in a timely manner before they cause injury or damage to property.

AUGUST 2006 GIS FOR PUBLICWORKS16
Screen shots showing an overview of Cambridge neighborhood trees.
“We needed a detailed and comprehensive street tree inventory to track species, size, location, and tree condition,” explains Writer, “but more important, this information needed to be easily accessible for managing the maintenance priorities of the tree crews.” DPW completed tree inventories in the 1980s using stand-alone software, but it found this data ineffective. “It was diffi cult to access,” says Writer, “and we needed an easier way to manage our trees that was fl exible and powerful and worked seamlessly with our existing ArcGIS system.”

GIS BEST PRACTICES WWW.ESRI.COM/PUBLICWORKS17
He turned to the Kenerson Group, an ESRI Business Partner, to provide the solution. The Kenerson Group had developed TreeWorks, a community tree management software extension for ArcView. Writer was introduced to the software at a Massachusetts Tree Warden conference where he learned of its ability to effi ciently produce an ArcGIS software-based street tree inventory integrated within Cambridge’s existing digital mapping environment. The software’s tree maintenance data could also be linked with DPW’s server-based organization-wide work order system. Upon the recommendation of a colleague, Writer invited the Kenerson Group to provide a demonstration for him and Eric Josephson, DPW’s GIS manager. They ultimately decided the software would be a good fi t and installed it in the summer of 2005.
Since the installation on a Dell OptiPlex 280 desktop PC, Writer’s staff of four has inventoried more than 4,000 street trees in about one and one-half months. Josephson uses ArcView to delineate work areas, and staff arborists are sent out to the target neighborhoods. The arborists use Hewlett-Packard iPAQ 2415 handheld computers (PDAs) running ArcPad, TreeWorks Mobile with street and building layers, and a high-resolution color aerial photo of Cambridge to collect the individual street tree information.
The selected neighborhoods were easy to navigate on the PDA screen, and the high resolution allowed the arborists to identify individual trees on the photo. The trees are located in the fi eld and accurately mapped in the ArcPad tree layer. The arborists then enter the site information, tree attributes, and maintenance information into dialog boxes that store the data in linked tables. Upon completing the day’s inventory, the arborists bring the PDAs back to the GIS offi ce and connect them to the main computer, and the newly collected data is automatically synchronized with the master TreeWorks database on the base computer. After the synchronization process, the PDAs are ready for a new day’s inventory.
The Cambridge tree inventory (about one-third fi nished as of this writing) has already become an invaluable tool for both DPW and the city’s residents. According to Writer, at a recent neighborhood meeting, residents expressed their concern over street tree maintenance. “They wanted to know what system was in place to prioritize tree care issues, such as planting; tree stump removal; and hazard identifi cation, for example, locations where tree roots are lifting sidewalks and driveways—a situation especially important to the elderly,” relates Writer. “The arborist staff had just inventoried the trees in the concerned neighborhood, so I was prepared with comprehensive maps and data showing the exact location of the trees; their condition; and, to the satisfaction of the residents, a time frame for addressing identifi ed problems.”

AUGUST 2006 GIS FOR PUBLICWORKS18
“GIS systems provide a great advantage in protecting our natural resources, wherever they are located—in cities or the countryside and in natural or man-made environments,” concludes Writer. “The Cambridge DPW now has access to better, timelier information, and better information always leads to better decision making.”
(Reprinted from the Winter 2005/2006 issue of ArcNews magazine)

GIS BEST PRACTICES WWW.ESRI.COM/PUBLICWORKS19
Gwinnett County, Georgia, Uses GIS for Traffi c Analysis
A growing suburb of a city known for traffi c snarls doesn’t want to mess around with its traffi c analysis systems. It wants a system that takes its existing data and applies analysis that will help it improve the safety and function of its roads.
Until recently, Gwinnett County, Georgia, did not have the capability to truly analyze traffi c accidents. It was using a traffi c diagramming system that did not incorporate the spatial orientation of the roads where the accidents occurred. The problem with the old generic system is that not every intersection consists of two roads that come together at a 90-degree angle. If this were the case, any generic diagramming solution would work. But accidents occur in thereal world where roads intersect at irregular angles and have curves. Gwinnett County is no exception. As part of the expanding Atlanta metropolitan area, the county has a complicated transportation infrastructure.
When analyzing traffi c accidents, transportation engineers must have a clear understanding of the contributing factors. How would analysts know if a road angle contributed to the accident if every intersection is plotted as a generic four-lane, 90-degree intersection? How would analysts know if the sun could have been in the driver’s eyes or if a tree was blocking a driver’s view? They wouldn’t. They would have to know the spatial orientation of the intersection or drive to the site.

AUGUST 2006 GIS FOR PUBLICWORKS20
Example of a midblock diagram created that shows aerial photos and road centerlines.
In addition, the county had no way to plot midblock accidents. Midblock accidents are classifi ed as all accidents that occur between intersections. The most common midblock accidents occur when someone pulls from a parking lot onto a busy street. The old method of diagramming midblock accidents meant running database queries and drawing the diagrams by hand. This process could take hours, depending on how many accidents occurred at a specifi c location.

GIS BEST PRACTICES WWW.ESRI.COM/PUBLICWORKS21
Despite having an established GIS program, the managers at Gwinnett County understood that they needed some expert guidance in developing a GIS-based traffi c-analysis program. Following extensive investigation, the county picked ESRI Business Partner Burns & McDonnell Engineering of Kansas City, Missouri, to help develop a real-world solution for collision diagramming.
The county’s new consultant then applied its ArcGIS Desktop (ArcView) extension TrueTraffi c, which produces spatially oriented diagrams of accidents where they happened, whether at intersections or midblock.
The extension works by querying the county’s Oracle database for all the accidents that have occurred at a selected intersection or midblock location. The data stored in Oracle contains all the characteristics of an accident, including accident type, vehicle direction of travel, street names, vehicle maneuvers, and more. The application then analyzes each accident and places it in the appropriate location on the map. The map layout view in ArcView can include any additional features that the analysts want to evaluate. These features might include edge of pavement, road centerlines, signs, or aerial photos.
Says Martin Bretherton, traffi c studies engineer for Gwinnett County, “The county is no longer limited by a simplifi ed schematic that doesn’t accurately represent the real world of curves and angles in streets.”
The ArcView extension takes into account the data obtained by the county by incorporating it with the diagrams, including aerial photos. The county is already seeing benefi ts from the extension’s ability to transform its existing data into a more useful and reliable resource. The extension also helps improve the data in the county’s system by fl agging invalid accidents that are missing crucial details or have incorrect spatially oriented values.
AUGUST 2006 GIS FOR PUBLICWORKS22
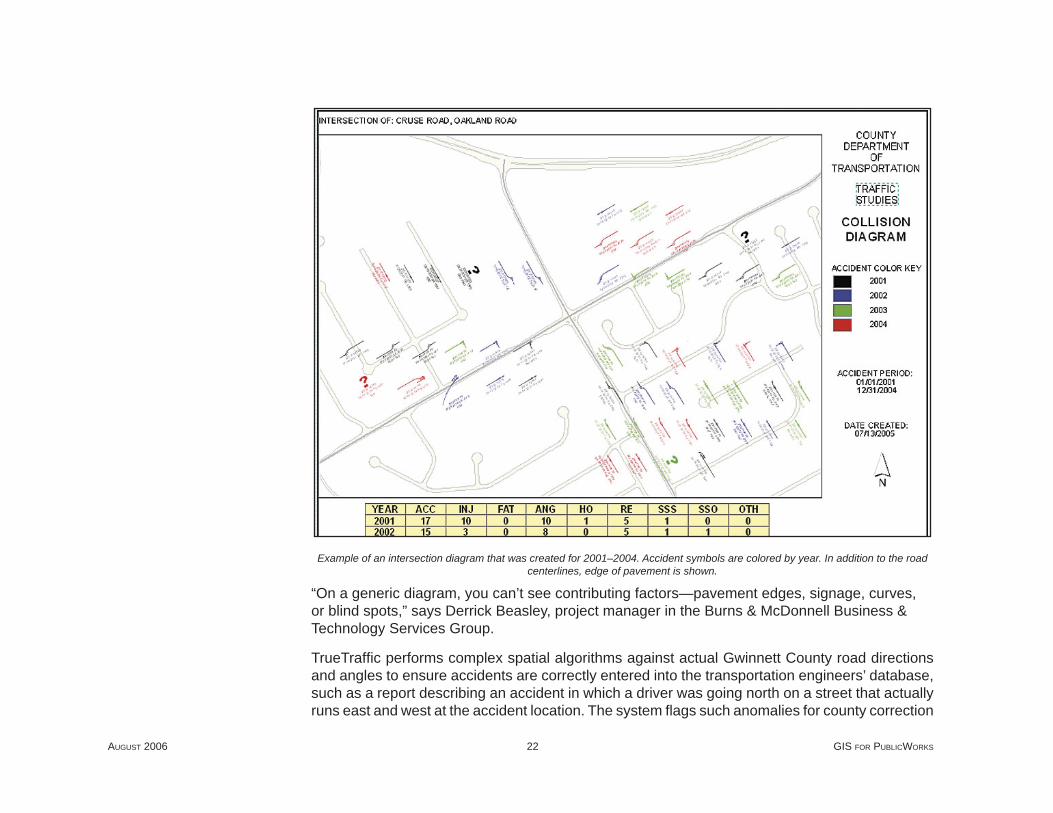
Example of an intersection diagram that was created for 2001–2004. Accident symbols are colored by year. In addition to the road centerlines, edge of pavement is shown.
“On a generic diagram, you can’t see contributing factors—pavement edges, signage, curves, or blind spots,” says Derrick Beasley, project manager in the Burns & McDonnell Business & Technology Services Group.
TrueTraffi c performs complex spatial algorithms against actual Gwinnett County road directions and angles to ensure accidents are correctly entered into the transportation engineers’ database, such as a report describing an accident in which a driver was going north on a street that actually runs east and west at the accident location. The system fl ags such anomalies for county correction
GIS BEST PRACTICES WWW.ESRI.COM/PUBLICWORKS23
and does not allow any accident to be incorrectly represented. Once identifi ed, the accidents can be quickly corrected and diagrammed again. Correct interpretation of the data is key to Gwinnett County’s analysis of traffi c accidents. Furthermore, the program runs on numerous workstations throughout the county and allows Gwinnett County to address the safety concerns of its citizens by giving offi cials a clearer picture of where accidents happen and what might be the contributing factors.
(Reprinted from the Spring 2006 issue of ArcNews magazine)

G21424Copyright © 2006 ESRIAll rights reserved.Printed in the United States of America.
The information contained in this document is the exclusive property of ESRI. This work is protected under United States copyright law and other international copyright treaties and conventions. No part of this work may be reproduced or transmitted in any form or by any means, electronic or mechanical, including photocopying and recording, or by any information storage or retrieval system, except as expressly permitted in writing by ESRI. All requests should be sent to Attention: Contracts and Legal Services Manager, ESRI, 380 New York Street, Redlands, CA 92373-8100, USA.
The information contained in this document is subject to change without notice.
U.S. GOVERNMENT RESTRICTED/LIMITED RIGHTSAny software, documentation, and/or data delivered hereunder is subject to the terms of the License Agreement. In no event shall the U.S. Government acquire greater than RESTRICTED/LIMITED RIGHTS. At a minimum, use, duplication, or disclosure by the U.S. Government is subject to restric-tions as set forth in FAR §52.227-14 Alternates I, II, and III (JUN 1987); FAR §52.227-19 (JUN 1987) and/or FAR §12.211/12.212 (Commercial Technical Data/Computer Software); and DFARS §252.227-7015 (NOV 1995) (Technical Data) and/or DFARS §227.7202 (Computer Software), as applicable. Contractor/Manufacturer is ESRI, 380 New York Street, Redlands, CA 92373-8100, USA.
@esri.com, 3D Analyst, ACORN, ADF, AML, ArcAtlas, ArcCAD, ArcCatalog, ArcCOGO, ArcData, ArcDoc, ArcEdit, ArcEditor, ArcEurope, ArcExplorer, ArcExpress, ArcGIS, ArcGlobe, ArcGrid, ArcIMS, ARC/INFO, ArcInfo, ArcInfo Librarian, ArcInfo—Professional GIS, ArcInfo—The World’s GIS, ArcLocation, ArcLogistics, ArcMap, ArcNetwork, ArcNews, ArcObjects, ArcOpen, ArcPad, ArcPlot, ArcPress, ArcQuest, ArcReader, ArcScan, ArcScene, ArcSchool, ArcSDE, ArcSdl, ArcSketch, ArcStorm, ArcSurvey, ArcTIN, ArcToolbox, ArcTools, ArcUSA, ArcUser, ArcView, ArcVoyager, ArcWatch, ArcWeb, ArcWorld, ArcXML, Atlas GIS, AtlasWare, Avenue, Business Analyst Online, BusinessMAP, Community, CommunityInfo, Data Automation Kit, Database Integrator, DBI Kit, EDN, ESRI, ESRI—Team GIS, ESRI—The GIS Company, ESRI—The GIS People, ESRI—The GIS Software Leader, FormEdit, Geographic Design System, ESRI BIS, Geography Matters, Geography Network, GIS by ESRI, GIS Day, GIS for Everyone, GISData Server, JTX, MapBeans, MapCafé, MapData, MapObjects, Maplex, MapStudio, ModelBuilder, MOLE, NetEngine, PC ARC/INFO, PC ARCPLOT, PC ARCSHELL, PC DATA CONVERSION, PC STARTER KIT, PC TABLES, PC ARCEDIT, PC NETWORK, PC OVERLAY, PLTS, Rent-a-Tech, RouteMAP, SDE, Site·Reporter, SML, Sourcebook·America, Spatial Database Engine, StreetEditor, StreetMap, Tapestry, the ARC/INFO logo, the ArcAtlas logo, the ArcCAD logo, the ArcCAD WorkBench logo, the ArcCOGO logo, the ArcData logo, the ArcData Online logo, the ArcEdit logo, the ArcEurope logo, the ArcExplorer logo, the ArcExpress logo, the ArcGIS logo, the ArcGIS Explorer logo, the ArcGrid logo, the ArcIMS logo, the ArcInfo logo, the ArcLogistics Route logo, the ArcNetwork logo, the ArcPad logo, the ArcPlot logo, the ArcPress for ArcView logo, the ArcPress logo, the ArcScan logo, the ArcScene logo, the ArcSDE CAD Client logo, the ArcSDE logo, the ArcStorm logo, the ArcTIN logo, the ArcTools logo, the ArcUSA logo, the ArcView 3D Analyst logo, the ArcView Business Analyst logo, the ArcView Data Publisher logo, the ArcView GIS logo, the ArcView Image Analysis logo, the ArcView Internet Map Server logo, the ArcView logo, the ArcView Network Analyst logo, the ArcView Spatial Analyst logo, the ArcView StreetMap 2000 logo, the ArcView StreetMap logo, the ArcView Tracking Analyst logo, the ArcWorld logo, the Atlas GIS logo, the Avenue logo, the BusinessMAP logo, the Community logo, the Data Automation Kit logo, the Digital Chart of the World logo, the ESRI Data logo, the ESRI globe logo, the ESRI Press logo, the Geography Network logo, the MapCafé logo, the MapObjects Internet Map Server logo, the MapObjects logo, the MOLE logo, the NetEngine logo, the PC ARC/INFO logo, the Production Line Tool Set logo, the RouteMAP IMS logo, the RouteMAP logo, the SDE logo, The World’s Leading Desktop GIS, Water Writes, www.esri.com, www.esribis.com, www.geographynetwork.com, www.gis.com, www.gisday.com, and Your Personal Geographic Information System are trademarks, registered trademarks, or service marks of ESRI in the United States, the European Community, or certain other jurisdictions.
Other companies and products mentioned in the ESRI Web site may be trademarks or registered trademarks of their respective trademark owners.
ESRI • 380 New York Street • Redlands, CA 92373-8100 • 909-793-2853 • FAX 909-793-5953 • www.esri.com
Since 1969, ESRI has been giving customers around
the world the power to think and plan geographically.
The market leader in geographic information system
(GIS) solutions, ESRI software is used in more than
300,000 organizations worldwide including each
of the 200 largest cities in the United States, most
national governments, more than two-thirds of Fortune
500 companies, and more than 5,000 colleges and
universities. ESRI applications, running on more than one
million desktops and thousands of Web and enterprise
servers, provide the backbone for the world’s mapping
and spatial analysis. ESRI is the only vendor that provides
complete technical solutions for desktop, mobile, server,
and Internet platforms. Visit us at www.esri.com.


