
GIS based Salt Industries Information System for Salt...
123
GIS based Salt Industries Information System for Salt Iodization in Bangladesh Dhaka June 2007 This work was carried out with the a grant from Micronutrient Initiative, Ottawa, Canada through the financial assistance of the Government of Canada through the Canadian International Development Agency (CIDA)
Transcript of GIS based Salt Industries Information System for Salt...

GIS based Salt Industries Information System for Salt Iodization
in Bangladesh
Dhaka
June 2007
This work was carried out with the a grant from Micronutrient Initiative, Ottawa, Canada through the financial assistance of the Government of Canada through the Canadian International Development Agency (CIDA)

i
Study Team
Md. Motaleb Hossain Sarker, GIS Expert/Project Leader
Mollah Md Awlad Hossain, Project Technical Advisor
Pia Afreena Khaleda Huq, GIS Specialist
Md. Abdul Lahel Shafey, GIS Programmer
Md Abul Khayer, Programmer
Md Mohammad Kamrul Hasan, Programmer
Sayeefur Rahman Rizvi, Graphic Specialist
Md. Firoz Alam, GIS Analyst and Field Coordinator
Md. Habibur Rahman, GIS Analyst
Md. Billal Hossain Majumder, Junior GIS Analyst
Field Team
Md. Anowar Hossain (Field Supervisor)
Shiratur Rahman (Field Supervisor)
Sankor C Sinh (Field Supervisor)
Md. Shahadat Hossain Manik, Field Surveyor
A.K.M Saiful Kabir, Field Surveyor
Md. Mamunur Rahman Khan, Field Surveyor
Md. Kamal Pasha, Field Surveyor
Md. Ziaul Karim, Field Surveyor
Torikul Islam, Field Surveyor
Raufa Khanum, Technical Assistant
Fouzia Nusrat, Technical Assistant


iii
Acknowledgement The Centre for Environmental and Geographic Information Services (CEGIS) carried out the study on ‘Development of a GIS based Salt Industries Information System “ for salt iodization in Bangladesh’ with the aid of a grant from Micronutrient Initiative, Ottawa, Canada through the financial assistance of the Government of Canada through the Canadian International Development Agency (CIDA)
CEGIS express gratitude to MI for the support and express special thanks to Dr. Zeba Mahmud, National Programme Manager and Mr. Ashek Mahfuz, National Programme Officer, MI, Bangladesh for their enormous cooperation.
CEGIS greatly acknowledged the kind guidance and cooperation of Mr. A.K.M Mustafizur Rahman, General Manager and Project Director of Control of Iodine Deficiency Disorder Project (CIDD) of Bangladesh Small Cottage Industries Corporation (BSCIC). Ms. Lucky Ahmed, Chemist, CIDD Project provided assistance to the project staff while carrying out the study. Her assistance in this regard is highly acknowledged.
CEGIS acknowledge cordial cooperation of Dr. Salehuddin, Project Director, Salt Development Project and all field-level officials of BSCIC, Cox’s Bazar who provided valuable inputs to the study. The kind guidance by Mr. Giasuddin Ahmed Choudhury, Executive Director, CEGIS provided during the important discussion sessions is acknowledged with honor.
The heartfelt contribution from Mr. Firoz Alam as a Field Coordinator and GIS Analyst to assist the Project Leader during project period and sincere input to the study by Ms. Pia Afreena Khaleda Huque as a GIS specialist are also acknowledged.
Mr. Motaleb Hossain Sarker has given intensive input to complete the whole study as the Project Leader and GIS Expert to manage the project through field work monitoring, supervised the GIS database and software framework concept development and prepared the extensive report. His contributions are greatly acknowledged. Contributions from the short-term field staff of the project for their extensive labour to collect data from field are highly acknowledged.
CEGIS deeply appreciate the technical guidance and remarkable advisory support including time-to-time feedback by Mr. Mollah Md. Awlad Hossain as the Project Technical Advisor and also Software Development Expert to design and develop GSIIS.
CEGIS also express gratitude to Mr. Sayeefur Rahman Rizvi for formatting the study report Special thanks to Asifa Rahman and Halima Neyamat for editing the study report.
The report was written by
Md. Motaleb Hossain Sarker
Mollah Awlad Hossain
Md. Abdul Lahel Shafey
Pia Afreena Khaleda Huq

iv

v
Table of contents
Study Team............................................................................................................................... i
Table of contents ......................................................................................................................v
List of tables.......................................................................................................................... viii
List of figures.......................................................................................................................... ix
Executive Summary............................................................................................................. xiii
Acronyms ................................................................................................................................xv
Chapter 1 Introduction............................................................................................................1
1.1 Background..............................................................................................................................1
1.2 Development of Salt Industries in Bangladesh........................................................................2
1.3 Study Area ...............................................................................................................................3
1.4 Objective..................................................................................................................................8
1.5 Deliverables .............................................................................................................................8
1.6 Study Approach .......................................................................................................................8
1.7 Major Information on Status of Salt Industries and Iodization Process ..................................9
1.8 Structure of the Report ..........................................................................................................10
Chapter 2 Methodology.........................................................................................................11
2.1 Introduction ...........................................................................................................................11
2.2 Conceptual Framework..........................................................................................................12
2.3 Data Needs Assessment.........................................................................................................13
2.4 Questionnaire Development ..................................................................................................14
2.5 Collection and Processing of Data.........................................................................................14
2.6 Quality Control ......................................................................................................................14
2.7 Database Development ..........................................................................................................14
2.8 GIS Mapping .........................................................................................................................15
2.9 Data Analysis.........................................................................................................................15 2.9.1 Situation analysis ........................................................................................................15 2.9.2 Salt flow route analysis...............................................................................................15
2.10 Web based Monitoring Software Development ....................................................................16 2.10.1 Framework design of monitoring software.................................................................16 2.10.2 Development of monitoring software .........................................................................16 2.10.3 Deployment of monitoring software ...........................................................................16
2.11 Documentation ......................................................................................................................16
Chapter 3 Field data collection.............................................................................................19
3.1 Introduction ...........................................................................................................................19

vi
3.2 Field Team Formation ...........................................................................................................19
3.3 Preparation of Field Survey...................................................................................................19
3.4 Training of the Field Staff .....................................................................................................20
3.5 Testing of the Questionnaire..................................................................................................20
3.6 Field Data Collection.............................................................................................................21
3.7 Quality Control of the Field Data ..........................................................................................25
3.8 Field Data Entry ....................................................................................................................26
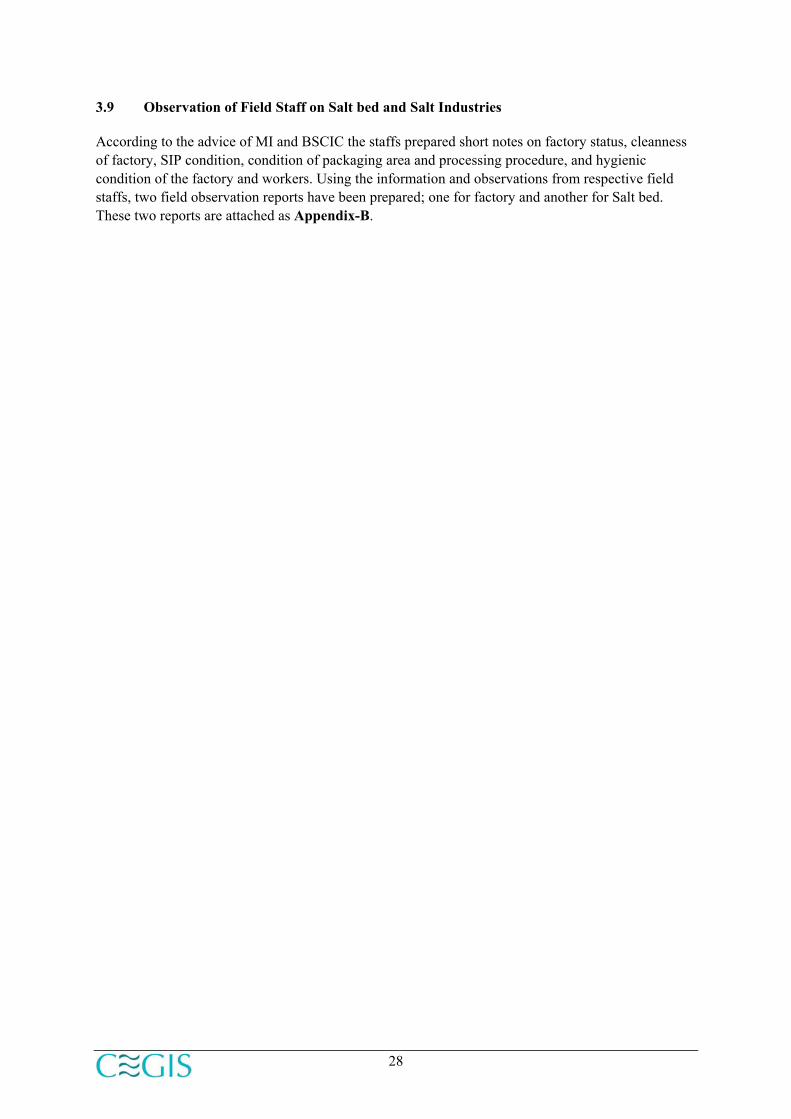
3.9 Observation of Field Staff on Salt bed and Salt Industries....................................................28
Chapter 4 Database development & GIS mapping ............................................................29
4.1 Organization and processing of field data .............................................................................29
4.2 Organization of secondary data .............................................................................................29
4.3 Integration of processed data.................................................................................................30
4.4 GSIIS Database .....................................................................................................................31
4.5 GIS mapping..........................................................................................................................33
Chapter 5 Salt Iodization Situation Analysis ......................................................................41
5.1 Salt ghonas data analysis.......................................................................................................41 5.1.1 Major salt farming areas .............................................................................................41 5.1.2 Sampling of salt bed survey........................................................................................41 5.1.3 Salt bed preparation and production cost....................................................................42 5.1.4 Crude salt production data ..........................................................................................44 5.1.5 Quality control and transportation process of crude salt.............................................45 5.1.6 Mode of Transportation for carrying crude salt ..........................................................46
5.2 Salt factory data analysis .......................................................................................................47 5.2.1 Coverage of the survey ...............................................................................................47 5.2.2 Functional status of salt factory and SIP.....................................................................48 5.2.3 Salt production and processing ...................................................................................51 5.2.4 Factory technical capability status ..............................................................................53 5.2.5 Production and pricing of common and iodized salt...................................................56 5.2.6 Availability and requirement of potassium iodate ......................................................56 5.2.7 Quality control and monitoring of iodization process ................................................57 5.2.8 Packaging and distribution..........................................................................................58 5.2.9 Satisfaction of selling iodized salt ..............................................................................59 5.2.10 Awareness of people...................................................................................................60 5.2.11 Suggestions from salt processors ................................................................................61
5.3 Wholesaler data analysis .......................................................................................................62 5.3.1 Coverage of the wholesaler survey .............................................................................62 5.3.2 Distribution and mode of transport for distribution status of wholesaler ...................62 5.3.3 Quantity of salt distributed by wholesaler ..................................................................64 5.3.4 Monitoring of iodine level during collection and storage...........................................64 5.3.5 Technical support / assistance requirement for wholesaler ........................................68
5.4 Comparative analysis of iodine contents at factory and wholesaler level .............................68
5.5 Salt flow route analysis..........................................................................................................74

vii
5.6 Spatial survey for Iodized Salt Intake at household level......................................................77
Chapter 6 Development of web-based mapping & monitoring system ............................85
6.1 Introduction ...........................................................................................................................85
6.2 Overall architecture of GSIIS ................................................................................................85 6.2.1 User Interface..............................................................................................................86 6.2.2 Database......................................................................................................................86 6.2.3 Web Server .................................................................................................................87 6.2.4 Map components: SharpMap ......................................................................................87
6.3 Technology used....................................................................................................................87
6.4 Main Input and output from the system.................................................................................88 6.4.1 Input data layers..........................................................................................................88 6.4.2 Major Outputs .............................................................................................................89
6.5 Main user of GSIIS................................................................................................................89
6.6 Software components ............................................................................................................90 6.6.1 Data entry interface.....................................................................................................91 6.6.2 Data Explorer:.............................................................................................................91 6.6.3 Mapping......................................................................................................................95 6.6.4 Data analysis ...............................................................................................................97 6.6.5 Map print.....................................................................................................................98 6.6.6 Report printing module ...............................................................................................98 6.6.7 Photo Visualization.....................................................................................................99
6.7 Deployment the web-based monitoring system...................................................................100
6.8 Documentation and Training ...............................................................................................100
6.9 Maintenance ........................................................................................................................100
Chapter 7 Conclusion & Recommendations .....................................................................101
7.1 Conclusion...........................................................................................................................101
7.2 Recommendations ...............................................................................................................102
Appendix A: Field Survey Forms
Appendix B: Field Observation Report from field staff
Appendix C: Detailed Iodine Test Report
viii
List of tables
Table 2.1: Example of identified data through need assessment .............................................13
Table 3.1: Salt Center under salt farming zones ......................................................................22
Table 3.2: Summary of salt farming data collected from the field : ........................................22
Table 4.1: Secondary data with their sources ..........................................................................29
Table 4.2: Some important attribute data................................................................................31
Table 4.3: Items of GIS data layer on salt ghonas ...................................................................32
Table 4.4: Items of GIS data layer on salt factories.................................................................32
Table 4.5: Items of GIS data layer on salt wholesalers............................................................33
Table 4.6: Items of GIS data layer on salt centers ...................................................................33
Table 4.7: Items of GIS data layer on BSCIC office location .................................................33
Table 4.8: Sample list of Salt related GIS maps ......................................................................34
Table 5.1.3.1: Centre wise crude salt production cost from representative sample survey (2007)...............................................................................................................43
Table 5.2: Salt Center wise production of crude salt ...............................................................45
Table 5.2.1.1: Zone wise classification of salt industries based on production capacity ........48
Table 5.2.2.1: Zone-wise status (operating and non operating) salt factories ........................49
Table 5.2.2.2: Zone wise type SIP ...........................................................................................50
Table 5.2.3.1: Zone wise different of salt produced by the industries.....................................51
Table 5.2.4.1: Status of factory manpower by zone ................................................................54
Table 5.2.4.2: Zonewise status of trained manpower working at different salt industries ......55
Table 5.2.4.3: Zone wise status of crude salt processing method in Bangladesh ...................55
Table 5.2.5.1: Average selling price of salt by zone................................................................56
Table 5.2.6.1: Zone-wise potassium iodate required, used and stock status ...........................56
Table 5.2.9.1: Zone wise status of owner satisfaction on selling iodized salt .........................60
Table 5.4.1: Zone wise status of iodine content (ppm) in iodized salt at factory level ...........69
Table 5.4.2: Division wise status of iodine content (ppm) in iodized salt at wholesaler level71
Table 5.4.3: division wise status of iodine content (ppm) in iodized salt at wholesaler level.72
Table 5.4.4: division wise status of iodine content (ppm) in iodized salt at wholesaler level.72
Table 5.4.3: division wise status of iodine content (ppm) in iodized salt at wholesaler level (cont.) ...............................................................................................................73
Table 5.6.1: Patient information from household data (Union : Raghunathpur Upazila: Thakurgaon Sadar,)..........................................................................................80
ix
List of figures
Figure 1.1: Trend of salt farming area .......................................................................................2
Figure 1.2: (a) Flow diagram of polythene bed salt production, (b) Picture of polythene bed..3
Figure 1.3: Location map of the salt beds..................................................................................5
Table 1.1: Summary of zone wise salt industries of Bangladesh ..............................................6
Figure 1.4: BSCIC Salt industry zones of Bangladesh ..............................................................7
Figure 1.5 : Flow daigram of the study approach ......................................................................9
Figure 2.1: Flow diagram of the methodology ........................................................................11
Figure 2.2: Conceptual framework of the study .....................................................................13
Figure 2.3: Salt transport and salt route flow analysis diagram...............................................15
Figure 2.4: Simplified Structure of GIS based Salt Industries Information System................16
Figure 2.5: The main interface of the GSIIS............................................................................17
Figure 3.3: Handheld GPS used in the field for data collection ..............................................20
Figure 3.6: Photograph of the transpotation process of salt from salt bed to factory ..............22
Figure 3.7: (a) Interview with the Production Manager of ACI salt industries at Naryanganj, (b) SIP at Mollah Salt Industries, Fatullah, Naryanganj ...................................24
Figure 3.8: Wholesaler at S.K Traders, Thakurgaoun District ................................................25
Figure 3.9: BSCIC office at Natore (GPS reading: Latitude: 24ọ 24΄ 11.8”; Longitude: 89ọ 01΄
50.3”) .................................................................................................................25
Figure 3.10: Data entry interface for salt factory data .............................................................26
Figure 3.11: Data entry interface for salt ghona data...............................................................27
Figure 3.12: Data entry interface for Wholesaler data............................................................27
Figure 4.1: Sample satellite image showing salt farming area ................................................30
Figure 4.2: Data Structure of the GSIIS database....................................................................32
Figure 4.3: Salt center wise ghona (cluster of salt bed) map ...................................................36
Figure 4.4: Zone wise salt factory map....................................................................................37
Figure 4.5: Division wise wholesaler map...............................................................................38
Figure 4.6: Division wise BSCIC location map.......................................................................39
Figure 5.1: Salt Farming Areas of Bangladesh........................................................................42
Figure 5.1.3.1: Centre wise crude salt production cost from 2007 survey data.......................44
Figure 5.1.3.2: Centre wise crude salt production cost from 2007 survey data.......................44
Figure 5.1.4.1: Crude salt production status (2007 survey).....................................................45
Figure 5.1.4.2: Crude salt production status (2007 survey).....................................................46

x
Figure 5.1.6.1: Mode of transportation for carrying crude salts ..............................................46
Figure 5.1.6.2: Zone status of mode of transportation for carrying crude salts.......................47
Figure 5.2.1.1: Distribution of salt industries in Bangladesh ..................................................47
Figure 5.2.1.2: Zone wise Factory size based on production capacity ....................................48
Figure 5.2.2.2: Operating status of salt industries in Bangladesh............................................49
Figure 5.2.2.3: Zone-wise operating and non operating status of salt industries in Bangladesh...........................................................................................................................49
Figure 5.2.2.4: Classification of not operating (time) duration for the non-function factories50
Figure 5.2.2.5: Operating status of salt industries in Bangladesh............................................50
Figure 5.2.3.1: Zone wise operating and non operating status of salt industries in Bangladesh...........................................................................................................................51
Figure 5.2.3.2: Stock position of all type of salt during survey period (2007)........................52
Figure 5.2.3.3: Zone wise stock position of all type of salts during survey period (2007) .....52
Figure 5.2.3.4: Status of crude salt sources for all industries of Bangladesh (2007)...............53
Figure 5.2.4.1: Status of different types of manpower working at salt industries ...................53
Figure 5.2.4.2: Status of zone wise different types of manpower working at salt industries ..54
Figure 5.2.4.3: Status of technical or trained manpower working at salt industries of Bangladesh ........................................................................................................55
Figure 5.2.4.4: Status of crude salt processing method in Bangladesh....................................55
Figure 5.2.6.1: Zone-wise comparative status of potassium iodate required, used and stock .57
Figure 5.2.7.1: Frequency monitoring of salt iodization at factory level by BSCIC...............58
Figure 5.2.7.2: Iodine method used during monitoring of salt iodization at factory level by BSCIC ...............................................................................................................58
Figure 5.2.8.1: Printed items on consumer packet of iodized salt ...........................................59
Figure 5.2.9.1: Status of owner satisfaction on selling iodized salt.........................................60
Figure 5.2.10.1: Status of awareness on iodine deficiency disorder........................................61
Figure 5.2.11.2: Problems related to salt iodization process ...................................................61
Figure 5.2.11.2: Suggestion related to the salt iodization process...........................................62
Figure 5.3.2.1: Status of different type of salt distribution (by wholesaler) in Bangladesh ....62
Figure 5.3.2.2: Salt distribution status of Bangladesh from sample survey data (2007) .........63
Figure 5.3.2.3: Division-wise salt distribution status of Bangladesh from sample survey data (2007) ................................................................................................................63
Figure 5.3.2.4 Type of transports used by the wholesaler for distribution of salt ...................63
Figure 5.3.3.1: Division-wise salt selling status from sample survey (2007)..........................64
Figure 5.3.3.2: Status of salt distribution media from sample survey 2007 ............................64

xi
Figure 5.3.4.1: Monitoring of iodine level by the wholesaler during collection .....................65
Figure 5.3.4.2: Division-wise status of monitoring of iodine level by the wholesaler during collection ...........................................................................................................65
Figure 5.3.4.3: Monitoring of iodine level by the wholesaler during storage .........................65
Figure 5.3.4.4: Division-wise status of monitoring of iodine level by the wholesaler during storage ...............................................................................................................66
Figure 5.3.4.5: Method used by the wholesalers for iodine test during collection and storing of salt .................................................................................................................66
Figure 5.3.4.6: Division-wise status of iodine test method used during collection and storing of salt .................................................................................................................67
Figure 5.3.4.7: Reason for not monitoring iodine level by wholesalers during collection of salt .....................................................................................................................67
Figure 5.3.4.8: Reason for not monitoring iodine level by wholesaler during storage of salt.67
Figure 5.3.5.1: Status of requirement of any technical or financial support for wholesaler....68
Figure 5.4.1: Status of iodine content (ppm) in iodized salt....................................................69
Figure 5.4.2: Zone wise status of iodine content (ppm) in iodized salt at different salt factories .............................................................................................................69
Figure 5.4.3: Status of iodine content (ppm) in iodized salt at wholesaler level.....................70
Figure 5.4.4: Division wise status of iodine content (ppm) in iodized salt at wholesaler level...........................................................................................................................71
Figure 5.5.1: Salt flow route analysis ......................................................................................76
Figure 5.6.1: Study area for salt intake household sample survey...........................................78
Figure 5.6.2: Status of education level at salt intake household surveyed area.......................79
Figure 5.6.3: Status of occupation of household’s head at salt intake household surveyed area...........................................................................................................................79
Figure 5.6.4: Status of occupation of household’s head at salt intake household surveyed area...........................................................................................................................79
Figure 5.6.5: Sample photographs of goiter patient of salt intake households surveyed area.80
Figure 5.6.6: Maps showing salt intake by the households at surveyed area ..........................81
Figure 5.6.7: Status of salt intake by the households at surveyed area....................................82
Figure 5.6.8: Status of duration iodized salt used by the households at surveyed area ...........82
Figure 5.6.9: Status of awareness on IDD by the households at surveyed areas.....................83
Figure 6.2.1: Overall architecture of GSIIS.............................................................................86
Figure 6.6.1: Front screen of the GSIIS...................................................................................90
Figure 6.6.1: Data entry interface (Salt bed)............................................................................91
Figure: 6.6.2.1: Map data viewer .............................................................................................92

xii
Figure 6.6.2.2: Tabular data viewer .........................................................................................93
Figure 6.6.2.3: Chart tool.........................................................................................................94
Figure 6.6.2.4: Export tool.......................................................................................................94
Figure 6.6.2.5: New query tool ................................................................................................95
Figure 6.6.3.1 Dynamic mapping tool .....................................................................................96
Figure 6.6.4.1 Data analysis tool .............................................................................................97
Figure 6.6.5.1 Map print tool ...................................................................................................98
Figure 6.6.6.1 Map print tool ..................................................................................................99
Figure 6.6.7.1: Pictures viewer ................................................................................................99

xiii
Executive Summary
Iodine deficiency is one of the three greatest global public health concerns. It is an essential element required by the thyroid hormone that controls cellular metabolism, neuromuscular tissue growth, and development. Lack of iodine severely affects the development of the brain and nervous tissue. Lack of iodine causes intellectual impairment, brain damage, impaired mental functions. The most severe effect of iodine deficiency is goiter disease. Micronutrient Initiative (MI) an international not-for-profit organization with headquarters in Ottawa, Canada through its Bangladesh office has been providing technical assistance to address alleviation of iodine problem in Bangladesh through CIDD Project of BSCIC. As part of one of the programme MI assigned CEGIS to develop a GIS based salt industries information system titled “GIS based Salt Industries Information System (GSIIS)” to assist the BSCIC to improve the condition of iodine deficiency of the people of Bangladesh.
The salt chain from production to the intake by the people consists three stages: Salt production bed, salt factories where iodine is mixed and wholesale in the markets. The mixing of iodine at factory level requires strong monitoring to ensure proper iodine level. But production level includes quality of salts that is concerned to health. At wholesale level the iodine level are decayed during collection and storage. Hence a requirement for monitoring of all these levels is necessary.
The study has been conducted in the almost whole of Bangladesh with the three distinct aspects are: Salt Bed/Ghona (salt farming area at Coastal zone of Bangladesh), Salt industry (eight salt monitoring zones of Bangladesh) and Wholesale market (64 district).
The study involved collection of information from 292 salt industries, 751 salt ghona (cluster of salt beds) more than 166 wholesalers. Data from all the three levels are analyzed and compiled into a GIS based System which can be accessed interactively from Internet through web browsers.
During the preparation of the GSIIS the situation of salt industries and the salt iodization process were assessed. Major information collected for this assessment are:
Annual crude salt production, transportation process
Salt industry status, industrial production, iodization plants, quality control and iodine level monitoring process, pricing of processed salt
Average sales, iodine monitoring status, transportation process of wholesale salt etc.
According to sample survey most of the salt beds are situated in the Cox’s Bazar region and 57% of the farmers are producing black crude salt and 43% of the farmers are producing polythene crude salt. More than 60% of the crude salts are carrying from salt beds to factory by boat. Present study revealed that 71% factories are operating and 29% of the factories are not operating. It has also been observed that 44 of the factories are not operating since less than 1-year period, 17 of the factories are not operating since 1- 5 years, 22 of the factories are not operating since 5 – 10 years and only two factories are not operating for more than 10 years duration.
Study also revealed that 54% of the salt industries producing iodized salt, 40% of the salt industries producing industrial salt and only 6% of the factory producing non-iodized. About 91% of the salt industries are using Bangladeshi crude salt and only 9% of industries are using Indian crude salt and as well as Bangladeshi crude salts. About 84% of salt industry based manpower is working on daily basis and only 16% is permanent. Only 13% of workers of all industries are trained. About 80% of the respondents are satisfied with the selling of iodized salt but they need cooperation from government of Bangladesh through BSCIC to provide low interest rate loan and subsidized automated crude processing and drying machine which will helpful for their sustained.

xiv
CEGIS conducted the ‘Iodized Salt Intake Household Survey’ for identification of low coverage area for iodine intake. From the survey result it is observed that 6% of the respondent households have goiter patients at Thakurgaon area of Bangladesh. Around 30% of the respondents households are eating non-iodized salt in the same area.
The GSIIS developed under the study is fully equipped with very recent database, maps, photographs and other information. The GIS based database would be very effective for spatial planning and monitoring of salt iodization process of Bangladesh.
Finally it is to be noticed that the GSIIS would be very effective for efficient monitoring and planning of salt iodization process of Bangladesh especially for BSCIC and as well as other relevant organization.

xv
Acronyms
BBS Bangladesh Bureau of Statistics
BITAC Bangladesh Industrial Technical Assistance Centre
BSCIC Bangladesh Small and Cottage Industries Corporation
BSTI Bangladesh Standard and Testing Institute
BUET Bangladesh University of Engineering and Technology
CEGIS Center for Environmental and Geographic Information Services
CHARM Chittagong Hill Tracts Resource Management System
CIDD Control of Iodine Deficiency Disorder
ESRI Environmental Systems Research Institute
GIS Geographic Information System
GPS Global Positioning System
GSIIS GIS based Salt Industries Information System
HH Household
ICRD Integrated Coastal Resources Database
IDD Iodine Deficiency Disorder
INFS Institute of Nutrition and Food Science
IPHN Institute of Public Health Nutrition
IRS Indian Remote Sensing Satellites
KIO3 Potassium Iodate
MI Micronutrient Initiative
NWRD National Water Resources Database
PC Production Cost
Ppm Parts per million
SIP Salt Iodization Plant
SQL Structured Query Language
UNICEF United Nations International Children’s Emergency Fund
WHO World Health Organization

xvi

1
Chapter 1
Introduction
1.1 Background
Prevention of the detrimental effects of inadequate intake of the three micronutrients--iodine, vitamin-A and iron--is of immense importance to global public health. Investments in economic development and education will not achieve their desired outcomes fully unless this problem is addressed.
Iodine deficiency is one of the three greatest global public heath concerns. It is an essential element required by the thyroid hormone that controls cellular metabolism, neuromuscular tissue growth, and development. Lack of iodine severely affects the development of the brain and nervous tissue. During the last decade it has been recognized that iodine deficiency is the leading cause of intellectual impairment. On a worldwide basis, iodine deficiency is the single most important preventable cause of brain damage. Iodine deficiency at critical stages during pregnancy and early childhood results in impaired development of the brain and consequently in impaired mental function. The problem related to iodine deficiency is known as Iodine Deficiency Disorders or IDD. The problem is observed more severe in rural than urban areas.
In 1990, 28.9% of the world’s population (1,572 million people) was at risk of IDD, 12% had goiter, 8% had some degree of mental impairment due to iodine deficiency and 2% were cretinous. By 1999, 81% of the 130 countries where IDD was a public health problem had a national coordinating body, 78% had an action plan for IDD control, 75% had salt iodization legislation and 68% of households had access to iodized salt.
Over the last few decades, after testing many foods, salt has been accepted as the most acceptable vehicle for providing supplementary iodine. A small, constant amount of iodine in salt every day is all that is needed.
Although the main strategy for the control of IDD is salt iodization, sustainable elimination cannot be achieved by this means alone. The first step in the development of a national prevention and control programme is to establish a suitable mechanism for coordinating the sectors involved in the control of IDD. Later stages include carrying out baseline assessments; preparing plans of action; winning political support; communicating with the public and other sectors, and writing, enacting and enforcing legislation on salt iodization. In high-risk areas, where considerable delays in access to iodized salt are likely, iodized salt should be given to women and children. Monitoring the impact of iodization programs is essential in order to ensure adequate and continuing coverage (WHO, 1998).
Any national iodine deficiency disorders elimination program must ensure that all salt for human and animal consumption, both imported and locally produced, is adequately iodized.
However, salt iodization is not simply a matter of passing legislation or persuading certain salt producers to iodize their salt. Iodine is volatile in all forms, potassium iodide is most volatile, and potassium iodate (KIO3) is least. Iodine is lossed during production and in storage. It may happen due to poor quality control in factory and wholesale.
The challenge in sustaining the salt iodization effort also needs strong commitments and motivation. National level coordinated programme are required to eliminate IDD from Bangladesh. In this respect Bangladesh Small and Cottage Industries Corporation (BSCIC) is continuing a project on salt iodization to prevent Control Iodization Deficiency Disorder (CIDD) for last ten years.

2
To make the program efficient and sustainable a strong digital monitoring system is essential where the iodization chain can be tracked at every stage, from salt bed to market outlet along with location and status.
MI is a Canada- based international not-for-profit organization dedicated to eliminating vitamin and mineral deficiencies worldwide. It is a global network based in Ottawa, Canada with regional offices in New Delhi, India and Johannesburg, South Africa, serving over 75 countries. The Micronutrient Initiative (MI) assigned CEGIS to develop a GIS based Salt Industries Information System for CIDD project of BSCIC.
1.2 Development of Salt Industries in Bangladesh
BSCIC took several programmes targeting self-sufficiency in salt production and to create more employment scope in coastal zone of Bangladesh (BSCIC, 2005). As an effect the salt farming has been expanded remarkably. The trend of increasing salt farming area is presented in Figure 1.1. It is seen that the salt production area has been increased from 60,000 acres to 70,000 acres. It worth noting that Bangladesh government has passed an Iodine Deficiency Disease Protection Rule to enhance the iodization process for ensuring an adequate level of iodine in edible salt.
Process of common salt production at farm level
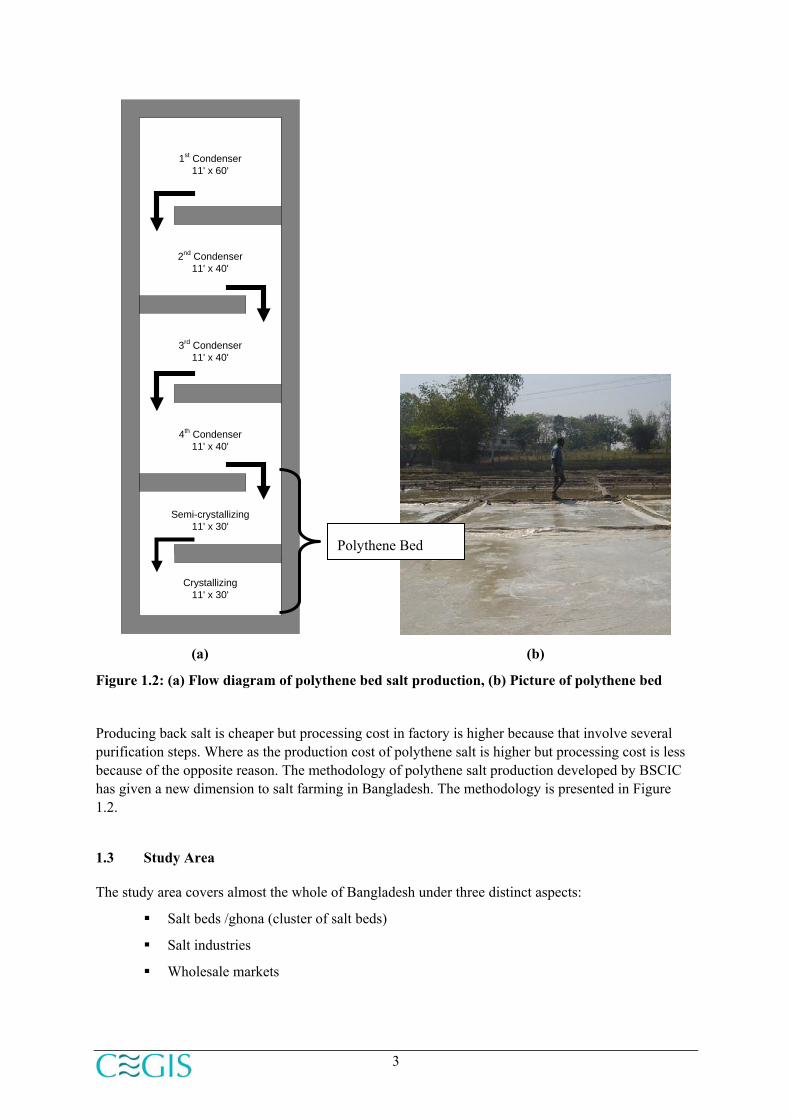
The salt iodization process is indirectly related to salt production at the farm and factory levels. Salt is produced in Bangladesh mainly by a process of drying up of seawater by solar heat. There are two types of crude salt produced in Bangladesh, which are (i) black salt – the media or bed for this type of salt is soil and (ii) polythene salt – the media is polythene bed.
Comparetive statistics of salt farming area (2003- 2006)
55000
60000
65000
70000
75000
2003-2004 2004-2005 2005-2006Year
Tot
al A
rea(
acre
)
Figure 1.1: Trend of salt farming area
3
2nd Condenser11' x 40'
1st Condenser11' x 60'
3rd Condenser11' x 40'
4th Condenser11' x 40'
Semi-crystallizing11' x 30'
Crystallizing11' x 30'
(a) (b)
Figure 1.2: (a) Flow diagram of polythene bed salt production, (b) Picture of polythene bed
Producing back salt is cheaper but processing cost in factory is higher because that involve several purification steps. Where as the production cost of polythene salt is higher but processing cost is less because of the opposite reason. The methodology of polythene salt production developed by BSCIC has given a new dimension to salt farming in Bangladesh. The methodology is presented in Figure 1.2.
1.3 Study Area
The study area covers almost the whole of Bangladesh under three distinct aspects:
Salt beds /ghona (cluster of salt beds)
Salt industries
Wholesale markets
Polythene Bed

4
Salt bed/Ghona
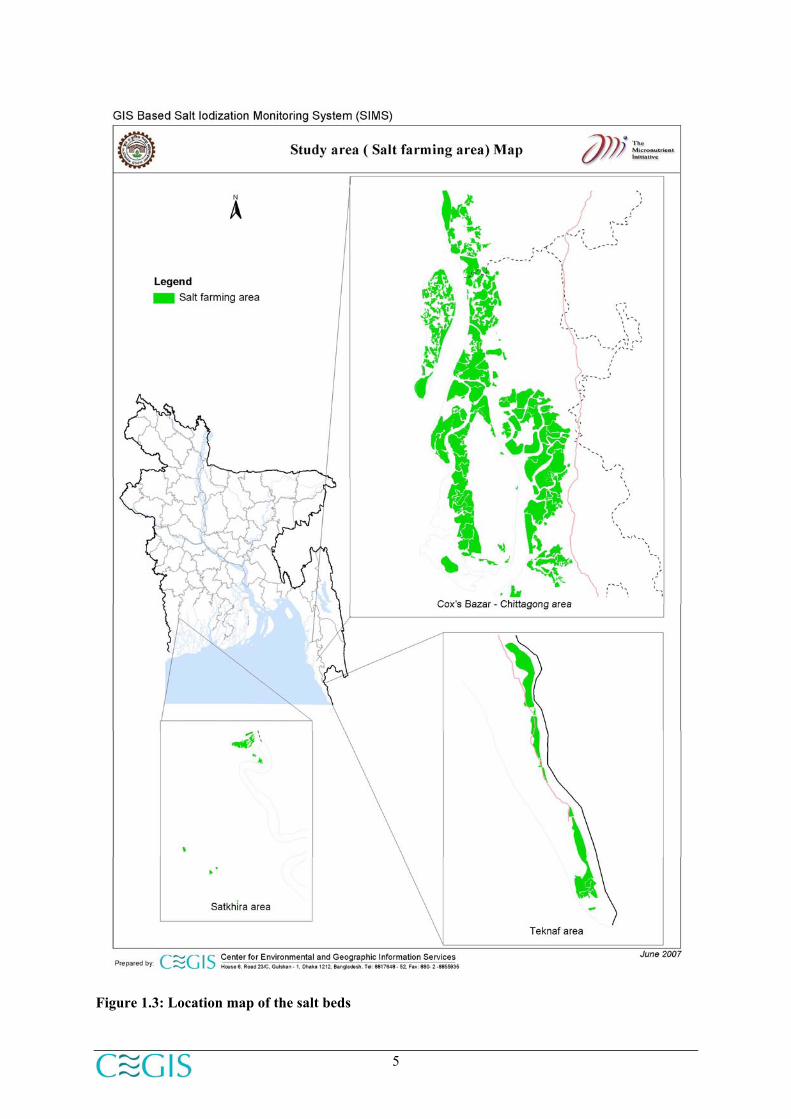
Presently near about 70,000 acres of area are under salt farming in coastal zone of Bangladesh. The total salt farming area in the country during 2003-04, 2004-05 and 2005-06 comprised 60918, 63556 and 69960 acres respectively. The salt ghonas (clusters of salt beds) are mainly situated in two specific areas of the coastal zones (i) the Chittagong – Cox’s Bazar area, and (ii) the Satkhira area. Major salt farming is observed in the Chittagong – Cox’s Bazar area and small-scale salt farming has recently been started in the Satkhira area. The overall salt farming activity of the country is monitored by 15 salt centers of BSCIC. The locations of the salt centers and the study area for conducting the salt ghona inventory are presented in Figure 1.3.
5
Figure 1.3: Location map of the salt beds
6
Salt industry zones
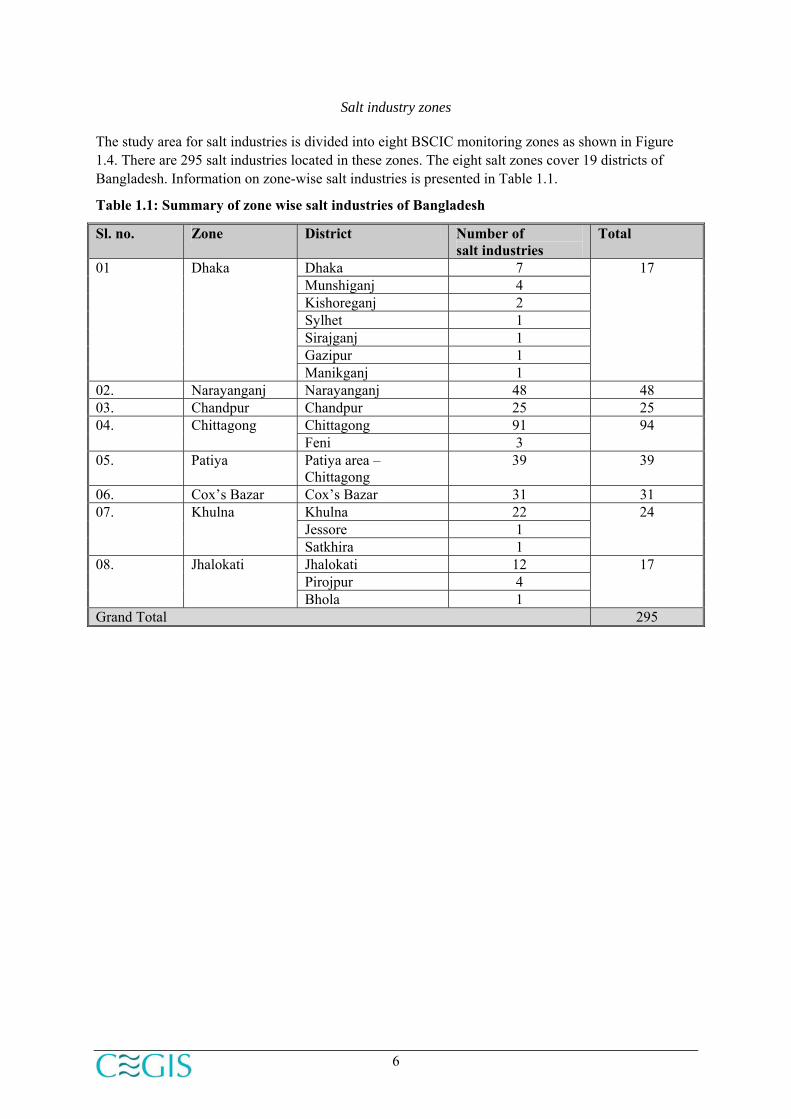
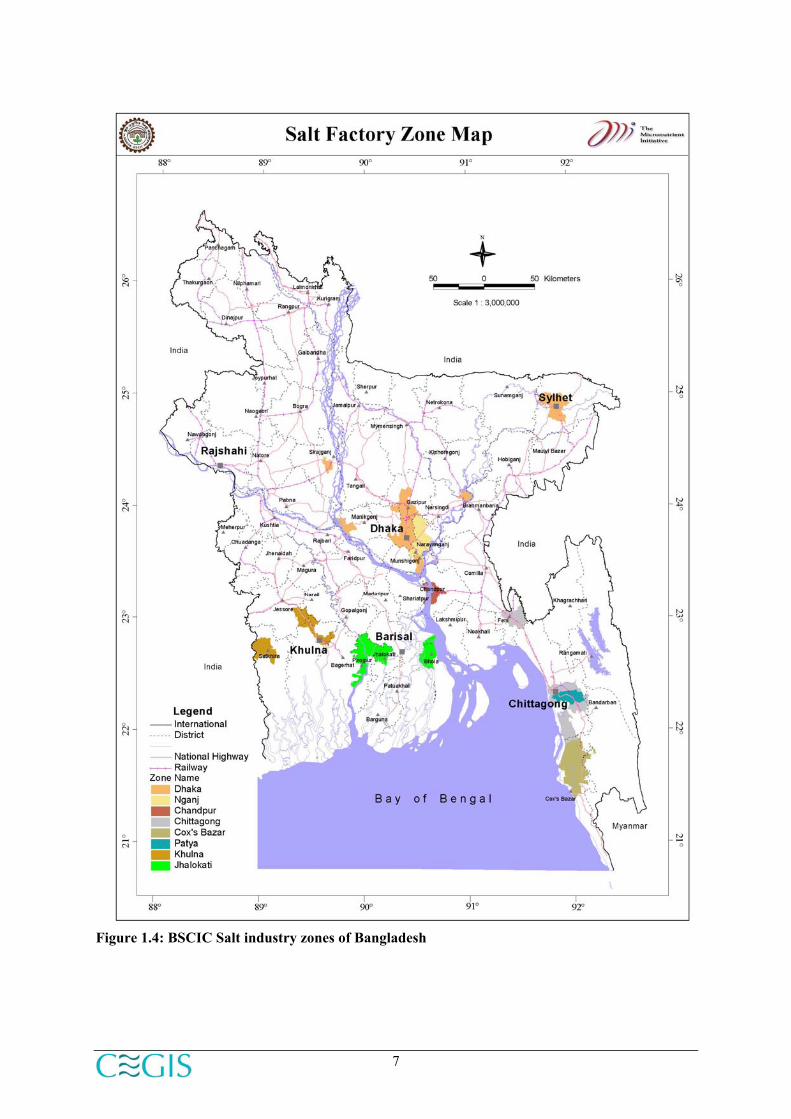
The study area for salt industries is divided into eight BSCIC monitoring zones as shown in Figure 1.4. There are 295 salt industries located in these zones. The eight salt zones cover 19 districts of Bangladesh. Information on zone-wise salt industries is presented in Table 1.1.
Table 1.1: Summary of zone wise salt industries of Bangladesh
Sl. no. Zone District Number of salt industries
Total
Dhaka 7 Munshiganj 4 Kishoreganj 2 Sylhet 1 Sirajganj 1 Gazipur 1
01 Dhaka
Manikganj 1
17
02. Narayanganj Narayanganj 48 48 03. Chandpur Chandpur 25 25
Chittagong 91 04. Chittagong Feni 3
94
05. Patiya Patiya area – Chittagong
39 39
06. Cox’s Bazar Cox’s Bazar 31 31 Khulna 22 Jessore 1
07. Khulna
Satkhira 1
24
Jhalokati 12 Pirojpur 4
08. Jhalokati
Bhola 1
17
Grand Total 295
7
Figure 1.4: BSCIC Salt industry zones of Bangladesh

8
Wholesale market/ Wholesaler
Wholesaler survey area covers the entire Bangladesh. The plan was to take information of 6 wholesalers from each division and one from each of 64 districts.
1.4 Objective
The overall objective of this project is to develop a GIS based Salt Industries Information System (GSIIS) software based on surveyed database to help to ensure appropriate level of iodine mixing at all levels. The specific objectives of the project are:
To establish a GIS based information system in order to support the monitoring of iodized salt production and distribution
To prepare an inventory of salt ghers/ghonas
To prepare a complete inventory on the small, medium and large scale salt producing units in the country
To prepare an inventory of wholesalers
To develop a GIS based salt iodization database
1.5 Deliverables
The following deliverables/outputs are made available to MI and BSCIC at the end of the assignment:
GIS based database on salt ghers, salt industries, and wholesalers
Web enabled GIS based mapping and monitoring system (software),
GIS maps on salt ghers, salt industries, wholesalers, salt centers and BSCIC office locations
Technical report, training and user manual of the software
1.6 Study Approach
The study was done following sequential steps: (i) Conceptual framework development, (ii) Data collection and processing (iii) Database development and data analysis, and (iv) Web based monitoring software development. The Approach has been presented in Figure 1.5. The detailed description of the study approach is given in the chapter 2.
Conceptual framework development: An initial discussion meeting with MI and BSCIC was done for getting a clear understanding on the existing salt iodization and monitoring process. Data need was also assessed based on the discussion meeting and review of reports of MI and BSCIC. Three questionnaires were developed based on assessed data need: (i) salt bed/gher survey form, (ii) salt Industries survey form and (iii) wholesaler survey form. All these questionnaires were finalized with MI and BSCIC through a consultation workshop. A field test of the questionnaire was also done.
Data collection and processing: Five teams consisting two members in each were formed to collect data using the questionnaires, GPS and digital cameras. The survey team members were trained on how to fill up the questionnaires in the field and how to collect data using GPS. After collection, all the data were entered and processed for uploading into the database system. Quality checking of the data was also done during data collection and entry.

9
Figure 1.5 : Flow daigram of the study approach
Database development, analysis of data and GIS mapping: After the collection and processing of data, a well organized database was developed. The database contains the tabular or attributes data, spatial or GIS data and other data (photographs, report). A detailed data analysis was done to assess the present status of the salt iodization process, including salt ghers/beds, salt industries including SIPs (Salt Iodization Plants) and wholesalers. GIS mapping of salt ghers, salt industries and wholesalers was also done.
Web enabled GIS based monitoring software development: For interactive viewing and monitoring of the salt iodization information and process a web enabled GIS based user-friendly monitoring software was developed. The monitoring software consists several modules which includes (i) data entry interface, (ii) data explorer / viewer, (iii) data analysis (query and reporting), and (iv) mapping interface.
1.7 Major Information on Status of Salt Industries and Iodization Process
During the preparation of the GSIIS the situation of salt industries and the salt iodization process were assessed. Major information collected for this assessment are:
Conceptual Framework Development
1. Literature Review 2. Discussion meeting 3. Data needs assessment 4. Questionnaire development 5. Consultation workshop
Data collection and Processing 1 Team formation 2 Training of field staff 3 Data collection 4 Quality checking 5 Data entry and processing
Database development, GIS Mapping and Data Analysis
1. Database development 2. GIS mapping 3. Data Analysis
Web enabled GIS based Monitoring Software
Development
Documentation 1 Technical Report 2 Software User Manual 3 Training Manual

10
Annual crude salt production, transportation process
Salt industry status, industrial production, iodization plants, quality control and iodine level monitoring process, pricing of processed salt
Average sales, iodine monitoring status, transportation process of wholesale salt
The detail of the survey and the situation analysis has been described in Chapter 5.
1.8 Structure of the Report
Chapter 1 of the report contains the background, study area description, objectives, deliverables and study approach. The details of the study methodology including software development are described in Chapter 2. The detail about field data (salt ghers, salt industries and wholesalers) collection process is described in Chapter 3. Chapter 4 contains the description of database development and GIS mapping. Chapter 5 contains the description of the present situation of salt iodization in Bangladesh based on collected data analysis. Chapter 6 deals with the GIS based mapping and monitoring software development. Finally, the conclusion and recommendations are presented in Chapter 7.

11
Chapter 2
Methodology
2.1 Introduction
The study approach has been described in section 1.6 of Chapter 1. The detailed description of the study however, is given in this chapter. A systematic process and steps were followed to develop the methodology. A simple diagram of the methodology is presented in Figure 2.1. The different steps of the methodology are described in the subsequent sections of this chapter.
Figure 2.1: Flow diagram of the methodology

12
2.2 Conceptual Framework
At the inception stage of the project, a conceptual framework was developed to carry out the study smoothly. The major activities under this step of the methodology were (i) literature review, and (ii) conceptual framework development. A brief description of these activities are given below:
Literature review
For conceptualization of the salt iodization process and framework development of the monitoring system, different study reports were reviewed, such as (i) “Situational Analysis and Inventory of Salt Industry in Pakistan” (Islamabad, 2005), (ii) Journal article on Salt Iodization, Monitoring, and Evaluation (SIME, Metab 2003), (iii) Iodine Deficiency Disorders and Salt Iodization in Azerbaijan (UNICEF, January 2006) and (iv) Iodine Deficiency Disorders Status Survey (Nepal, 2005). In addition, monitoring reports of the CIDD Project, BSCIC were also studied.
To develop the system several existing GIS based information and motoring system and national level databases has been studied before planning the overall conceptual framework under this task. The reviewed systems are: National Water Resources Database (NWRD) of WARPO, Coastal Zone Information System (CoZIS) of WARPO, Chittagong Hill tracts Resource Management System (CHARM) of European Union (EU) Integrated Coastal Resource Database (ICRD) of Ministry of Water Resources and Climate Change Database of DoE.
Conceptual framework development
A consultation workshop was organized to discuss the conceptual framework of the GIS based Salt Industries Information System (GSIIS). Officers from BSCIC, MI and professionals from CEGIS participated in the workshop and discussed the main data needs for the salt iodization monitoring process, initial framework of the software and users and uses of the monitoring system. The three major source of data and survey locations were identified for development of effective GIS based Salt Industries Information System, such as (i) salt farming beds / ghonas, where salt is cultivated (ii) salt industries including salt iodization plants and (iii) wholesalers/ distributors. The main options identified for the monitoring system were data entry/updating, data exploration, query and reporting and map viewing and printing. The overall conceptual framework of the GSIIS is shown in figure 2.2.

13
Figure 2.2: Conceptual framework of the study
2.3 Data Needs Assessment
Based on the conceptual framework and discussion at the consultation workshop the data needs for GSIIS were identified. The major groups of data required for the monitoring software were identified to be salt ghers or salt farming beds, salt industries, wholesalers, and other GIS data layers. Furthermore, these data were classified as Spatial / GIS and attribute data. Table 2.1 presents the data identified for the GSIIS.
Table 2.1: Example of identified data through need assessment
Major Group Attribute Salt Ghers Location, owners, salt production cost, production, type of salt cultivation,
quality control and transport process etc. Salt Industries Location, factory status, skilled manpower, SIP types and status, KIO3
requirement and used, type of salt produced, packaging, quality control process and average production etc.
Wholesalers Location, packaging, quality control process and average sales, transportation, monitoring of iodine level etc.
GIS data GPS location of salt ghers/ghonas, salt industries, wholesalers, administrative boundaries, rivers, roads, settlements, growth centers and BSCIC office locations (at district and field levels)
Photographs Photograph of salt bed, industries, wholesalers and other relevant features etc.

14
2.4 Questionnaire Development
For data collection from three data sources (ghers, industries and wholesalers), a well-defined questionnaires were developed covering all the aspects of salt iodization monitoring activities in Bangladesh in consultation with BSCIC and MI. Three separate questionnaires were developed: (i) salt factory survey form, (ii) salt bed survey form, and (iii) wholesaler survey form. The Salt factory survey form contained location information (union name, mauza name), name of owner, factory status, SIP information (type, status, maintenance cost, etc.), salt production information (type and source of crude salt, daily production, etc.), chemicals used, quality control, packaging and distribution and GPS location of the industries. The salt bed survey form contained the location of salt beds, name of owner, information related to salt bed preparation, transportation and GPS reading and quality control process etc. The wholesaler survey form contained the name of the wholesaler, location, iodine level monitoring status, transportation and distribution process and GPS reading of the wholesale market etc. The survey forms are presented in Appendix-A.
2.5 Collection and Processing of Data
The required data were collected from field and secondary sources (BSCIC). Five teams were formed to collect the data from different zones and districts. The data for creating a list of salt industries and salt farming ghonas was collected from different project offices (CIDD project and Salt Development project). The team members were equipped with the list of salt industries, salt beds, field questionnaires, GPS and digital cameras for collecting the data. The data collectors were trained for data collection by demonstration surveys before sending for full scale data collection.
Afterwards, the data was entered into the computer in the Access database format. Quality control of the data has been done through randomly checking, graphical presentation and visualization process. A detailed description of field data collection is given in Chapter 3.
2.6 Quality Control
Quality control is necessary for any kind of database development to get quality information. For this study, quality control was done during field data collection, processing, database development and analysis. It is to be mentioned that the field staff were well trained to collect accurate information. The project leader, field coordinator and field supervisor also supervised the field data collection and data processing activities. Data validation and consistency checking were done by database experts and programmers exclusively.
2.7 Database Development
Database is the heart of any information monitoring system. For this study, a comprehensive and well-organized database was developed. The GSIIS database has three major data groups, which are (i) basic data (administrative boundaries, rivers, roads etc.) (ii) salt related data (salt ghers, salt industries, wholesalers and BSCIC office locations at district level etc. and (iii) other data (photographs, documents, reports and special household data etc.). The database development activity included (i) organization of field data, (ii) organization of secondary data, and (iii) development of the data structure and relationships. The details about the database development are described in Chapter 4.

15
2.8 GIS Mapping
After developing a well-organized database, different types of GIS maps were prepared and incorporated into the GSIIS to help the planners in efficient decision-making. Different types of GIS maps produced under this study were (i) salt iodization monitoring zone map, (ii) salt farming area / zone map, (iii) salt industry location map, (iv) salt ghona map, (v) wholesaler or distributor location map, salt center location map and map showing district level BSCIC offices etc. The detailed description of GIS mapping is given in Chapter 4.
2.9 Data Analysis
A substantial amount of data was collected and incorporated into the GSIIS database. Analyses of different types of data were carried out under this study to know the situation of salt industries and the status of salt iodization in Bangladesh. These analyses can be categorized as situation analysis and salt flow route analysis. A brief description of this is given in 2.9.1 and 2.9.2.
2.9.1 Situation analysis
For situational analysis, both qualitative and quantitative methodologies were applied to assess the present situation of the common salt producing beds, salt industries, wholesale markets etc. The data was analyzed in an integrated manner as per the requirement of BSCIC. The details of the situation analysis are given in Chapter 5.
2.9.2 Salt flow route analysis
The salt transportation process is one of the important factors, which is related to the buying cost of salt industries and iodization process. After collecting the GPS location of salt ghonas, salt industry units and wholesaler data, a transportation network system or salt route flow analysis was done using the road network data available in CEGIS. The conceptual salt route flow diagram is presented in Figure 2.3. The salt route flow analysis was done in two contexts (i) considering the road network and (ii) considering the navigation routes (perennial rivers).
Figure 2.3: Salt transport and salt route flow analysis diagram
Retailers
Local transport (boats, trucks,
cargo etc.)
Trucks, small cargo, covered vans etc.
Rickshaw vans, human pullers etc.
Salt Bed Middlemen/Br
okers Salt factories Wholesalers
Road network
River network Consumers

16
Data Entry Interface
Data Viewer Interface
Data Analysis Interface
Mapping interface
2.10 Web based Monitoring Software Development
For sustainable use of the database and efficient salt iodization monitoring process, a dynamic and web based monitoring software was developed. The software development activity included (i) software framework design (ii) software development and (iii) deployment of the software. A brief description of these sub-activities is given in the subsequent sections.
2.10.1 Framework design of monitoring software
Following the ToR of the study and literature review the structure of the monitoring software was conceptualized. A series of consultation workshops were also organized to discuss the conceptual structure of the monitoring software. The simplified structure of GIS based Salt Industries Information Software (GSIIS) is presented in Figure 2.4.
Figure 2.4: Simplified Structure of GIS based Salt Industries Information System
2.10.2 Development of monitoring software
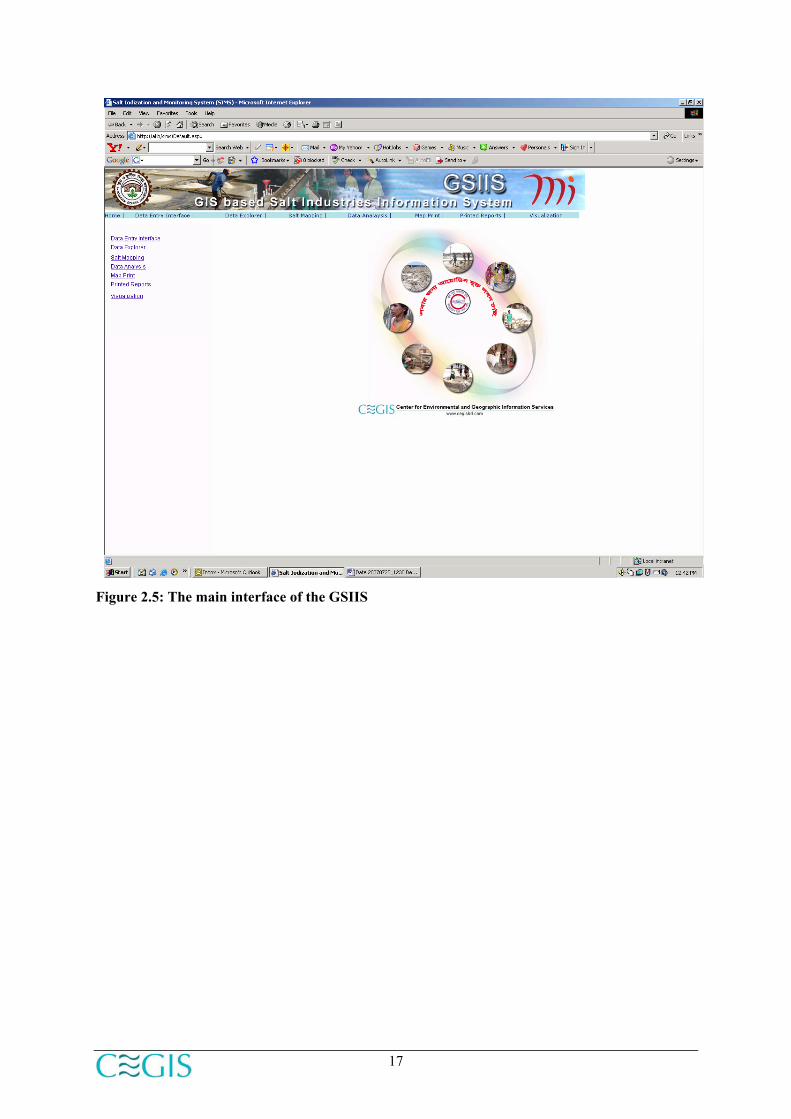
Dynamic and user-friendly monitoring software is required for a sustainable salt iodization monitoring process. Therefore, a GIS based web enabled prototype GIS based Salt Industries Information System (GSIIS) has been developed in Windows platform considering the functions and deliverables required for BSCIC and MI. The developed software will be able to incorporate spatial and attribute data to generate monitoring reports in tabular format and for simple mapping. It should be mentioned that the design of the system was done based on the framework defined in the conceptual stage. The software has been developed using open sources such as SharpMap and VS.Net. For security purpose the software has two levels of users (i) administrative user and (ii) normal user. The administrative user will have flexible options/access to give data input to the system as well as updating permission and printing access etc. The normal user will have browsing access and will be able to view and print information. The main interface of the monitoring software is shown in Figure 2.5.
2.10.3 Deployment of monitoring software
After developing the GSIIS, it has to be handed over to BSCIC/MI. Training has to be organized to develop the capacity of the professionals/officials concerned so that the system could be used efficiently for monitoring of salt iodization.
2.11 Documentation
A comprehensive technical report has been prepared mentioning the study methodology, situation analysis, conclusion and recommendations. A well-defined user manual of the monitoring software has also been developed to run the software smoothly.
17
Figure 2.5: The main interface of the GSIIS

18

19
Chapter 3
Field data collection
3.1 Introduction
For the development of the GIS based mapping and monitoring system for salt iodization in Bangladesh, several kinds of information were required from the field (primary) and secondary sources. Primary data was collected from the field for which several activities or processes were followed. The activities are described in subsequent sections of this chapter.
3.2 Field Team Formation
As stated before five field teams were formed to collect data from 19 districts under eight salt industrial zones of BSCIC. The salt gher information was collected from coastal zone and wholesaler information was colleted from 64 districts. The Each team consisted of two persons equipped with one GPS and one camera to collect data and for smooth operation of the field activities.
3.3 Preparation of Field Survey
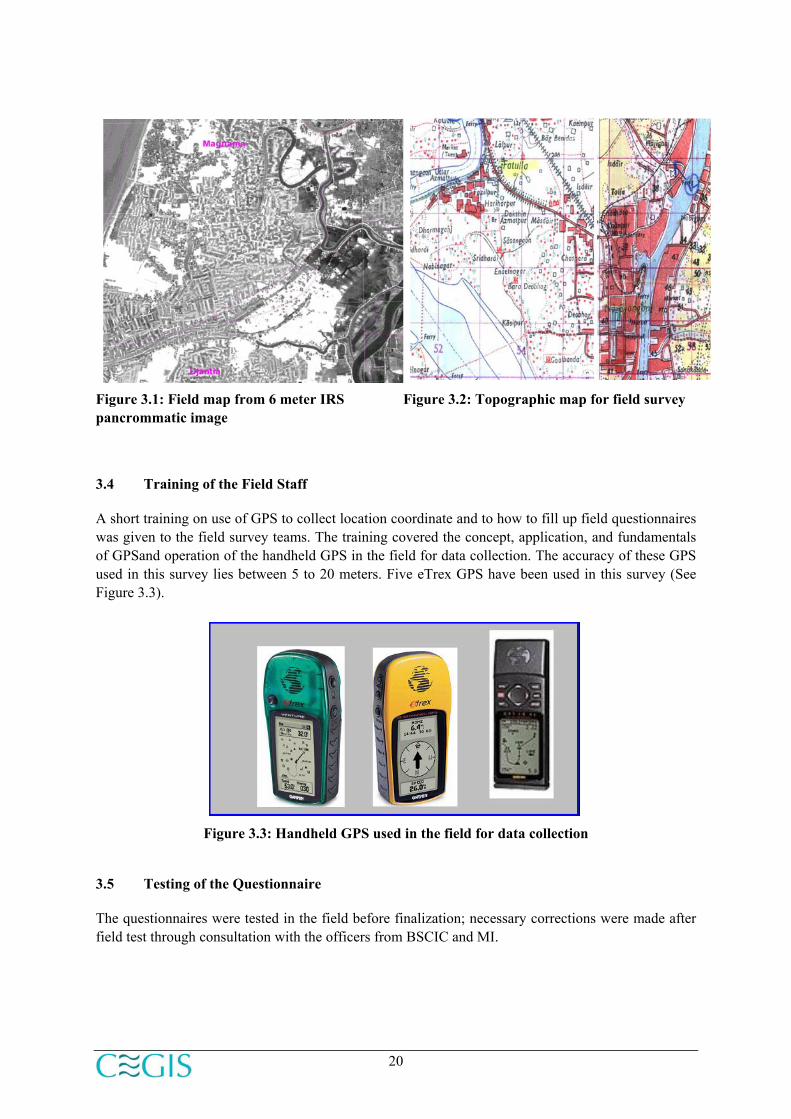
Different types of maps, including base maps for different zones, were produced to facilitate the field activities. These base maps were prepared using satellite images and a available topographic map of Survey of Bangladesh. Two samples base maps for two zones are shown in Figures 3.1 and 3.2. These maps were used to find the locations of salt ghers/ghonas, salt industries and wholesaler markets and for monitoring and supervising the field activities. The prominent features in base maps are administrative boundaries (of districts, upazilas, unions, mauzas), upazila and union headquarters , rivers, roads (national, regional, feeder roads, rural roads) and some important locations of the area. Along with the base maps satellite images of 2000 and 2001 were used for in field for easier identification of salt ghers. The base maps were used for the identification of survey features, survey areas, communication routes, and planning of field data collection. Then the survey questionnaire was developed as discussed before. Samples of the survey questionnaire has been presented in Appendix-A.
20
Figure 3.1: Field map from 6 meter IRS pancrommatic image
Figure 3.2: Topographic map for field survey
3.4 Training of the Field Staff
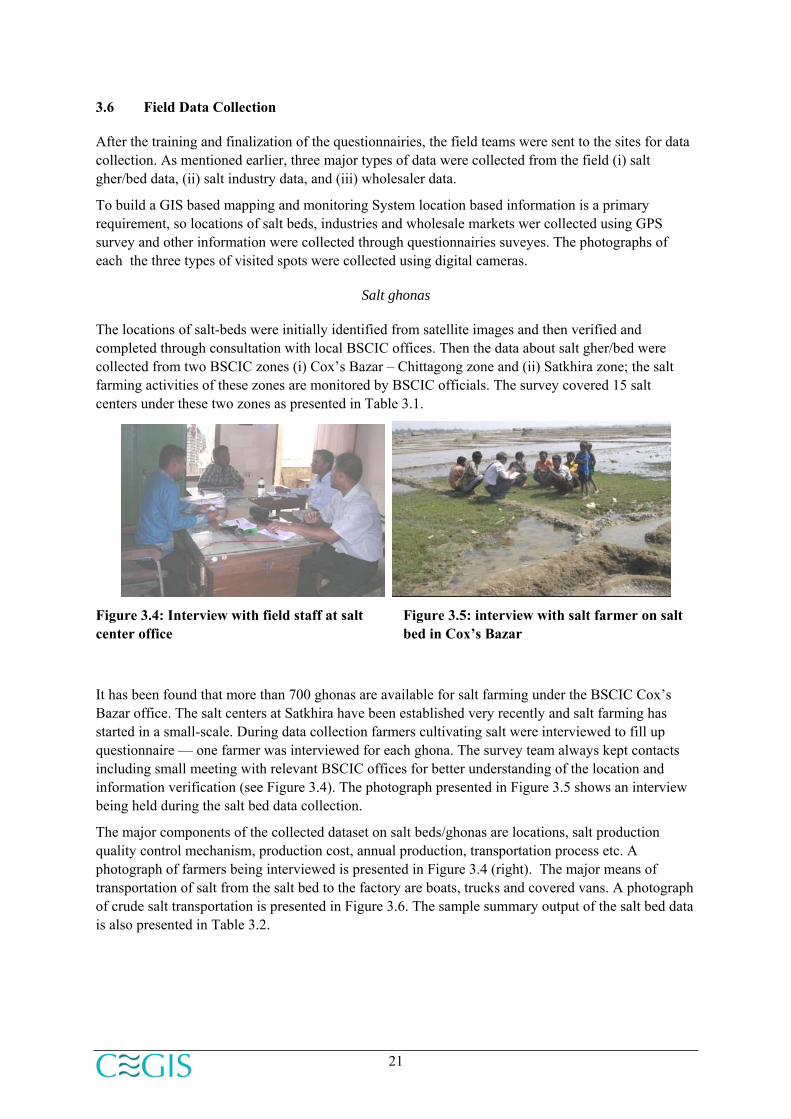
A short training on use of GPS to collect location coordinate and to how to fill up field questionnaires was given to the field survey teams. The training covered the concept, application, and fundamentals of GPSand operation of the handheld GPS in the field for data collection. The accuracy of these GPS used in this survey lies between 5 to 20 meters. Five eTrex GPS have been used in this survey (See Figure 3.3).
Figure 3.3: Handheld GPS used in the field for data collection
3.5 Testing of the Questionnaire
The questionnaires were tested in the field before finalization; necessary corrections were made after field test through consultation with the officers from BSCIC and MI.
21
3.6 Field Data Collection
After the training and finalization of the questionnairies, the field teams were sent to the sites for data collection. As mentioned earlier, three major types of data were collected from the field (i) salt gher/bed data, (ii) salt industry data, and (iii) wholesaler data.
To build a GIS based mapping and monitoring System location based information is a primary requirement, so locations of salt beds, industries and wholesale markets wer collected using GPS survey and other information were collected through questionnairies suveyes. The photographs of each the three types of visited spots were collected using digital cameras.
Salt ghonas
The locations of salt-beds were initially identified from satellite images and then verified and completed through consultation with local BSCIC offices. Then the data about salt gher/bed were collected from two BSCIC zones (i) Cox’s Bazar – Chittagong zone and (ii) Satkhira zone; the salt farming activities of these zones are monitored by BSCIC officials. The survey covered 15 salt centers under these two zones as presented in Table 3.1.
Figure 3.4: Interview with field staff at salt center office
Figure 3.5: interview with salt farmer on salt bed in Cox’s Bazar
It has been found that more than 700 ghonas are available for salt farming under the BSCIC Cox’s Bazar office. The salt centers at Satkhira have been established very recently and salt farming has started in a small-scale. During data collection farmers cultivating salt were interviewed to fill up questionnaire — one farmer was interviewed for each ghona. The survey team always kept contacts including small meeting with relevant BSCIC offices for better understanding of the location and information verification (see Figure 3.4). The photograph presented in Figure 3.5 shows an interview being held during the salt bed data collection.
The major components of the collected dataset on salt beds/ghonas are locations, salt production quality control mechanism, production cost, annual production, transportation process etc. A photograph of farmers being interviewed is presented in Figure 3.4 (right). The major means of transportation of salt from the salt bed to the factory are boats, trucks and covered vans. A photograph of crude salt transportation is presented in Figure 3.6. The sample summary output of the salt bed data is also presented in Table 3.2.

22
Figure 3.6: Photograph of the transpotation process of salt from salt bed to factory
Table 3.1: Salt Center under salt farming zones
Zone Name Name of Salt Center No of Salt Center
Choufoldondi Darbeshkata Dulhazara Fulchari Gomatoli Gorakghata Lemshikhali Matarbari Purbo Boro Ghona Sarol Teknaf
Cox’s Bazaar
Uttar Nolbila
12
Assasuni Koyra Satkhira Shyamnagar
3
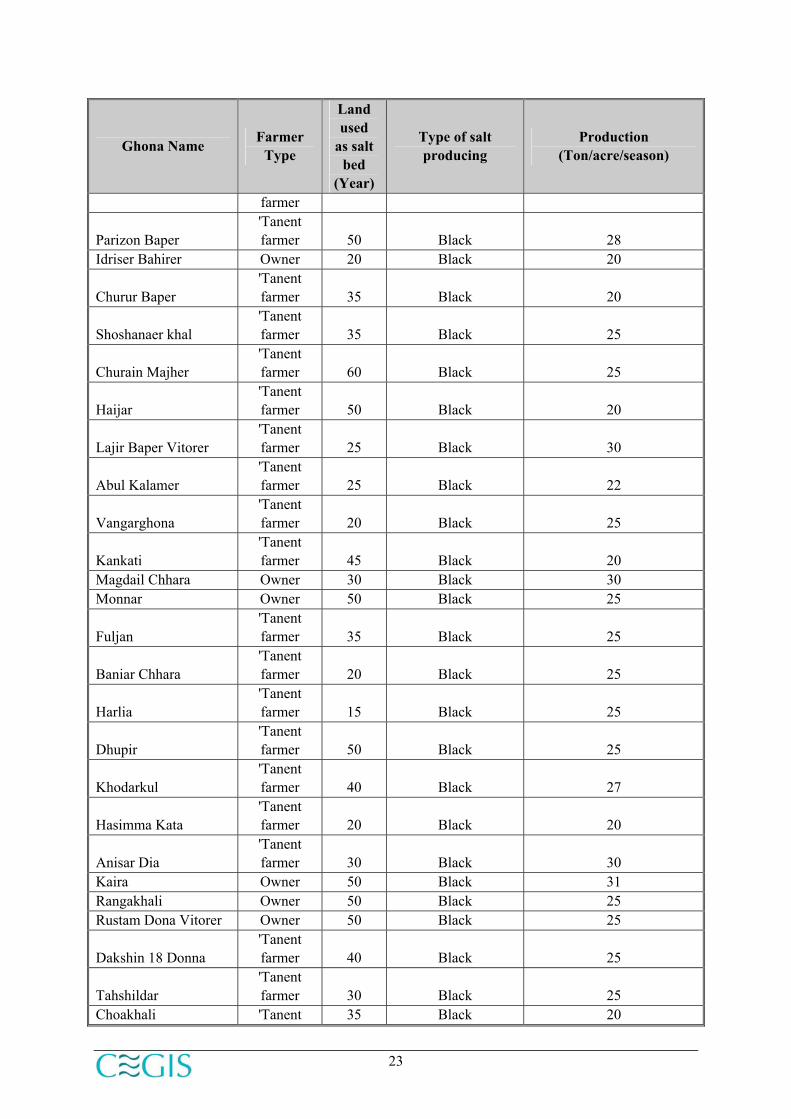
Table 3.2: Summary of salt farming data collected from the field :
Ghona Name Farmer Type
Land used
as salt bed
(Year)
Type of salt producing
Production (Ton/acre/season)
Naya Ghona 'Tanent farmer 50 Black 25
Farm 'Tanent farmer 30 Black 30
Uttar 18 Donna 'Tanent farmer 30 Black 30
Denar 'Tanent 30 Black 25
23
Ghona Name Farmer Type
Land used
as salt bed
(Year)
Type of salt producing
Production (Ton/acre/season)
farmer
Parizon Baper 'Tanent farmer 50 Black 28
Idriser Bahirer Owner 20 Black 20
Churur Baper 'Tanent farmer 35 Black 20
Shoshanaer khal 'Tanent farmer 35 Black 25
Churain Majher 'Tanent farmer 60 Black 25
Haijar 'Tanent farmer 50 Black 20
Lajir Baper Vitorer 'Tanent farmer 25 Black 30
Abul Kalamer 'Tanent farmer 25 Black 22
Vangarghona 'Tanent farmer 20 Black 25
Kankati 'Tanent farmer 45 Black 20
Magdail Chhara Owner 30 Black 30 Monnar Owner 50 Black 25
Fuljan 'Tanent farmer 35 Black 25
Baniar Chhara 'Tanent farmer 20 Black 25
Harlia 'Tanent farmer 15 Black 25
Dhupir 'Tanent farmer 50 Black 25
Khodarkul 'Tanent farmer 40 Black 27
Hasimma Kata 'Tanent farmer 20 Black 20
Anisar Dia 'Tanent farmer 30 Black 30
Kaira Owner 50 Black 31 Rangakhali Owner 50 Black 25 Rustam Dona Vitorer Owner 50 Black 25
Dakshin 18 Donna 'Tanent farmer 40 Black 25
Tahshildar 'Tanent farmer 30 Black 25
Choakhali 'Tanent 35 Black 20

24
Ghona Name Farmer Type
Land used
as salt bed
(Year)
Type of salt producing
Production (Ton/acre/season)
farmer
Abu Bakkarer 'Tanent farmer 7 Black 25
Ruatam Donar Bahirer – 1
'Tanent farmer 10 Black 25
Ruatam Donar Bahirer – 2 Owner 15 Black 20
Akkas Mofizer 'Tanent farmer 7 Black 25
Jona Kata 'Tanent farmer 2 Black 25
Name of salt center: Matarbari Upazila: Maheskhali Union Name: Matarbari
Salt industries data
As mentioned earlier, data on salt industries was collected from 8 salt iodization-monitoring zones, covering 19 districts of Bangladesh. The major information of salt industries collected from the field are location, functional status, SIP status, quality control process, quantity of salt production (iodized and non iodized), information on packaging, adequacy of internal monitoring process etc. The information on these factories was collected through physical inspections to factories either functional or nonfunctional. GPS reading and pictures of SIPs (Salt Iodization Plants) were also collected. The owners and high officials of the factories were also interviewed. Two photographs were taken during these inspection visits are shown in Figure 3.7.
(a) (b)
Figure 3.7: (a) Interview with the Production Manager of ACI salt industries at Naryanganj, (b) SIP at Mollah Salt Industries, Fatullah, Naryanganj
Wholesaler data.
Data on a total of 100 wholesalers was collected from 64 districts and six divisions covering the whole of Bangladesh. GPS reading and photographs of the wholesalers were taken during field data

25
collection. The wholesaler dataset contains mainly information on location, types of salt, iodine level monitoring system that the wholesalers use during collection and storage and salt mode transportation for distribution. A photograph of a wholesaler is shown in Figure 3.8.
Figure 3.8: Wholesaler at S.K Traders, Thakurgaoun District
Additionally, GPS locations of BSCIC offices in 64 districts were also collected to incorporate in GIS map as part of the GSIIS. Along with locations photographs of all the BSCIC offices have been collected and incorporated into the GSIIS. A sample photograph of a BSCIC office is shown Figure 3.9
Figure 3.9: BSCIC office at Natore (GPS reading: Latitude: 24ọ 24΄ 11.8”; Longitude: 89ọ 01΄
50.3”)
3.7 Quality Control of the Field Data
Quality control of the field data collection was done through very close monitoring of the field activities. Different measures were taken to execute quality control:
• Five groups leaders and three supervisors under guidance of a full time project leader comunicated persistently through moble phone for better management and control of the overall survey activities
• Field supervisors and field coordinators monitored the field work of the data collectors very closely
• Regular discussion meetings were done in the field between the group leaders and surveyors

26
• Close liaison were maintained with BSCIC offices
• Local field guides were hired as required for faster and accurate interpretations
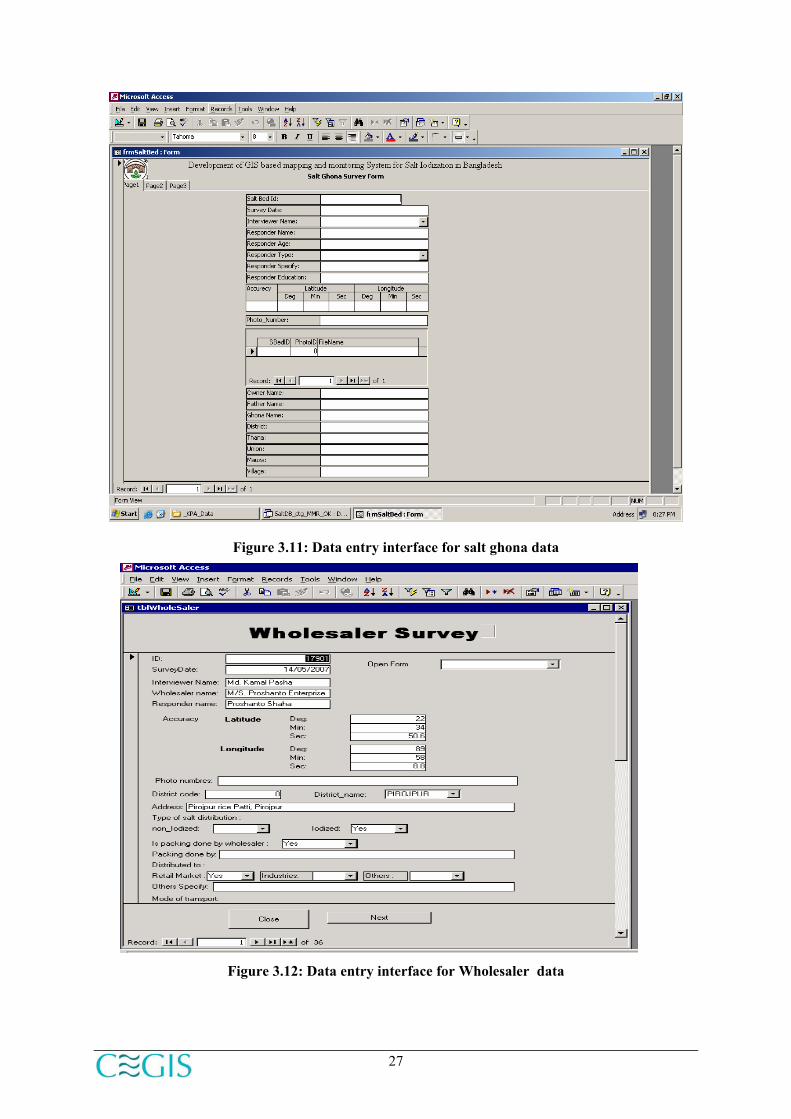
3.8 Field Data Entry
Different data entry interfaces were designed in MS Access database to enter the field data. The data entry interfaces are given in Figures 3.10 To 3.12. The data that was collected and recorded in forms were entered into the GSIIS database under the guidance of data entry supervisor and programmer to ensure correctness and consistencies. During entry, some parameters were automatically entered using developed lookup tables with interfaces such as locations (of upazilas, unions, mauzas etc), and zone name. All other parameters were then manually entered into the data entry software. Quality control of the data entry was done through randomly checked and graphical and visual interpretation. For data consistency, the names of administrative boundaries (union, mauza, etc.) were checked with BBS administrative names. Furthermore, all attribute data and spatial data were processed using ArcGIS software.
Figure 3.10: Data entry interface for salt factory data
27
Figure 3.11: Data entry interface for salt ghona data
Figure 3.12: Data entry interface for Wholesaler data
28
3.9 Observation of Field Staff on Salt bed and Salt Industries
According to the advice of MI and BSCIC the staffs prepared short notes on factory status, cleanness of factory, SIP condition, condition of packaging area and processing procedure, and hygienic condition of the factory and workers. Using the information and observations from respective field staffs, two field observation reports have been prepared; one for factory and another for Salt bed. These two reports are attached as Appendix-B.

29
Chapter 4
Database development & GIS mapping
4.1 Organization and processing of field data
A large amount of data was collected from the field according to the data need specified for GIS based Salt Industries Information Software. The field data comprised of numeric, text and GIS data. The numeric and text data are linked with GIS data as attribute data. The major attribute data linked to GIS data layers are: (i) surveyed data on salt ghona (ii) surveyed data on salt industries and (iii) surveyed data on wholesaler survey. These data are organized in MS-Access database and then imported in post GRE SQL. On the other hand the key GIS data includes (i) geographic location (GPS reading) of salt ghona, (ii) geographic location of salt industries, (iii) geographic location of wholesale markets /distributors, (iv) geographic location of BSCIC salt centers and (iiv) district level offices. It has already been mentioned that all field data were processed using MS Access. All GIS data were processed in ArcGIS platform. Both attribute and GIS data layers are kept in postGRE SQL database which are accessed from GSIIS through interactive interfaces.
4.2 Organization of secondary data
In addition to the primary data, some relevant secondary data were collected for this study from two main sources:
(i) Different project offices of BSCIC,
(ii) CEGIS.
A list of few secondary data sets with their sources is shown in Table 4.1.
Table 4.1: Secondary data with their sources
Name of secondary data Sources of data List of salt industries including SIPs CIDD, Project BSCIC, Dhaka List of salt centres, salt ghonas (cluster of salt beds) Salt Development Project, Cox’s Bazar Administrative boundaries (thana, union, mauza, etc.) CEGIS, Settlements, roads, rivers, water bodies, etc. CEGIS
Besides these, high-resolution IRS image (6 meter resolution) was used to locate the salt farming area and industries. It is important to note that, 6 meter resolution IRS can visualize the physical features and landmarks very precisely. A sample high resolution image showing the salt farming area is presented in Figure 4.1

30
Figure 4.1: Sample satellite image showing salt farming area
4.3 Integration of processed data
After the collection and processing of primary and secondary data, all the data were integrated into a database system. The different types of data collected and processed for this study are:
Tabular data (numeric and text),
Spatial or GIS data (GIS maps, GPS coordinate of sites),
Other data. (Photographs, reports etc)
Tabular data
The tabular data consisted detail information on salt beds/ghonas, salt industries and wholesaler. For simplicity the data were organized first in MS Access Database and kept in different tables for easier entry, verification and validation; later the cleaned data were imported to store in postGRE SQL for better security and management and efficient access from web based GSIIS. Some important attribute data is presented in Table 4.2.

31
Table 4.2: Some important attribute data
Major data group Attribute
Salt Ghona
Survey date, ghona’s name, types of farmer, use of land after salt farming, salt bed type, chemical used, total production, production cost, mode of transport, etc.
Salt Industries Zone name, factory name, factory status, SIP status, type of salt produced, salt production, stock position, salt processing step, potassium requirement, monitor status etc.
Wholesaler Wholesaler name, type of salt wholesaling, packaging, distribution, mode of transport, source of salt, storage information and iodine monitoring status etc.
Household Survey
Survey date, name of household, education, household size, patient status, and awareness etc.
Spatial /GIS data
The GIS data layers consist of information on location of salt ghona, salt industries, salt centres, BSCIC office location and basic geographic data (road, river and administrative boundary etc.). Moreover, a household survey on iodized salt intake and goiter patient has also been conducted as a sample case. All the spatial data were processed in ArcGIS platform and integrated into the GSIIS database.
Other data
Beside the above-mentioned data other important information such as photographs of salt industries, salt iodization plants, salt beds, BSCIC offices and other important photographs, reports and documents etc. were collected, processed and integrated into the GSIIS database.
A total of 3170 photographs were taken during the survey of which 1821 are of salt industries, 1074 are of salt bed, 200 are of wholesaler and 75 are of BSCIC offices. All these photographs are incorporated into GSIIS and linked with relevant data interfaces. Moreover, three nos. of salt related reports are also included into the GSIIS.
4.4 GSIIS Database
A well-structured database system was developed to entry process and manage the data in GSIIS. The conceptual diagram of the GSIIS database is presented in figures 4.2. A brief description of salt related GIS data layers is given below:

32
Figure 4.2: Data Structure of the GSIIS database
salt ghona / salt bed
The ghona’s spatial or GIS data layer were created in ESRI’s shape file format (ghona.shp). The key associated items of the GIS data layer on ghonas is presented in Table 4.3
Table 4.3: Items of GIS data layer on salt ghonas
SL Item Description 1 SBedID Identification code of salt ghona 2 SaltCenter Name of salt center 3 Ghona_Name Name of ghona 4 Region Name of region
salt industries
Salt industry or factory were also created in ESRI’s shape of format (e.g. factory.shp). The major associated items of the GIS data layer on salt factories are presented in Table 4.4
Table 4.4: Items of GIS data layer on salt factories
SL Item Description Remarks
1 Factory_Id Identification code of factory
The item was used to join data with the attribute table for analysis
2 Zone_name Name of zone
3 Factory_name Name of factory
GSIIS Database
Basic Data Database Salt Related Data Other Data Spatial (Goiter patient location) Attribute (Union, Mouza, education, awareness, type of salt intake etc.) Photographs, Documents etc. Spatial Data
Administrative Boundary Road Network Railway River System
Spatial Data Salt Factory Location Salt Field Location Wholesaler Location BSCIC Location Salt Center Location
Attribute Data Iodine Monitoring Data Factory Data Wholesaler Data Crude Salt Farming Data

33
wholesaler
Similar to salt ghona and industries the attribute data of salt wholesaler was created in ESRI’s shape format (e.g. wholesale.shp). The major associated items of the GIS data layer on salt wholesalers are presented in Table 4.5
Table 4.5: Items of GIS data layer on salt wholesalers
SL Item Description Remarks 1 WSellID Identification code of wholesaler The item was used to join data with the
attribute table for analysis 2 Distname Name of district 3 Divcode Division identification code 4 Divname Division name
Similarly the GIS data layers of salt centers and BSCIC office locations were created in ESRI’s shape e format (e.g. center.shp). The key associated items of the these GIS data layer are presented in tables 4.6 and 4.7 respectively.
Table 4.6: Items of GIS data layer on salt centers
SL Item Description
1 Region Name of region
2 SaltCentre Name of salt centre
3 Type Type of salt center
Table 4.7: Items of GIS data layer on BSCIC office location
SL Item Description
1 Name Name of district of office location
2 Type Type of office
4.5 GIS mapping
Information related to the mapping of salt iodization monitoring was one of the main tasks of this study. The major GIS maps prepared for this study are salt ghona location maps, salt industry location maps and wholesaler location maps. Besides this, some other basic maps were also produced. These include (i) salt iodization monitoring zone maps, (ii) salt centre location maps and (iii) BSCIC office location maps. Furthermore, a substantial number of salt related maps were produced using data analysis and query results. A list of those maps is presented in Table 4.8. All the listed maps are presented in Annex- A. It should be noted that the developed web based GSIIS software has a provision for producing sample maps for reporting and printings.

34
Table 4.8: Sample list of Salt related GIS maps
Group Map title Bed Salt Field (GPS survey) Location Map Bed Salt Field (from IRS) Location Map Bed Salt Center Location map Bed Regionwise Salt center location map (cox) Bed Salt Centerwise Ghona Map Bed Crude salt production type (black / polythene) Bed Salt center wise farmer type (owner / tenant) map Bed Density of farmer (Polygon/Pie Chart/Dot density) Bed Sample ghona boundary map from GPS survey Bed Salt Transportation route map (road / waterway) Bed Route of salt flow analysis map Bed Salt Bed Age Map Bed Regionwise Salt center location map (satkhira) Factory Salt Factory Zone Map Factory Salt Factory Map Factory Zonewise Salt Factory Map – Dhaka Factory Zonewise Factory Functional Status Map - Dhaka Factory Zonewise Salt Factory Map – Nganj Factory Zonewise Salt Factory Map - Chandpur Factory Zonewise Salt Factory Map - Chittagong Factory Zonewise Salt Factory Map – Patiya Factory Zonewise Salt Factory Map - Cox's Bazar Factory Zonewise Salt Factory Map – Khulna Factory Zonewise Salt Factory Map - Jhalokati Factory SIP Location Map Factory Zonewise SIP Location Map Factory Factory Functional Status Map Factory Zonewise Factory Functional Status Map - Nganj Factory Zonewise Factory Functional Status Map - Chandpur Factory Zonewise Factory Functional Status Map - Chittagong Factory Zonewise Factory Functional Status Map - Patiya Factory Zonewise Factory Functional Status Map - Cox's Bazar Factory Zonewise Factory Functional Status Map - Khulna Factory Zonewise Factory Functional Status Map - Jhalokati Factory SIP Functional Status Map Factory Zonewise SIP Functional Status Map - Dhaka Factory Salt production type map Factory Salt production type map – zone wise Factory Iodine level (Laboratory test result) map Factory Zonewise Iodine level (Laboratory test result) map Factory SIP upgraded Map Factory Zonewise SIP upgraded Map Factory SIP Type Map Factory Zonewise SIP type map Factory Factory size map (small/medium/large) Factory Source of Crude Salt

35
Group Map title Factory Iodine Stock Position Map (required/used/stock) Factory Zone wise Factory Capacity map (small/medium/large) Factory Area wise Factory capacity map (A4) Factory Chandpur Zone Factory Map Gen BSCIC Office Location Map Gen Divisionwise BSCIC Office Location Map WS Wholesaler Location (sample) Map WS Wholesaler Location (sample) map – division wise WS Type of salt distribution WS Storage information WS Sell level map – salt type wise WS Iodine level (Laboratory test result) map – division wise WS Mode of Transportation map for distribution WS Iodine monitoring (self)
Salt iodization monitoring zone
To take decisions on iodization monitoring activities, salt iodization monitoring zone maps are essential. Based on the factory, district and zone names provided by CIDD project office of BSCIC, the GIS based zones maps were prepared (see Figure 1.4).
Salt farm/ Ghona
The term ‘ghona’ means a cluster of several salt beds. The ghona maps were prepared at three levels: national, regional and salt centre wise. A sample ghona map is presented in Figure 4.3.
Salt industry
All salt industry locations are stored in GIS as point data layer and the relevant attributes are linked. The salt industry map has been prepared at national and zonal levels. A sample of zone wise salt factory map is presented in Figure 4.4.
Wholesaler
Salt wholesaler maps were prepared in both national and division level. A sample of division wise salt wholesaler map has been presented in Figure 4.5.
Other maps (BSCIC office and salt centres)
In addition to the above-mentioned maps, some other maps such as salt centre location maps, BSCIC office location maps etc. were also prepared. The salt centres and BSCIC office location maps were prepared in both national and zonal level. A sample BSCIC office location map is presented in Figure 4.6.
To locate the maps clearly some other basic background GIS layers like roads, rivers and administrative boundaries (national, district, union and mouza etc.) were also prepared and added into the GSIIS database.

36
Figure 4.3: Salt center wise ghona (cluster of salt bed) map
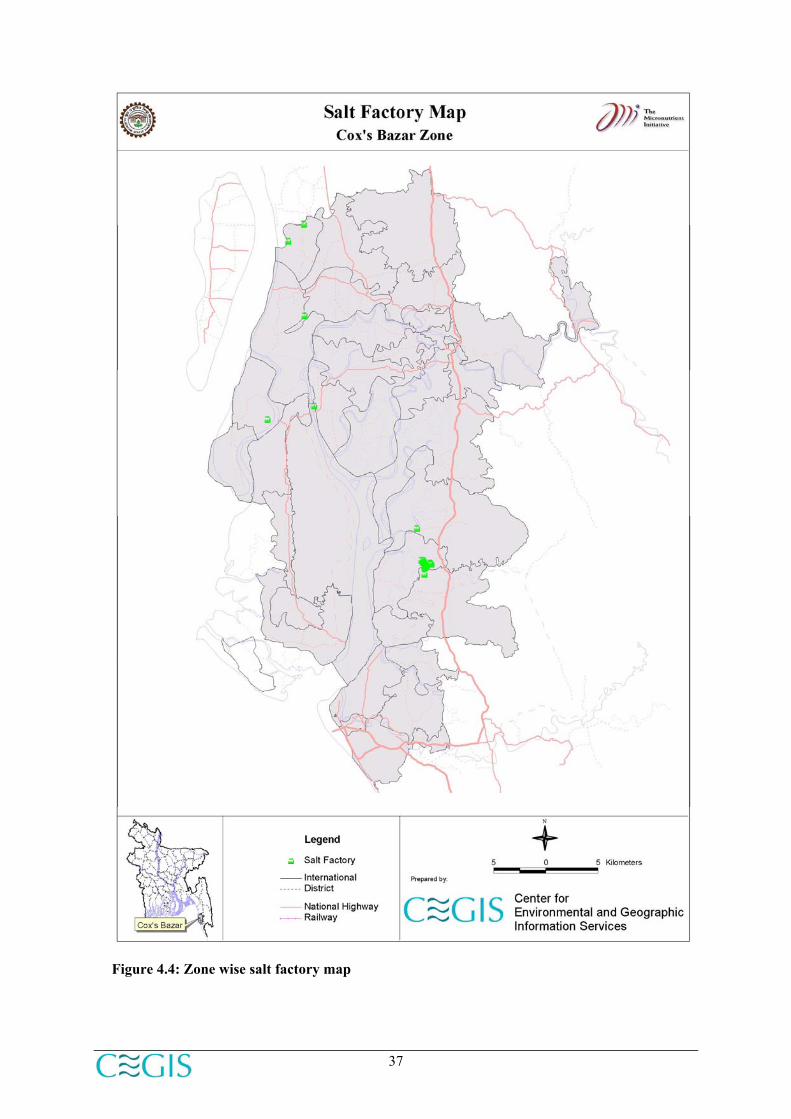
37
Figure 4.4: Zone wise salt factory map
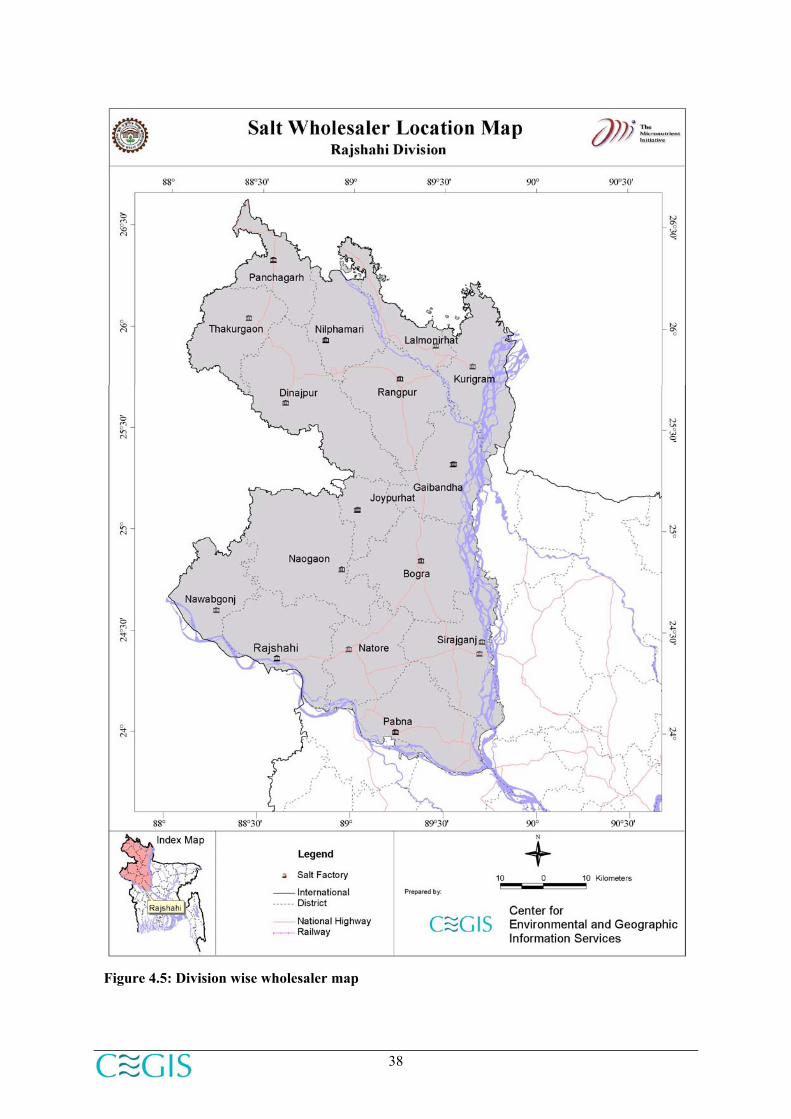
38
Figure 4.5: Division wise wholesaler map
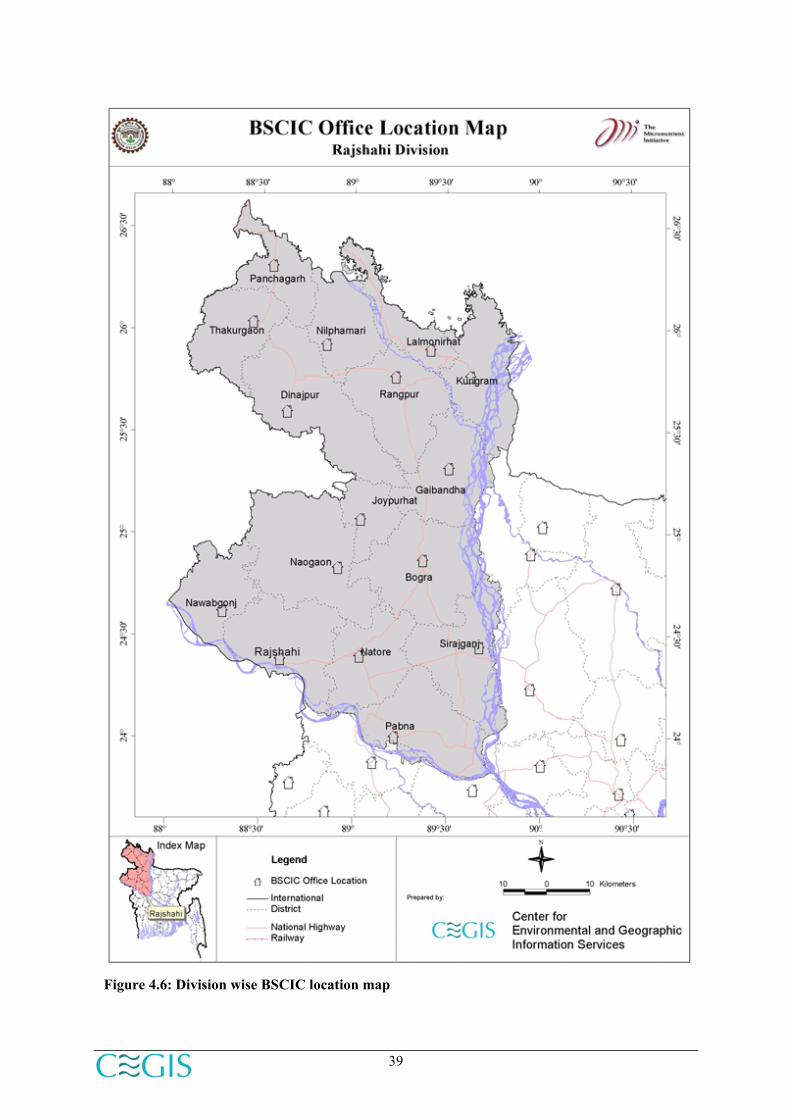
39
Figure 4.6: Division wise BSCIC location map

40

41
Chapter 5
Salt Iodization Situation Analysis
The knowledge of salt iodization situation is important for planning of future action to mitigate the IDD. In this respect the current salt iodization situation needs proper quantitative and qualitative analysis. The survey on ghona/gher, industries and wholesale gives information of the salt iodine chain. Under this study the survey covered almost whole country which includes:
(i) near about 750 salt ghonas (cluster of salt beds) at two distinct coastal areas of Bangladesh: Cox’s Bazar-Chittagong and Satkhira.
(ii) near about 300 salt industries situated in the eight Salt Iodization Monitoring Zones of BSCIC, and
(iii) more than 150 wholesalers from six divisions and 64 districts of Bangladesh.
This chapter dealt with the situation analysis of the salt iodization and monitoring status of Bangladesh. The detailed summary of data analysis results for salt ghonas, salt industries and wholesaler are presented in Annex-B.
5.1 Salt ghonas data analysis
In Bangladesh, salt farming is being practiced with group of farmers (either by owner or tenant) with different number of continuous salt beds in specified areas. Cluster of this seamless bed is termed as ‘ghona’ and more than 750 ghonas have been identified during field survey, which covered more than 60,000 acre of land. BSCIC Salt Development Project office is also monitoring all salt production beds ghona-wise. CEGIS field team collected list of ghonas from BSCIC, Cox’s Bazar and the detailed information of these ghonas were collected by interviewing one farmer from each ghona.
5.1.1 Major salt farming areas
Major salt farming area is situated in Cox’s Bazaar coastal region including few areas of Chittagong coastal belt. Apart from that, substantial amount of new land in Satkhira area has been taken under for the purpose of salt farming and all necessary preparation are almost completed. The substantial amount of salt production will start from the coming year (year 2008). The areas of major salt farming of Bangladesh are presented in Figure 5.1.
5.1.2 Sampling of salt bed survey
More than 50,000 farmers are involved in salt farming in Bangladesh. Thus, it is a massive task and required huge time to collect information from each and every salt bed or from individual farmers. Therefore, one farmer was interviewed from each ghona (BSCIC provided a list consists of 746 ghona) in Cox’s Bazar region and five sample farmers from slat beds of the Satkhira region. The reasons of taking only five sample farmers at Satkhira region are: (i) salt farming was introduced in recent years and it was not possible to identify salt bed clusters (ghona), and (ii) individual farmers have been practicing salt farming in scattered way. As BSCIC is implementing lot of programs to assist the salt farmers in Satkhira, it is expected that from next year the salt farming will be as precise as present salt farming in the Cox’s Bazar region.

42
Figure 5.1: Salt Farming Areas of Bangladesh
5.1.3 Salt bed preparation and production cost
During the questionnaire survey, the surveyors collected the cost parameters which were involved in the production of crude salt. They are namely (i) cost of labour, (ii) food allowance for labour, (iii) cost of field equipments used for land preparation, (iv) lease money for the leasing land, (v) polythene cost for polythene salt bed and, (vi) other costs which includes cost of pumping, sluice gate operating, etc. However, a formula was developed to calculate the production cost of crude salt as stated below:
Production cost of crude salt, PC =A/B (Tk./ton)
Where,
PC = Production cost per ton
A = Total salt production in ton during the whole season for specific bed/gher or area
B = Total salt production cost in taka during the whole season
Further,
B = B1 + B2 + B3 + B4 + B5 + B6
Where
(i) B1=Total Labour Cost (bed preparation cost + labour cost for harvesting period)
(ii) B2= Food cost (for labor)
(iii) B3=Field Equipment (leveler for land leveling +other etc.)
(iv) B4=Lease Money (if any)
(v) B5=Polythene Cost (Actual Cost / 2) for only polythene salt
(vi) B6=Other Costs (Water entering +Sluice Gate + Chemical + Etc.)

43
It should be noted that the production cost of crude salt was calculated for two groups of farmer separately and they are:
1. Production cost of crude salt for landowner (land owner is farmer himself) and;
2. Production cost of crude salt for tenant farmer.
The average production cost of the crude salt is calculated from the representative survey data. The tenant farmer pays lease money for the farm land and this amount is added to the production cost. Therefore, the production cost of crude salt for tenant farmer is higher than the production cost of landowner farmer.
From the collected and processed data, center wise average production cost (BDT/acre /season) for both landowner and tenant farmer was analyzed and presented in Table 5.1.3.1. According to the Table, average production cost of black and polythene salt for the landowner framers are 32,642 and 45,656 (Taka /acre/season) respectively. Whereas, the average production cost of black and polythene salts for the tenant farmers are 53,818 and 65,168 (Taka /acre/season) respectively. The production costs of both black salt is about 65% higher for tenant farmers, where as it is 43% in case of polythene salt. But in both case the selling price of crude salt to the factory end remains same. That means the tenant farmers are in vulnerable to compete with the landowners.
Centre wise production costs for landowner and tenant farmers was also analyzed and presented in Figure 5.1.3.1 and 5.1.3.2 respectively. The figure shows that the costs of polythene type of crude salt are much higher than black salt. According to the Figure 5.1.3.2, there is no tenant farmer under Koyra centre in Satkhira, as salt farming are practiced only by the landowner farmers.
Table 5.1.3.1: Centre wise crude salt production cost from representative sample survey (2007)
Owner Tenant Farmer Salt Center Black Polythene Black Polythene
Assasuni 55000 Choufoldondi 32000 39333 56871 67278 Darbeshkata 31500 37600 53882 66375 Dulhazara 32625 50800 Fulchari 32250 54191 62500 Gomatoli 38100 55000 65594 Gorakghata 33073 45917 56567 71654 Koyra 60000 Lemshikhali 52296 77262 Matarbari 32379 59461 Purbo Boro Ghona 33967 47375 56108 69588 Sarol 32500 40333 50273 60000 Shyamnagar 58000 Teknaf 32750 41000 41230 Uttar Nolbila 33488 41167 57845 70200 Average production cost 32642 45656 53818 65168
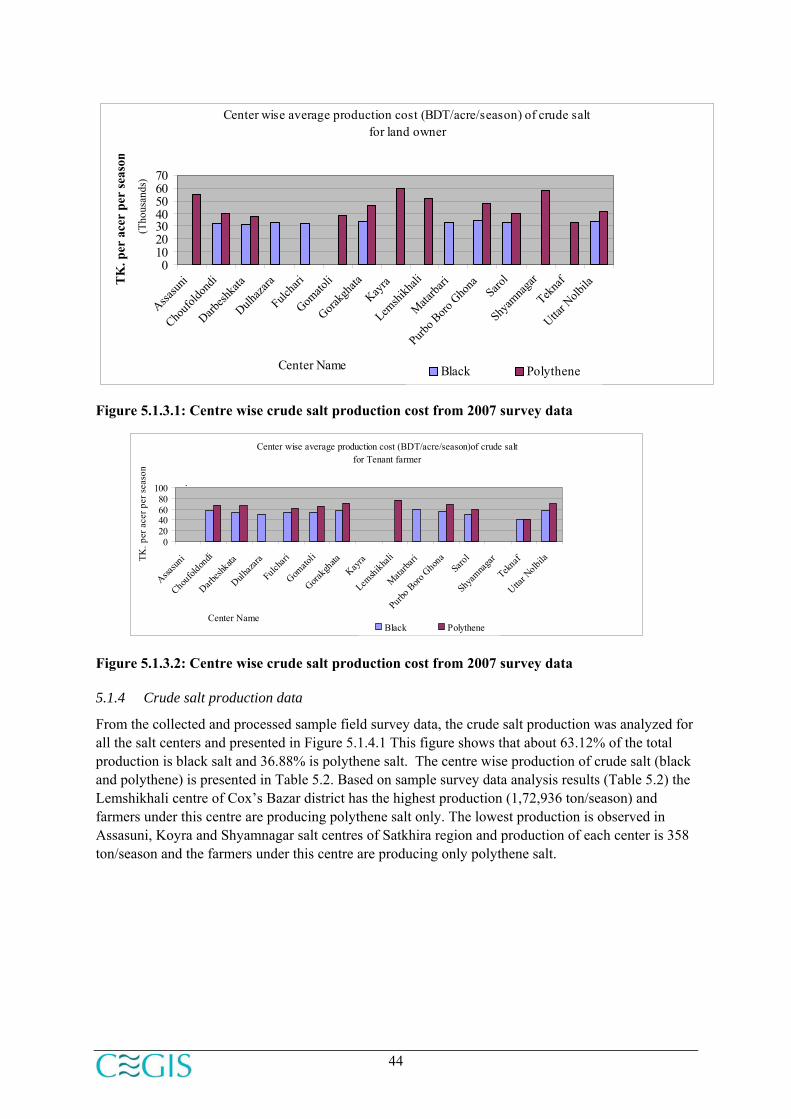
44
Center wise average production cost (BDT/acre/season) of crude salt for land owner
010203040506070
Assasun
i
Choufo
ldond
i
Darbesh
kata
Dulhaza
ra
Fulcha
ri
Gomato
li
Gorakg
hata
Kayra
Lemshi
khali
Matarba
ri
Purbo B
oro G
hona
Sarol
Shyam
naga
r
Tekna
f
Uttar N
olbila
(Tho
usan
ds)
Center Name
TK
. per
ace
r pe
r se
ason
Black Polythene
Figure 5.1.3.1: Centre wise crude salt production cost from 2007 survey data
Figure 5.1.3.2: Centre wise crude salt production cost from 2007 survey data
5.1.4 Crude salt production data
From the collected and processed sample field survey data, the crude salt production was analyzed for all the salt centers and presented in Figure 5.1.4.1 This figure shows that about 63.12% of the total production is black salt and 36.88% is polythene salt. The centre wise production of crude salt (black and polythene) is presented in Table 5.2. Based on sample survey data analysis results (Table 5.2) the Lemshikhali centre of Cox’s Bazar district has the highest production (1,72,936 ton/season) and farmers under this centre are producing polythene salt only. The lowest production is observed in Assasuni, Koyra and Shyamnagar salt centres of Satkhira region and production of each center is 358 ton/season and the farmers under this centre are producing only polythene salt.
Center wise average production cost (BDT/acre/season)of crude salt for Tenant farmer
020406080
100
Assasun
i
Choufol
dondi
Darbesh
kata
Dulhaza
ra
Fulch
ari
Gomato
li
Gorakg
hata
Kayra
Lemshikh
ali
Matarba
ri
Purbo B
oro Ghon
aSa
rol
Shyam
nagar
Teknaf
Uttar N
olbila
.Center Name
TK. p
er a
cer p
er s
easo
n
Black Polythene
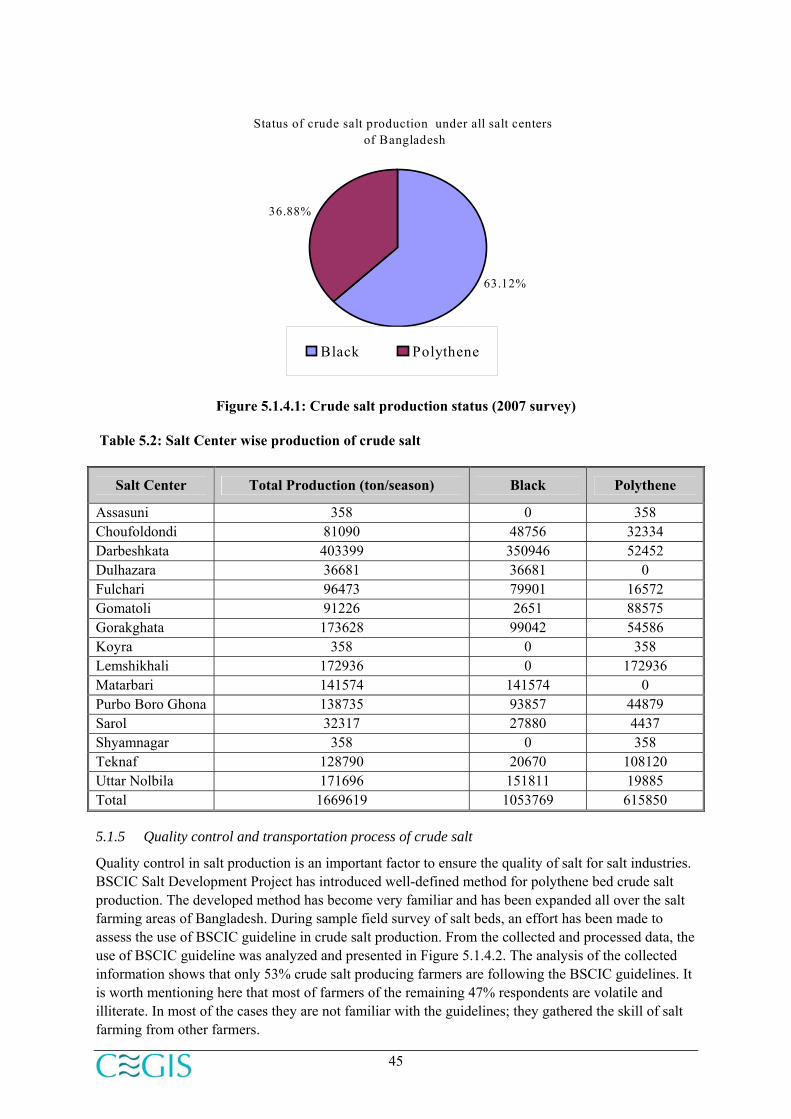
45
Status of crude salt production under all salt centers of Bangladesh
63.12%
36.88%
Black Polythene
Figure 5.1.4.1: Crude salt production status (2007 survey)
Table 5.2: Salt Center wise production of crude salt
Salt Center Total Production (ton/season) Black Polythene
Assasuni 358 0 358 Choufoldondi 81090 48756 32334 Darbeshkata 403399 350946 52452 Dulhazara 36681 36681 0 Fulchari 96473 79901 16572 Gomatoli 91226 2651 88575 Gorakghata 173628 99042 54586 Koyra 358 0 358 Lemshikhali 172936 0 172936 Matarbari 141574 141574 0 Purbo Boro Ghona 138735 93857 44879 Sarol 32317 27880 4437 Shyamnagar 358 0 358 Teknaf 128790 20670 108120 Uttar Nolbila 171696 151811 19885 Total 1669619 1053769 615850
5.1.5 Quality control and transportation process of crude salt
Quality control in salt production is an important factor to ensure the quality of salt for salt industries. BSCIC Salt Development Project has introduced well-defined method for polythene bed crude salt production. The developed method has become very familiar and has been expanded all over the salt farming areas of Bangladesh. During sample field survey of salt beds, an effort has been made to assess the use of BSCIC guideline in crude salt production. From the collected and processed data, the use of BSCIC guideline was analyzed and presented in Figure 5.1.4.2. The analysis of the collected information shows that only 53% crude salt producing farmers are following the BSCIC guidelines. It is worth mentioning here that most of farmers of the remaining 47% respondents are volatile and illiterate. In most of the cases they are not familiar with the guidelines; they gathered the skill of salt farming from other farmers.

46
Status on use of BSCIC Guideline for quality control of salt crude salt production
47%
53%
NoYes
Figure 5.1.4.2: Crude salt production status (2007 survey)
5.1.6 Mode of Transportation for carrying crude salt
From the collected sample survey data, the status of crude salt transportation was analyzed and presented in Figure 5.1.6.1. According to this figures, more than 60% of the total crude salts is transported by boat as it costs less, 28% is transported by both boats and trucks and only 4% is transported by only trucks. Further, zone wise status of crude salt transportation was analyzed and presented in Figure 5.1.6.2. The figure shows that, the highest numbers of respondents at Lemshikhali are carrying the salt to the factory by using boats. But in Teknaf, the maximum respondents are using trucks for carrying the salt to the factory.
Status of mode of transport for crude salt
68%4%
28%
Boat Truck Boat,Truck
Figure 5.1.6.1: Mode of transportation for carrying crude salts

47
Center wise status of mode of transport for carrying crude salt
1
94
9
2938
81
100
63 67
29
3 1
67
0
20
40
60
80
100
120
Assasun
i
Choufo
ldond
i
Darbesh
kata
Dulhaza
ra
Fulcha
ri
Gomato
li
Gorakg
hata
Kayra
Lemshi
khali
Matarba
ri
Purbo B
oro G
hona
Sarol
Shyam
naga
r
Tekna
f
Uttar N
olbila
Center Name
Num
ber o
f Gho
na
Boat Truck Boat,Truck
Figure 5.1.6.2: Zone status of mode of transportation for carrying crude salts
5.2 Salt factory data analysis
5.2.1 Coverage of the survey
According to the list of BSCIC, there are 295 salt industries situated in eight Salt Monitoring Zones. Out of these 295 salt industries, a total of 292 were surveyed and three factories were not covered under the survey due to physical non-existence of the factory. The zone wise number of factories was presented in Figure 5.2.1.1. It shows that, the highest number (94) factories exist in the Chittagong zone and the lowest numbers (15) of factories exist in the Dhaka zone.
Zone wise factory
25
94
31151723
48
39
ChandpurChittagongCox'S BazarDhakaJhalokatiKhulnaNarayanganjPatiya
Figure 5.2.1.1: Distribution of salt industries in Bangladesh
The salt factories were surveyed under this study can be categorized as small, medium and large based on production capacity of the factories. Zone-wise classification of salt industries is presented in Table 5.2.1.1. It is to be noted that the production capacity >50 tons/day is considered as large factory, production capacity between 20 – 49 tons/day is considered as medium factory and the production capacity >20 ton/day is considered as small factory. From the Table 5.2.1.1, a total 20 large factories,
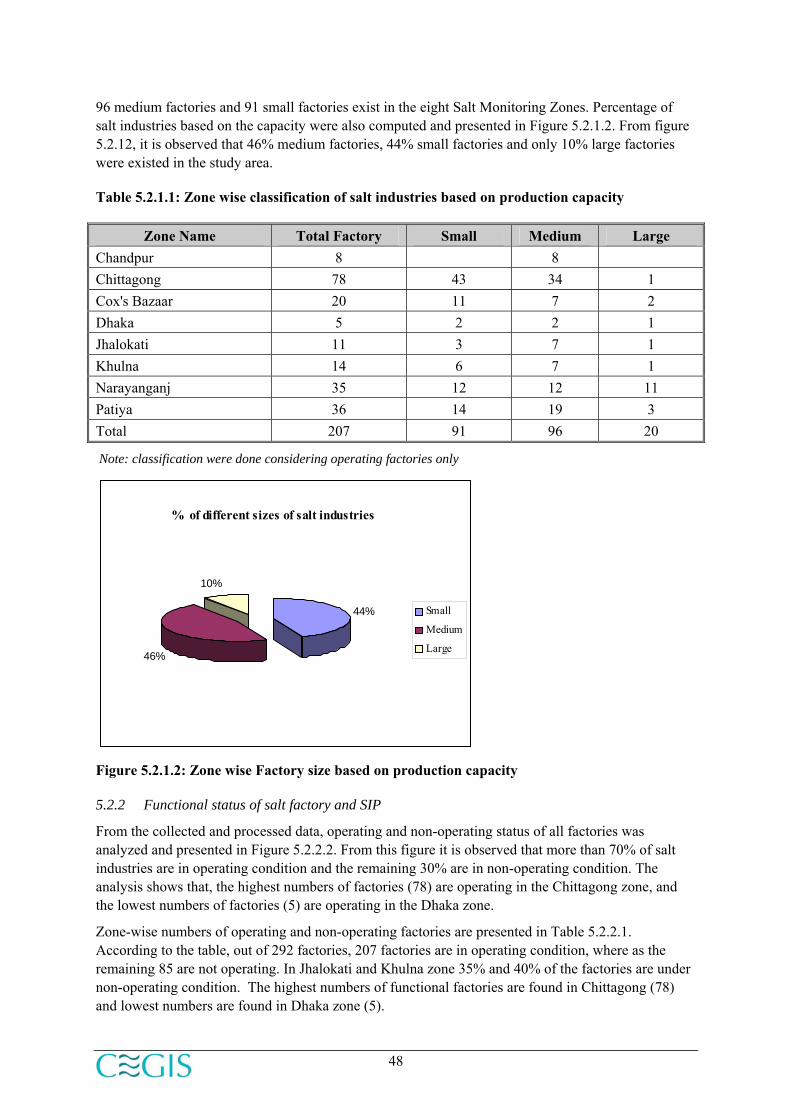
48
96 medium factories and 91 small factories exist in the eight Salt Monitoring Zones. Percentage of salt industries based on the capacity were also computed and presented in Figure 5.2.1.2. From figure 5.2.12, it is observed that 46% medium factories, 44% small factories and only 10% large factories were existed in the study area.
Table 5.2.1.1: Zone wise classification of salt industries based on production capacity
Zone Name Total Factory Small Medium Large Chandpur 8 8 Chittagong 78 43 34 1 Cox's Bazaar 20 11 7 2 Dhaka 5 2 2 1 Jhalokati 11 3 7 1 Khulna 14 6 7 1 Narayanganj 35 12 12 11 Patiya 36 14 19 3 Total 207 91 96 20
Note: classification were done considering operating factories only
% of different sizes of salt industries
44%
46%
10%
Small
Medium
Large
Figure 5.2.1.2: Zone wise Factory size based on production capacity
5.2.2 Functional status of salt factory and SIP
From the collected and processed data, operating and non-operating status of all factories was analyzed and presented in Figure 5.2.2.2. From this figure it is observed that more than 70% of salt industries are in operating condition and the remaining 30% are in non-operating condition. The analysis shows that, the highest numbers of factories (78) are operating in the Chittagong zone, and the lowest numbers of factories (5) are operating in the Dhaka zone.
Zone-wise numbers of operating and non-operating factories are presented in Table 5.2.2.1. According to the table, out of 292 factories, 207 factories are in operating condition, where as the remaining 85 are not operating. In Jhalokati and Khulna zone 35% and 40% of the factories are under non-operating condition. The highest numbers of functional factories are found in Chittagong (78) and lowest numbers are found in Dhaka zone (5).

49
In addition, non-functioning factories were classified according the time of non-operating duration and presented in Figure 5.2.2.4. The figure shows that more than 50% of the closed factories are not operating for less than one year. These factories sometimes operate for certain duration of a year but during the survey time the factories were closed. From the Figure 5.2.2.4 it has been observed that 20% of the factories are closed since 1-5 years and 26% of the factories are closed since 5-10 years.
Figure 5.2.2.2: Operating status of salt industries in Bangladesh
Zone wise factory status
8
78
205 11 14
35 3617 16 11 10 6 9 13 3
020406080
100
Chand
pur
Chittag
ong
Cox'S Baza
r
Dhaka
Jhalok
ati
Khulna
Naraya
ngan
jPati
ya
Zone Name
Num
ber o
f fac
tory
Operating Not Operating
Figure 5.2.2.3: Zone-wise operating and non operating status of salt industries in Bangladesh
Table 5.2.2.1: Zone-wise status (operating and non operating) salt factories
Zone Name Total Factory Not Operating Operating Chandpur 25 17 8 Chittagong 94 16 78 Cox'S Bazar 31 11 20 Dhaka 15 10 5 Jhalokati 17 6 11 Khulna 23 9 14 Narayanganj 48 13 35 Patiya 39 3 36 Total 292 85 207
Factory operating status for all zone of Bangladesh
29%
71%
Not Operating Operating

50
Duration factory not operating
52%
20%
26%2%
less than 1 year1-5 years 5-10 yearsMore than 10 years
Figure 5.2.2.4: Classification of not operating (time) duration for the non-function factories
From the collected and processed data, the types of Salt Iodization Plants (SIP) used by the salt industries were analyzed and presented in Figure 5.2.2.5. According to the figure, more than 90% of the industries have traditional type of SIP, 4% have mechanical type SIP and only 2% have vacuum type SIP. Furthermore, zone wise type of SIP data were also summarized and presented in Table 5.2.2.2. It has been observed that only Narayanganj, Patiya and Dhaka zone have few numbers of mechanical SIPs.
SIP Type
4%
94%
2%
MechanicalTraditionalVacuum
Figure 5.2.2.5: Operating status of salt industries in Bangladesh
Table 5.2.2.2: Zone wise type SIP
Zone name Total number of SIP Mechanical Traditional Vacuum
Chandpur 25 25 Chittagong 94 93 1 Cox'S Bazar 31 30 1 Dhaka 15 1 14 Jhalokati 17 17 Khulna 23 22 1 Narayanganj 48 5 41 2 Patiya 39 6 33 Total 292 12 275 5
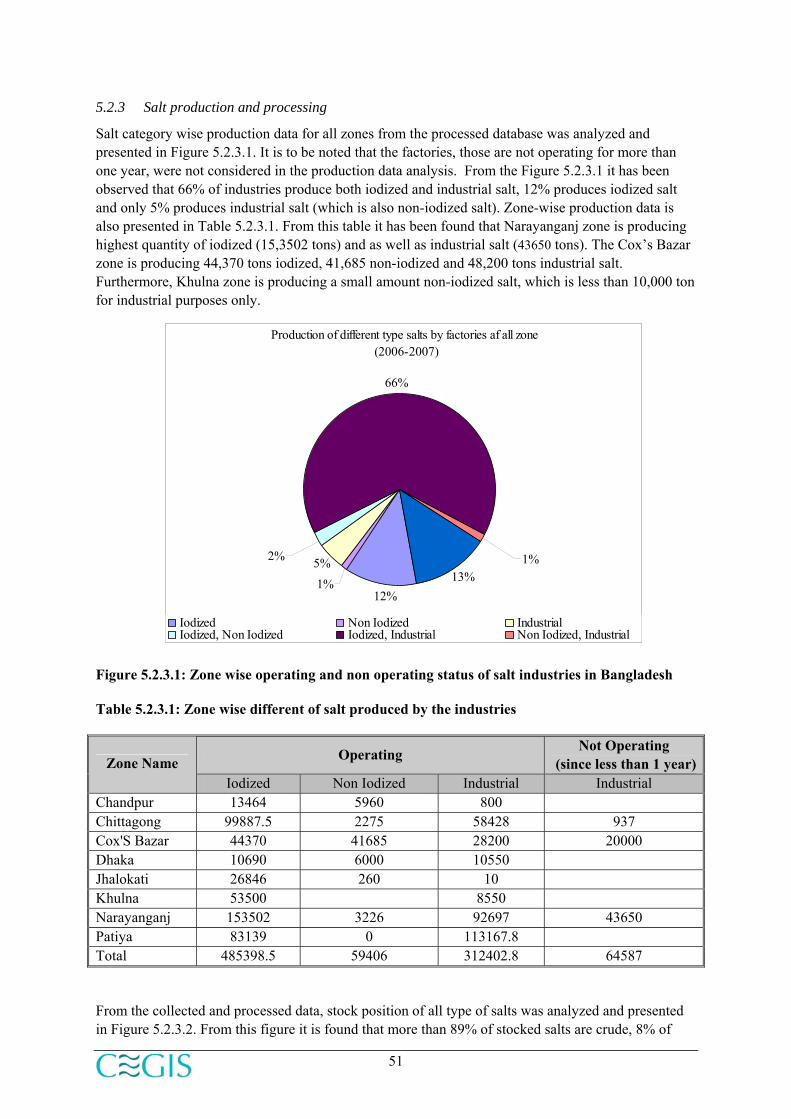
51
5.2.3 Salt production and processing
Salt category wise production data for all zones from the processed database was analyzed and presented in Figure 5.2.3.1. It is to be noted that the factories, those are not operating for more than one year, were not considered in the production data analysis. From the Figure 5.2.3.1 it has been observed that 66% of industries produce both iodized and industrial salt, 12% produces iodized salt and only 5% produces industrial salt (which is also non-iodized salt). Zone-wise production data is also presented in Table 5.2.3.1. From this table it has been found that Narayanganj zone is producing highest quantity of iodized (15,3502 tons) and as well as industrial salt (43650 tons). The Cox’s Bazar zone is producing 44,370 tons iodized, 41,685 non-iodized and 48,200 tons industrial salt. Furthermore, Khulna zone is producing a small amount non-iodized salt, which is less than 10,000 ton for industrial purposes only.
Figure 5.2.3.1: Zone wise operating and non operating status of salt industries in Bangladesh
Table 5.2.3.1: Zone wise different of salt produced by the industries
Operating Not Operating (since less than 1 year)Zone Name
Iodized Non Iodized Industrial Industrial Chandpur 13464 5960 800 Chittagong 99887.5 2275 58428 937 Cox'S Bazar 44370 41685 28200 20000 Dhaka 10690 6000 10550 Jhalokati 26846 260 10 Khulna 53500 8550 Narayanganj 153502 3226 92697 43650 Patiya 83139 0 113167.8 Total 485398.5 59406 312402.8 64587
From the collected and processed data, stock position of all type of salts was analyzed and presented in Figure 5.2.3.2. From this figure it is found that more than 89% of stocked salts are crude, 8% of
Production of different type salts by factories af all zone (2006-2007)
66%
12%13%1%
5%2% 1%
Iodized Non Iodized IndustrialIodized, Non Iodized Iodized, Industrial Non Iodized, Industrial
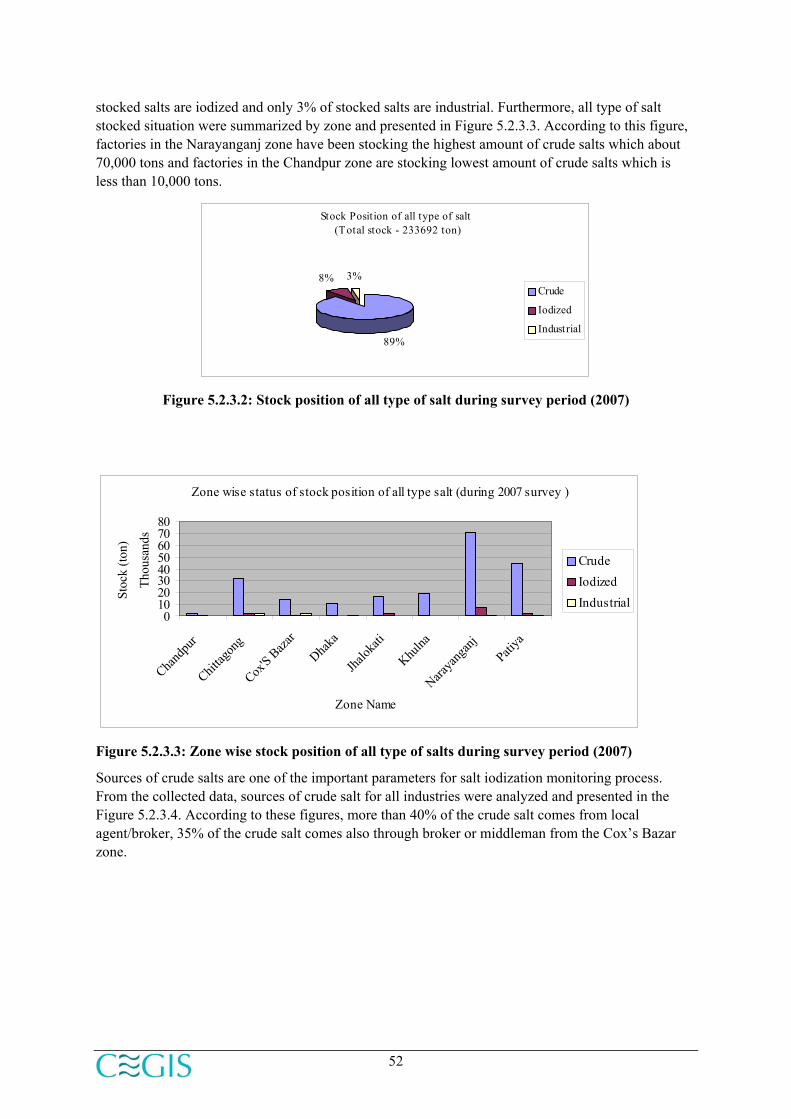
52
stocked salts are iodized and only 3% of stocked salts are industrial. Furthermore, all type of salt stocked situation were summarized by zone and presented in Figure 5.2.3.3. According to this figure, factories in the Narayanganj zone have been stocking the highest amount of crude salts which about 70,000 tons and factories in the Chandpur zone are stocking lowest amount of crude salts which is less than 10,000 tons.
Stock Position of all type of salt (Total stock - 233692 ton)
89%
8% 3%Crude
Iodized
Industrial
Figure 5.2.3.2: Stock position of all type of salt during survey period (2007)
Zone wise status of stock position of all type salt (during 2007 survey )
01020304050607080
Chand
pur
Chittag
ong
Cox'S Baza
r
Dhaka
Jhalok
ati
Khulna
Naraya
ngan
jPati
ya
Thou
sand
s
Zone Name
Stoc
k (to
n)
CrudeIodizedIndustrial
Figure 5.2.3.3: Zone wise stock position of all type of salts during survey period (2007)
Sources of crude salts are one of the important parameters for salt iodization monitoring process. From the collected data, sources of crude salt for all industries were analyzed and presented in the Figure 5.2.3.4. According to these figures, more than 40% of the crude salt comes from local agent/broker, 35% of the crude salt comes also through broker or middleman from the Cox’s Bazar zone.

53
Sources of crude salt
47%
35%
6% 8% 4% LocalCox'BazarKhulnaIndiaOthers
Figure 5.2.3.4: Status of crude salt sources for all industries of Bangladesh (2007)
5.2.4 Factory technical capability status
According to the processed data, status of working manpower of the salt industries were also analyzed and presented in Figure 5.2.4.1 to observe the present situation of the factories. It shows that, 84% of the total manpower is working on daily basis and only 16% of the manpower is working on permanent basis, which indicates that the factories are not running smoothly. The salt iodization process or price of iodized salt sometime increases due to the existing vulnerable situation of daily labour working in salt industries. This is also threat to the industries as well as for the manpower involved with these industries. Furthermore, zone wise status of working manpower of salt industries was also analyzed and presented in Figure 5.2.4.2 and Table 5.2.4.1. The Figure and Table show that the Chittagong zone has the highest numbers of daily labour working in the factories which is more than 3,000 and factories of the Chandpur zone have the lowest number of daily labours. The highest number of permanent workers of salt factories of the Narayanganj zone is more than 500 and second highest is in the Chittagong zone which is little bit less. Though, the number of salt industries in the Chittagong zone is much higher than that of Narayanganj zone.
Status of working person in salt industries of Bangladesh
16%
84%
Permanent staffDaily staff
Figure 5.2.4.1: Status of different types of manpower working at salt industries
Technical manpower is a very vital issue for salt industries; it is concerned with the salt iodization process. From the collected and processed data, the technical or trained manpower was assessed and presented in Figure 5.2.4.3. Only 14% of working persons of all industries are trained and 84% are not trained. The zone-wise trained manpower statistics are presented in Table 5.2.4.2. The table shows that apart from the Naryanganj and Patiya zone, all other zones have very few amount of trained manpower, which is less than 20%. The Naryanganj and Patiya zone have more than 20% trained

54
manpower. All these indicate that very low percentage of trained manpower exists and this has impacts on the appropriate level of iodine in the iodized salt.
The status of crude salt processing method used by the factories were analyzed and presented in Figure 5.2.4.4. According to the figure, more than 85% of the total salt factories are processing salt by using traditional method, 11% are producing by using refined method and only 4% of the total salt factories are using boiled method to process the crude salt.
The zone wise status of crude salt processing method are also analyzed and presented in Table 5.2.4.3. According to the Figure the highest numbers of factories using traditional processing method are situated in Chittagong zone (76), highest number factories using refined processing method are situated Khulna zone (10) and highest number (4) of boiled processing method are used in the Patiya zone.
Zone wise status of working person
0500
100015002000250030003500
Chand
pur
Chittag
ong
Cox'S Baza
rDha
ka
Jhalok
ati
Khulna
Naraya
ngan
j
Patiya
Zone
Num
ber o
f per
son
Permanent
Daily
Figure 5.2.4.2: Status of zone wise different types of manpower working at salt industries
Table 5.2.4.1: Status of factory manpower by zone
Zone Permanent
staff (male)
Permanent staff
(female)
Daily Labor (male)
Daily Labor
(female)
Daily Labor
(children)
Permanent staff
(total)
Daily staff
(total) Chandpur 38 372 38 372 Chittagong 454 0 3030 0 6 454 3036 Cox'S Bazar 192 0 1023 220 54 192 1297 Dhaka 110 153 110 153 Jhalokati 49 338 49 338 Khulna 114 0 732 327 2 114 1061 Narayanganj 612 77 2292 82 0 689 2374 Patiya 196 0 1300 4 0 196 1304 Total 1765 77 9240 633 62 1842 9935

55
Status of technical persons working at salt industries in Bangladesh
14%
86%
Trained
Not Trained
Figure 5.2.4.3: Status of technical or trained manpower working at salt industries of Bangladesh
Table 5.2.4.2: Zonewise status of trained manpower working at different salt industries
Zone Total Staff Number of trained staff % of Trained staff
Chandpur 410 11 3 Chittagong 3490 273 8 Cox'S Bazar 1489 153 10 Dhaka 263 59 22 Jhalokati 387 28 7 Khulna 1175 79 7 Narayanganj 3063 665 22 Patiya 1500 324 22 Total 11777 1592 100
Status of salt processing system
4% 11%
85%
BoiledRefinedTraditional
Figure 5.2.4.4: Status of crude salt processing method in Bangladesh
Table 5.2.4.3: Zone wise status of crude salt processing method in Bangladesh
Zone Name Total factory Boiled Refined Traditional Chandpur 8 8 Chittagong 78 2 76 Cox'S Bazar 20 1 19 Dhaka 5 2 3
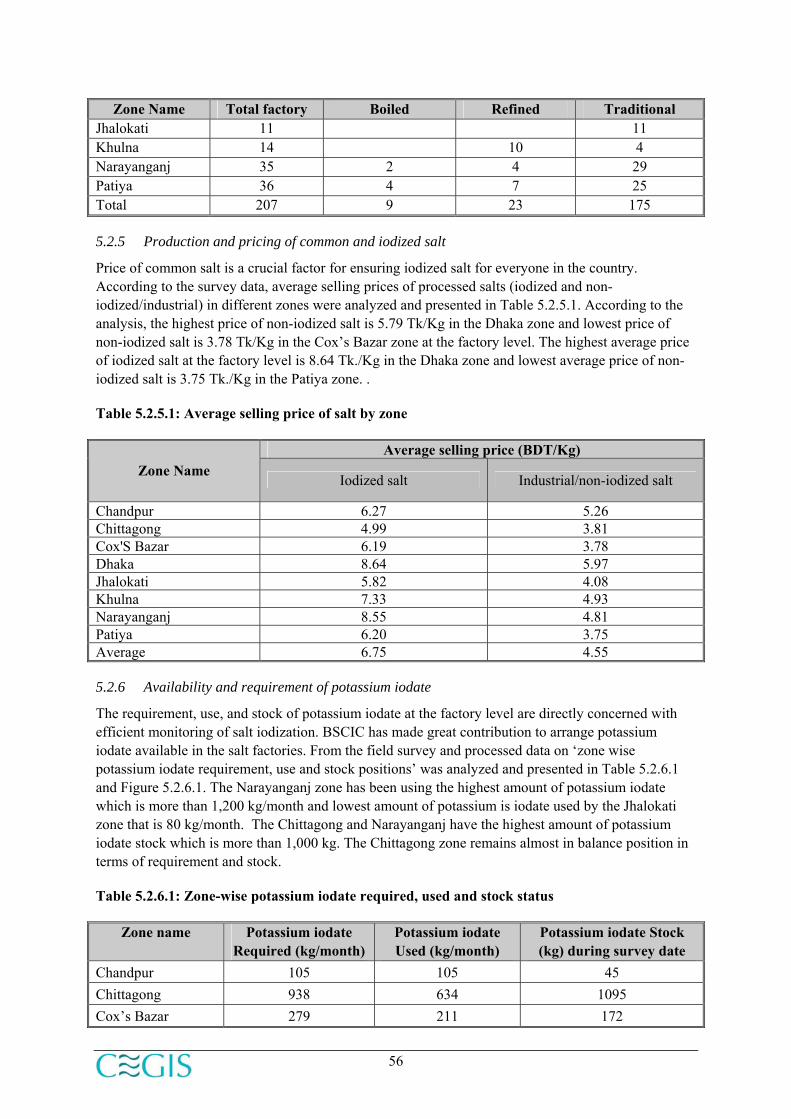
56
Zone Name Total factory Boiled Refined Traditional Jhalokati 11 11 Khulna 14 10 4 Narayanganj 35 2 4 29 Patiya 36 4 7 25 Total 207 9 23 175
5.2.5 Production and pricing of common and iodized salt
Price of common salt is a crucial factor for ensuring iodized salt for everyone in the country. According to the survey data, average selling prices of processed salts (iodized and non-iodized/industrial) in different zones were analyzed and presented in Table 5.2.5.1. According to the analysis, the highest price of non-iodized salt is 5.79 Tk/Kg in the Dhaka zone and lowest price of non-iodized salt is 3.78 Tk/Kg in the Cox’s Bazar zone at the factory level. The highest average price of iodized salt at the factory level is 8.64 Tk./Kg in the Dhaka zone and lowest average price of non-iodized salt is 3.75 Tk./Kg in the Patiya zone. .
Table 5.2.5.1: Average selling price of salt by zone
Average selling price (BDT/Kg) Zone Name
Iodized salt Industrial/non-iodized salt
Chandpur 6.27 5.26 Chittagong 4.99 3.81 Cox'S Bazar 6.19 3.78 Dhaka 8.64 5.97 Jhalokati 5.82 4.08 Khulna 7.33 4.93 Narayanganj 8.55 4.81 Patiya 6.20 3.75 Average 6.75 4.55
5.2.6 Availability and requirement of potassium iodate
The requirement, use, and stock of potassium iodate at the factory level are directly concerned with efficient monitoring of salt iodization. BSCIC has made great contribution to arrange potassium iodate available in the salt factories. From the field survey and processed data on ‘zone wise potassium iodate requirement, use and stock positions’ was analyzed and presented in Table 5.2.6.1 and Figure 5.2.6.1. The Narayanganj zone has been using the highest amount of potassium iodate which is more than 1,200 kg/month and lowest amount of potassium is iodate used by the Jhalokati zone that is 80 kg/month. The Chittagong and Narayanganj have the highest amount of potassium iodate stock which is more than 1,000 kg. The Chittagong zone remains almost in balance position in terms of requirement and stock.
Table 5.2.6.1: Zone-wise potassium iodate required, used and stock status
Zone name Potassium iodate Required (kg/month)
Potassium iodate Used (kg/month)
Potassium iodate Stock (kg) during survey date
Chandpur 105 105 45 Chittagong 938 634 1095 Cox’s Bazar 279 211 172

57
Zone name Potassium iodate Required (kg/month)
Potassium iodate Used (kg/month)
Potassium iodate Stock (kg) during survey date
Dhaka 110 109 23 Jhalokati 80 80 132 Khulna 316 316 98 Narayanganj 1715 1288 1077 Patiya 559 549 569 Total 4102 3291 3210
Zone-wise status (requried, used and stock) of potassium iodate
0
500
1000
1500
2000
Chand
pur
Chittag
ong
Cox'S Baza
rDha
ka
Jhalok
ati
Khulna
Naraya
ngan
jPati
ya
Zone name
Am
ount
(KG
)
Required Used Stock
Figure 5.2.6.1: Zone-wise comparative status of potassium iodate required, used and stock
5.2.7 Quality control and monitoring of iodization process
Frequent monitoring of salt iodization is the pre-requisite of sustainable monitory system. And for that reason related data on frequency of monitoring produced by BSCIC was analyzed. The analysis was done based on one operating factory and presented in Figure 5.2.7.1. The substantial number of factories informed that they are monitored by BSCIC once in every 15 days. In addition, data on iodine levels test methods used during monitoring process was also analyzed and stated in Figure 5.2.7.2. This figure shows that 54% of the respondents are using both the Test kit and BSCIC kit box, 27% of the respondents are using only Test kit, 4% of the respondents are using both lab and test kit and only 2% of the respondents are using laboratory.

58
Monitoring frequency of salt Iodization at factories by BSCIC
0102030405060708090
Chand
pur
Chittag
ong
Cox'S Baza
rDha
ka
Jhalok
ati
Khulna
Naraya
ngan
jPati
ya
Zone Name
Num
ber o
f res
pond
ent
Every 15 days Monthly
Figure 5.2.7.1: Frequency monitoring of salt iodization at factory level by BSCIC
Method used for Iodin during monitring of iodization process
27%54%
2% 1%4%
3%
9%
KitBox
Lab
Lab,KitBox
Lab,TKit
Lab,TKit,KitBox
TKit
TKit,KitBox
Figure 5.2.7.2: Iodine method used during monitoring of salt iodization at factory level by BSCIC
5.2.8 Packaging and distribution
After processing and iodization of raw salt the factory packs them with well decorated printed brands and different containers for distribution. According to BSTI and BSCIC the major printed items should be on the packets are:
(i) Name and address of manufacturer,
(ii) License/registration number,
(iii) “Iodized Salt”,
(iv) Iodine level,

59
(v) Pot and hand logo,
(vi) Net weight,
(vii) Maximum retail price,
(viii) Manufacturer’s trade mark,
(ix) Date of manufacture,
(x) Expiry date and
(xi) Educational message etc.
Collected printed items were scanned and incorporate in the monitoring database and software. From the database the user will be able to see the printed item through GSIIS interface. The sample printed item of a salt industry is shown in Figure 5.2.8.1
Figure 5.2.8.1: Printed items on consumer packet of iodized salt
5.2.9 Satisfaction of selling iodized salt
In addition, from the field survey data and processed factory data, the users’ satisfaction on selling of iodized salt was analyzed (based on factories who are operating and producing iodized salt only) and presented in Figure 5.2.9.1. The reasons of dissatisfaction of selling iodized salts are (1) frequent mechanical problem of SIPs, (2) slow production of process, (3) Need of BSTI license and ‘No objection certificates from BSTI’, and (4) financial problems and competition with large factories.
According to the figure, 86% of the respondents were found satisfied with selling of iodized salt but they need cooperation from government of Bangladesh through BSCIC to provide low interest rate

60
loan and subsidized automated crude processing and drying machine which will helpful for their sustained.
In fact this is positive for the iodization monitoring process. Furthermore, data on zone-wise users’ satisfaction on the selling of iodized salt was analyzed and presented in Table 5.2.9.1. The highest number (66%) satisfied respondents were in the Chittagong zone (more than 80% of the total respondents). In the Narayanganj zone more than 60% are satisfied and less than 40% are not satisfied on marketing of iodized salt.
Owner satisfaction of status (selling of iodized salt)
86%
14%
YesNo
Figure 5.2.9.1: Status of owner satisfaction on selling iodized salt
Table 5.2.9.1: Zone wise status of owner satisfaction on selling iodized salt
Zone Name Total Respondent Yes No Chandpur 4 4 Chittagong 78 69 9 Cox'S Bazar 16 14 2 Dhaka 5 3 2 Jhalokati 11 11 Khulna 13 12 1 Narayanganj 31 19 12 Patiya 34 34 Total 192 166 26
5.2.10 Awareness of people
Data on the users’ awareness on adverse impact of iodine deficiency was analyzed and presented in Figure 5.2.10.1. More than 60% of the respondents became aware by both the project (CIDD) of BSCIC and by media mainly television (TV), 2% by the television only and 33% became aware exclusively by the different activities of BSCIC.

61
Status of awareness of IDD
35%
2%63%
BSCIC
TV
BSCIC/TV
Figure 5.2.10.1: Status of awareness on iodine deficiency disorder.
5.2.11 Suggestions from salt processors
During the factory survey, the problems and suggestion related salt industries and iodization process were assessed. Data on problems related to salt iodization process were analyzed and presented in Figure 5.2.11.1. It shows that the 38% factories are facing problem with electricity (load shading) to operate the factory and as well as SIPs, 34% factories are facing problem with financial crises, 16% factories are facing problem as the highly competition market and 12% of the factory facing problem with the high price of potassium iodate.
Problems related to salt iodization process.
16%
38%34%
12%
Competition market Electricity problem
Financial problem High price of potassium iodate
Figure 5.2.11.2: Problems related to salt iodization process
Data on suggestion (from the factories) related to salt iodization process were analyzed and presented in Figure 5.2.11.2. The data analysis result shows that, 64% of the respondents need support related established subsidized laboratory, 22% of the respondent suggested for ‘not to use the black salt’ as raw salt at factory level, 9% of the respondent suggested for not to imported crude salt from India and only 2% of the respondents suggested for fixing common prices of iodized salt all factories.

62
Suggession related to salt iodization process
9%
64%
2%
22%3%
Crude Salt Import stoped
Government assistance
Need to fixed a sellingprice for all factories
No black salt use as crudesalt
Support to Lab
Figure 5.2.11.2: Suggestion related to the salt iodization process
5.3 Wholesaler data analysis
The important parameters of the wholesaler survey are (i) location, (ii) type of salt distributed, (iii) salt distributed to whom/where, (iv) mode of salt transportation, (v) amount of salt distribution, (vi) sources of salt, (vii) monitoring of idolization and (viii) salt distributed by whom, etc. The summary report of these parameters was presented in Appendix-A. The analysis results of some parameters were presented through graphical and tabular presentation below with brief description.
5.3.1 Coverage of the wholesaler survey
The data on the salt wholesalers was collected from all over the country including six divisions and 64 districts. Sample sizes of the wholesaler data are (i) six wholesalers from each division and (ii) two wholesalers from each district. Thus the total sample sizes of wholesalers were collected under this study area supposed to be 166 (6 x 6 + 64 x 2 + 2 additional). To collect the information 166 wholesalers were interviewed.
5.3.2 Distribution and mode of transport for distribution status of wholesaler
Information of types of salt distributed by wholesalers are collected and processed for further analysis. The sample survey data analysis result is presented in Figure 5.3.2.1. It shows that more than 80% of total wholesalers are distributing iodized salt, 11% of the wholesalers are distributing both iodized and non-iodized salt and only 1% of the wholesalers are distributing non-iodized salt.
Status of different type salt distrivution by wholesaler, Bangladesh
88%
1% 11%IodizedNon IodizedBoth
Figure 5.3.2.1: Status of different type of salt distribution (by wholesaler) in Bangladesh

63
Collected data on the wholesalers is processed and analyzed according to salt distribution destination and presented in the Figure 5.3.2.2. It shows that 92% of the wholesalers distributed salt to the retailers, 7% of the wholesalers to the industries and only 1% of the wholesalers to both retailer and industries. Division-wise salt distribution destination data have been collected, analyzed and presented in Figure 5.3.2.3. The maximum numbers of wholesalers of Dhaka and Rajshahi divisions are distributing salt to the retailers. It is also identified that reasonable number of wholesalers of these two divisions are distributing salt to the industries compare to remaining four divisions.
Status of Salt Distribution
1%
92%
7%
Industry
Retailer
Both
Figure 5.3.2.2: Salt distribution status of Bangladesh from sample survey data (2007)
Division wise salt distributed to
0
10
20
30
40
Barisal
Chittag
ong
Dhaka
Khulna
Rajsha
hiSylh
et
Division Name
Num
ber o
f WS
Industry
Retailer
Both
Figure 5.3.2.3: Division-wise salt distribution status of Bangladesh from sample survey data
(2007)
Different types of transports were used to transport salts. Analysis was done to identify the types of salt transport based on collected data, which is presented in Figure 5.3.2.4. It has been observed that 77% of the wholesalers are distributing salt through public transports, 14% are using their own transport and only 9% are using both own and public transports.
Salt distribution transportOwn = own vechicle, Pub = public transport
14%
77%
9%Own PubBoth
Figure 5.3.2.4 Type of transports used by the wholesaler for distribution of salt

64
5.3.3 Quantity of salt distributed by wholesaler
From the collected sample data, information on division-wise daily average quantity of selling of salt was analyzed and presented in Figure 5.3.3.1. The wholesalers of the Khulna region sold highest number of half kg bag -- more than 2,000 bags per day, and lowest number of half kg bag -- less than 500 bags/day are sold by the wholesalers of the Barisal region.
Division wise total salt sell status (bags)
020406080
Barisal
Chittag
ong
Dhaka
Khulna
Rajsha
hi
Sylhet
Tho
usan
ds
Division Name
Num
ber o
f bag
Non Iodin (75 KG)Iodin (Half KG)Iodin (One KG)Iodin (75 KG)Industrial (75 KG)
Figure 5.3.3.1: Division-wise salt selling status from sample survey (2007)
Collected sample data provides information by whom salt are taken from the wholesalers for distribution. These information was analyzed and presented in Figure 5.3.3.2 According to the analyzed results, 27% of salt distributed by the wholesaler, 38% salt taken by retailer from the warehouse and 33% of the salt distributed by both wholesaler and retailer and only 1% of the salt are taken by industries (i.e. garments, dying industries etc.)
Division wise salt distributed byInd=Industries, Ret=Retailer,Who=Wholesaler
38%
27%
33%
1% 1%
Ind
Ret
Who
Who,Ret
Who,Ret,Ind
Figure 5.3.3.2: Status of salt distribution media from sample survey 2007
5.3.4 Monitoring of iodine level during collection and storage
Testing of iodine level during collection and storage is significant for salt iodization monitoring process. From the processed survey data, iodine level monitoring status during collection of salt was analyzed and presented in Figure 5.3.4.1. From the analysis result it was observed that 67% of wholesalers were monitoring the iodine level during collection. Division-wise iodine level monitoring status during collection of salt was analyzed and presented in Figure 5.3.4.2. From the division wise

65
analysis result it is found that the highest number of positive answers received from the Rajshahi division and highest number of negative answers received from the Chittagong division.
Monitoring of iodine level during salt collection
33%
67%
No
Yes
Figure 5.3.4.1: Monitoring of iodine level by the wholesaler during collection
Division wise iodin level monitoring by wholesaler during salt collection
0
10
20
30
40
Barisal
Chittag
ong
Dhaka
Khulna
Rajsha
hi
Sylhet
Division Name
Num
ber o
f Who
lesa
ler
No
Yes
Figure 5.3.4.2: Division-wise status of monitoring of iodine level by the wholesaler during
collection
According to the processed survey data, iodine level monitoring status during the storing period was analyzed and presented in Figure 5.3.4.3. It shows that 67% of wholesalers were monitoring the iodine level during collection. Division-wise iodine level monitoring status during the time of storage was also analyzed and presented in Figure 5.3.4.4. According to the result highest number of positive answers received from the Rajshahi division and highest number of negative answers received from the Chittagong division.
Monitoring of iodine level by wholesalerduring salt storing
33%
67%
NoYes
Figure 5.3.4.3: Monitoring of iodine level by the wholesaler during storage

66
Division wise monitoring of iodine level by wholesalerduring salt storing
0
1020
30
40
Barisal Chittagong Dhaka Khulna Rajshahi Sylhet
Division Name
Num
ber o
f WS
No
Yes
Figure 5.3.4.4: Division-wise status of monitoring of iodine level by the wholesaler during storage
Iodine test methods
From the processed survey data, iodine level test methods during collection and storing of salt was analyzed and presented in Figure 5.3.4.5. According to the analysis result, 94% of the wholesalers tested the iodine level by using test kit and only 6% of the wholesalers test the iodine level by using lemon. Division-wise iodine test method monitoring status during collection and storing of salt was analyzed and presented in Figure 5.3.4.6. From the analysis result we found that the maximum numbers of wholesaler from the Rajshahi division are using test kit and substantial numbers of wholesaler from the Dhaka division are using lemon for testing iodine level.
Figure 5.3.4.5: Method used by the wholesalers for iodine test during collection and storing of
salt
Method of iodin level test by wholesaler
94%
6%
TestKitLemonKit

67
Method of iodine level test by wholesaler
010203040
Barisal
Chittag
ong
Dhaka
Khulna
Rajsha
hiSylh
et
Division Name
Num
ber o
f WS
TestKitLemonKit
Figure 5.3.4.6: Division-wise status of iodine test method used during collection and storing of
salt
During the survey it was found that many wholesalers did not monitored the iodine level during collection and storage period. The reason for not testing iodine level during collection was analyzed and presented in Figure 5.3.4.7. According to the analysis 11% of the wholesalers do not have test kits and 89% does not perform tests because of faith on salt industries. Furthermore, reasons for not testing iodine level during storage was analyzed and presented in Figure 5.3.4.8. It has been observed that 75% of wholesalers do not test as they have faith on the factory and 25% of the wholesalers do not test due not having the test kit.
Reason for not monitoring iodine level by wholesaler during collection of salt
11%
89%
No Testing KitFaith on salt company
Figure 5.3.4.7: Reason for not monitoring iodine level by wholesalers during collection of salt
25%
75%
No Testing KitPleased To Company
Reason for not monitoring iodine level by wholesaler during storage of salt
Figure 5.3.4.8: Reason for not monitoring iodine level by wholesaler during storage of salt

68
5.3.5 Technical support / assistance requirement for wholesaler
From the collected sample data, requirement of technical or financial support for the distribution was also assessed and presented in Figure 5.3.5.1. The figure shows that 67% of the wholesalers have no requirement for any technical or financial support, 25% of the wholesalers have requested for technical or financial support and 8% of the wholesalers did not give any comments.
Status of requirement of technical assistance from Government
67%
25%
8%
NoYesNo comments
Figure 5.3.5.1: Status of requirement of any technical or financial support for wholesaler
5.4 Comparative analysis of iodine contents at factory and wholesaler level
For the purpose of comparative analysis of iodine content at factory and wholesaler level, salt samples were collected from 170 factories (those are under functioning and producing iodized salt) and 69 wholesalers and tested in the IPHN laboratory. The detailed test result of iodized salt at the factory and wholesaler level were given Appendix - C.
Iodine content at factory level
From the iodine test result data, the factory wise iodine content were analyzed and presented in figure 5.4.1. From figure 5.4.1, it is observed that 18% of sampled factories’ salt have the iodine content < 20 ppm, 39% of sampled factories’ salt have the iodine content between 20 to 50 ppm, 15% of sampled factories’ salt have the iodine content between 50 to 100 ppm and 28% of sampled factories’ have the iodine content > 100 ppm. Further zone wise iodine test result data were analyzed and presented in figure 5.4.2 and table 5.4.1. From figure 5.4.2 and table 5.4.1, it is observed that salt of 25 factories of Chittagong zone, salt of 9 factories of Patyia zone, salt of 5 factories of Narayanganj zone and 7 factories of other zone has the content more than 100 ppm.

69
Status of iodine content in iodized salt at factory (Total sample - 170 )
18%
39%15%
28%
<20 20-50 50-100 >=100
Iodine content ( )
Figure 5.4.1: Status of iodine content (ppm) in iodized salt
Zone wise status of iodine content (ppm) in iodized salt at factory level
2
12
41
4 31
3
28
52
6
16
9
2
11
31 1
35
2
25
14
25
9
0
5
10
15
20
25
30
Chand
pur
Chittag
ong
Cox'S Baza
rDha
ka
Jhalok
ati
Khulna
Naraya
ngan
jPati
ya
Zone Name
Num
ber
of fa
ctor
ies
<20 20-50 50-100 >100
Figure 5.4.2: Zone wise status of iodine content (ppm) in iodized salt at different salt factories
Table 5.4.1: Zone wise status of iodine content (ppm) in iodized salt at factory level
Iodine level (ppm) Zone Total factories <20 20-50 50-100 >=100
Chandpur 6 2 2 2 Chittagong 76 12 28 11 25 Cox's Bazar 13 4 5 3 1 Dhaka 1 1 Jhalokati 11 4 2 1 4 Khulna 12 3 6 1 2 Narayanganj 25 1 16 3 5 Patiya 26 3 9 5 9 Total 170 30 66 26 48

70
Iodine content at wholesaler level
From the iodine test result data, the wholesaler wise iodine content were analyzed and presented in figure 5.4.3. From figure 5.4.3, it is observed that 22% of the sampled wholesaler’s salt have the iodine content < 20 ppm, 59% of the sampled wholesaler’s salt have the iodine content between 20 to 50 ppm, 13% of the sampled wholesaler’s salt have the iodine content between 50 to 100 ppm and only 6% of the sampled wholesaler’s salt have the iodine content > 100 ppm.
Division wise iodine test result data were analyzed and presented in figure 5.4.4 and table 5.4.2. It is observed that salt of 3 wholesaler at Khulna division and salt of 1 wholesaler at Barisal division have the iodine content more than 100 ppm which is more higher than the standard range of ppm value (20-50 ppm). Table 5.4.2 shows that salt sample of 51 wholesaler has the iodine content within the 50 ppm and salt sample of 13 wholesaler has the higher iodine content (>50 ppm).
Status of Iodine content salt at wholesaler(Total sample - 69 )
22%
59%
13% 6%
<20 20-50 50-100 >=100
Iodine content (ppm)
Figure 5.4.3: Status of iodine content (ppm) in iodized salt at wholesaler level

71
Division wise Status of Iodine content (ppm) in iodized salt at wholesaler level
7
1
5
2
8
3
11
10
7
22
3
2 2
1
3
0
2
4
6
8
10
12
Barisal Chittagong Dhaka Khulna Rajshahi Sylhet
Zone Name
Num
ber o
f who
lesa
ler
<20 20-50 50-100 >100
Figure 5.4.4: Division wise status of iodine content (ppm) in iodized salt at wholesaler level
Table 5.4.2: Division wise status of iodine content (ppm) in iodized salt at wholesaler level
Iodine level (ppm) Division Total number of sampled wholesaler <20 20-50 50-100 >=100
Barisal 9 8 1 Chittagong 5 3 2 Dhaka 21 7 11 3 Khulna 16 1 10 2 3 Rajshahi 12 5 7 Sylhet 6 2 2 2 Total 69 15 41 9 4
Comparison of iodine content between factory and wholesaler
The results from the salt sample and iodine content tests were cross-linked with factory and wholesaler and presented in table 5.4.3. It is observed that 48 wholesaler located in different districts are buying iodized salt from 17 factories located in different zones. Further comparative analysis between 17 factories and 48 wholesaler were carried out and presented in Table 5.4.4. From the comparative results (Table 5.4.4) it is observed that M/S Mohammadi Salt Refinery Industries has very higher level iodine content which 521.73 ppm and iodine content of three wholesalers of this factory are 10.54, 146.51 and 153.88 ppm. The probable reason of the higher level iodine content of this factory could be (i) iodine mixing by hand or spray, (ii) SIP does not working properly, (iii) lack of technical manpower to operate the SIP etc.
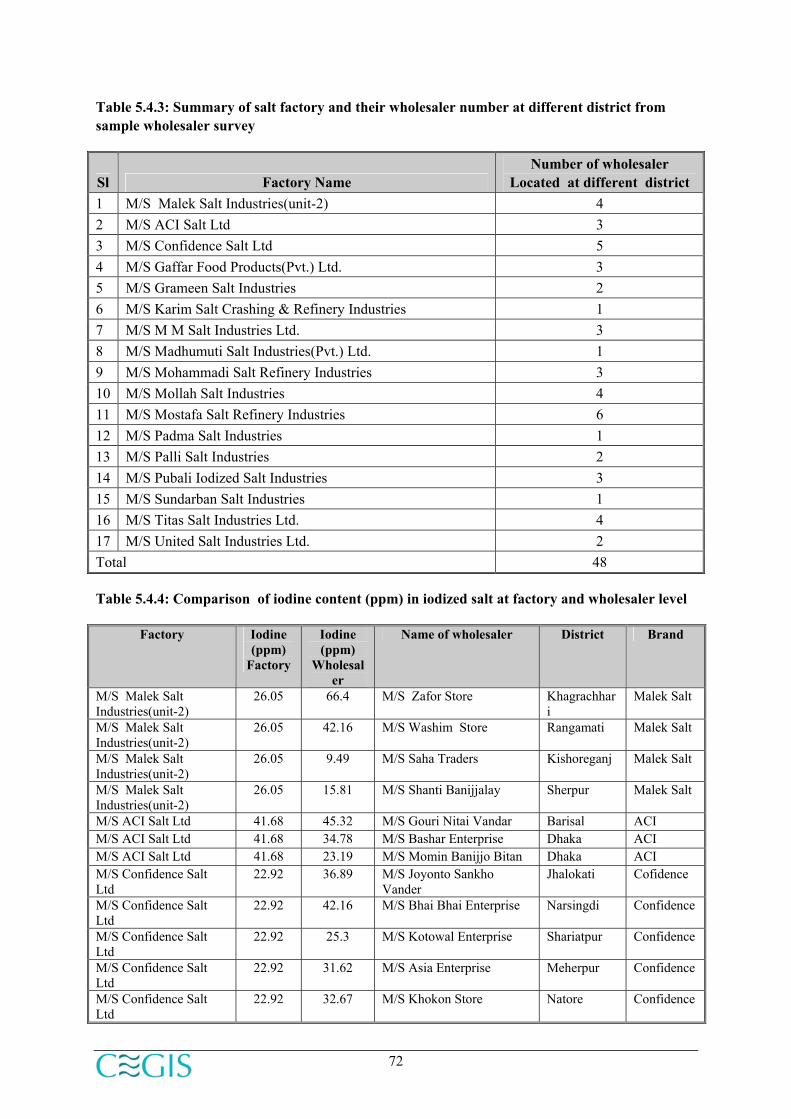
72
Table 5.4.3: Summary of salt factory and their wholesaler number at different district from sample wholesaler survey
Sl Factory Name Number of wholesaler
Located at different district 1 M/S Malek Salt Industries(unit-2) 4 2 M/S ACI Salt Ltd 3 3 M/S Confidence Salt Ltd 5 4 M/S Gaffar Food Products(Pvt.) Ltd. 3 5 M/S Grameen Salt Industries 2 6 M/S Karim Salt Crashing & Refinery Industries 1 7 M/S M M Salt Industries Ltd. 3 8 M/S Madhumuti Salt Industries(Pvt.) Ltd. 1 9 M/S Mohammadi Salt Refinery Industries 3 10 M/S Mollah Salt Industries 4 11 M/S Mostafa Salt Refinery Industries 6 12 M/S Padma Salt Industries 1 13 M/S Palli Salt Industries 2 14 M/S Pubali Iodized Salt Industries 3 15 M/S Sundarban Salt Industries 1 16 M/S Titas Salt Industries Ltd. 4 17 M/S United Salt Industries Ltd. 2 Total 48
Table 5.4.4: Comparison of iodine content (ppm) in iodized salt at factory and wholesaler level
Factory Iodine (ppm)
Factory
Iodine (ppm)
Wholesaler
Name of wholesaler District Brand
M/S Malek Salt Industries(unit-2)
26.05 66.4 M/S Zafor Store Khagrachhari
Malek Salt
M/S Malek Salt Industries(unit-2)
26.05 42.16 M/S Washim Store Rangamati Malek Salt
M/S Malek Salt Industries(unit-2)
26.05 9.49 M/S Saha Traders Kishoreganj Malek Salt
M/S Malek Salt Industries(unit-2)
26.05 15.81 M/S Shanti Banijjalay Sherpur Malek Salt
M/S ACI Salt Ltd 41.68 45.32 M/S Gouri Nitai Vandar Barisal ACI M/S ACI Salt Ltd 41.68 34.78 M/S Bashar Enterprise Dhaka ACI M/S ACI Salt Ltd 41.68 23.19 M/S Momin Banijjo Bitan Dhaka ACI M/S Confidence Salt Ltd
22.92 36.89 M/S Joyonto Sankho Vander
Jhalokati Cofidence
M/S Confidence Salt Ltd
22.92 42.16 M/S Bhai Bhai Enterprise Narsingdi Confidence
M/S Confidence Salt Ltd
22.92 25.3 M/S Kotowal Enterprise Shariatpur Confidence
M/S Confidence Salt Ltd
22.92 31.62 M/S Asia Enterprise Meherpur Confidence
M/S Confidence Salt Ltd
22.92 32.67 M/S Khokon Store Natore Confidence
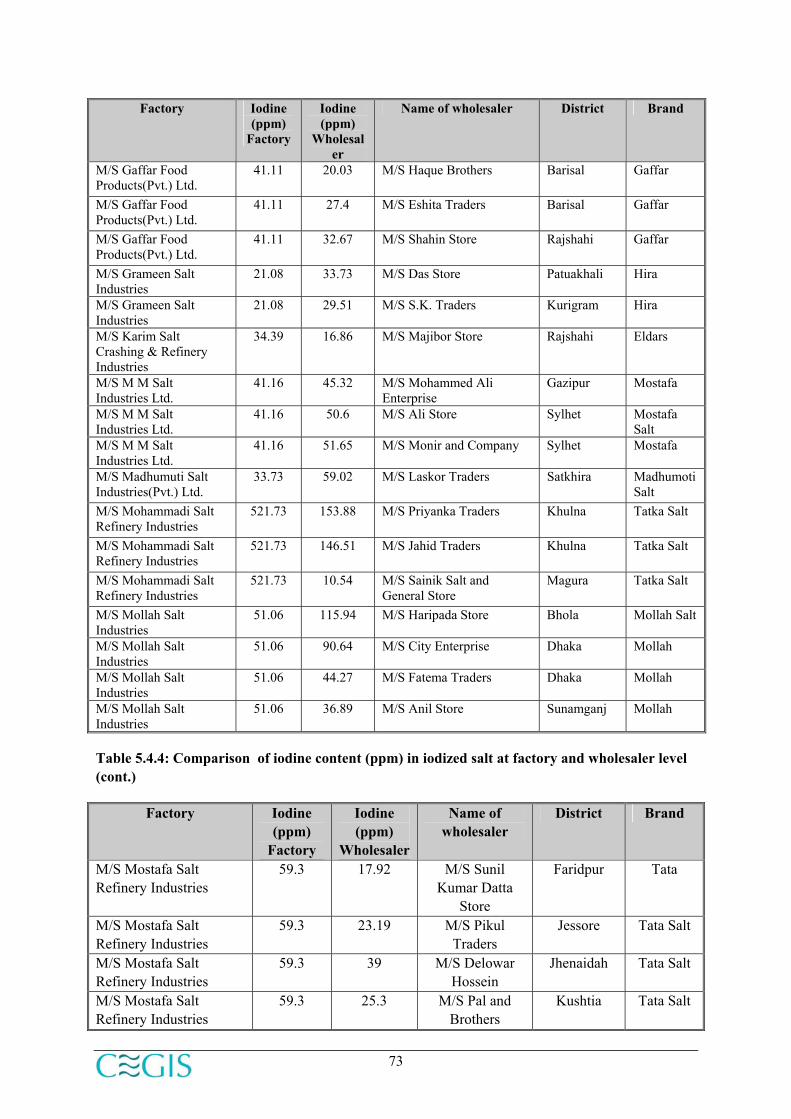
73
Factory Iodine (ppm)
Factory
Iodine (ppm)
Wholesaler
Name of wholesaler District Brand
M/S Gaffar Food Products(Pvt.) Ltd.
41.11 20.03 M/S Haque Brothers Barisal Gaffar
M/S Gaffar Food Products(Pvt.) Ltd.
41.11 27.4 M/S Eshita Traders Barisal Gaffar
M/S Gaffar Food Products(Pvt.) Ltd.
41.11 32.67 M/S Shahin Store Rajshahi Gaffar
M/S Grameen Salt Industries
21.08 33.73 M/S Das Store Patuakhali Hira
M/S Grameen Salt Industries
21.08 29.51 M/S S.K. Traders Kurigram Hira
M/S Karim Salt Crashing & Refinery Industries
34.39 16.86 M/S Majibor Store Rajshahi Eldars
M/S M M Salt Industries Ltd.
41.16 45.32 M/S Mohammed Ali Enterprise
Gazipur Mostafa
M/S M M Salt Industries Ltd.
41.16 50.6 M/S Ali Store Sylhet Mostafa Salt
M/S M M Salt Industries Ltd.
41.16 51.65 M/S Monir and Company Sylhet Mostafa
M/S Madhumuti Salt Industries(Pvt.) Ltd.
33.73 59.02 M/S Laskor Traders Satkhira Madhumoti Salt
M/S Mohammadi Salt Refinery Industries
521.73 153.88 M/S Priyanka Traders Khulna Tatka Salt
M/S Mohammadi Salt Refinery Industries
521.73 146.51 M/S Jahid Traders Khulna Tatka Salt
M/S Mohammadi Salt Refinery Industries
521.73 10.54 M/S Sainik Salt and General Store
Magura Tatka Salt
M/S Mollah Salt Industries
51.06 115.94 M/S Haripada Store Bhola Mollah Salt
M/S Mollah Salt Industries
51.06 90.64 M/S City Enterprise Dhaka Mollah
M/S Mollah Salt Industries
51.06 44.27 M/S Fatema Traders Dhaka Mollah
M/S Mollah Salt Industries
51.06 36.89 M/S Anil Store Sunamganj Mollah
Table 5.4.4: Comparison of iodine content (ppm) in iodized salt at factory and wholesaler level (cont.)
Factory Iodine (ppm)
Factory
Iodine (ppm)
Wholesaler
Name of wholesaler
District Brand
M/S Mostafa Salt Refinery Industries
59.3 17.92 M/S Sunil Kumar Datta
Store
Faridpur Tata
M/S Mostafa Salt Refinery Industries
59.3 23.19 M/S Pikul Traders
Jessore Tata Salt
M/S Mostafa Salt Refinery Industries
59.3 39 M/S Delowar Hossein
Jhenaidah Tata Salt
M/S Mostafa Salt Refinery Industries
59.3 25.3 M/S Pal and Brothers
Kushtia Tata Salt
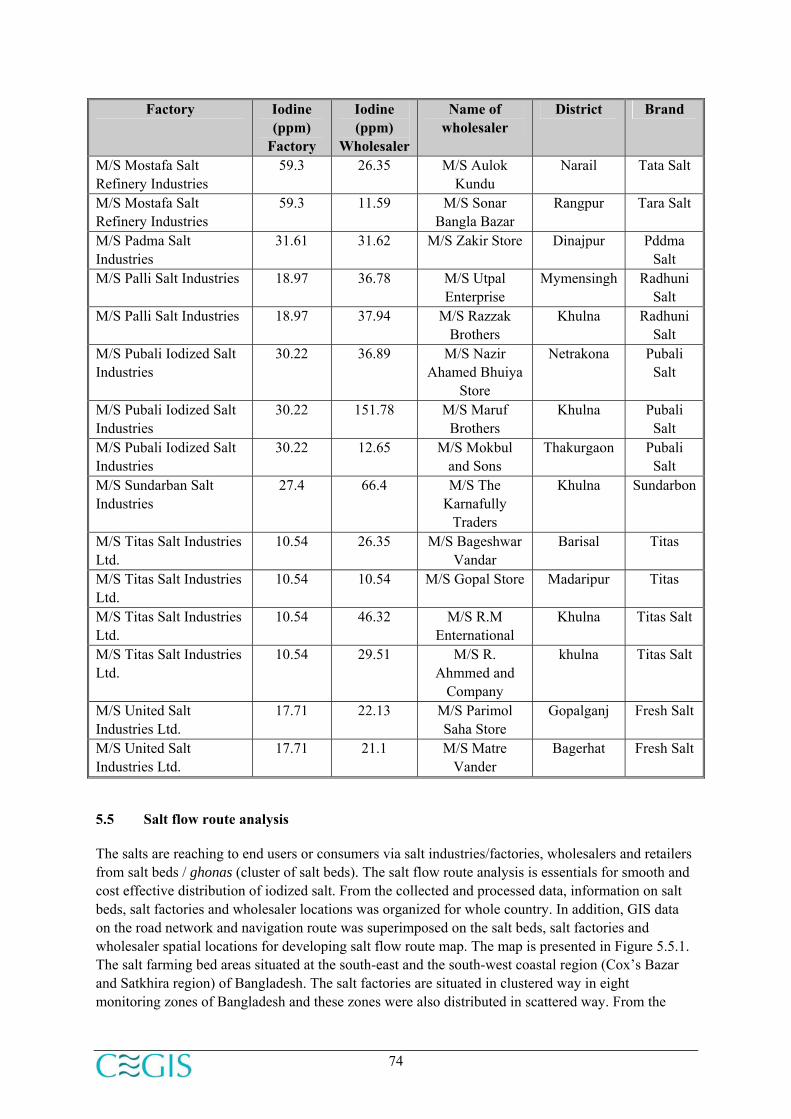
74
Factory Iodine (ppm)
Factory
Iodine (ppm)
Wholesaler
Name of wholesaler
District Brand
M/S Mostafa Salt Refinery Industries
59.3 26.35 M/S Aulok Kundu
Narail Tata Salt
M/S Mostafa Salt Refinery Industries
59.3 11.59 M/S Sonar Bangla Bazar
Rangpur Tara Salt
M/S Padma Salt Industries
31.61 31.62 M/S Zakir Store Dinajpur Pddma Salt
M/S Palli Salt Industries 18.97 36.78 M/S Utpal Enterprise
Mymensingh Radhuni Salt
M/S Palli Salt Industries 18.97 37.94 M/S Razzak Brothers
Khulna Radhuni Salt
M/S Pubali Iodized Salt Industries
30.22 36.89 M/S Nazir Ahamed Bhuiya
Store
Netrakona Pubali Salt
M/S Pubali Iodized Salt Industries
30.22 151.78 M/S Maruf Brothers
Khulna Pubali Salt
M/S Pubali Iodized Salt Industries
30.22 12.65 M/S Mokbul and Sons
Thakurgaon Pubali Salt
M/S Sundarban Salt Industries
27.4 66.4 M/S The Karnafully
Traders
Khulna Sundarbon
M/S Titas Salt Industries Ltd.
10.54 26.35 M/S Bageshwar Vandar
Barisal Titas
M/S Titas Salt Industries Ltd.
10.54 10.54 M/S Gopal Store Madaripur Titas
M/S Titas Salt Industries Ltd.
10.54 46.32 M/S R.M Enternational
Khulna Titas Salt
M/S Titas Salt Industries Ltd.
10.54 29.51 M/S R. Ahmmed and
Company
khulna Titas Salt
M/S United Salt Industries Ltd.
17.71 22.13 M/S Parimol Saha Store
Gopalganj Fresh Salt
M/S United Salt Industries Ltd.
17.71 21.1 M/S Matre Vander
Bagerhat Fresh Salt
5.5 Salt flow route analysis
The salts are reaching to end users or consumers via salt industries/factories, wholesalers and retailers from salt beds / ghonas (cluster of salt beds). The salt flow route analysis is essentials for smooth and cost effective distribution of iodized salt. From the collected and processed data, information on salt beds, salt factories and wholesaler locations was organized for whole country. In addition, GIS data on the road network and navigation route was superimposed on the salt beds, salt factories and wholesaler spatial locations for developing salt flow route map. The map is presented in Figure 5.5.1. The salt farming bed areas situated at the south-east and the south-west coastal region (Cox’s Bazar and Satkhira region) of Bangladesh. The salt factories are situated in clustered way in eight monitoring zones of Bangladesh and these zones were also distributed in scattered way. From the

75
Figure 5.7.1, it is found that navigation route and road networks can be used to flow the salt to salt beds factory wholesaler consumer.
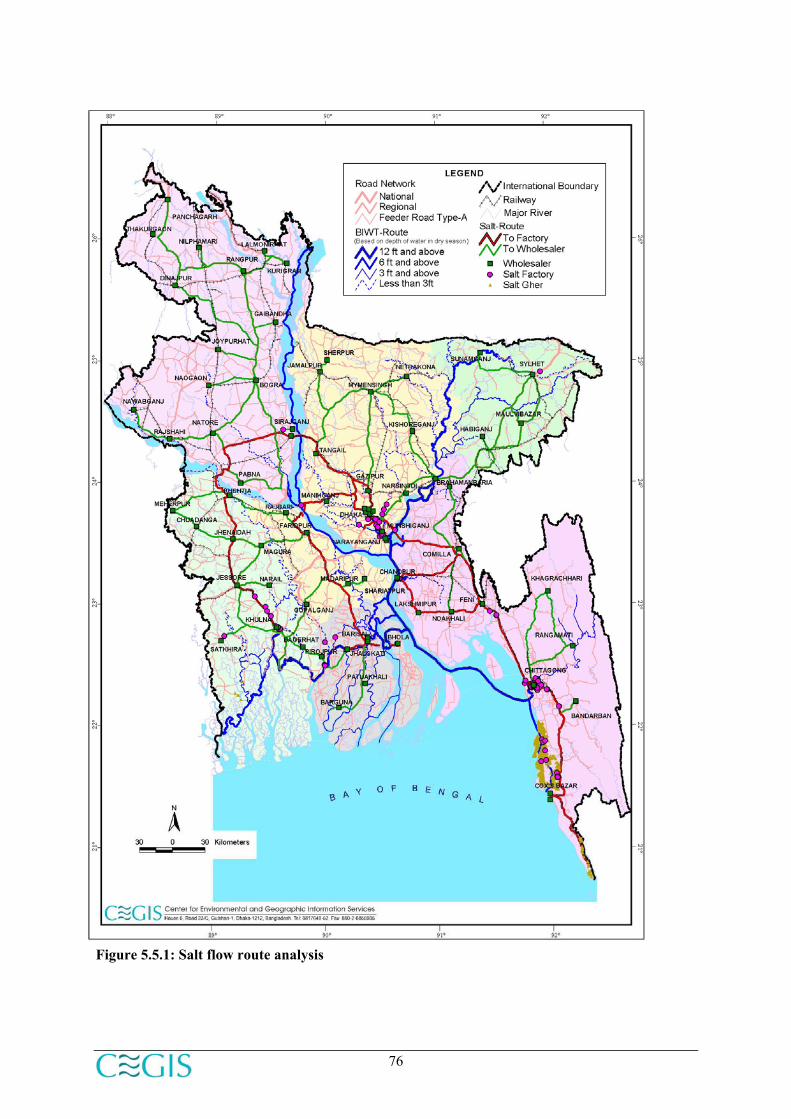
76
Figure 5.5.1: Salt flow route analysis

77
5.6 Spatial survey for Iodized Salt Intake at household level
CEGIS has conducted household survey aiming to assess the status of iodized salt intake at household level. Total 100 sample households were surveyed in the Daulatpur mouza under Jagonnathpur Union of Thakurgaon Sadar Upazila, by using the developed household questionnaire and GPS. The sample study area has been shown in Figure 5.6.1. The major parameters covered under this survey are (i) education level, (ii) occupation of the head of household, (iii) existence of goiter patient in the households, (iv) types of salt intake, (v) period of iodized salt use and (vi) awareness status etc. A brief description of surveyed data analysis result is given below:
Education levelof house hold head
According to the collected household data, the education levels of the respondent households was analyzed and presented in Figure 5.6.2. It shows that, more than 40% of the respondent households head’s education is under primary level, 15% is up to primary level, 25% is up to high school level and only 4% is up to graduate level.
Occupation of the household head
From the collected household data, the occupation of the head of the respondent households was analyzed and presented in Figure 5.6.3. More than 60% of the respondent household heads occupation is farmer, 22% daily earning worker/daily labourer. 12% is small business holder and only 6% is service-holder as per the analyzed results.
Existence of goiter patient in the household
According to the collected household data, the existence of goiter patient in the households was analyzed and presented in Figure 5.6.4. According to the analyzed results, more than 90% of the respondent households have no goiter patient and only 6% have goiter patient in their houses. Furthermore, status of goiter patient, including age, duration of suffering, period of iodized salt used by the patient’s household was also analyzed and presented in Table 5.6.1. An instance from the collected information reveals that since 30 years one patient is suffering and she has started to take iodized salt since seven years. The sample photograph of a goiter patient and iodine disorder impacted person has been shown in Figure 5.6.5.

78
Figure 5.6.1: Study area for salt intake household sample survey

79
Status of education level at salt intake houseolds surveyed area
42%
15%
25%
9%5% 4%
Under primaryPrimeryUp to high schoolS.S.CH.S.CGraduate
Figure 5.6.2: Status of education level at salt intake household surveyed area
Status of Occupation for HH
22%
60%
6%12%
Daily Earning Worker
Farmer
Service Holder
Small Business Holder
Figure 5.6.3: Status of occupation of household’s head at salt intake household surveyed area
Status of Patient availability
94%
6%
No
Yes
Figure 5.6.4: Status of occupation of household’s head at salt intake household surveyed area

80
Table 5.6.1: Patient information from household data (Union : Raghunathpur Upazila: Thakurgaon Sadar,)
Patient Name
Village Mouza Para Patient Age
Suffering Time (year)
Iodized salt used
(year) Kawtali Bala
Daulotpur Daulotpur Malipara 35 1 3
Mst. Samsun Nahar
Daulotpur Daulotpur Dhanipara 50 20 3
Lipi Rani Daulotpur Daulotpur Bashgara 14 14 5 Mst. Achhia Begum
Bahadurpara Jagannatpur Bahadurpara 45 30 7
Fayjul Islam
Bahadurpara Jagannatpur Bahadurpara 35 2 3
Figure 5.6.5: Sample photographs of goiter patient of salt intake households surveyed area
GIS mapping of goiter patient households
In the survey area, the households of goiter patient’s were surveyed using developed questionnaire and GPS. After processing of GPS data using GIS, the goiter patient’s location maps were developed and presented in Figure 5.6.6. This Figure shows that Jagannathpur mouza has the highest number of non-iodized salt intake households.

81
Figure 5.6.6: Maps showing salt intake by the households at surveyed area

82
Types of salt intake
The collected household data on the types of salt intake by the households was analyzed and presented in Figure 5.6.7. According to the analyzed result, more than 70% of the respondent household intakes iodized salt and 28% intakes non iodized salt.
Status of type of Salt intake at HH
72%
28%
IodizedNon Iodized
Figure 5.6.7: Status of salt intake by the households at surveyed area
Period of iodized salt used
Information received from the surveyed area on duration of iodized salt use was analyzed and presented in Figure 5.6.8. According to the Figure, more than 40% households using iodized salt since 3 years, 20% households since 5 years, 16% households since 4 years, 15% households since 6 years and only 1% households since 7 years are using iodized salt.
Duration of Iodized salt used
5%
43%
16%
20%
15% 1%2 years3 years4 years5 years6 years7 years
Figure 5.6.8: Status of duration iodized salt used by the households at surveyed area
Awareness status
Data on the status of awareness on iodine deficiency disorder (IDD) by the households was analyzed and presented in Figure 5.6.9. The Figure shows that more than 60% of the respondents are not aware and 33% of the respondents are aware of IDD in the surveyed area as per sample survey result.
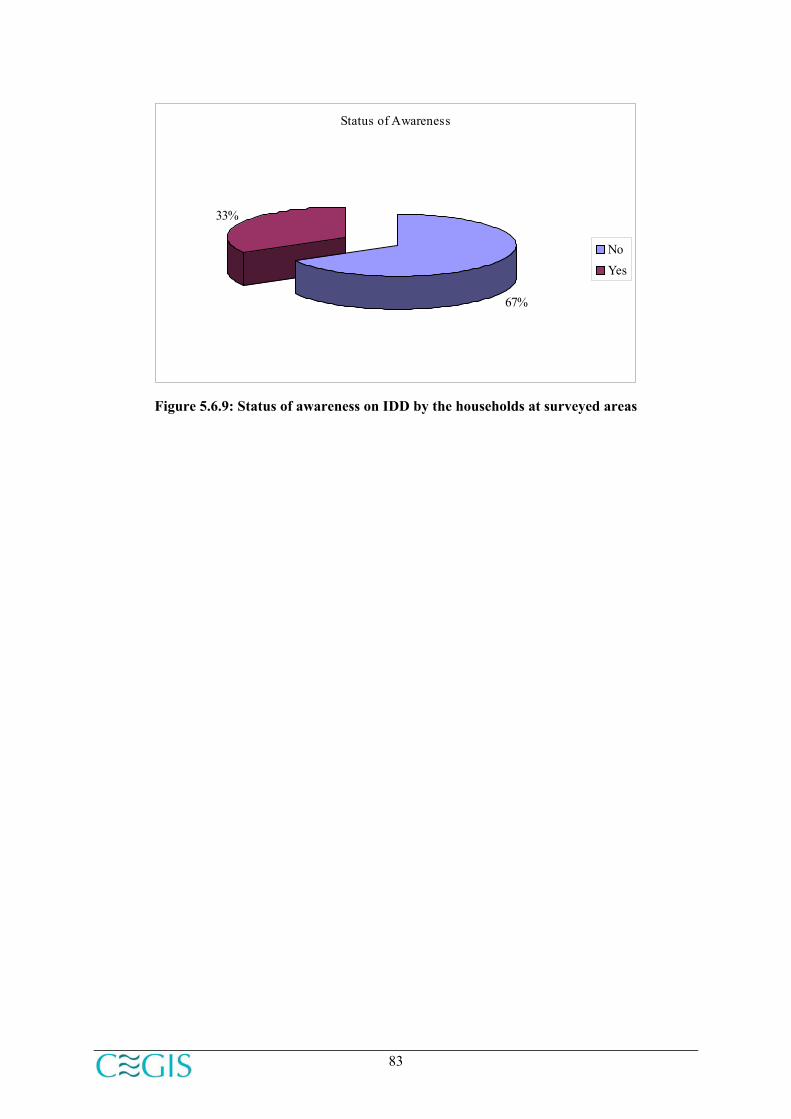
83
Status of Awareness
67%
33%
NoYes
Figure 5.6.9: Status of awareness on IDD by the households at surveyed areas

84

85
Chapter 6
Development of web-based mapping & monitoring system
6.1 Introduction
For effective monitoring of salt iodization process in Bangladesh and to ensure the proper iodine level for the general people, a GIS based web enable monitoring system named as GIS based Salt Industries Information System (GSIIS) has been developed under this project. The web based system is developed with the aim that all the partners in the process could have access to the system through internet or intranet based on their access authorization. The system is developed using open source software development tools to reduce the cost and licensing obligations. The user interfaces, input/output formats has been designed and developed in consultation with BSCIC and MI. The higher level steps to develop the system are: System design, Database design, Interface design and System development.
The software framework development task included conceptualization of software framework and identification of software elements and users. The identified major elements of the software are data input, data browsing, query and report generation and mapping etc. It has been identified that the major users of this software are: BSCIC, MI, BITAC, BUET, INFS, IPHN, UNICEF and etc.
6.2 Overall architecture of GSIIS
The system is designed and developed using four-tier architecture that consisted following layers:
• User interface
• Web Server
• Map service and Desktop GIS
• Database

86
Figure 6.2.1: Overall architecture of GSIIS
6.2.1 User Interface
The user interface is developed using ASP.NET framework version 2. User-friendly interface of GSIIS is designed for easy access of data from the database server. The users get online access using browsing tool (i.e. internet explorer) to the system and database and able to get required information through different queries. Authorized users can insert and edit data to the system and can also able to download data in different format.
Data entry and editing interface
Using data entry and editing interface, the user can enter and edit the survey and monitoring data. The partners who want to access the GSIIS database will need authentication to the system to update and modify the monitoring data. The interface have mainly three functions: entry, edit and deletion.
Query and Reporting interface
The query and reporting interface is designed to facilitate analyzing data based on predefine criteria and generate reports online. The predefined query is designed and kept in the database, user can get data by clicking the query name displayed in query window of GSIIS. Facilities to create a new query and modify an existing query have also been incorporated.
Mapping interface
The mapping interface has been developed to view and print maps on salt related data. The developed mapping interface is capable to retrieve data based on location based query. The mapping interface has been developed using open source GIS named SharpMap.
6.2.2 Database
The data server contains data, views and stored-procedure. It executes SQL statements, views and stored-procedure for data manipulation. The database has been developed using open source Database Management System named PostGRESQL. Data relationships are established after normalization of the collected survey and monitoring data.
Internet Application .Net Technology
Map ServerMinnesota Map Server
Desktop GISArcGIS, ArcView
DatabasePostGRESQL GIS Data
ESRI shape files
Data entrymodule
Mappingmodule
Query andreporting module
User interface
Web Server
Map Server and
Database
Internet Application .Net Technology
Web Server IIS
Map Server Sharp Map Server
Desktop GIS ArcGIS
PostGRE SQL Database
GIS Data ESRI shape files
Data entrymodule
Mappingmodule
Query andreporting module
User interface
Web Server
Map Server and Data Analysis
Database
87
The Spatial data have also been stored in PostGRESQL database, the GIS analysis components of the SharpMap and PostGRESQL have been used to accessed the spatial data layers for spatial operations. The spatial data layers are organized with the structured file formats and naming convention.
6.2.3 Web Server
The main component for a web-enabled application is the web server. Web server is a sever program that handles the requests from web browsers for data and pages and delivers the requested web pages along with data, maps and other information based on request parameters over the internet or intranet. The GSIIS has been developed in .Net platform for Microsoft Windows IIS (ver 6) web server .
6.2.4 Map components: SharpMap
SharpMap is an open source map server and it has an easy-to-use mapping library for use in web and desktop application developments. It provides access to many types of GIS data, enables spatial query on that data, and renders maps on screen in web browser. The important features of ShapMap are:
• Completely written in C# .NET 2.0
• Embed the engine using any .NET language, including C#, VB.NET and J#
• PostGreSQL/PostGIS support
• ESRI Shapefile support
• HttpHandler for ASP.NET applications
• Support for Points, Linestings, Polygons, MultiPoints, MultiLineStrings and MultiPolygons, * GeometryCollections etc. according to the OpenGIS Simple Features Specification.
• Renders attributes as labels
• Advanced thematic maps using delegates
• Easy extensible with additional dataproviders, layertypes and geometry types
6.3 Technology used
The technology used for the development of GSIIS is .Net frame work 2.0 and open GIS technology. The post GIS technology is very useful for low cost and stable solution. Open GIS is based on open source software. The following technologies have been used to develop the components of the GSIIS:
− Programming Language: C#
− Frame work: .Net framework 2
− Web components: Asp.Net
− Data access components: NpgSql (.Net data provider for postgreSQL)
− Database: PostgreSQL
− Map service: SharpMap
− Reports framework: Seagate Crystal reports
− Chart component : TeechartPro development license version

88
6.4 Main Input and output from the system
To monitor the salt iodization chain using the intended GIS based monitoring system a number of data layers are required as described below.
6.4.1 Input data layers
Primary GIS data layers that were collected for this project:
1. Gher (Ghona) Location
2. Industry location
3. Wholesale market location
4. BSCIC office location
5. Secondary GIS data
6. Administrative boundary (District/ Thana)
7. River
8. Roads
9. Growth Center
10. Data from the questionnaire survey are categorized in three blocks:
11. Common salt production:
• General Information: GPS location, Owner name, Location etc
• Bed Preparation: process of bed preparation, duration, cost
• Production: production info
• Quality Control: if maintain BSIC guideline
• Transprtation: Salt transport by, bed to factory etc.
12. Salt Industry:
• General Information: Factory name, Owner name, Location, and working person etc.
• SIP Information: Opeating condition, SIP type, Machine parts condition, category of worker etc
• Production and Processing: capacity, source of salt, salt production, stock position
• Chemical: crude salt process, Potasium Iodate source, chemical stock position
• Quality control: Any quality control, monitor iodine level, monitor process etc
• Packing and distribution: size of packing, brand names, items printed on packets, salt supplied
13. Wholeseller:
• General Information: name, Location, responder etc.
• Distribution: salt type distribution, packing, transport, salt packet, source salt
• Monitoring/Technical: Iodine monitor after collecting, storing, salt distributed by , suggestion etc

89
6.4.2 Major Outputs
Map based outputs
• SIP information (functional, non-functional), factory location
• Iodized salt production map
• Factory location by salt production (Iodized, non-Iodized, both)
• Zone wise factory map
• Location of common salt production, industry and wholesale market with administrative boundary
Tabuler Output
• Factory General Information: Owner name, man power etc.
• Status of SIP
• Production and Processing of Salt Industry
• Chemical: chemical used
• Quality control
• Packing and distribution
• Suggestions and problems
• Detials status of SIP
• In Packing items should be printed
• Production reports monthwise
6.5 Main user of GSIIS
The main users of the intended system, GSIIS, are as follows:
Bangladesh Small and Cottage Industries Corporation (BSCIC)
o CIDD Project
o BSCIC head office
o BSCIC district/zone office
• Monitoring officer
• Monitoring Inspector
Ministry of Industry
BITAC
BUET
INFS
MicroNutirent Initiative (MI) Bangladesh
Unicef
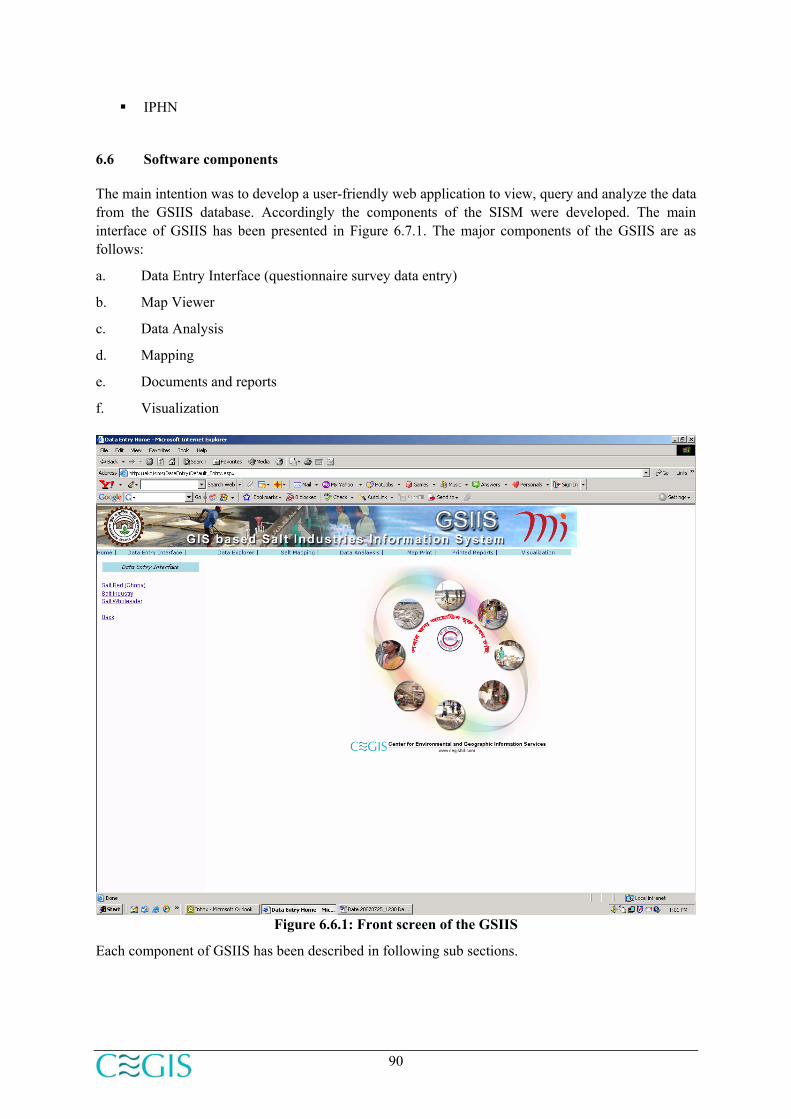
90
IPHN
6.6 Software components
The main intention was to develop a user-friendly web application to view, query and analyze the data from the GSIIS database. Accordingly the components of the SISM were developed. The main interface of GSIIS has been presented in Figure 6.7.1. The major components of the GSIIS are as follows:
a. Data Entry Interface (questionnaire survey data entry)
b. Map Viewer
c. Data Analysis
d. Mapping
e. Documents and reports
f. Visualization
Figure 6.6.1: Front screen of the GSIIS
Each component of GSIIS has been described in following sub sections.
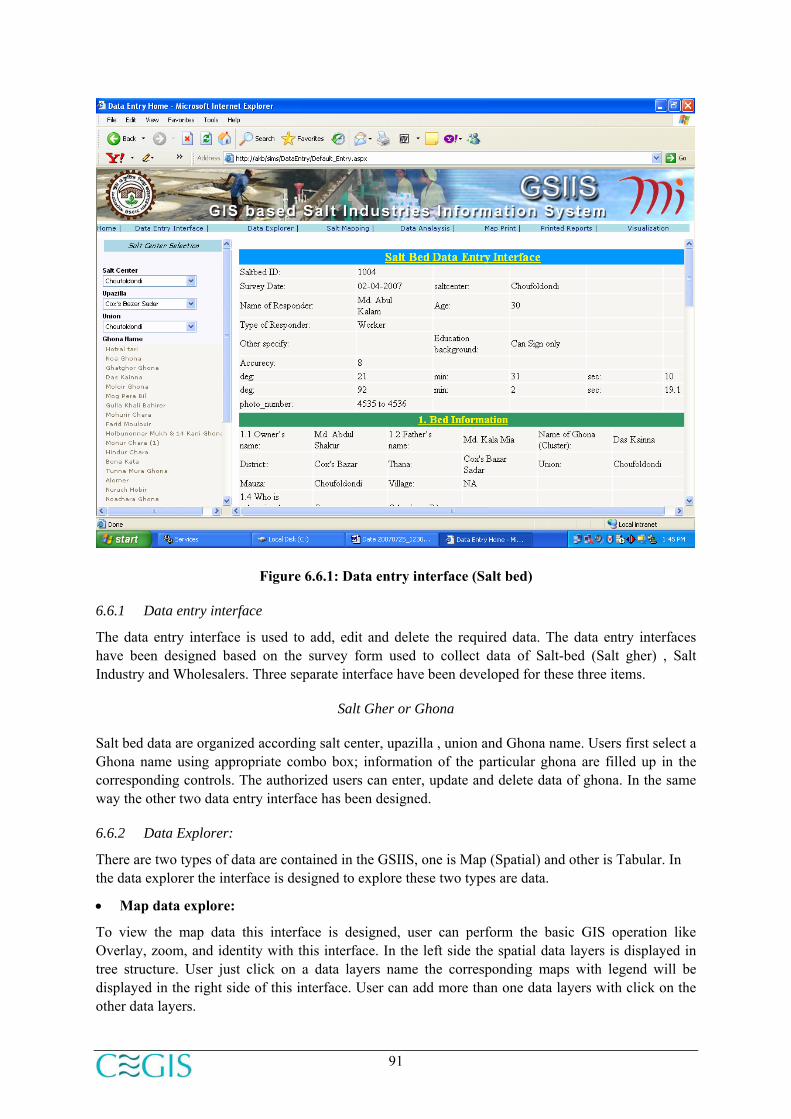
91
Figure 6.6.1: Data entry interface (Salt bed)
6.6.1 Data entry interface
The data entry interface is used to add, edit and delete the required data. The data entry interfaces have been designed based on the survey form used to collect data of Salt-bed (Salt gher) , Salt Industry and Wholesalers. Three separate interface have been developed for these three items.
Salt Gher or Ghona
Salt bed data are organized according salt center, upazilla , union and Ghona name. Users first select a Ghona name using appropriate combo box; information of the particular ghona are filled up in the corresponding controls. The authorized users can enter, update and delete data of ghona. In the same way the other two data entry interface has been designed.
6.6.2 Data Explorer:
There are two types of data are contained in the GSIIS, one is Map (Spatial) and other is Tabular. In the data explorer the interface is designed to explore these two types are data.
• Map data explore:
To view the map data this interface is designed, user can perform the basic GIS operation like Overlay, zoom, and identity with this interface. In the left side the spatial data layers is displayed in tree structure. User just click on a data layers name the corresponding maps with legend will be displayed in the right side of this interface. User can add more than one data layers with click on the other data layers.
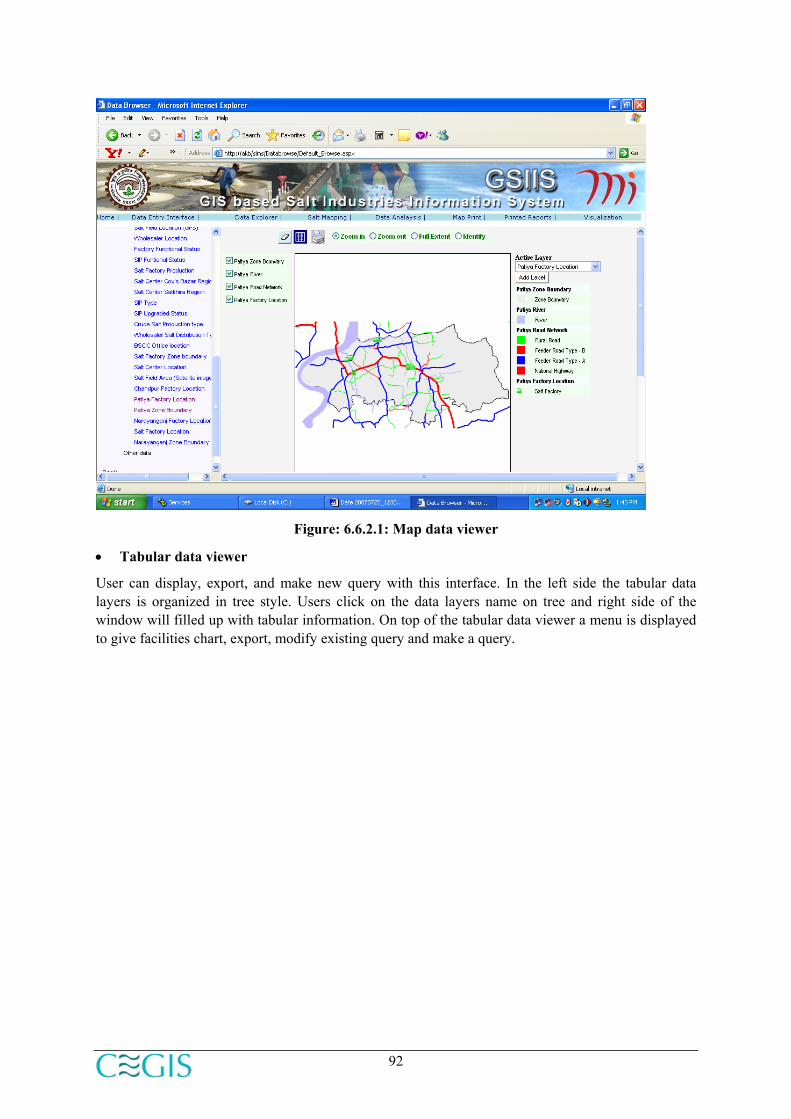
92
Figure: 6.6.2.1: Map data viewer
• Tabular data viewer
User can display, export, and make new query with this interface. In the left side the tabular data layers is organized in tree style. Users click on the data layers name on tree and right side of the window will filled up with tabular information. On top of the tabular data viewer a menu is displayed to give facilities chart, export, modify existing query and make a query.

93
Figure 6.6.2.2: Tabular data viewer
• Chart tool
To make a chart from the predefined query this tool is used. The field name from the query is filled up automatically on the field list box. User can add field for x-axis and y-axis of the chart and click on

94
the “Generate Chart” button, the output chart is displayed in the lower part of the window.
Figure 6.6.2.3: Chart tool
• Export tool
This tool has been developed to export the output of predefined or custom query. It can export the query outputs to MS-Excel, MS Word or text format.
Figure 6.6.2.4: Export tool

95
• New Query tool
A custom query interface has been developed and incorporated into GSIIS. Through this query interface dataset on Factory, Salt-bed and wholesalers can be fetched with user selected data fields and conditions.
Figure 6.6.2.5: New query tool
6.6.3 Mapping
An user-friendly mapping interface has been developed and incorporated in GSIIS to design and display maps with facilities of adding legends, labels and symbols. This can be used to generate maps for reports. The viewed map can be printed through a printing interface button. A snapshot of Mapping interface is presented in Figure
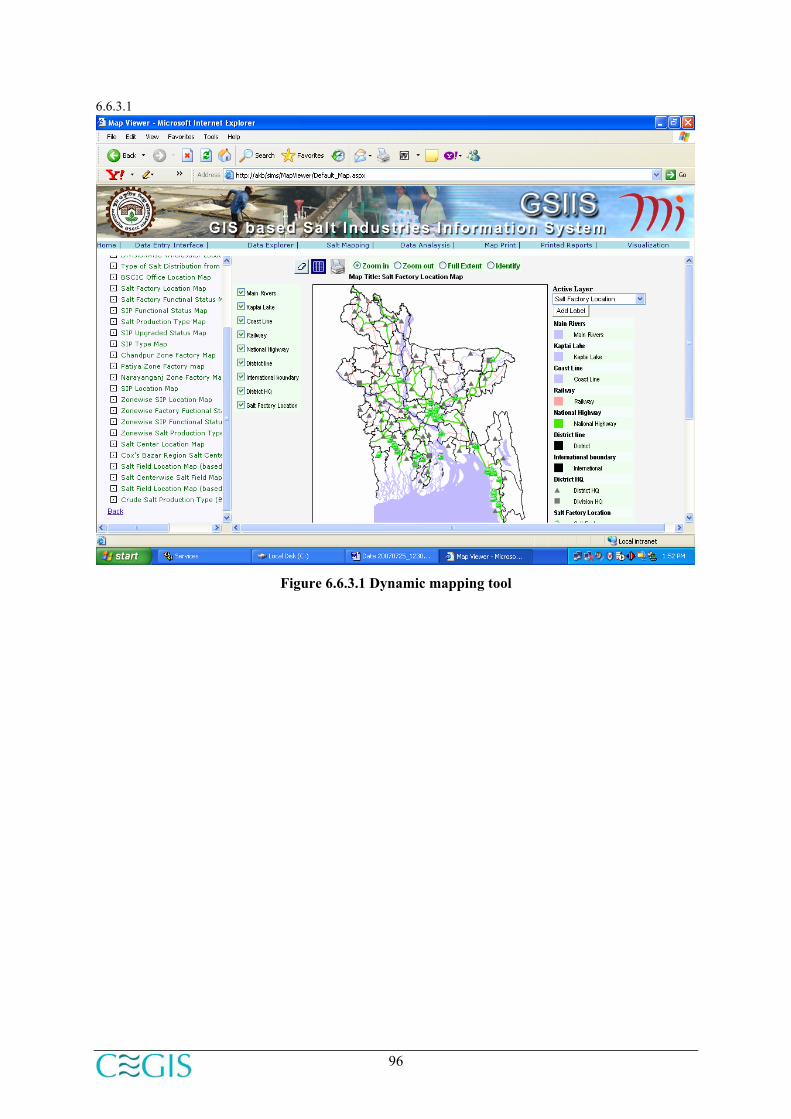
96
6.6.3.1
Figure 6.6.3.1 Dynamic mapping tool

97
6.6.4 Data analysis
The data analysis tool has been developed to perform some simple statistical analysis on salt gehrs, industries and wholesalers. A snapshot of this interface is shown in Figure 6.6.4.1.
Figure 6.6.4.1 Data analysis tool

98
6.6.5 Map print
A set of ready-made maps are stored in the database and those could be printed using a simple interface. A snapshot of the map print interface is shown in Figure 6.6.5.1.
Figure 6.6.5.1 Map print tool
6.6.6 Report printing module
Based on the query the fetched datasets can be printed using the “report printing” interface which use Crystal Reports internally. The interface is shown in figure 6.6.6.1.

99
Figure 6.6.6.1 Report print tool
6.6.7 Photo Visualization
The photographs stored in GSIIS database can be viewed through the photo visualization interface. User can select the Ghona name, salt factory name or wholesaler name from left side of the window. In the right side the corresponding pictures will be displayed.
Figure 6.6.7.1: Pictures viewer

100
6.7 Deployment the web-based monitoring system
After development of GSIIS, the system will be deployed in MI server/BSCIC server. The users connected to the MI/BSCIC/CEGIS intranet will be able to access the GSIIS through web browser (internet explorer, Opera or any other) with permission of software/database administrator through UserID and password.
For GSIIS deployment following items will be required:
• Space: 2 GB
• Web Server: IIS version 6
• DBMS: PostgreSQL version 8.2
• Deployment package of GSIIS
6.8 Documentation and Training
A User manual has been prepared to guide the users to operate the system. A training will be given to the designated personnel of BSCIC/MI on use of GSIIS.
6.9 Maintenance
According to the contract, CEGIS will provide technical support to maintain the GSIIS for six months after the deployment.
101
Chapter 7
Conclusion & Recommendations
7.1 Conclusion
The key activities of the project were (i) field data collection on salt beds, salt industries and wholesaler or distributors, (ii) database development, (iii) web-enable GIS based Salt Industries Information System (GSIIS) development. For the purpose of field data collection, three comprehensive field questionnaires were developed in consultation with BSCIC, and Micronutrient Initiative (MI). During the salt bed survey it has been observed that more than 50,000 farmers are involved in salt farming and they are cultivating salt in a cluster named ‘ghona’. There are more than 700 ghona in the two salt farming regions of Bangladesh. The project team realized that it is very difficult to collect the individual farmer’s particulars because they are huge in number and they are also volatile. Therefore, it has been recommended that a separate study could be executed to obtain detailed information about the salt farmers. Survey data was used to analyze Factory functional status, technical manpower, processing of crude salt, quality monitoring, SIP condition, packaging and potassium use etc. The sample wholesaler information collected from the district and division levels were used to observe the distribution and iodization monitoring during salt collection and storage. Furthermore, Salt Monitoring Zone Wise GIS maps were prepared. These maps might assist monitoring process of salt iodization in Bangladesh. The important observations including some limitations of the study are stated below.
Salt bed
(i) According to sample survey most of the salt beds are situated in the Cox’s Bazar region and more than 50% of the farmers are producing black crude salt and 43% of the farmers are producing polythene crude salt.
(ii) More than 60% of the crude salts are being carried from salt beds to factory through boat.
(iii) A substantial numbers of volatile farmers are involved in salt farming. Sometimes they take loan from the brokers with higher interest rate. On the other hand the brokers buy crude salts from these farmers at very cheaper rate against the loan as a precondition.
(iv) There is a need to develop modern techniques to process the crude salt at salt farming level which will reduced the processing cost at factory level.
(v) Transportation cost by boat and trucks of crude salt is comparatively high. Special arrangement can be made with Bangladesh railway regarding the transportation cost to carry the crude salt.
Salt Industries
a. Functional status of the factories varies time to time. About 71% of the factories are operating and 29% of the factories are not operating.
b. Technical manpower capacities of the factories are very weak; only 14% are trained. On the other hand 84% of the factory’s manpower working on temporary or daily basis.
102
c. Most of the factories (85%) are using traditional method for processing crude salts and only 11% factories have the refining processing plant. The medium and small industries need subsidized processing plant and bank loan on low interest rate.
d. The medium and small salt industries are feeling threat with large factories due to lack of automated or mechanized crude salt pressing machine. For the survival of these medium and small factories, subsidized mechanical processing system or loan from government at lower rate of interest is required.
e. Some factories are importing crude or raw salt from India. Indian raw salts are comparatively cheaper than Bangladeshi crude salts. Bangladeshi black crude salts required more processing cost due to huge amount of mud exists in it.
Wholesaler
(i) More than 80% of the wholesalers are selling iodized salt and more than 67% of the wholesalers are monitoring iodine level during salt collection and storage.
(ii) More than 90% of the wholesalers are using test kit and 6% are using lemon to monitor the iodine level during collection and storage.
Constraints:
(i) All individual farmers could not be interviewed during the survey because of huge number of farmers (more than 50,000) and shortage of project duration. Majority of farmers are volatile/floating. Farmers are not available all time in the field. Therefore, a total 751 farmers were interviewed considering one farmer from each salt beds cluster (ghona).
(ii) Sometimes factory owner/responsible staff did not provide the appropriate answers/information.
7.2 Recommendations
Based on the experiences and observations from this study the following recommendations are made:
(i) The marginal and landless farmers need assistance to get polythene to produce quality crude salt. The polythene beds salt are very clean and required low processing cost in the factory. In future, this might help the Government of Bangladesh to stop import of crude salt from India.
(ii) Farmers are selling crude salt at very low price due to the interference of brokers or middlemen. To resolve this issue, BSCIC can take necessary actions viz. procure salt directly from the farmers through its Salt Farming Monitoring Centers. After that salt industries may collect crude salt from BSCIC. A well-defined salt flow distribution principle can be developed.
(iii) Farmers need to be trained to follow the guidelines and techniques of BSCIC. The training can be carried with the help of their Salt Demonstration Cum Training Center of BSCIC.
(iv) Khas lands can be distributed among the salt farmers with nominal lease amount, especially to those who are landless.
(v) It is essential to assess the status of iodized salt intake at household level in low iodine coverage area (Tangail, greater Dinajpur and Rangpur). Thus a pilot project titled “GIS

103
Based Assessment and Evaluation of Households Level Iodized Salt Intake at Low Iodine Coverage Districts of Bangladesh” can be taken for assessing present situation. This proposed pilot study can be done at Tangail & greater Rangpur areas with the financial assistance from MI before the scheduled five year interval national level survey.
(vi) Periodic laboratory test of salt samples of the factories should also be done for the monitoring zones to ensure with iodine level, especially in terms of safe and unsafe ranges.
(vii) Research need be carried out by BUET–BITAC to develop mobile processing machine and mobile SIP, so that processing and iodization can be done at the field level under supervision of BSCIC officers at different salt centers.
(viii) For Salt Industries Development Project of BSCIC, Cox’sBazar, a project titled “Development of Detailed Salt Farmers Database and Internal Monitoring Report Generation” can be taken up with financial support from MI
(ix) To make the use of GSIIS more effective it has to be deployed at district level field offices of BSCIC. In this regard a follow-up project “Capacity building of BSCIC officials through Computerized Monitoring System” could be taken up with the financial assistances from MI.
(x) For the sustainable salt iodization monitoring process and institutionalization of the monitoring system, the GSIIS has to be used regularly. Thus, a five years duration project titled “Data updating and institutionalization of GSIIS through periodic survey and GIS based data analysis” could be taken up.
(xi) The GSIIS would be very useful in monitoring salt iodization process at factory and wholesale market level.
(xii) For efficient use of GSIIS, it has to be deployed at the district level BSCIC offices and training for the field level officers is also required.

104
105
References
BSCIC, 2005, Sequential Development of Salt Industries and uase of Polythene for Salt Production in using of Solar Energy , by Dr. Engr. Saleh Uddin and Engr. Md. Shahidul Islam of BSCIC In addition, monitoring reports of the CIDD Project, BSCIC were also studied.
Islamabad, 2005, Situational Analysis and Inventory of Salt Industry by Micronutrient Initiative (MI), Islamabad in Pakistan.
SIME, 2003, Journal article on Salt Iodization, Monitoring, and Evaluation from
Int J Endocrinol Metab 2003; 2:46-47
UNICEF, 2006, Iodine Deficiency Disorders and Salt Iodization in Azerbaijan by UNICEF, January 2006)
Nepal, 2005, Iodine Deficiency Disorders Status Survey in Nepal