GIS based Hydrogeological Vulnerability Mapping …Geofísica Internacional 47 (2), 85-97 (2008) 85...
13
Geofísica Internacional 47 (2), 85-97 (2008) 85 GIS based Hydrogeological Vulnerability Mapping of Groundwater Resources in Jerash Area – Jordan N. Hammouri 1 * and A. El-Naqa 2 1 Department of Earth and Environmental Sciences, Faculty of Natural Resources and Environment, Hashemite University, Zarqa, Jordan 2 Department of Water Management and Environment, Faculty of Natural Resources and Environment, Hashemite University, Zarqa, Jordan Received: December 4, 2006; accepted: September 11, 2007 Resumen El estudio de vulnerabilidad de aguas subterráneas en la región de Yerash, Jordania fue obtenido mediante las metodologías de EPIK y DRASTIC. Se usó GIS para mapear las zonas protegidas y para sugerir un plan de protección para mejorar la calidad del agua subterránea en los principales manantiales y pozos. Los niveles de contaminación bacteriana y de nitratos son elevados. El efluente doméstico es la fuente más importante de contaminación; vienen en segundo lugar la precipitación en zonas urba- nas, los fertilizantes agrícolas y los desechos sólidos. En el mapa de EPIK, la vulnerabilidad extrema abarca hasta 41% del área total; en cambio, en el mapa de DRASTIC las áreas de alta vulnerabilidad ocupan solo un 23% del área. La correlación de los datos de contaminación microbiana y química con ambos mapas der vulnerabilidad es buena. Asimismo se observa que concuerdan las áreas señaladas como “altamente vulnerables” con las de alto nivel de contaminación. Palabras clave: Aguas subterráneas, vulnerabilidad, DRASTIC, EPIK, karst, Jordania, GIS. Abstract This paper presents groundwater vulnerability mapping for Jerash area, north Jordan generated using EPIK and DRAS- TIC models. These models have been implemented using GIS to delineate groundwater protection zones and to suggest a protection plan to improve groundwater quality of the major springs and wells. Most of the groundwater resources in the study area are polluted and bacteria and nitrate levels are high. Different sources of groundwater pollution have been identified. Domestic wastewater is considered as a major source of pollution. Urban runoff, fertilizers from agricultural return flows and solid waste disposal appear to be secondary sources. The most relevant vulnerability class of EPIK map is very high which accounts for about 41 % of the total area. While in the DRASTIC vulnerability map, areas with high vulnerability were only about 23 % of the total area. There is a good correlation between vulnerability maps obtained from both models with microbiological and chemical pollution evidences. There is also a good agreement between the areas classified as “highly vulnerable” and those that have high levels of pollution. Key words: Groundwater, vulnerability, DRASTIC, EPIK, karst, Jordan, GIS. Introduction Jordan is an arid to semi-arid country, with a land area of approximately 90,000 km². The mean annual rainfall in Jordan ranges between 50 mm in the desert region to about 600 mm in the eastern mountains adjacent to the Jordan valley. As a result of increasing population pressu- re in recent years, Jordan has needed to increment exploi- tation of natural resources as well as protect. Therefore, the demand of high-quality drinking wa- ter is increasing, while the average domestic water con- sumption is less than 100 liters/capita/day which is one of the lowest rates in the world (Water Authority of Jordan –WAJ-, 2002). In Jordan, stress on groundwater resources is related to two factors: 1) Water has traditionally been scarce due to climatic conditions i.e., low rainfall and high evaporation. 2) Excessive groundwater withdrawal has caused severe lowering of groundwater table by more than 2 m/year in some fields in central and northern Jordan (Margane, 1995). The intensive utilization of aquifers has changed the groundwater chemical quality. The study of these changes requires the design of monitoring networks. One of the most successful tools for monitoring system has been the use of vulnerability maps. Vulnerability maps have become an ever more essential tool for groundwater protection and environmental management (Vias et al., 2005). Several
Transcript of GIS based Hydrogeological Vulnerability Mapping …Geofísica Internacional 47 (2), 85-97 (2008) 85...
Geofísica Internacional 47 (2), 85-97 (2008)
85
GIS based Hydrogeological Vulnerability Mapping of Groundwater Resources in Jerash Area – Jordan
N. Hammouri1* and A. El-Naqa2
1Department of Earth and Environmental Sciences, Faculty of Natural Resources and Environment, Hashemite University, Zarqa, Jordan2 Department of Water Management and Environment, Faculty of Natural Resources and Environment, Hashemite University, Zarqa, Jordan
Received: December 4, 2006; accepted: September 11, 2007
Resumen
El estudio de vulnerabilidad de aguas subterráneas en la región de Yerash, Jordania fue obtenido mediante las metodologías de EPIK y DRASTIC. Se usó GIS para mapear las zonas protegidas y para sugerir un plan de protección para mejorar la calidad del agua subterránea en los principales manantiales y pozos. Los niveles de contaminación bacteriana y de nitratos son elevados.
El efluente doméstico es la fuente más importante de contaminación; vienen en segundo lugar la precipitación en zonas urba-nas, los fertilizantes agrícolas y los desechos sólidos.
En el mapa de EPIK, la vulnerabilidad extrema abarca hasta 41% del área total; en cambio, en el mapa de DRASTIC las áreas de alta vulnerabilidad ocupan solo un 23% del área. La correlación de los datos de contaminación microbiana y química con ambos mapas der vulnerabilidad es buena. Asimismo se observa que concuerdan las áreas señaladas como “altamente vulnerables” con las de alto nivel de contaminación.
Palabras clave: Aguas subterráneas, vulnerabilidad, DRASTIC, EPIK, karst, Jordania, GIS.
AbstractThis paper presents groundwater vulnerability mapping for Jerash area, north Jordan generated using EPIK and DRAS-
TIC models. These models have been implemented using GIS to delineate groundwater protection zones and to suggest a protection plan to improve groundwater quality of the major springs and wells. Most of the groundwater resources in the study area are polluted and bacteria and nitrate levels are high.
Different sources of groundwater pollution have been identified. Domestic wastewater is considered as a major source of pollution. Urban runoff, fertilizers from agricultural return flows and solid waste disposal appear to be secondary sources.
The most relevant vulnerability class of EPIK map is very high which accounts for about 41 % of the total area. While in the DRASTIC vulnerability map, areas with high vulnerability were only about 23 % of the total area. There is a good correlation between vulnerability maps obtained from both models with microbiological and chemical pollution evidences. There is also a good agreement between the areas classified as “highly vulnerable” and those that have high levels of pollution.
Key words: Groundwater, vulnerability, DRASTIC, EPIK, karst, Jordan, GIS.
Introduction
Jordan is an arid to semi-arid country, with a land area of approximately 90,000 km². The mean annual rainfall in Jordan ranges between 50 mm in the desert region to about 600 mm in the eastern mountains adjacent to the Jordan valley. As a result of increasing population pressu-re in recent years, Jordan has needed to increment exploi-tation of natural resources as well as protect.
Therefore, the demand of high-quality drinking wa-ter is increasing, while the average domestic water con-sumption is less than 100 liters/capita/day which is one of the lowest rates in the world (Water Authority of Jordan –WAJ-, 2002).
In Jordan, stress on groundwater resources is related to two factors: 1) Water has traditionally been scarce due to climatic conditions i.e., low rainfall and high evaporation. 2) Excessive groundwater withdrawal has caused severe lowering of groundwater table by more than 2 m/year in some fields in central and northern Jordan (Margane, 1995).
The intensive utilization of aquifers has changed the groundwater chemical quality. The study of these changes requires the design of monitoring networks. One of the most successful tools for monitoring system has been the use of vulnerability maps. Vulnerability maps have become an ever more essential tool for groundwater protection and environmental management (Vias et al., 2005). Several

86
Geofís. Int. 47 (2), 2008
methods have been proposed for vulnerability assessment of aquifers. The assessment systems used in this study are derived from DRASTIC (Aller et al., 1985) and EPIK (SAEFL, 1998).
DRASTIC was the earliest method applied to evaluate vulnerability to contamination based on point count system (Cucchi, et al., 2004). According to Foster and Hirata (1998), DRASTIC method is suitable for areas with low data availability and known hydrogeological setup. This method is a popular approach in groundwater vulnerability because it is relatively inexpensive and straightforward, and uses data that are commonly available or could be estimated to produce a vulnerability maps that can be easily interpreted (Margane, 2003).
EPIK is a parameter weighting and rating method especially developed for karst aquifers to protect water supply sources (springs and wells) (Doerfliger et al., 1999). It is recommended for areas with karst features; however, it requires a detailed evaluation of these features, which is often difficult, costly and time consuming as it involves field work, geophysical, isotopic, and hydrological studies, analysis of the hydraulic character, etc. (Margane, 2003).
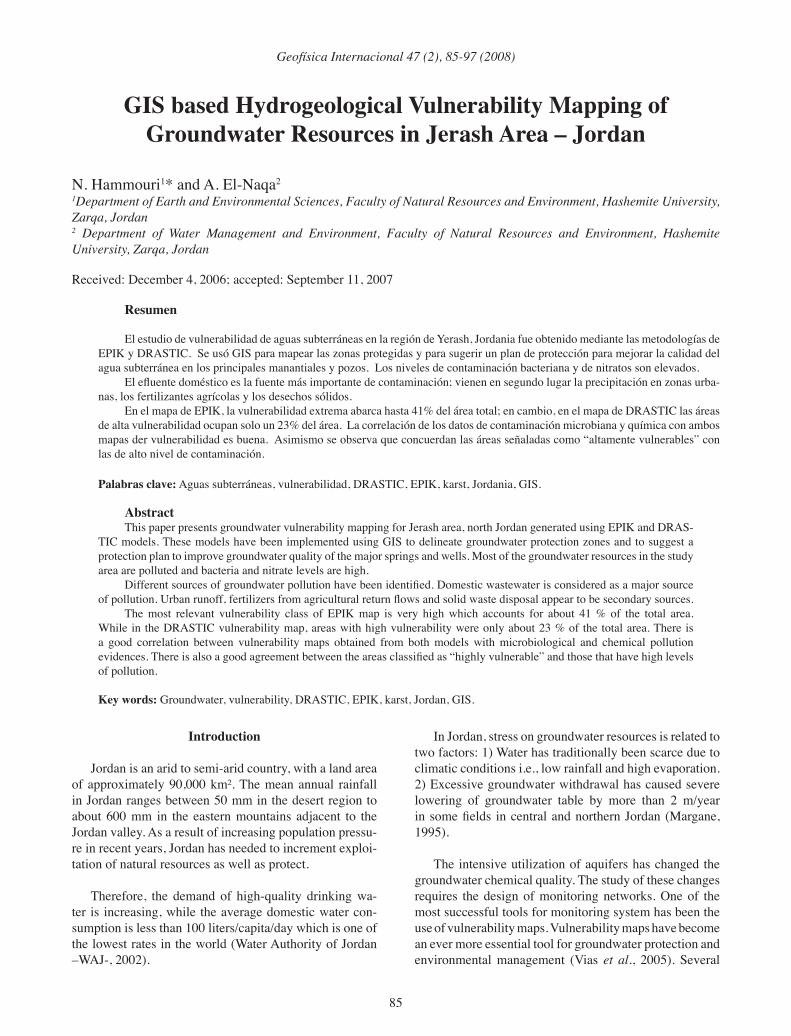
DRASTIC and EPIK methods were applied to delineate groundwater vulnerability zones in the Jerash watershed which is located in the karst highlands of north Jordan (Fig. 1). Furthermore, the vulnerability maps were used to define groundwater protection zones to implement protection programs for these groundwater sources. The earlier studies have been carried out by Camp Dresser & McKee International Inc. (CDM 1999; 2001; 2002).
Description of Jerash Watershed
The Jerash watershed comprises an area of 39 km² located in the northwestern part of the highlands of Amman-Zarqa basin (Fig. 1). There are three main settlements in the watershed. Among these, Jerash city is one of the best preserved Roman cities in the Middle East. There are 61,500 inhabitants in the watershed; it has been growing rapidly, placing additional constrains on the stressed water supply (Department of Statistics –DOS-, 2007). The groundwater resources in the Jerash watershed are provided from different aquifers, comprising Kurnub sandstone aquifer (K), Hummar dolomitic limestone aquifer (A4), and Nau’r limestone aquifer (A1/2).
Thirteen major springs are located in the study area, of which five emerge from the A4 aquifer, six springs from A1/2 aquifer and two springs from K aquifer (Alawneh, 1998).
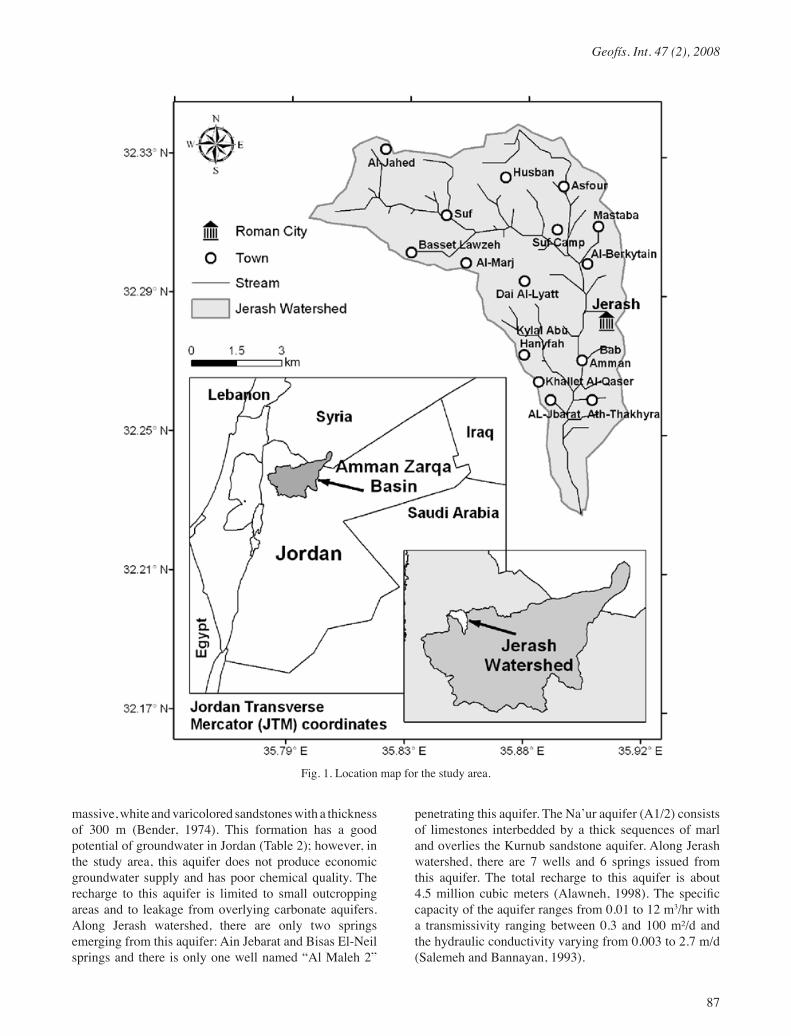
The major springs and wells in the study area are summarized in Table 1. El-Qairawan spring (elevation 570 m above sea level) is one of the major springs located immediately northeast of the Jerash archaeological site. The discharged water from this spring is pumped directly to the distribution network of Al Saru area near Jerash.
The discharge of the springs has decreased dramatically from an average of about 170 m3/hr in 1980 to about 75 m3/hr in 2002 (WAJ, 2002). The drop in discharge is likely due to an increase in pumping from the Shawahed wells located upgradient from the El-Qairawan spring. The other small springs (<10 m3/hr) can be locally important, both for domestic and agricultural purposes. During winter months, rooftop runoff and cisterns supplement individual household supplies.
Hydrogeological Characterization
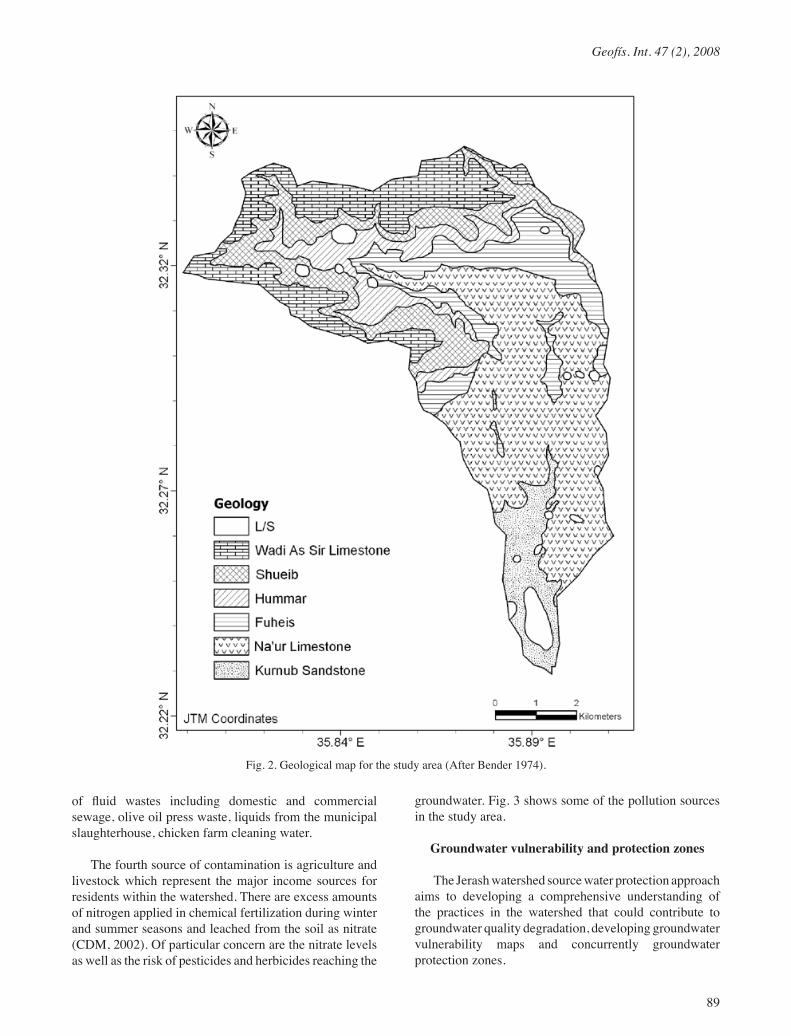
The geologic column of the watershed area compri-ses a cover of sedimentary rocks of Lower and Upper Cretaceous age. These rocks include sandstones, limesto-nes, dolomitic limestones, marly limestones and shales (Bender, 1974). The geological formations outcropping in the area are shown in the geologic map (Fig. 2). Table 2 shows the geological column and hydrogeological rock classification in the area. Limestone rocks are predomi-nantly characterized by karstification phenomena, where the watershed boundary was defined by using topogra-phic high points, coincident with surface water drainages. Two main wadis (streams) traverse the valley floor (Wadi Suf and Wadi Dayr). In most of the year, these wadies have intermittent base flow, except the lower reaches of Wadi Dayr, which has perennial flow. There are numerous outcrops in portions of the watershed, such as limestone and chalky limestone formations. As a result, many epi-karst features (e.g., sinkholes) can be noticed (Kolb et al., 2004).
Major springs in the watershed are found in close proximity to one another, but at different elevations and outcrops, indicating the presence of localized, perched flow systems. Along Wadi Dayr, several small springs emerge on the flanks of the wadi, and some of this water naturally re-infiltrates, while the remainder of the water is either used locally or piped along canals and aqueducts for irrigation purposes. Some of the irrigation water re-infiltrates and recharges the alluvial sediments of Wadi Dayr, then flows towards the El-Qairawan spring in Jer-ash (CDM, 2001).
Aquifer Characteristics
The main aquifers in Jerash watershed area include Kurnub sandstone aquifer (K), Nau’r aquifer (A1/2) and Hummar aquifer (A4). The Kurnub aquifer consists of
87
Geofís. Int. 47 (2), 2008
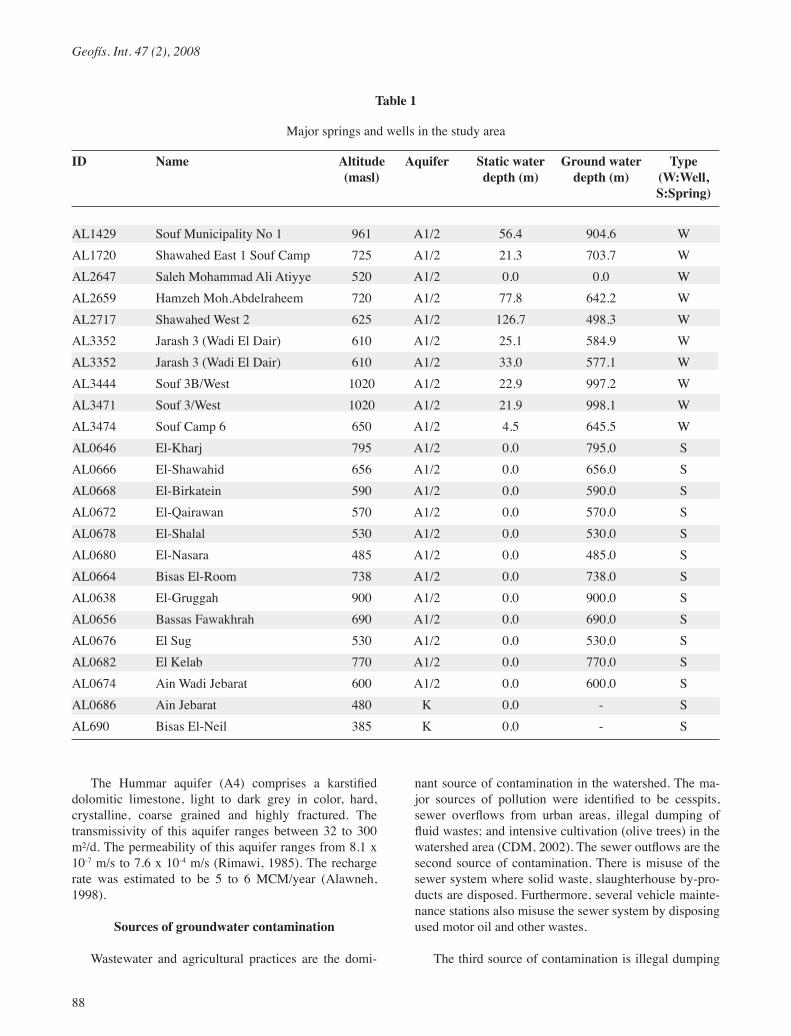
penetrating this aquifer. The Na’ur aquifer (A1/2) consists of limestones interbedded by a thick sequences of marl and overlies the Kurnub sandstone aquifer. Along Jerash watershed, there are 7 wells and 6 springs issued from this aquifer. The total recharge to this aquifer is about 4.5 million cubic meters (Alawneh, 1998). The specific capacity of the aquifer ranges from 0.01 to 12 m3/hr with a transmissivity ranging between 0.3 and 100 m²/d and the hydraulic conductivity varying from 0.003 to 2.7 m/d (Salemeh and Bannayan, 1993).
massive, white and varicolored sandstones with a thickness of 300 m (Bender, 1974). This formation has a good potential of groundwater in Jordan (Table 2); however, in the study area, this aquifer does not produce economic groundwater supply and has poor chemical quality. The recharge to this aquifer is limited to small outcropping areas and to leakage from overlying carbonate aquifers. Along Jerash watershed, there are only two springs emerging from this aquifer: Ain Jebarat and Bisas El-Neil springs and there is only one well named “Al Maleh 2”
Fig. 1. Location map for the study area.
88
Geofís. Int. 47 (2), 2008
The Hummar aquifer (A4) comprises a karstified dolomitic limestone, light to dark grey in color, hard, crystalline, coarse grained and highly fractured. The transmissivity of this aquifer ranges between 32 to 300 m²/d. The permeability of this aquifer ranges from 8.1 x 10⁻⁷ m/s to 7.6 x 10⁻⁴ m/s (Rimawi, 1985). The recharge rate was estimated to be 5 to 6 MCM/year (Alawneh, 1998).
Sources of groundwater contamination
Wastewater and agricultural practices are the domi-
nant source of contamination in the watershed. The ma-jor sources of pollution were identified to be cesspits, sewer overflows from urban areas, illegal dumping of fluid wastes; and intensive cultivation (olive trees) in the watershed area (CDM, 2002). The sewer outflows are the second source of contamination. There is misuse of the sewer system where solid waste, slaughterhouse by-pro-ducts are disposed. Furthermore, several vehicle mainte-nance stations also misuse the sewer system by disposing used motor oil and other wastes.
The third source of contamination is illegal dumping
Table 1
Major springs and wells in the study area
ID Name Altitude Aquifer Static water Ground water Type (masl) depth (m) depth (m) (W:Well, S:Spring)
AL1429 Souf Municipality No 1 961 A1/2 56.4 904.6 WAL1720 Shawahed East 1 Souf Camp 725 A1/2 21.3 703.7 WAL2647 Saleh Mohammad Ali Atiyye 520 A1/2 0.0 0.0 WAL2659 Hamzeh Moh.Abdelraheem 720 A1/2 77.8 642.2 WAL2717 Shawahed West 2 625 A1/2 126.7 498.3 WAL3352 Jarash 3 (Wadi El Dair) 610 A1/2 25.1 584.9 WAL3352 Jarash 3 (Wadi El Dair) 610 A1/2 33.0 577.1 WAL3444 Souf 3B/West 1020 A1/2 22.9 997.2 WAL3471 Souf 3/West 1020 A1/2 21.9 998.1 WAL3474 Souf Camp 6 650 A1/2 4.5 645.5 WAL0646 El-Kharj 795 A1/2 0.0 795.0 SAL0666 El-Shawahid 656 A1/2 0.0 656.0 SAL0668 El-Birkatein 590 A1/2 0.0 590.0 SAL0672 El-Qairawan 570 A1/2 0.0 570.0 SAL0678 El-Shalal 530 A1/2 0.0 530.0 SAL0680 El-Nasara 485 A1/2 0.0 485.0 SAL0664 Bisas El-Room 738 A1/2 0.0 738.0 SAL0638 El-Gruggah 900 A1/2 0.0 900.0 SAL0656 Bassas Fawakhrah 690 A1/2 0.0 690.0 SAL0676 El Sug 530 A1/2 0.0 530.0 SAL0682 El Kelab 770 A1/2 0.0 770.0 SAL0674 Ain Wadi Jebarat 600 A1/2 0.0 600.0 SAL0686 Ain Jebarat 480 K 0.0 - SAL690 Bisas El-Neil 385 K 0.0 - S
89
Geofís. Int. 47 (2), 2008
of fluid wastes including domestic and commercial sewage, olive oil press waste, liquids from the municipal slaughterhouse, chicken farm cleaning water.
The fourth source of contamination is agriculture and livestock which represent the major income sources for residents within the watershed. There are excess amounts of nitrogen applied in chemical fertilization during winter and summer seasons and leached from the soil as nitrate (CDM, 2002). Of particular concern are the nitrate levels as well as the risk of pesticides and herbicides reaching the
groundwater. Fig. 3 shows some of the pollution sources in the study area.
Groundwater vulnerability and protection zones
The Jerash watershed source water protection approach aims to developing a comprehensive understanding of the practices in the watershed that could contribute to groundwater quality degradation, developing groundwater vulnerability maps and concurrently groundwater protection zones.
Fig. 2. Geological map for the study area (After Bender 1974).
90
Geofís. Int. 47 (2), 2008
In this study two different methods were used for the assessment of groundwater vulnerability and conse-quently establishing groundwater protection zones. EPIK method (SAEFL, 1998) and DRASTIC method (Aller et al., 1987) used in this study. These methods will be briefly described.
EPIK method
The EPIK method is a general multi-attribute method used for karst aquifer vulnerability mapping, providing a basis for establishing groundwater protection zones in the karst environment (Doerfliger and Zwhalen, 1995, 1997). This model was developed with the support of the Swiss Federal Office for Environment, Forest and Landscape (SAFEL, 1998). The objective of this method is to produ-ce vulnerability maps for karst spring water catchments. According to the selected attributes, the assigned vulnera-bility zones can be the basis for delineating groundwater protection zones.
The acronym EPIK refers to the following four attri-butes:
E - Development of the Epikarst P - Effectiveness of the Protective cover I - Infiltration condition K - Development of the Karst network.
The overall protection index F is calculated based on the following equation:
F = αE + βP + γ I + б K
where α, β, γ and б are weighting coefficients
The available geological and morphological informa-tion about the study area was used to determine E and K parameters. Soil and landuse maps that have been genera-ted by the Ministry of Agriculture in 1995 at a scale of 1:50,000 as a part of the national soil and land use ma-pping were used to generate the P and I parameter the-matic layer.
These four thematic layers were generated using ArcMAP 9.0 and Spatial Analyst to integrate all different geospatial data from these layers into EPIK vulnerability
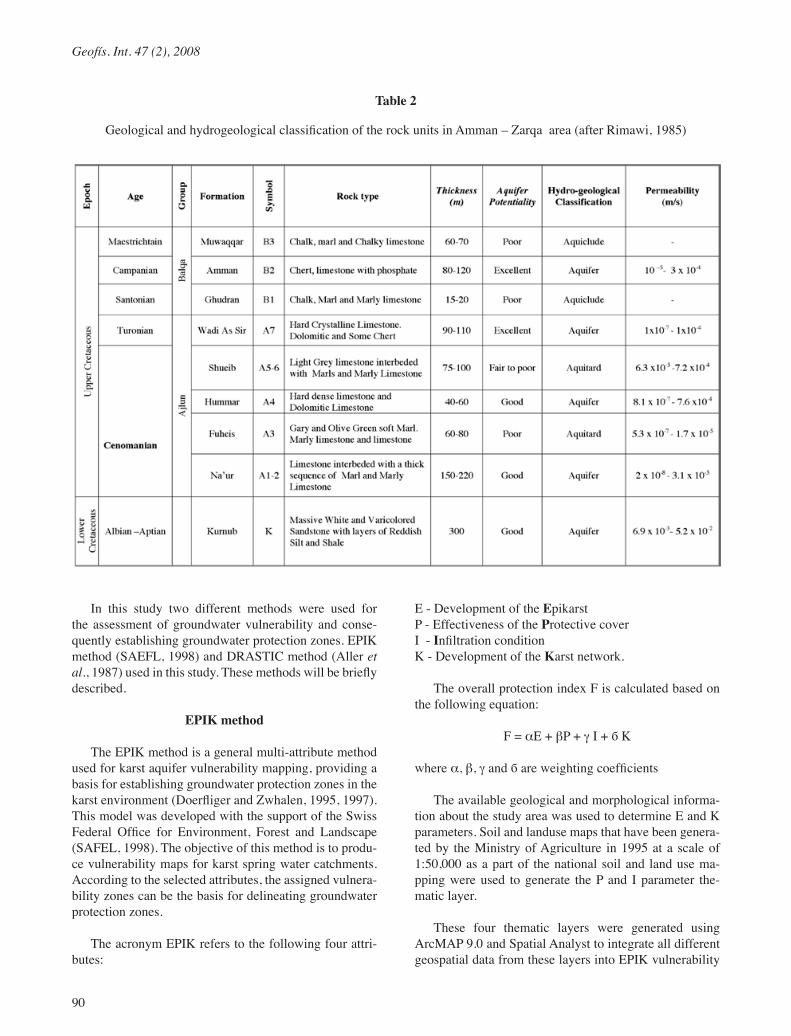
Table 2
Geological and hydrogeological classification of the rock units in Amman – Zarqa area (after Rimawi, 1985)

91
Geofís. Int. 47 (2), 2008
map. This map has been classified into four vulnerability classes (Fig. 4) that range from low to very high according to Doerfliger and Zwahlen (1997) vulnerability classification. Fig. 5 shows a histogram for the obtained classes. Accordingly, about 68% of the total land area within the watershed has a vulnerability rating equal to or greater than “high.” This is significant and expected as a result of karstic character of the aquifers and the existence of different sources of groundwater pollution on the watershed.
DRASTIC method
DRASTIC is an acronym representing seven hydrogeologic parameters or factors used for the assess-ment of pollution potential: Depth to water; net Recharge, Aquifer media, Soil media, Topography (slope), Impact of the vadose zone media, and hydraulic Conductivity of the aquifer. It employs a numerical ranking system that assigns relative weights to each parameter to help in the evaluation of relative groundwater vulnerability
Fig. 3. Some of the pollution sources in Jerash Watershed.

92
Geofís. Int. 47 (2), 2008
to contamination. Each parameter comprises a range of categories that are scored on a scale from 1 to 10. The variable rating allows the user to select either a typical value or to adjust the value based on more specific knowledge of the area under consideration (Aller et al., 1987). Determination of the DRASTIC index number (pollution potential) for a given area involves multiplying each factor rating by its weight and adding together the resulting values. Higher sum values represent a greater potential for pollution or a greater vulnerability of the aquifer to contamination. Finally, the total impact factor score, the DRASTIC index number, can be calculated as:DRASTIC Index = DrDw + RrRw + ArAw + SrSw + TrTw + IrIw + CrCwFig. 5. Histogram for the obtained EPIK vulnerability classes.
Fig. 4. EPIK vulnerability map for the study area.
93
Geofís. Int. 47 (2), 2008
where:
r = Rating for area being evaluated (1-10)
w = Importance weight for the factor (1-5)
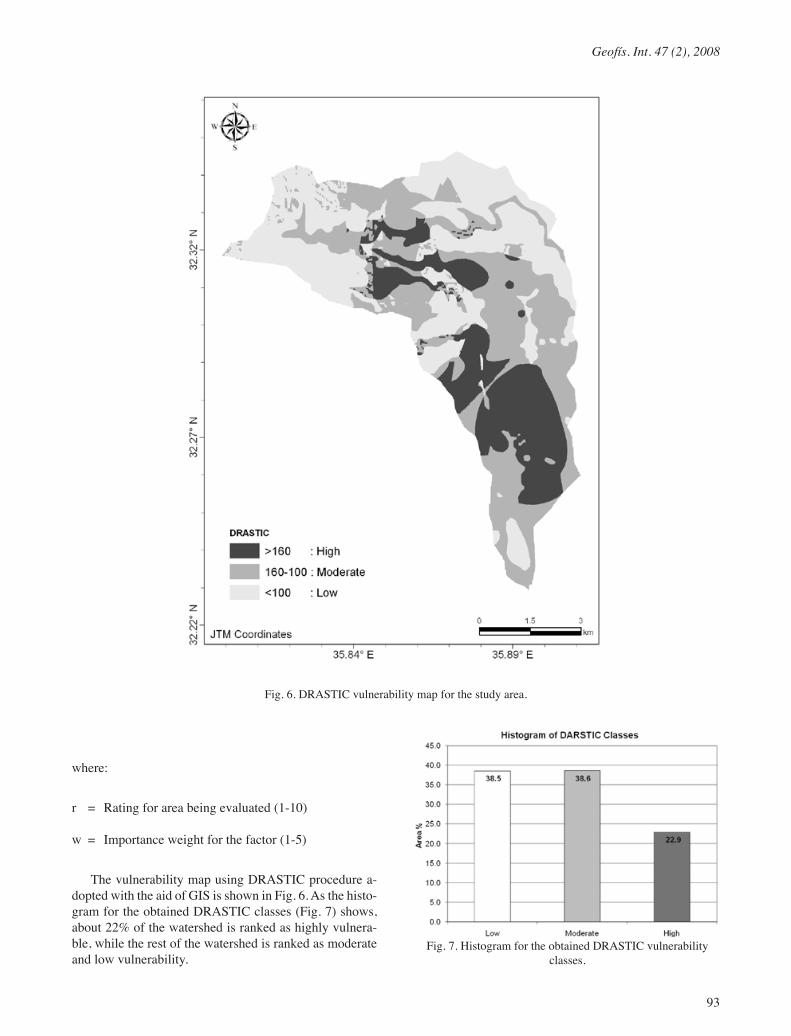
The vulnerability map using DRASTIC procedure a-dopted with the aid of GIS is shown in Fig. 6. As the histo-gram for the obtained DRASTIC classes (Fig. 7) shows, about 22% of the watershed is ranked as highly vulnera-ble, while the rest of the watershed is ranked as moderate and low vulnerability.
Fig. 6. DRASTIC vulnerability map for the study area.
Fig. 7. Histogram for the obtained DRASTIC vulnerability classes.
94
Geofís. Int. 47 (2), 2008
Comparing DRASTIC and EPIK vulnerability map
As Figs. 3 and 5 illustrate, EPIK and DRASTIC method may agree on some degree of vulnerability about a specific area; however, some disagreement can be noticed in both maps. This fact would be expected as the assumptions behind each method are different. DRASTIC method is based on seven hydrological parameters that combine together to assess pollution potential. These factors have different weights that represent the participation of a specific parameter in stimulating groundwater pollution process. On the other hand EPIK is based of four parameters; where two of them are used
to describe karstic morphology and karst network (E and K). Therefore, a major difference between EPIK and DRASTIC is the ability of the former method to describe epikarstic feature. This becomes an important fact when knowing that the study area have a lot of epikarstic features (e.g., holes, caves, sinkholes).
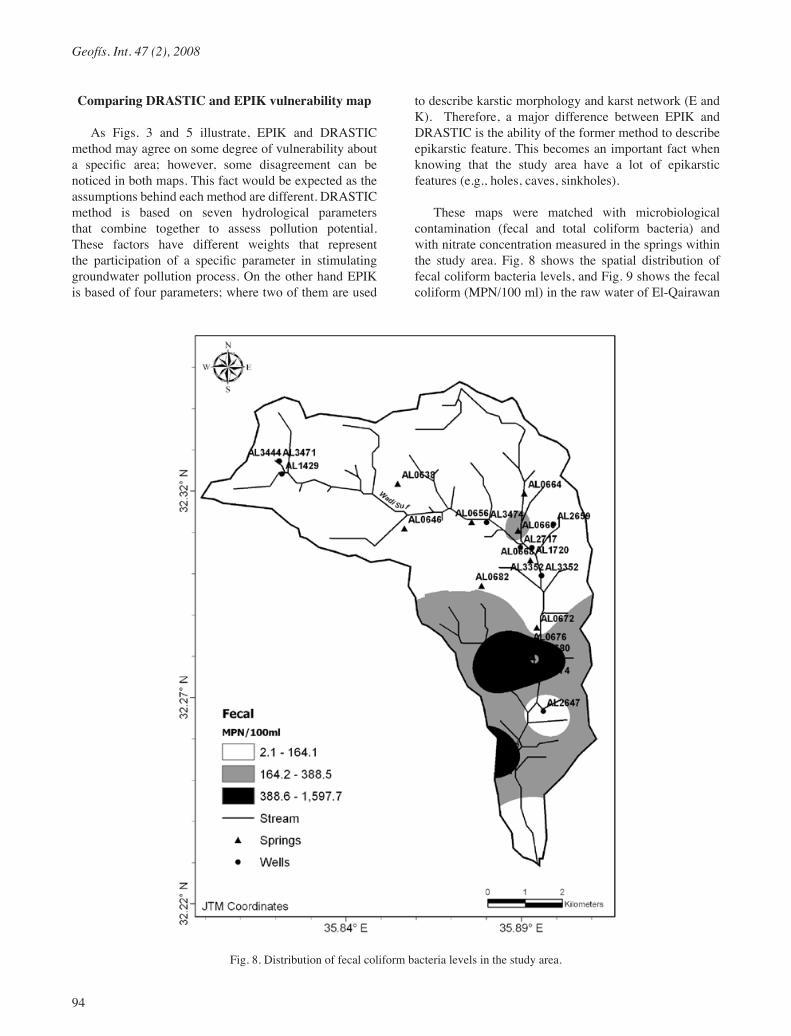
These maps were matched with microbiological contamination (fecal and total coliform bacteria) and with nitrate concentration measured in the springs within the study area. Fig. 8 shows the spatial distribution of fecal coliform bacteria levels, and Fig. 9 shows the fecal coliform (MPN/100 ml) in the raw water of El-Qairawan
Fig. 8. Distribution of fecal coliform bacteria levels in the study area.
95
Geofís. Int. 47 (2), 2008
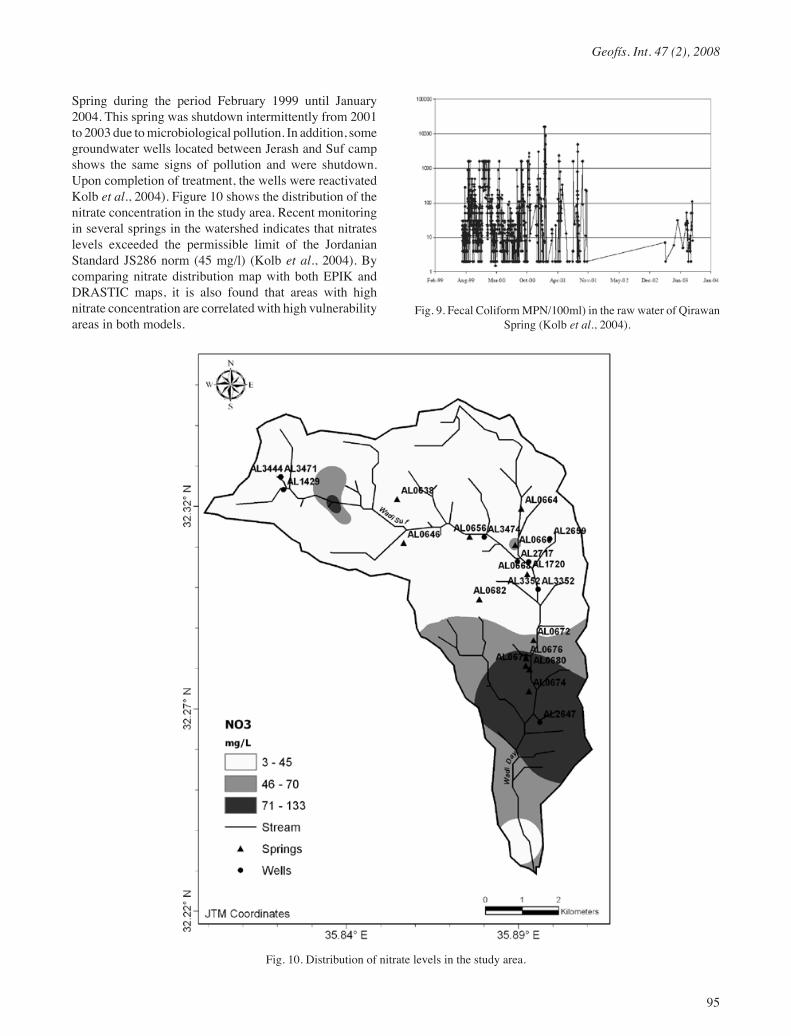
Spring during the period February 1999 until January 2004. This spring was shutdown intermittently from 2001 to 2003 due to microbiological pollution. In addition, some groundwater wells located between Jerash and Suf camp shows the same signs of pollution and were shutdown. Upon completion of treatment, the wells were reactivated Kolb et al., 2004). Figure 10 shows the distribution of the nitrate concentration in the study area. Recent monitoring in several springs in the watershed indicates that nitrates levels exceeded the permissible limit of the Jordanian Standard JS286 norm (45 mg/l) (Kolb et al., 2004). By comparing nitrate distribution map with both EPIK and DRASTIC maps, it is also found that areas with high nitrate concentration are correlated with high vulnerability areas in both models.
Fig. 10. Distribution of nitrate levels in the study area.
Fig. 9. Fecal Coliform MPN/100ml) in the raw water of Qirawan Spring (Kolb et al., 2004).

96
Geofís. Int. 47 (2), 2008
Conclusions
This study focuses on the assessment of aquifer vulnerability at Jerash area, northern Jordan. On the basis of the existing data, it was possible to derive an overall generalized assessment of groundwater vulnerability in Jerash. Since the vulnerability maps show also the location of the main water supply in the watershed such as springs and production wells, the combination of the two maps provides an indication of potential sources of pollution in the areas around major wells and springs and allows an initial assessment of the risk of groundwater contamination in the area.
Comparison of vulnerability maps obtained from both models indicates that there is a high degree of agreement of the areas with high vulnerability in DRASTIC and EPIK models in some areas.
The obtained vulnerability maps were compared with microbiological contamination (fecal coliform bacteria) and with nitrate levels. There is a good correlation bet-ween the areas with high microbiological and chemical pollution evidences and the areas which have shown high vulnerability from both EPIK and DRASTIC methods.
Bibliography
Alawneh, M., 1998. Hydrology and hydrochemistry of Wadi Jerash catchment area. Unpublised MSc. Thesis, University of Baghdad, 180pp.
Aller, L., T. Bennett, J. H. Lehr and R. J. Petty, 1985. ‘DRASTIC: A standardized system for evaluating groundwater pollution potential using hydrogeologic settings’. U.S. EPA, Robert S. Kerr Environmental Research Laboratory, Ada, OK, EPA/600/2-85/0108, 163 pp.
Aller, L., T. Bennet, J. H. Lehr, R. J. Petty and G. Hackett, 1987. ‘DRASTIC: A standardized system for evaluat-ing groundwater pollution potential using hydrogeo-logic settings’. EPA-600/2-87-035.
Bender, F., 1974. The geology of Jordan, contribution to the regional geology of the earth, supplementary edi-tion of volume 7. Gebrueder Borntraeger, Berlin.
Camp Dresser & McKee International Inc. (CDM), 1999. Rehabilitation of Selected Springs and Wells in Jor-dan. In: Assessment Report & Technical Feasibility Study for Rehabilitation of Springs at Salt, Jordan. Prepared for USAID, Amman –Jordan.
Camp Dresser & McKee International Inc. (CDM), 2001. “History, Water Quality and Regulatory Review of Emergency Wells and Springs Assistance Project”, USAID Report, May 2001.
Camp Dresser & McKee International Inc. (CDM), 2002. “Jordan Water Quality Management Program: Com-pilation of technical Memoranda”, USAID Report, December 2002.
Cucchi, F., P. Forti and L. Zini, 2004. The vulnerability of complex karst hydrostructures: Problems and perspec-tives. Geofísica Internacional, 43, 4, 533-540.
Department of Statistics (DOS), 2007. Annual Handbook of Statistics, Amman-Jordan.
Doerfliger, N. and F. Zwahlen, 1995. EPIK: a new method for outlining of protection areas in karst environment. In: Günay G., Johnson I. (eds.) Proceedings 5th In-ternational symposium and field seminar on karst wa-ters and environmental impacts. Antalya, Sep. 1995, Balkema, Rotterdam, pp. 117–123.
Doerfliger, N. and F. Zwahlen, 1997. EPIK: Cartographic Method for Assessing the Vulnerability of Karst Aqui-fers for the purpose of Delineating Protection Zones. Proceedings of the 1997 Karst and Cave Management Symposium 13th National Cave Management Sympo-sium, Bellingham, Washington and Chilliwack and Vancouver Island, BC, Canada October 7-10, 1997 karstic environment. International Symposium on Karst Waters and Environmental impacts, Antalya, 10-20 September 1995. Balkema, Netherland.
Doerfliger, N, PY Jeannin and F. Zwahlen, 1999. Water vulnerability assessment in karst environments: a new method of defining protection areas using a multiat-tribute approach and GIS tools (EPIK method). En-vironmental Geology, Volume 39, Number 2 p.165–176.
Foster, S. and R. Hirata, 1988. Groundwater Pollution Risk Assessment – A Methodology Using Available Data. Pan American Center for Sanitary Engineering and Environmnetal Science (CEPIS), 73p.: Lima/Peru.
Kolb, B. H., A. Abu Hijleh, C. Parameswar, N. Sunna and A. Hijazi, 2004. “Implementing Jordan’s First Source Water Protection Program”, Water Environment Fede-ration Watershed 2004 Conference, July 2004.
Margane, A., 1995. Groundwater resources of northern Jordan- Vol. 2, Part 2: Monitoring of groundwater levels

97
Geofís. Int. 47 (2), 2008
in Jordan. Report prepared by Technical Cooperation Project BMZ No. 89.2105.8, BGR-Archive No. 118702; Hannover and Amman [Unpubl.].
Margane, A., 2003. Guideline for Groundwater Vulnera-bility Mapping and Risk Assessment for the Suscepti-bility of Ground Water Resources to Contamination, Technical Cooperation, Project 1996.2189.7, 4, April 2003, 53 p., Damascus.
Rimawi, O., 1985. Hydrochemistry and isotope hydrology of groundwater and surface water in the north-east of Mafraq, Dhuleil, Hallabat, Azraq basin, PhD. Thesis. Tech. University, Muenchen, 240 pp.
Salameh, E. and H. Bannayan, 1993. Water Resources of Jordan: Future and Future Potentials. Friedrich Ebert Stiftung, Amman, Jordan.
SAEFL (Swiss Agency for Environment, Forests and Landscape), 1998. Practical Guide: Groundwater Vul-nerability Mapping in Karstic Regions (EPIK); Appli-cation to Groundwater Protection Zones.
Vias, J., B. Andreo, M. Perles and F. Carrasco, 2005. A compartive study of four schemes for groundwater vulnerability mapping in a diffuse flow carbonate aquifer under Mediterranean climatic condition. Envi-ron. Geol., 47, 586-595.
Water Authority of Jordan (WAJ), 2002. Water Informa-tion System, Ministry of Water and Irrigation, Am-man.
N. Hammouri1* and A. El-Naqa2
1Faculty of Natural Resources and Environment, Hashemite University, Zarqa, P.O.Box 150459 Fax No. +962-5-3826823.2Faculty of Natural Resources and Environment, Hashemite University, Zarqa, P.O.Box 150459Fax No. +962-5-3826823.E-mail: [email protected]*Corresponding author: [email protected]