GIS- Based Flood Risk Mapping for Kilifi county, Kenya Flood Risk... · GIS- Based Flood Risk...
16
ESRI Eastern Africa Education GIS User Conference 10 th - 11 th September, 2015 – JKUAT- Nairobi, Kenya GIS- Based Flood Risk Mapping for Kilifi county, Kenya A Paper Presented by Maina P. M., Ochola S and Onywere S. [email protected] Kenyatta University
Transcript of GIS- Based Flood Risk Mapping for Kilifi county, Kenya Flood Risk... · GIS- Based Flood Risk...

ESRI Eastern Africa Education GIS User Conference 10th- 11th September, 2015 – JKUAT- Nairobi, Kenya
GIS- Based Flood Risk Mapping for
Kilifi county, Kenya
A Paper Presented by
Maina P. M., Ochola S and Onywere S.
Kenyatta University
Introduction
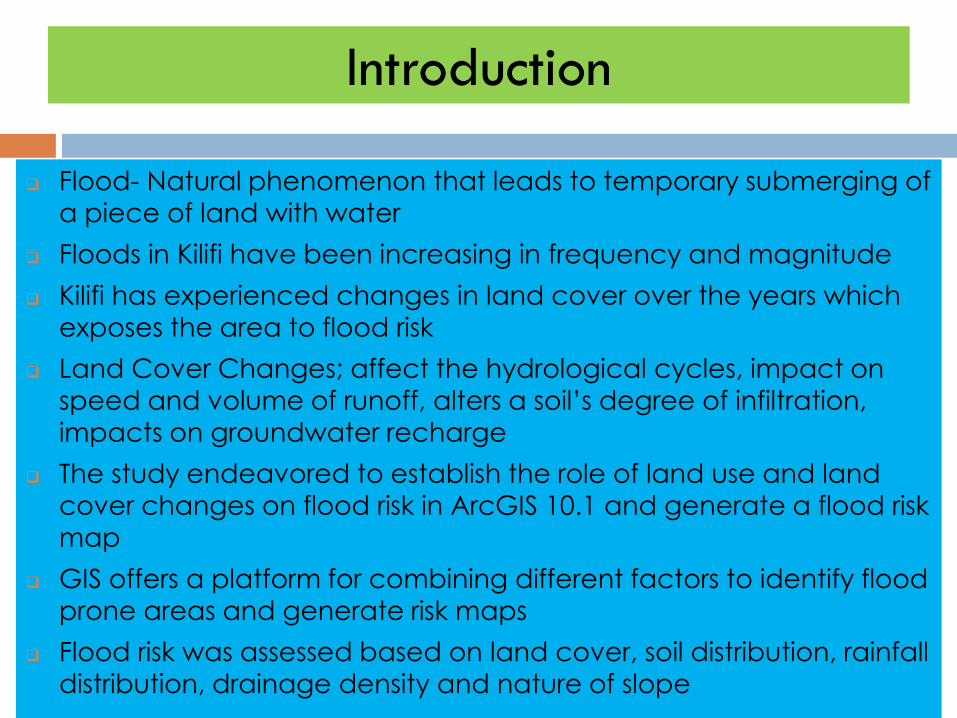
Flood- Natural phenomenon that leads to temporary submerging of
a piece of land with water
Floods in Kilifi have been increasing in frequency and magnitude
Kilifi has experienced changes in land cover over the years which
exposes the area to flood risk
Land Cover Changes; affect the hydrological cycles, impact on speed and volume of runoff, alters a soil’s degree of infiltration,
impacts on groundwater recharge
The study endeavored to establish the role of land use and land
cover changes on flood risk in ArcGIS 10.1 and generate a flood risk
map
GIS offers a platform for combining different factors to identify flood
prone areas and generate risk maps
Flood risk was assessed based on land cover, soil distribution, rainfall
distribution, drainage density and nature of slope
Introduction Cont’d
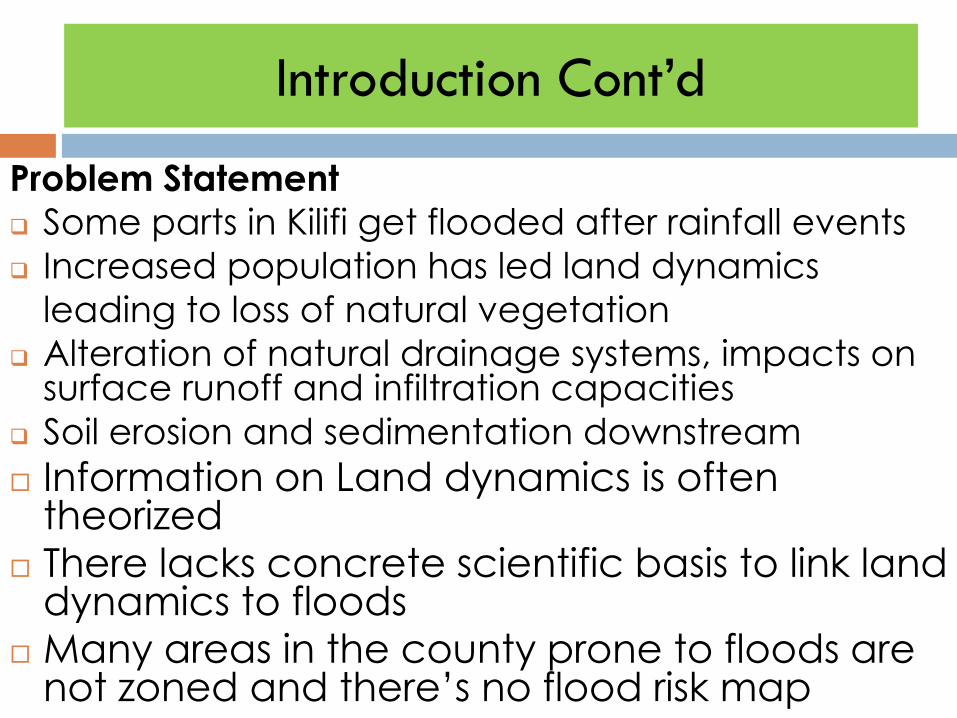
Problem Statement
Some parts in Kilifi get flooded after rainfall events
Increased population has led land dynamics
leading to loss of natural vegetation
Alteration of natural drainage systems, impacts on surface runoff and infiltration capacities
Soil erosion and sedimentation downstream
Information on Land dynamics is often theorized
There lacks concrete scientific basis to link land dynamics to floods
Many areas in the county prone to floods are not zoned and there’s no flood risk map

Materials and Methods Cont’d
MAP OF STUDY AREA
Spatial extent -12,245.90 km2
Population- 1,109,735 (2009 census)2˚ 20’ 4” South, and 39˚05’ 14” East
Materials and Methods Cont’d
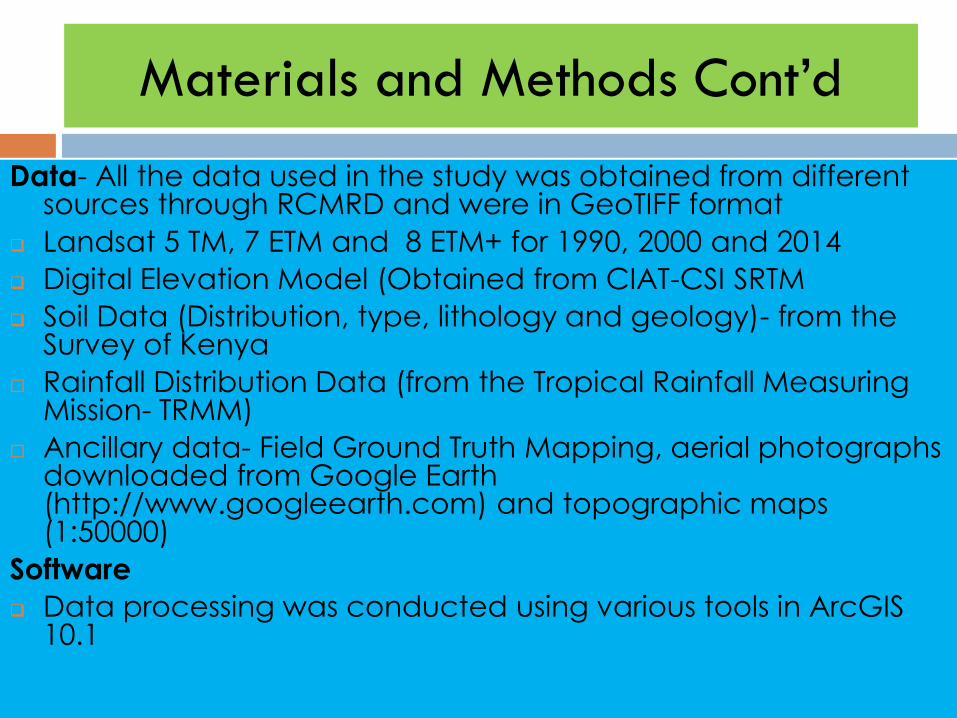
Data- All the data used in the study was obtained from different sources through RCMRD and were in GeoTIFF format
Landsat 5 TM, 7 ETM and 8 ETM+ for 1990, 2000 and 2014
Digital Elevation Model (Obtained from CIAT-CSI SRTM
Soil Data (Distribution, type, lithology and geology)- from the Survey of Kenya
Rainfall Distribution Data (from the Tropical Rainfall Measuring Mission- TRMM)
Ancillary data- Field Ground Truth Mapping, aerial photographs downloaded from Google Earth (http://www.googleearth.com) and topographic maps (1:50000)
Software
Data processing was conducted using various tools in ArcGIS 10.1
Materials and Methods Cont’d
Landsat 5, 7 and 8
Images
Mosaicking and
Subsetting
Image Classification
Accuracy analysis
Reclassification of 2014
LULC Map
Land Use Land Cover Maps
and Matrices
Stream Network and
Drainage Density
Drainage Basins
30M DEM Data
Flow Direction
Flow Accumulation
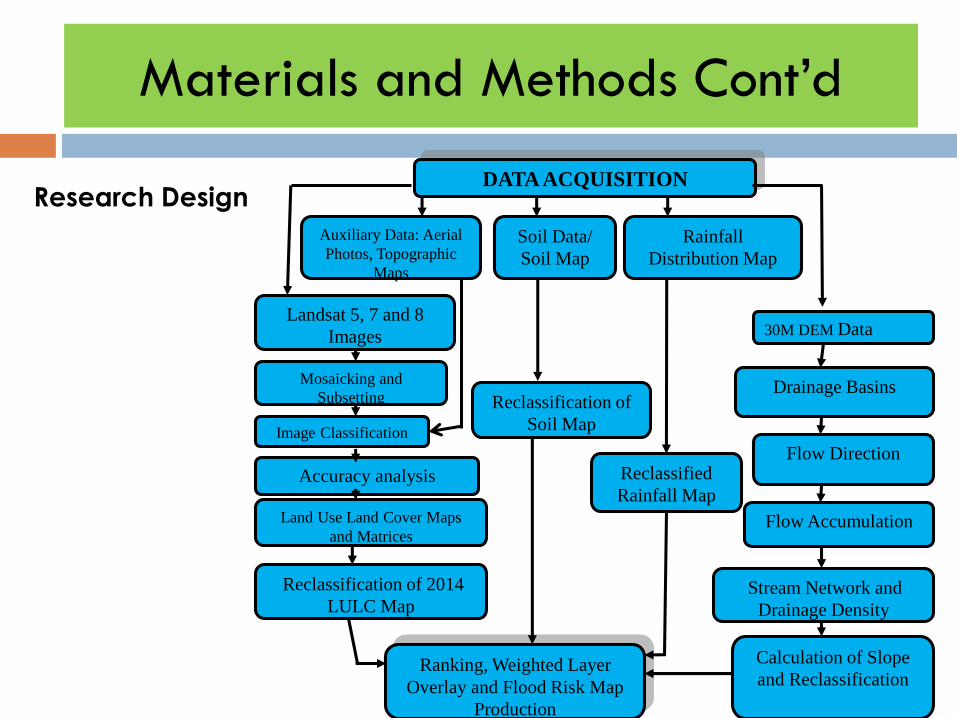
DATA ACQUISITION
Auxiliary Data: Aerial
Photos, Topographic
Maps
Ranking, Weighted Layer
Overlay and Flood Risk Map
Production
Calculation of Slope
and Reclassification
Soil Data/
Soil Map
Reclassification of
Soil Map
Rainfall
Distribution Map
Reclassified
Rainfall Map
Research Design

Results and Discussions
Image Classification- Years1990, 2000 and 2014
Land cover classes: croplands, forestlands, grasslands, settlements,
shrublands and wetlands.
There were significant gains and losses in land cover in the area
between 1990 and 2014 as indicated in the table below
Overall classification accuracy was 86.7% for 1990, 90.2% in 2000 and 92.4% in 2014
0
1000
2000
3000
4000
5000
6000
7000
Croplands Forestlands Grasslands Shrublands Settlements Wetlands
Are
a (
Km
²)
Land Cover Classes
Land Cover Extent in 1990, 2000 and 2014
1990
2000
2014

Results and Discussions
a) Land use land cover map for 1990 b) Land use land cover map for 2000 c) Land Use Land Cover Map for 2014

Results and Discussions Cont’d
Risk based on Land Cover DistributionLand Cover Map for 2014 was used
Six classes were generated; croplands,
forestlands, grasslands, shrublands,
settlements and wetlands
Classes were then reclassified into 5.
Highest rank (1)- assigned to settlements (have lowest soil infiltration
capacities, are highly devegetated,
highly impermeable)
Lowest rank (5)- assigned to wetlands
(are often flooded, not inhabited by humans unless they are reclaimed)
Risk areas based on land cover

Results and Discussions Cont’d
Risk zones based on slope angles
ii) Risk Based on Slope angles and Elevation
Slope angles were generated from the
DEM of the area
Highest rank (1) was assigned to slope
angles between 0 – 1.238˚ as this area is
relatively flat and highly vulnerable to risk
Lowest rank (5) was assigned to areas ,
≥10.244 as they are steep and less likely to
accumulate water
Slope Angle (Degrees) Area (Km²) % Area
0 – 1.238 6520.5 53.3
1.238 – 2.814 3012.5 24.6
2.814 – 5.403 1487.9 12.2
5.403 – 10.244 446.8 3.7
10.244 – 28.705 777.6 6.4

Results and Discussions Cont’d
Risk map based on soil type
Risk Based on Soil Type
Soils were categorized into five classes; very
clayey, clayey, loamy, sandy loam and sandy
Reclassification into 3 classes: Sandy, loamy
and Clayey
Highest rank (1)- Clay soil- has low permeability
Lowest rank (3)- Sandy soil- high infiltration
capacity
Soil Type Area (Km²) % Area
Sandy 2602.3 21.3
Loamy 4800.4 39.1
Clayey 4004.4 32.7
Very Clayey 842.8 6.9

Results and Discussions Cont’d
Risk map based on rainfall
distribution
Risk Based on Rainfall DistributionA mean annual rainfall for the years
between 1990 and 2013 used
5 classes were generated
542mm recorded as the least annual
mean rainfall.
1471mm recorded as the highest annual mean rainfall
High rainfall areas assigned rank (1)
Areas with the least rainfall were
assigned rank (5)
Results and Discussions Cont’d
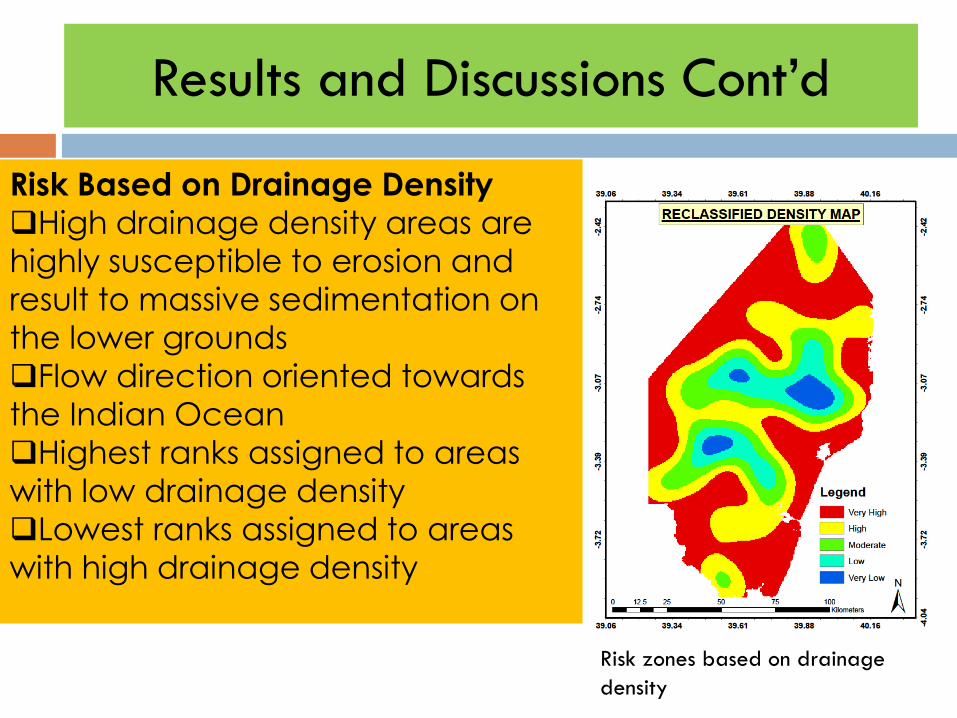
Risk zones based on drainage
density
Risk Based on Drainage Density
High drainage density areas are
highly susceptible to erosion and
result to massive sedimentation on
the lower grounds
Flow direction oriented towards
the Indian Ocean
Highest ranks assigned to areas
with low drainage density
Lowest ranks assigned to areas
with high drainage density
Results and Discussions Cont’d
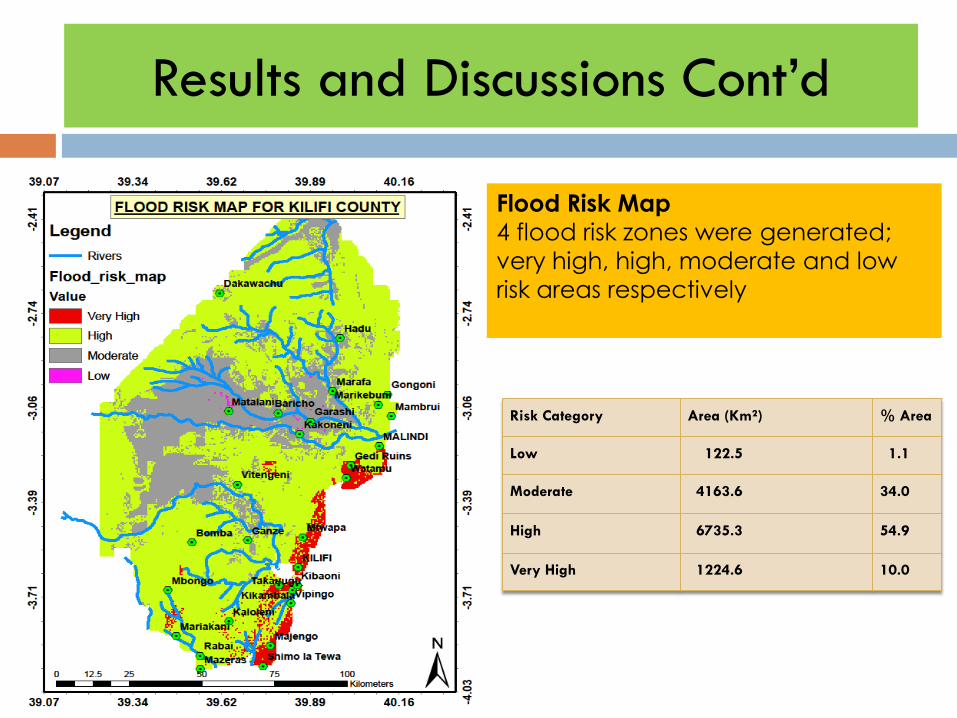
Risk Category Area (Km²) % Area
Low 122.5 1.1
Moderate 4163.6 34.0
High 6735.3 54.9
Very High 1224.6 10.0
Flood Risk Map
4 flood risk zones were generated;
very high, high, moderate and low
risk areas respectively

Conclusion
Flood risk maps are necessary and are the first step towards
flood risk management
Land use and land cover changes contribute to flooding
Will the necessary data, software and expertise, flood risk maps
are easy to make
Flood risk maps can be made for local, national or even
regional scales
The flood risk map produced in this study integrates the effect
of different parameters.
Just a short period of precipitation data may not be enough to
give a good visualization on flood risk. Its not only the
hydrological features that contribute to flooding, but an
integrated response of the ground.

Bibliography
GoK (2009). National Policy for Disaster Management in Kenya. Government of Kenya Ministry of State for Special Programmes (MSSP).
Ishaya, S, Ifatimehin, O. and Abaje, I. (2009). “Mapping flood vulnerable areas in a developing urban centre of Nigeria”, Journal of Sustainable Development in Africa, 11(4) 180-194.
Jahne, B., (2002). Digital Image Processing 5th revised and extended edition, Springer, Verlag Berlin Heidelberg, Germany.
Jensen, J.R. (2004). Digital change detection. Introductory image processing: A remote sensing perspective pp.467-494. Prentice-Hall: New Jersey.
Kenya National Bureau of Statistics (KNBS) (2010). Kenya Population and Housing Census Report 2009. Government Printer, Nairobi.
Onywere, S., Getanga, Z., Mwakalila, S., Twesigye, C. and Nakuranda, J. (2011). Assessing the Challenge of Settlement in Budalangi and Yala Swamp Area in Western Kenya Using Landsat Satellite Imagery. The Open Environmental Engineering Journal. 4, 97 – 104
Ochola, S., Eitel, B. and Olago, D. (2010). Vulnerability of schools to floods in Nyando River catchment, Kenya. Disasters, 34(3), 732-754.
Ouma, O. and Tateishi, R. (2014). Urban Flood Vulnerability and Risk Mapping Using Integrated Multi-Parametric AHP and GIS: Methodological Overview and Case Study Assessment. Water Journal. 2014 (6), 1515 – 1545.