GIIC 2016-Kishore Hota, Addl. General Manager, NTPC Ltd.
21
Gas / RLNG : Power Sector Perspective Kishore K. Hota Addl. GM (Corp. Fuel Mgmt.) NTPC Limited Gas Infrastructure India 2016 22 July, 2016, New Delhi
-
Upload
kuldeepprospur -
Category
Presentations & Public Speaking
-
view
124 -
download
0
Transcript of GIIC 2016-Kishore Hota, Addl. General Manager, NTPC Ltd.

Gas / RLNG :
Power Sector Perspective
Kishore K. Hota
Addl. GM (Corp. Fuel Mgmt.)
NTPC Limited
Gas Infrastructure India 2016
22 July, 2016, New Delhi

Sustainable in comparison to coal
Thermal Efficiencies ~ 50-55%, about 50% carbon emissions compared to coal
Less NOX / SOX emissions/ SPM levels, No ash issues
Lower capital cost
CCGT ~ 0.58 to 0.75 million USD/MW, Coal ~ 1 to 1.17 million USD /MW
Shorter gestation period
~ 24 to 30 months for CCGT commissioning as compared to ~ 40 to 45 months for coal based plant
Less land and water requirementWater requirement around 25% as compared to coal plant
Suitable for Peaking as well as Base load requirements
Ideal for Integration of Renewable power in the grid
Significant growth in Renewables (Wind & Solar) in the last decade in India
Natural Gas - Preferred Fuel Option for Power Generation

Source: IEO2016 Reference case , EIA
22%
29%
22%
28%
40%
29%
Growth Rate:
Renewables (non-hydro): 5.7%/year
Natural gas: 2.7%/year
Nuclear: 2.4%/year
Coal: 0.8%/year
World : Projected Share of Various Sources in Power Generation
EIA indicates that in spite of significant growth in Renewables, fossil fuels continue to play important
role in global power generation mix through to 2040
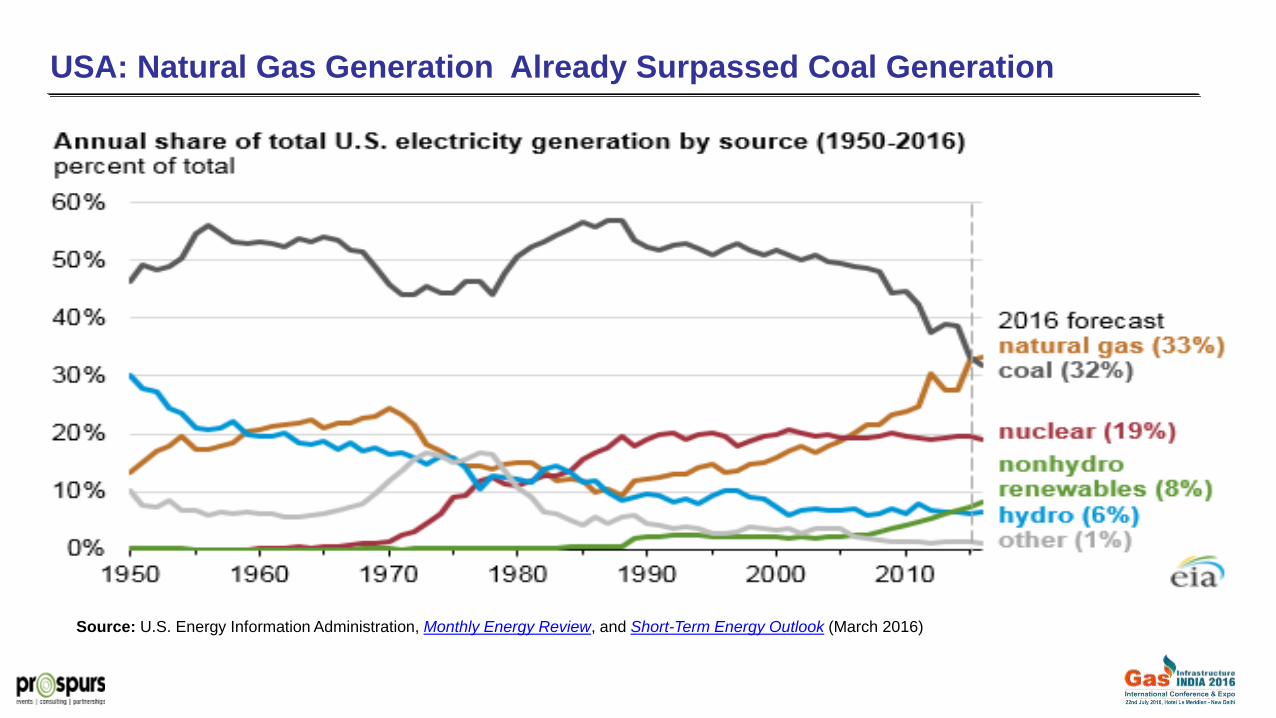
USA: Natural Gas Generation Already Surpassed Coal Generation
Source: U.S. Energy Information Administration, Monthly Energy Review, and Short-Term Energy Outlook (March 2016)

Source: U.S. Energy Information Administration, Monthly Energy Review, and Short-Term Energy Outlook (March 2016)
USA – Cost of Coal /Gas for Power Generation

Installed Capacity
Fuel MW %age
Total Thermal 210675 70.68
Coal 185173 62.13
Gas 24508 7.74
Diesel 993.5 0.33
Hydro (Renewable) 42783 16.03
Nuclear 5780 1.94
Renewable sources 38821.5 13.02
Total 298060 100.00
Installed Capacity as on 31st March, 2015
Source – CEA
Against installed Capacity of ~8%, share of Gas based electricity Generation in total
generation is less than 4%
Power Sector Overview in India
8.22%
0.33%
14.35%
1.94%
13.02%
62.13%
Coal
Gas
Diesel
Hydro
Nuclear
Renewable sources

IEO2016 Reference case- Net electricity generation in India increases @ 3.5%/year
INDIA : Projection of Electricity Generation Mix by 2040

INDIA : Projection of Electricity Generation Mix by 2040
Source: IEO2016 , EIA

Energy & Peak deficit which was more than 11% in financial year 2008-09 has dropped to
2.1% in 2015-16. 45,000 MW of conventional generation capacity added in last 2 years (22% growth)
Record 3019 MW Solar and 3300 MW Wind power capacity added in 2015-16. Fast
reduction in Renewable power tariffs
PLF of Coal stations in the country has fallen - significant URS power
CIL recorded a 6.9% increase in coal production in 2014-15 and 8.6% in 2015-16
Rationalisation/ Flexibility of linkages/ transportation of Coal
Reduction in Imported coal by 34.26 MT. Cost of Imported Coal significantly low globally
MoP’s UDAY Scheme – to improve the Discom’s financial health (Discoms losses: Rs. 60,000-
70,000 crore annually), Reduction in Cost of power generation
24x7 power and ATC reduction targets by 2022
Data source: CEA
India : Present Power Demand & Supply Position

India: Situation of Gas based Capacity in Jan 2015
Gas Requirement @70% PLF Gas Supply to Power Sector in 2014-15 (April- Jan)Gas
Shortage Commissioned
Ready for Commissioning
APM/PMT/NonAPM
KG D6Long Term
RLNGSpot RLNG Total
71.13 21.0414.58 0 1.42 0.38 16.38
75.80 (54.75 for existing +21.04 for new)Total 92.17
Gas based capacity
27,123 MW
21,874 MW
Commissioned5,349 MW
Ready for commissioning
Gas grid Connected
24,150 MW
Off - gas grid
2,774 MW Off - gas grid
200 MW
Stranded
14,305 MW
Domestic gas based
9,845 MW (32.2% PLF)
All CCGTs

Sharp Fall in Availability of Domestic gas
RLNG still not competitive in ‘Merit Order’ power generation – Take or Pay
(ToP) issues
Lack of availability of Infrastructure (Pipelines & Regas Terminals)
Regulatory issues
Issues with Taxes/ duties
Major Issues Of Concern

2011-12 2012-13 2013-14 2014-15 2015-16 2016-17*
Net Domestic Gas
production 126.92 108.91 94.72 89.57 85.08 65.55
RLNG import 42.11 39.57 48.57 50.78 58.22 69.24
Total 169.03 148.48 143.29 140.35 143.3 134.79
*upto May, 2016
Source: PPAC
Supply Trend of Domestic Gas & RLNG
MMSCMD

13.27
7.436.84
6.255.58 5.81
6.37 6.6
11.03
6.74 6.3 5.865.37 5.54 5.96 6.12
0
2
4
6
8
10
12
14
2016 2016 2016 2016 2016
Dec, 2015 Jan, 2016 Feb, 2016 March, April, May, June, July,
0
2
4
6
8
10
12
14
16
18
20
LT RLNG Basic price Variable Cost
Vari
ab
le C
ost
of
po
wer
in
UP
Gas p
lan
t (R
s/u
nit
)
PL
L L
T R
LN
G B
asic
Pri
ce*
(US
$/M
MB
tu)
Price Trend of RLNG and Cost of Power Generation
*Forex component

Contributions/ Sacrifices by Stakeholders
Making “e-Bid RLNG”
affordable
GoI waivers- Customs duty
- Service tax on Transptn
& Regasification
- CTU charges and losses
- Provision of Commingling
and Swapping
State Govt waivers- VAT/CST/Entry tax
- STU charges and losses
Stranded DevelopersCapping of Fixed cost
with No Return on Equity
Transporters50% discount on
Transportation
Gas Seller (GAIL)75% discount on
Marketing Margin
Regasifiers- 50% discount on
Regas Charges
GoI Financial Supportfrom
PSDF Fund
Banks-Restructuring of Loans
-Support for WC
MoP Scheme on ‘e-Bid RLNG’ : Making RLNG Affordable for Power Generation

Reverse e-bidding Process: Boundary Conditions
Reverse Bidding
Target Price*
Set by EPMC
Target PLFSet by EPMC
Ceiling for Bidding
Set by EPMC
RLNG qty.As per
Regasification Capacity & Target PLF
PSDF supportFixed by GoI:
FY 2016 :Rs 3500 Cr
FY 2017: Rs 4000 Cr
Bidders to be ranked in the order of minimum PSDF support on ascending order basis
*Target Price : Max. Net Purchase Price for Discom

Transaction Structure (DGP category)
Gas Based Plant
(DGP category)
MoP
Pool Operator (GAIL)
DISCOM
PSDF Support
Agreement
e-BID RLNG
Sales Agreement
PPA
Gas supply/
Payment
PSDF Support (Y)
Trust & Retention A/c
(TRA)
Net Price to Discom (X) +
PSDF Support (Y)
X+Y = Fuel
cost

Impact /Issues of e-Bid RLNG Scheme
11,717 MW of Gas projects have started generating power in 2015-16
3 Phases of Bidding completed successfully.
4th Phase (last phase) Bidding likely in Aug-Sept, 2016
Amendment in Section 3 of CST Act, 1956 done thru Finance Bill, 2016,
will result in increased gas supplies through swapping, reduced tax
implications and legitimacy of inter-State CST sale of comingled gas
Issues of VAT, Entry tax exemptions in certain States to be addressed
Issue of Base PLF for DGP category plants need to be addressed
Target Price: may be reduced in view of reduction in cost of power
generation in the grid
Target PLF : may be increased in view of the increase in Regas capacity
The Scheme may be extended beyond March, 2017 as this will help utilisation of the
stranded capacity and benefit the Grid while balancing the Renewable power

Taxes/ duties
Customs Duty (CD) exemption is still not available for LT LNG imported by M/s PLL
Present VAT varies across States (0% in Delhi to 26% in UP) & has significant impact on cost of Power
Regulations
Reasonable Transportation Tariff – to promote Swapping of gas, uniform Gas grid
Reasonable Regasification charges, Transparent Third party/Open access in Regas terminals
Flexibilities in GTAs/ GSAs – Firm and Interruptible transportation, Model agreements
Need for aligning the regulations of CERC & PNGRB – Gas / Transportation scheduling revision issue
Timely implementation of Trunk pipelines
Transparent implementation of Open Access and Affiliate Code of Conduct Regulations
Strengthening the PNGRB Act
DC requirement of 85% for Gas power plants needs to be lowered
Regulation / Taxation Issues
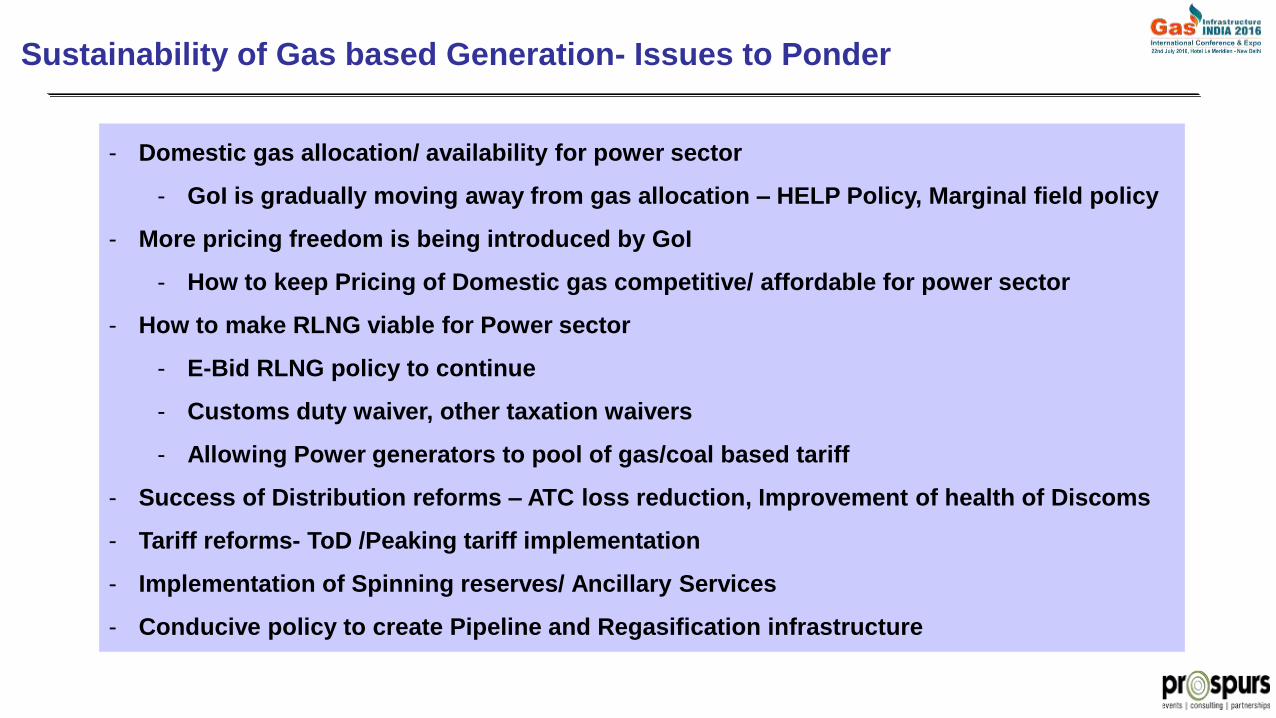
Sustainability of Gas based Generation- Issues to Ponder
- Domestic gas allocation/ availability for power sector
- GoI is gradually moving away from gas allocation – HELP Policy, Marginal field policy
- More pricing freedom is being introduced by GoI
- How to keep Pricing of Domestic gas competitive/ affordable for power sector
- How to make RLNG viable for Power sector
- E-Bid RLNG policy to continue
- Customs duty waiver, other taxation waivers
- Allowing Power generators to pool of gas/coal based tariff
- Success of Distribution reforms – ATC loss reduction, Improvement of health of Discoms
- Tariff reforms- ToD /Peaking tariff implementation
- Implementation of Spinning reserves/ Ancillary Services
- Conducive policy to create Pipeline and Regasification infrastructure

Thank YouDisclaimer
The views expressed in this presentation are solely are of the presenter, and may not necessarily represent views of NTPC Limited
E mail : [email protected] [email protected]: +91 9650991215
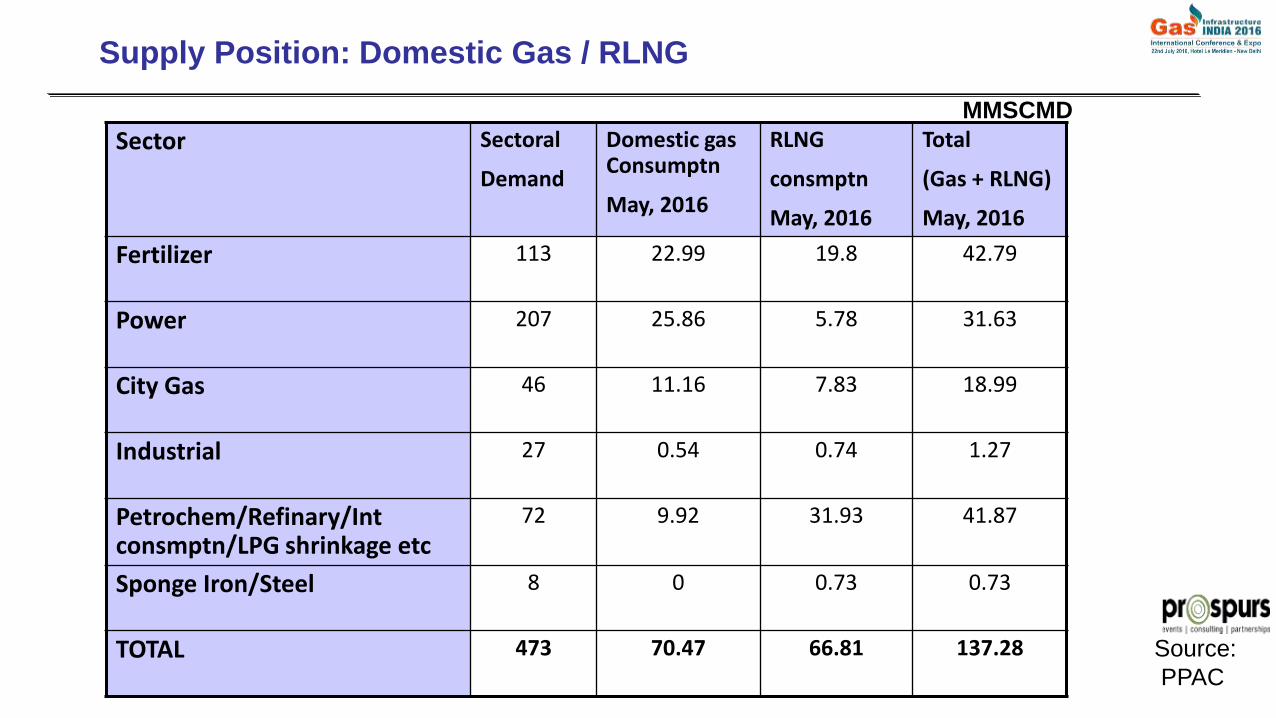
Sector Sectoral
Demand
Domestic gas Consumptn
May, 2016
RLNG
consmptn
May, 2016
Total
(Gas + RLNG)
May, 2016
Fertilizer 113 22.99 19.8 42.79
Power 207 25.86 5.78 31.63
City Gas 46 11.16 7.83 18.99
Industrial 27 0.54 0.74 1.27
Petrochem/Refinary/Int consmptn/LPG shrinkage etc
72 9.92 31.93 41.87
Sponge Iron/Steel 8 0 0.73 0.73
TOTAL 473 70.47 66.81 137.28
Supply Position: Domestic Gas / RLNG
Source:
PPAC
MMSCMD