GI SLIDE DECK 2016 - · PDF fileIf you would like to share your ... ESDO Medical Oncology...
59
Supported by Eli Lilly and Company. Eli Lilly and Company has not influenced the content of this publication GI SLIDE DECK 2016 Selected abstracts on Non-Colorectal Cancer from: 18 th World Congress on Gastrointestinal Cancer 29 June–2 July 2016 | Barcelona, Spain
Transcript of GI SLIDE DECK 2016 - · PDF fileIf you would like to share your ... ESDO Medical Oncology...

Supported by Eli Lilly and Company.
Eli Lilly and Company has not influenced the content of this publication
18th World Congress on Gastrointestinal Cancer 29 June–2 July 2016 | Barcelona, Spain
GI SLIDE DECK 2016 Selected abstracts on Non-Colorectal Cancer from:
18th World Congress on Gastrointestinal Cancer 29 June–2 July 2016 | Barcelona, Spain
Letter from ESDO
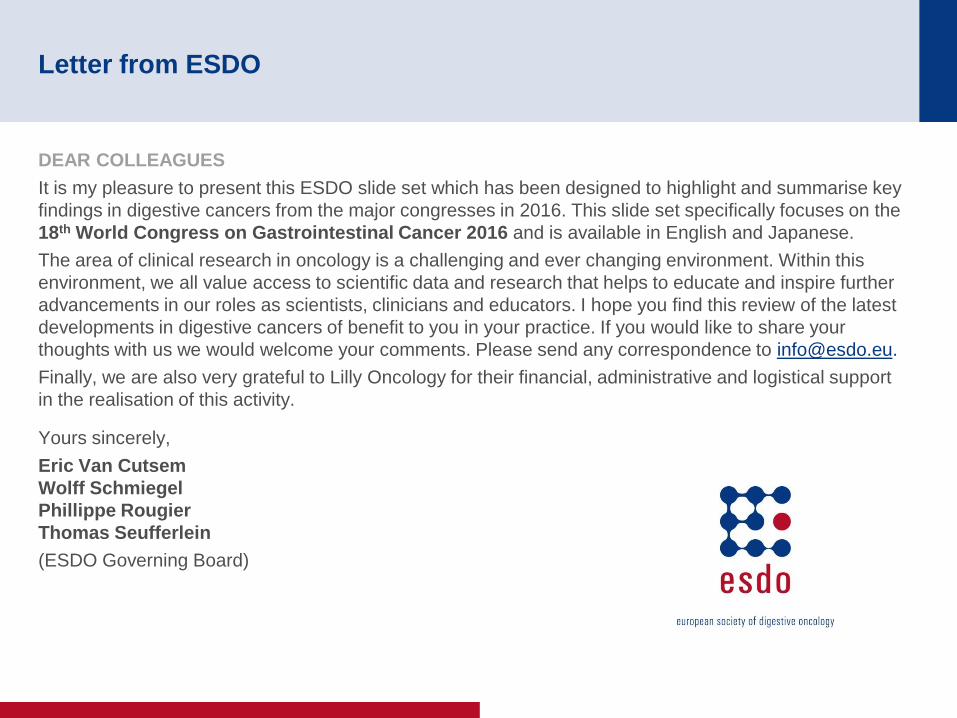
DEAR COLLEAGUES
It is my pleasure to present this ESDO slide set which has been designed to highlight and summarise key
findings in digestive cancers from the major congresses in 2016. This slide set specifically focuses on the
18th World Congress on Gastrointestinal Cancer 2016 and is available in English and Japanese.
The area of clinical research in oncology is a challenging and ever changing environment. Within this
environment, we all value access to scientific data and research that helps to educate and inspire further
advancements in our roles as scientists, clinicians and educators. I hope you find this review of the latest
developments in digestive cancers of benefit to you in your practice. If you would like to share your
thoughts with us we would welcome your comments. Please send any correspondence to [email protected].
Finally, we are also very grateful to Lilly Oncology for their financial, administrative and logistical support
in the realisation of this activity.
Yours sincerely,
Eric Van Cutsem
Wolff Schmiegel
Phillippe Rougier
Thomas Seufferlein
(ESDO Governing Board)
ESDO Medical Oncology Slide Deck
Editors 2016
BIOMARKERS
Prof Eric Van Cutsem Digestive Oncology, University Hospitals, Leuven, Belgium
Prof Thomas Seufferlein Clinic of Internal Medicine I, University of Ulm, Ulm, Germany
GASTRO-OESOPHAGEAL AND NEUROENDOCRINE TUMOURS
Emeritus Prof Philippe Rougier University Hospital of Nantes, Nantes, France
Prof Côme Lepage University Hospital & INSERM, Dijon, France
PANCREATIC CANCER AND HEPATOBILIARY TUMOURS
Prof Jean-Luc Van Laethem Digestive Oncology, Erasme University Hospital, Brussels, Belgium
Prof Thomas Seufferlein Clinic of Internal Medicine I, University of Ulm, Ulm, Germany
COLORECTAL CANCERS
Prof Eric Van Cutsem Digestive Oncology, University Hospitals, Leuven, Belgium
Prof Wolff Schmiegel Department of Medicine, Ruhr University, Bochum, Germany
Prof Thomas Gruenberger Department of Surgery I, Rudolf Foundation Clinic, Vienna, Austria
Glossary
1L first line
5FU 5-fluorouracil
AE adverse event
BCLC Barcelona Clinic Liver Cancer
BID twice daily
BSC best supportive care
CA-19.9 carbohydrate antigen-19.9
Cap-RT capecitabine + radiotherapy
CgA Chromogranin A
CI confidence interval
CR complete response
CRT chemoradiotherapy
CT chemotherapy
D day
DCR disease control rate
ECC epirubicin, cisplatin, capecitabine
ECOG Eastern Cooperative Oncology Group
EGFR endothelial growth factor receptor
EOC epirubicin, oxaliplatin, capecitabine
EORTC-QLQC30 European Organization for Research and Treatment
of Cancer core quality of life questionnaire
EOX epirubicin, oxaliplatin, capecitabine
FOLFOX leucovorin, fluorouracil, oxaliplatin
GC gastric cancer
GEJ gastroesophageal junction
GemCap gemcitabine, capecitabine
Gem-RT gemcitabine + radiotherapy
GI gastrointestinal
HCC hepatocellular carcinoma
HER2 human epidermal growth factor receptor 2
HR hazard ratio
IHC immunohistochemistry
ISH in situ hybridisation
KPS Karnofsky performance status
LAR long-acting release
LLOQ lower limit of quantitation
Lu lutetium
LV leucovorin
LV5FU2-CDDP leucovorin, 5-fluorouracil, cisplatin
MDT multidisciplinary team
MSEC metastatic squamous-cell oesophageal cancer
nal-IRI nanoliposomal irinotecan
(P)NET (pancreatic) neuroendocrine tumour
NGS next generation sequencing
NR not reached
OR odds ratio
ORR overall response rate
(m)OS (median) overall survival
PD progressive disease
PDAC pancreatic ductal adenocarcinoma
PD-L1 programmed death-ligand 1
(m)PFS (median) progression-free survival
PR partial response
PS performance status
q(2/3/4/6/8)w every (2/3/4/6/8) weeks
QD once daily
QoL quality of life
R randomised
RECIST Response Evaluation Criteria In Solid Tumors
RR response rate
RT radiotherapy
SAE serious adverse event
SRC signet ring cell
SSA somatostatin analogue
TTP time to progression
VEGF vascular endothelial growth factor
W week
WHO World Health Organization
Contents
• Cancers of the oesophagus and stomach 6
• Cancers of the pancreas, small bowel and hepatobiliary tract 28
– Pancreatic cancer 29
– Hepatocellular carcinoma 42
– Neuroendocrine tumour 47
– General 55
Note: To jump to a section, right click on the number and ‘Open Hyperlink’

CANCERS OF THE
OESOPHAGUS AND STOMACH

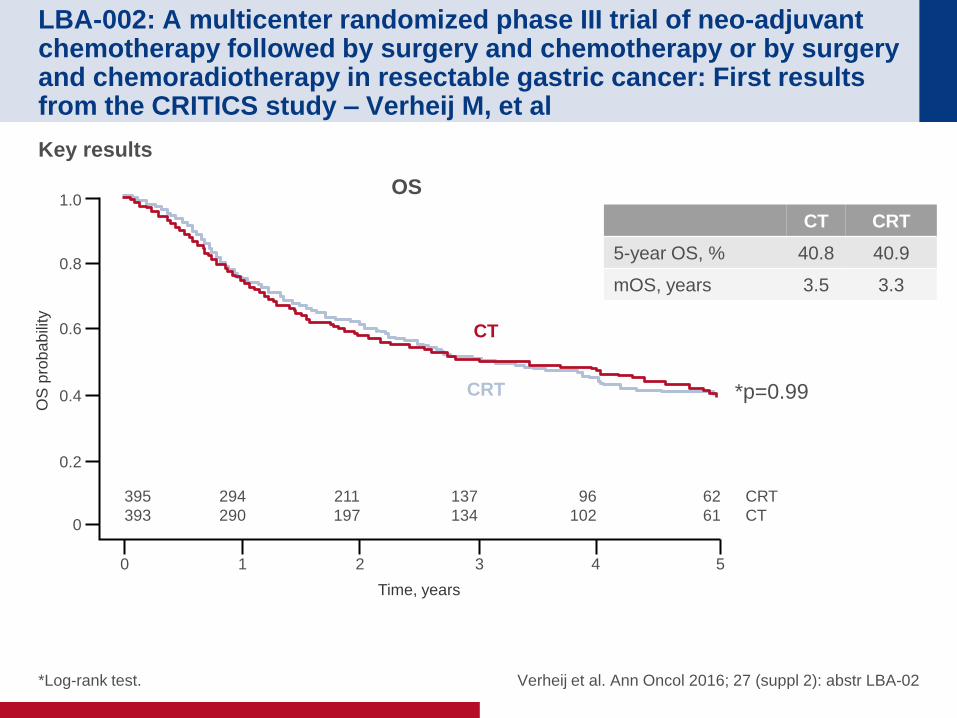
LBA-002: A multicenter randomized phase III trial of neo-adjuvant chemotherapy followed by surgery and chemotherapy or by surgery and chemoradiotherapy in resectable gastric cancer: First results from the CRITICS study – Verheij M, et al
Study objective
• To examine the effect of optimal local and systemic therapy on survival in patients with
resectable GC
Verheij et al. Ann Oncol 2016; 27 (suppl 2): abstr LBA-02
R 1:1
3x CT* q3w
(n=393) Key patient inclusion criteria
• Stage Ib–IVa resectable
GC or GEJ
• No distant metastases
• WHO PS ≤1
• Age ≥18 years
(n=788) 3x CT* q3w
(n=395)
Surg
ery
†
3x CT* q3w
(n=238)
CRT (45 Gy in 25
fractions + CT‡)
(n=248)
Stratification
• Centre
• Histological type
• Tumour localisation
*ECC (epirubicin 50 mg/m2 D1; cisplatin 60 mg/m2 D1; capecitabine
1000 mg/m2 BID D1–14) or EOC (epirubicin 50 mg/m2 D1,
oxaliplatin 130 mg/m2 D1, capecitabine 625 mg/m2 BID D1–21); †Total/partial gastrectomy and en bloc N1 + N2 lymph nodes; ‡cisplatin 20 mg/m2 qw, capecitabine 575 mg/m2 BID.
Su
rge
ry†
PRIMARY ENDPOINT
• OS
SECONDARY ENDPOINTS
• PFS
• Safety, QoL
LBA-002: A multicenter randomized phase III trial of neo-adjuvant chemotherapy followed by surgery and chemotherapy or by surgery and chemoradiotherapy in resectable gastric cancer: First results from the CRITICS study – Verheij M, et al
Key results
Verheij et al. Ann Oncol 2016; 27 (suppl 2): abstr LBA-02
CT CRT
5-year OS, % 40.8 40.9
mOS, years 3.5 3.3
OS
OS
pro
ba
bili
ty
Time, years
1.0
0.8
0.6
0.4
0.2
0
0 1 2 3 4 5
395
393
294
290
211
197
137
134
96
102
62
61
CRT
CT
*p=0.99
CT
CRT
*Log-rank test.
LBA-002: A multicenter randomized phase III trial of neo-adjuvant chemotherapy followed by surgery and chemotherapy or by surgery and chemoradiotherapy in resectable gastric cancer: First results from the CRITICS study – Verheij M, et al
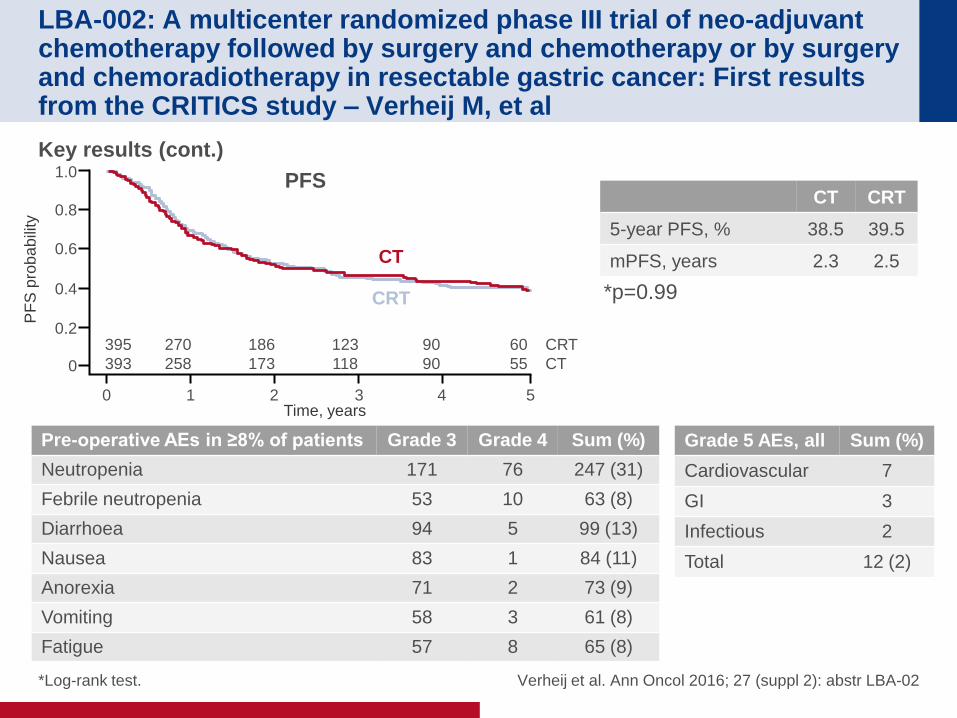
Key results (cont.)
Verheij et al. Ann Oncol 2016; 27 (suppl 2): abstr LBA-02
CT CRT
5-year PFS, % 38.5 39.5
mPFS, years 2.3 2.5
Pre-operative AEs in ≥8% of patients Grade 3 Grade 4 Sum (%)
Neutropenia 171 76 247 (31)
Febrile neutropenia 53 10 63 (8)
Diarrhoea 94 5 99 (13)
Nausea 83 1 84 (11)
Anorexia 71 2 73 (9)
Vomiting 58 3 61 (8)
Fatigue 57 8 65 (8)
Grade 5 AEs, all Sum (%)
Cardiovascular 7
GI 3
Infectious 2
Total 12 (2)
PFS
PF
S p
rob
ab
ility
Time, years
1.0
0.8
0.6
0.4
0.2
0
0 1 2 3 4 5
395
393
270
258
186
173
123
118
90
90
60
55
CRT
CT
CT
CRT *p=0.99
*Log-rank test.
LBA-002: A multicenter randomized phase III trial of neo-adjuvant chemotherapy followed by surgery and chemotherapy or by surgery and chemoradiotherapy in resectable gastric cancer: First results from the CRITICS study – Verheij M, et al
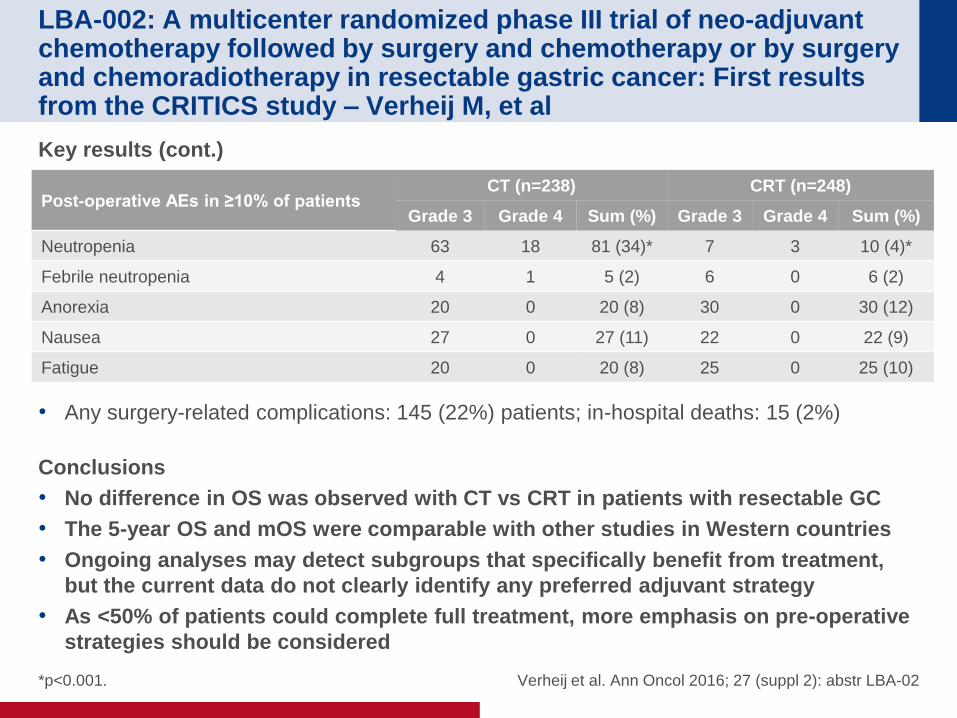
Key results (cont.)
• Any surgery-related complications: 145 (22%) patients; in-hospital deaths: 15 (2%)
Conclusions
• No difference in OS was observed with CT vs CRT in patients with resectable GC
• The 5-year OS and mOS were comparable with other studies in Western countries
• Ongoing analyses may detect subgroups that specifically benefit from treatment,
but the current data do not clearly identify any preferred adjuvant strategy
• As <50% of patients could complete full treatment, more emphasis on pre-operative
strategies should be considered
Verheij et al. Ann Oncol 2016; 27 (suppl 2): abstr LBA-02
Post-operative AEs in ≥10% of patients CT (n=238) CRT (n=248)
Grade 3 Grade 4 Sum (%) Grade 3 Grade 4 Sum (%)
Neutropenia 63 18 81 (34)* 7 3 10 (4)*
Febrile neutropenia 4 1 5 (2) 6 0 6 (2)
Anorexia 20 0 20 (8) 30 0 30 (12)
Nausea 27 0 27 (11) 22 0 22 (9)
Fatigue 20 0 20 (8) 25 0 25 (10)
*p<0.001.
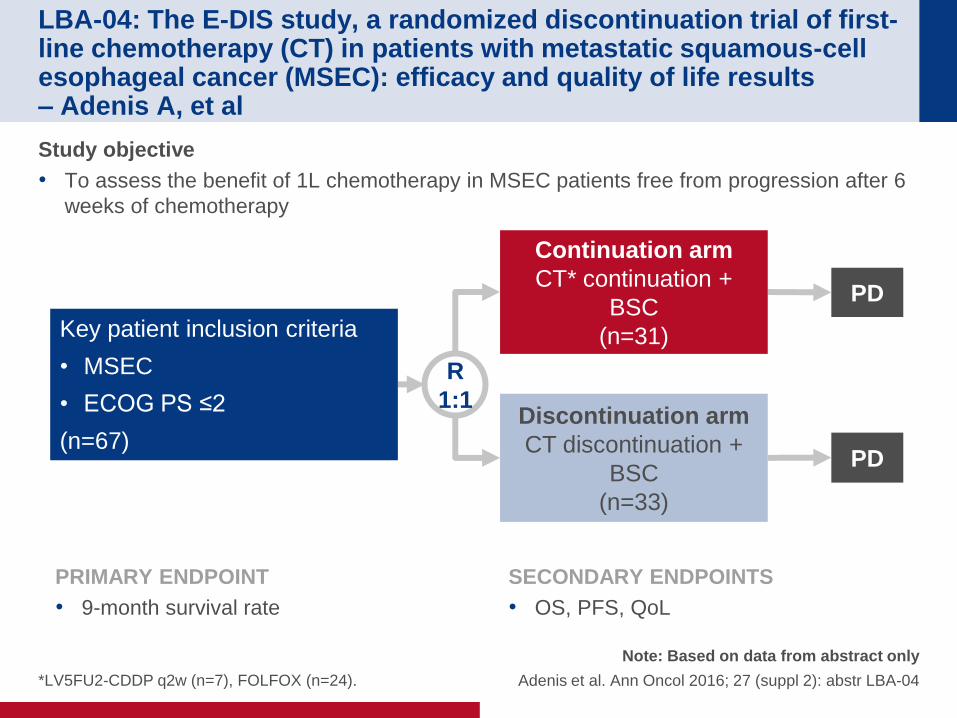
LBA-04: The E-DIS study, a randomized discontinuation trial of first-line chemotherapy (CT) in patients with metastatic squamous-cell esophageal cancer (MSEC): efficacy and quality of life results – Adenis A, et al
Study objective
• To assess the benefit of 1L chemotherapy in MSEC patients free from progression after 6
weeks of chemotherapy
*LV5FU2-CDDP q2w (n=7), FOLFOX (n=24).
Note: Based on data from abstract only
Adenis et al. Ann Oncol 2016; 27 (suppl 2): abstr LBA-04
R
1:1
PD
Continuation arm
CT* continuation +
BSC
(n=31) Key patient inclusion criteria
• MSEC
• ECOG PS ≤2
(n=67)
PRIMARY ENDPOINT
• 9-month survival rate
SECONDARY ENDPOINTS
• OS, PFS, QoL
PD
Discontinuation arm
CT discontinuation +
BSC
(n=33)
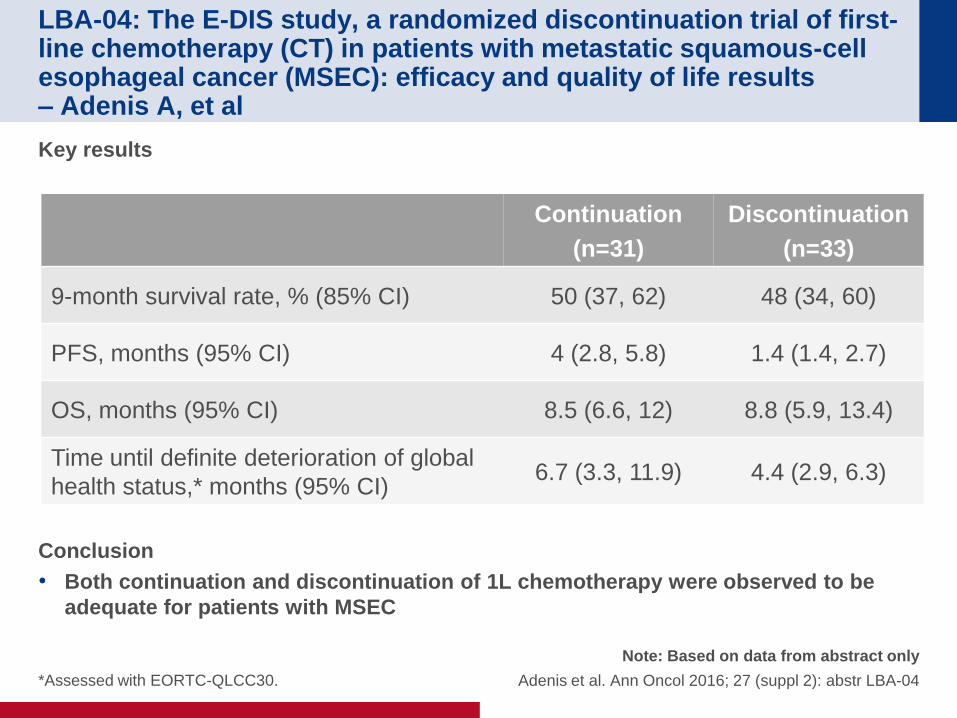
LBA-04: The E-DIS study, a randomized discontinuation trial of first-line chemotherapy (CT) in patients with metastatic squamous-cell esophageal cancer (MSEC): efficacy and quality of life results – Adenis A, et al
Key results
Conclusion
• Both continuation and discontinuation of 1L chemotherapy were observed to be
adequate for patients with MSEC
Note: Based on data from abstract only
Adenis et al. Ann Oncol 2016; 27 (suppl 2): abstr LBA-04
Continuation
(n=31)
Discontinuation
(n=33)
9-month survival rate, % (85% CI) 50 (37, 62) 48 (34, 60)
PFS, months (95% CI) 4 (2.8, 5.8) 1.4 (1.4, 2.7)
OS, months (95% CI) 8.5 (6.6, 12) 8.8 (5.9, 13.4)
Time until definite deterioration of global
health status,* months (95% CI) 6.7 (3.3, 11.9) 4.4 (2.9, 6.3)
*Assessed with EORTC-QLCC30.
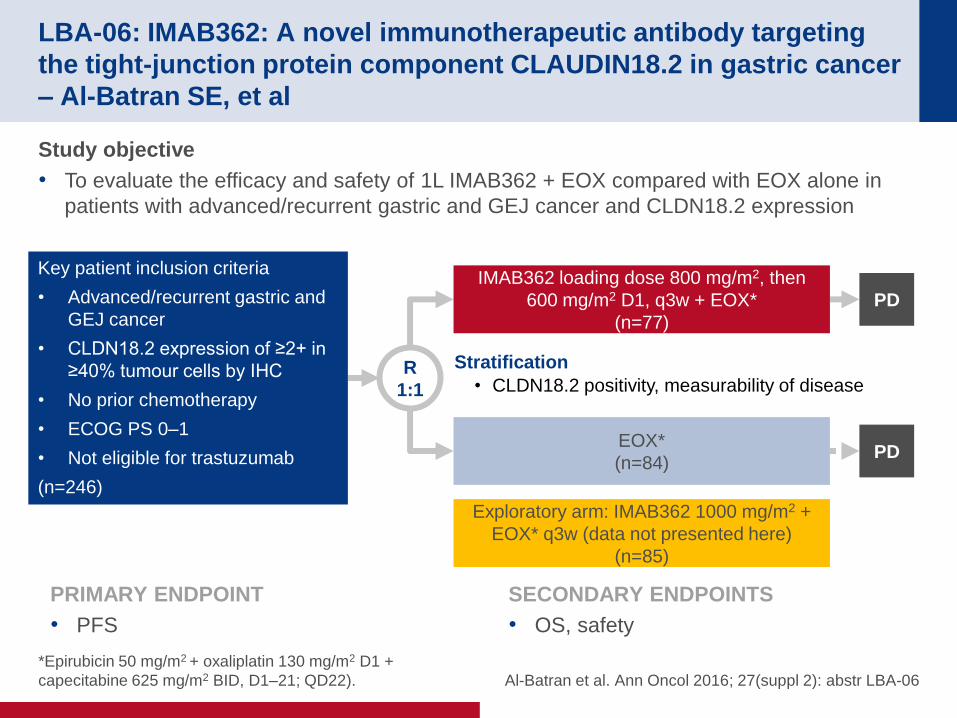
LBA-06: IMAB362: A novel immunotherapeutic antibody targeting
the tight-junction protein component CLAUDIN18.2 in gastric cancer
– Al-Batran SE, et al
*Epirubicin 50 mg/m2 + oxaliplatin 130 mg/m2 D1 +
capecitabine 625 mg/m2 BID, D1–21; QD22). Al-Batran et al. Ann Oncol 2016; 27(suppl 2): abstr LBA-06
Study objective
• To evaluate the efficacy and safety of 1L IMAB362 + EOX compared with EOX alone in
patients with advanced/recurrent gastric and GEJ cancer and CLDN18.2 expression
R
1:1
PD
IMAB362 loading dose 800 mg/m2, then
600 mg/m2 D1, q3w + EOX*
(n=77)
Key patient inclusion criteria
• Advanced/recurrent gastric and
GEJ cancer
• CLDN18.2 expression of ≥2+ in
≥40% tumour cells by IHC
• No prior chemotherapy
• ECOG PS 0–1
• Not eligible for trastuzumab
(n=246)
PRIMARY ENDPOINT
• PFS
SECONDARY ENDPOINTS
• OS, safety
PD EOX*
(n=84)
Exploratory arm: IMAB362 1000 mg/m2 +
EOX* q3w (data not presented here)
(n=85)
Stratification
• CLDN18.2 positivity, measurability of disease
LBA-06: IMAB362: A novel immunotherapeutic antibody targeting
the tight-junction protein component CLAUDIN18.2 in gastric cancer
– Al-Batran SE, et al
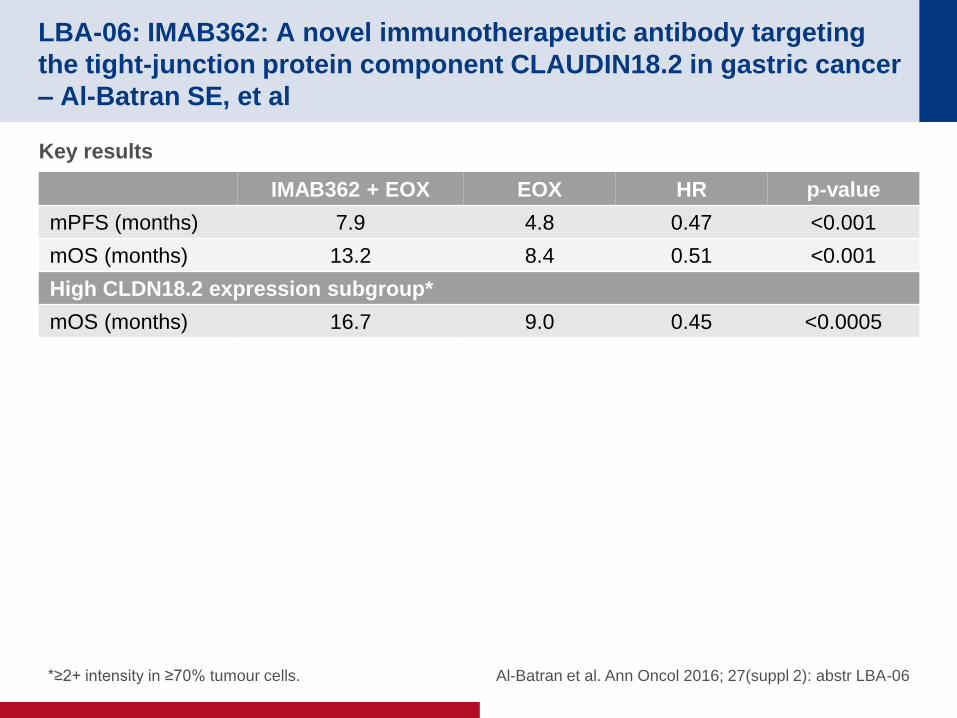
Key results
*≥2+ intensity in ≥70% tumour cells.
IMAB362 + EOX EOX HR p-value
mPFS (months) 7.9 4.8 0.47 <0.001
mOS (months) 13.2 8.4 0.51 <0.001
High CLDN18.2 expression subgroup*
mOS (months) 16.7 9.0 0.45 <0.0005
Al-Batran et al. Ann Oncol 2016; 27(suppl 2): abstr LBA-06
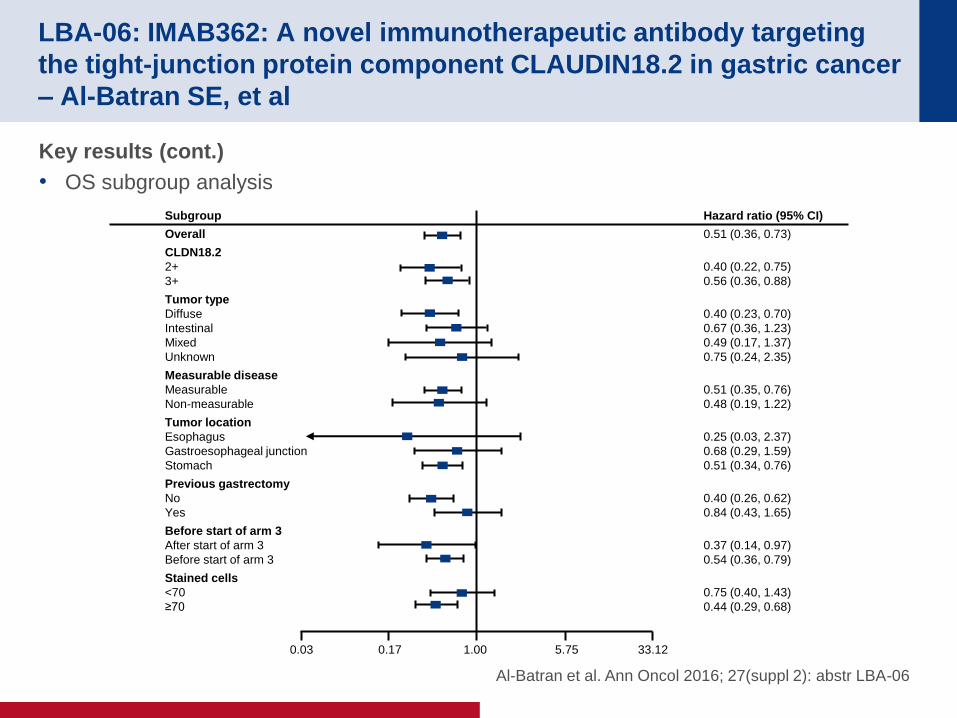
Key results (cont.)
• OS subgroup analysis
LBA-06: IMAB362: A novel immunotherapeutic antibody targeting
the tight-junction protein component CLAUDIN18.2 in gastric cancer
– Al-Batran SE, et al
Subgroup
Overall
CLDN18.2
2+
3+
Tumor type
Diffuse
Intestinal
Mixed
Unknown
Measurable disease
Measurable
Non-measurable
Tumor location
Esophagus
Gastroesophageal junction
Stomach
Previous gastrectomy
No
Yes
Before start of arm 3
After start of arm 3
Before start of arm 3
Stained cells
<70
≥70
Hazard ratio (95% CI)
0.51 (0.36, 0.73)
0.40 (0.22, 0.75)
0.56 (0.36, 0.88)
0.40 (0.23, 0.70)
0.67 (0.36, 1.23)
0.49 (0.17, 1.37)
0.75 (0.24, 2.35)
0.51 (0.35, 0.76)
0.48 (0.19, 1.22)
0.25 (0.03, 2.37)
0.68 (0.29, 1.59)
0.51 (0.34, 0.76)
0.40 (0.26, 0.62)
0.84 (0.43, 1.65)
0.37 (0.14, 0.97)
0.54 (0.36, 0.79)
0.75 (0.40, 1.43)
0.44 (0.29, 0.68)
0.03 0.17 1.00 5.75 33.12
Al-Batran et al. Ann Oncol 2016; 27(suppl 2): abstr LBA-06
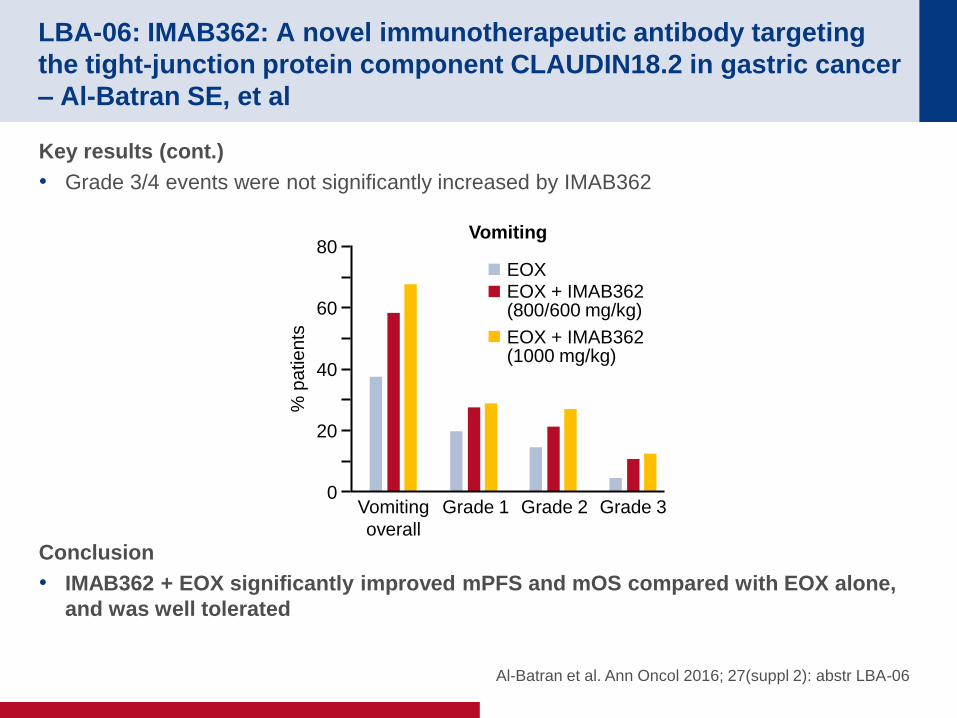
Key results (cont.)
• Grade 3/4 events were not significantly increased by IMAB362
Conclusion
• IMAB362 + EOX significantly improved mPFS and mOS compared with EOX alone,
and was well tolerated
LBA-06: IMAB362: A novel immunotherapeutic antibody targeting
the tight-junction protein component CLAUDIN18.2 in gastric cancer
– Al-Batran SE, et al
Al-Batran et al. Ann Oncol 2016; 27(suppl 2): abstr LBA-06
% p
atie
nts
80
60
40
20
0 Vomiting
overall
Grade 1 Grade 2 Grade 3
EOX EOX + IMAB362 (800/600 mg/kg)
EOX + IMAB362 (1000 mg/kg)
Vomiting
O-005: Comparative molecular analyses of esophageal adenocarcinoma, esophageal squamous cell carcinoma, and gastric adenocarcinoma, and impact of molecular profile on outcome – Salem M, et al
Salem et al. Ann Oncol 2016; 27 (suppl 2): abstr O-005
Study objective
• To compare the molecular characteristics of oesophageal adenocarcinoma, oesophageal
squamous cell carcinoma and gastric adenocarcinoma
Study design
• Between 2009 and 2015, 1892 gastroesophageal tumours were examined by Caris Life
Sciences including IHC (protein expression), ISH (gene amplification) and NGS
sequencing
• Only tumours with clear oesophageal or gastric origins were included
• Chi-square test was used to determine the differences between histological subtypes, and
the Kaplan-Meier methodology was used to estimate survival
O-005: Comparative molecular analyses of esophageal adenocarcinoma, esophageal squamous cell carcinoma, and gastric adenocarcinoma, and impact of molecular profile on outcome – Salem M, et al
Salem et al. Ann Oncol 2016; 27 (suppl 2): abstr O-005
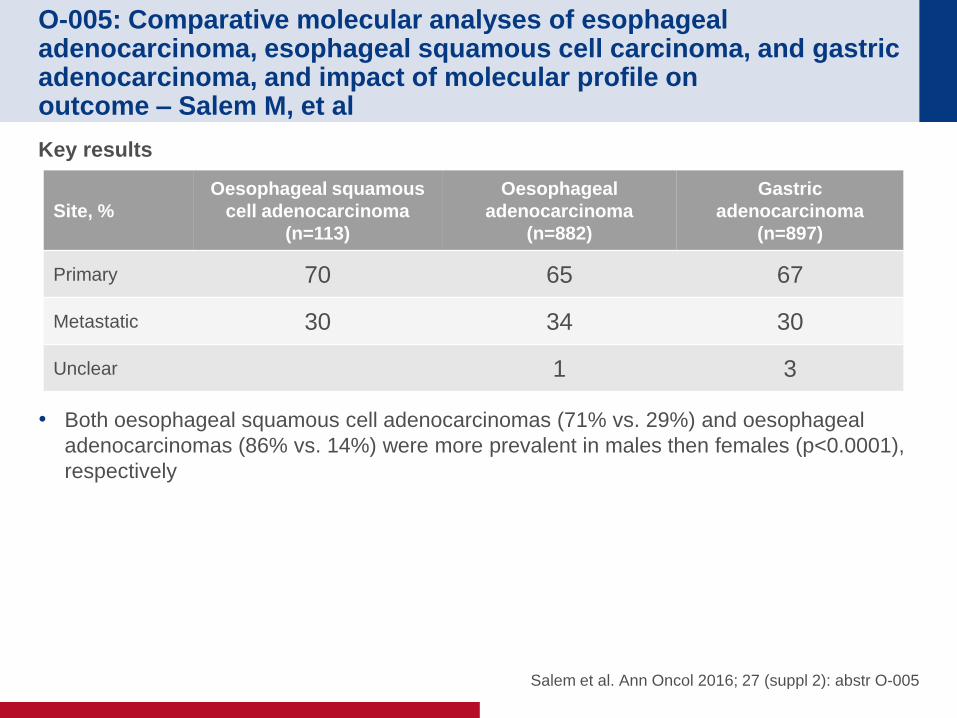
Key results
• Both oesophageal squamous cell adenocarcinomas (71% vs. 29%) and oesophageal
adenocarcinomas (86% vs. 14%) were more prevalent in males then females (p<0.0001),
respectively
Site, %
Oesophageal squamous
cell adenocarcinoma
(n=113)
Oesophageal
adenocarcinoma
(n=882)
Gastric
adenocarcinoma
(n=897)
Primary 70 65 67
Metastatic 30 34 30
Unclear 1 3
O-005: Comparative molecular analyses of esophageal adenocarcinoma, esophageal squamous cell carcinoma, and gastric adenocarcinoma, and impact of molecular profile on outcome – Salem M, et al
Salem et al. Ann Oncol 2016; 27 (suppl 2): abstr O-005
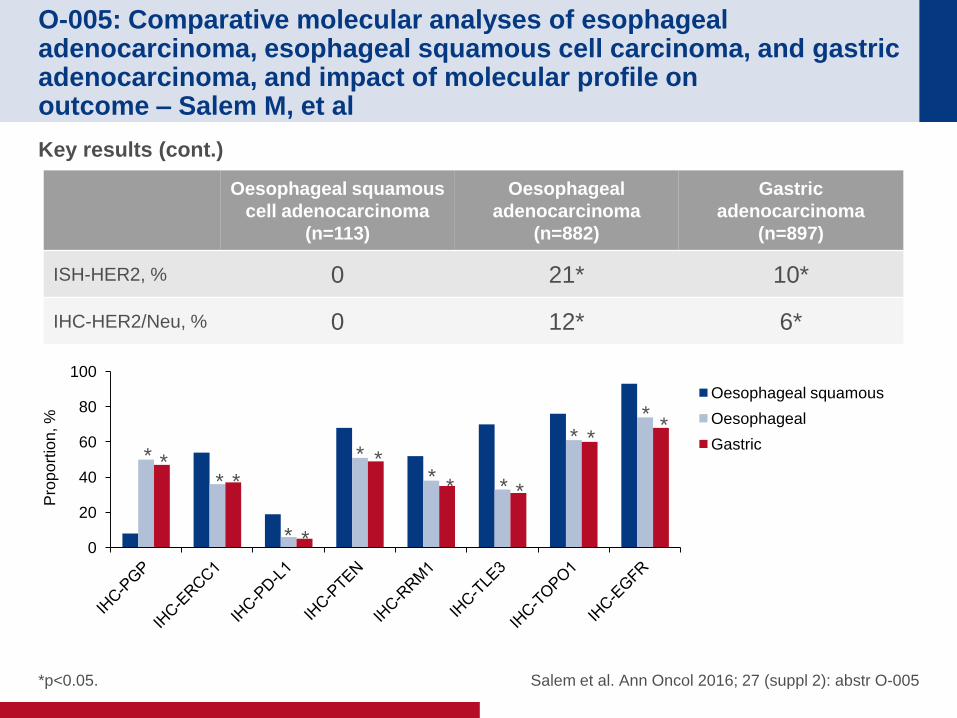
Key results (cont.)
Oesophageal squamous
cell adenocarcinoma
(n=113)
Oesophageal
adenocarcinoma
(n=882)
Gastric
adenocarcinoma
(n=897)
ISH-HER2, % 0 21* 10*
IHC-HER2/Neu, % 0 12* 6*
*p<0.05.
0
20
40
60
80
100
Oesophageal squamous
Oesophageal
Gastric * *
* *
* *
* * * * * *
* * *
*
Pro
po
rtio
n, %
O-005: Comparative molecular analyses of esophageal adenocarcinoma, esophageal squamous cell carcinoma, and gastric adenocarcinoma, and impact of molecular profile on outcome – Salem M, et al
Salem et al. Ann Oncol 2016; 27 (suppl 2): abstr O-005
Key results (cont.)
• TP53 is the most mutated gene in all three cancer types (70% in both oesophageal
squamous and oesophageal adenocarcinomas and 46% in gastric adenocarcinoma)
• KRAS mutation occurred more frequently in oesophageal (p=0.01) and gastric
adenocarcinomas (p=0.03) than oesophageal squamous cell adenocarcinoma, where it
was completely absent
• APC occurred more frequently in oesophageal adenocarcinoma (p=0.04) and was
completely absent in oesophageal squamous cell adenocarcinoma
Conclusions
• This molecular comparison of gastroesophageal tumours demonstrated that the
tumour profile of oesophageal adenocarcinomas is similar to that of gastric
adenocarcinomas, but differs from that of oesophageal squamous cell carcinoma,
which suggests that treatment of gastroesophageal tumours should be based on its
histological subtype rather than anatomical site
• Low frequency mutations in several druggable genes may have potential
therapeutic value including HER2, PD-L1, BRCA1/2, PIK3CA, PTEN, FGFR2
O-006: Survival impact of histology for resectable gastric cancer: A
multicenter U.S. observation study – Greenleaf E, et al
Note: Based on data from abstract only
Greenleaf et al. Ann Oncol 2016; 27 (suppl 2): abstr O-006
Study objective
• To assess compare the impact of gastric cancer histologies on survival in a large sample
of patients with resectable gastric cancer in the US
Study design
• Patients with stages 0–III gastric cancer who underwent definitive surgical resection
between 2003 and 2012 were identified from the ACS National Cancer Database
• Treatment groups were stratified based on commonly presented histology, including
intestinal type, diffuse type, signet ring cell (SRC), mucinous and mixed cell type
• Based on tumour aggressiveness, histology cohorts were combined to form two distinct
cohorts – intestinal/mucinous and diffuse/SRC
• Propensity score matching was performed to determine mortality rates after matching for
demographic, surgery-related and tumour-related variables
O-006: Survival impact of histology for resectable gastric cancer: A
multicenter U.S. observation study – Greenleaf E, et al
Note: Based on data from abstract only
Greenleaf et al. Ann Oncol 2016; 27 (suppl 2): abstr O-006
Key results
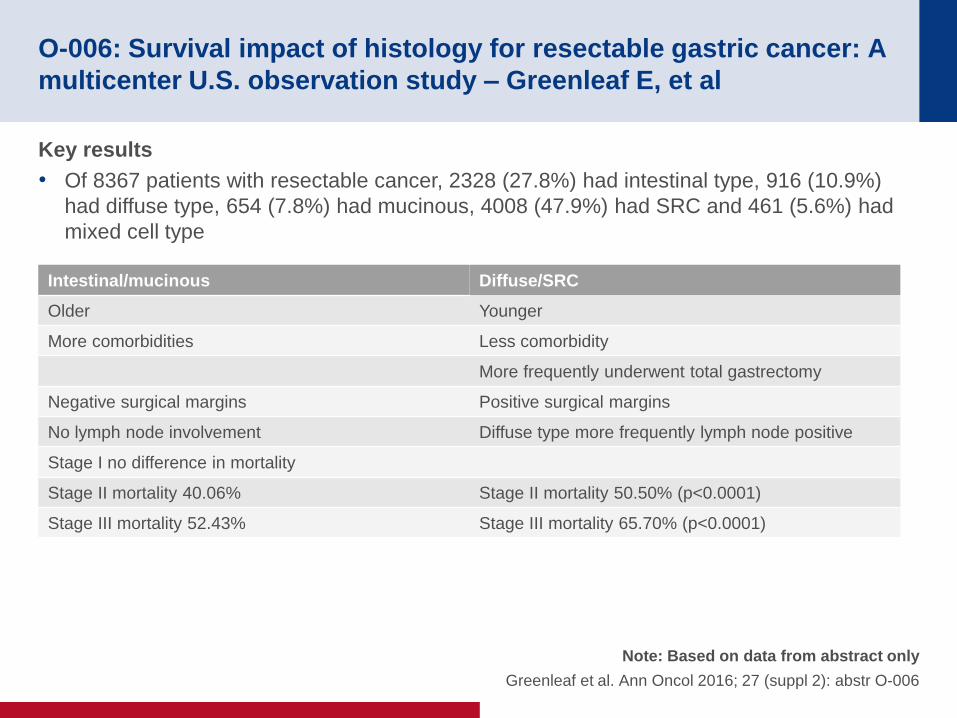
• Of 8367 patients with resectable cancer, 2328 (27.8%) had intestinal type, 916 (10.9%)
had diffuse type, 654 (7.8%) had mucinous, 4008 (47.9%) had SRC and 461 (5.6%) had
mixed cell type
Intestinal/mucinous Diffuse/SRC
Older Younger
More comorbidities Less comorbidity
More frequently underwent total gastrectomy
Negative surgical margins Positive surgical margins
No lymph node involvement Diffuse type more frequently lymph node positive
Stage I no difference in mortality
Stage II mortality 40.06% Stage II mortality 50.50% (p<0.0001)
Stage III mortality 52.43% Stage III mortality 65.70% (p<0.0001)
O-006: Survival impact of histology for resectable gastric cancer: A
multicenter U.S. observation study – Greenleaf E, et al
Note: Based on data from abstract only
Greenleaf et al. Ann Oncol 2016; 27 (suppl 2): abstr O-006
Conclusions
• Patients with gastric tumours with diffuse type and SRC histologies have worse
survival than those with intestinal type and mucinous tumours, regardless of other
prognostic factors and therapeutic intervention
• Further research is required to determine whether a different or more aggressive
treatment strategy should be employed for these patients
O-007: Biomarker analyses of second-line Ramucirumab in patients
with advanced gastric cancer from RAINBOW, a global, randomized,
double-blind, phase 3 study – Van Cutsem E, et al
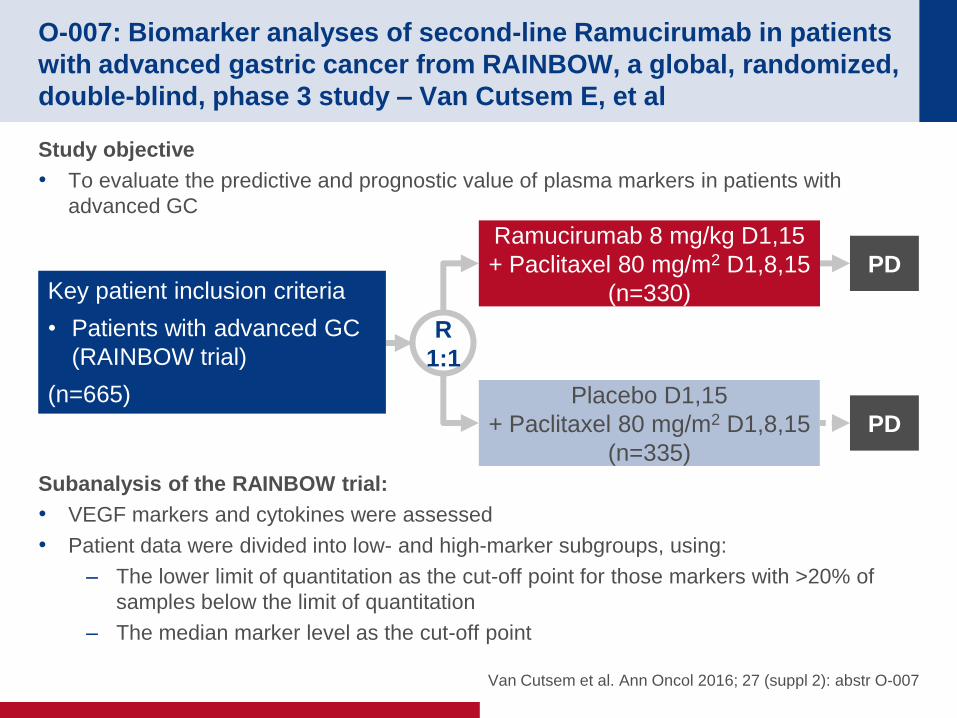
Study objective
• To evaluate the predictive and prognostic value of plasma markers in patients with
advanced GC
Subanalysis of the RAINBOW trial:
• VEGF markers and cytokines were assessed
• Patient data were divided into low- and high-marker subgroups, using:
– The lower limit of quantitation as the cut-off point for those markers with >20% of
samples below the limit of quantitation
– The median marker level as the cut-off point
Van Cutsem et al. Ann Oncol 2016; 27 (suppl 2): abstr O-007
R
1:1
PD
Ramucirumab 8 mg/kg D1,15
+ Paclitaxel 80 mg/m2 D1,8,15
(n=330) Key patient inclusion criteria
• Patients with advanced GC
(RAINBOW trial)
(n=665)
PD
Placebo D1,15
+ Paclitaxel 80 mg/m2 D1,8,15
(n=335)
O-007: Biomarker analyses of second-line Ramucirumab in patients
with advanced gastric cancer from RAINBOW, a global, randomized,
double-blind, phase 3 study – Van Cutsem E, et al
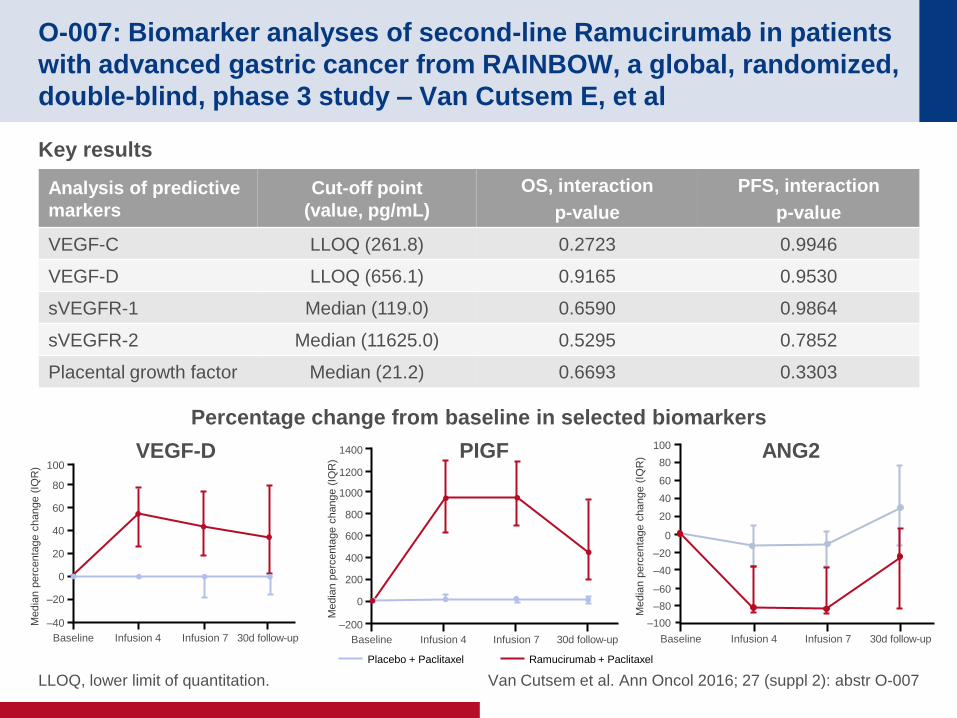
Key results
LLOQ, lower limit of quantitation. Van Cutsem et al. Ann Oncol 2016; 27 (suppl 2): abstr O-007
Analysis of predictive
markers
Cut-off point
(value, pg/mL)
OS, interaction
p-value
PFS, interaction
p-value
VEGF-C LLOQ (261.8) 0.2723 0.9946
VEGF-D LLOQ (656.1) 0.9165 0.9530
sVEGFR-1 Median (119.0) 0.6590 0.9864
sVEGFR-2 Median (11625.0) 0.5295 0.7852
Placental growth factor Median (21.2) 0.6693 0.3303
Ramucirumab + Paclitaxel Placebo + Paclitaxel
ANG2 VEGF-D PIGF
Percentage change from baseline in selected biomarkers
Media
n p
erc
enta
ge c
hange (
IQR
) 100
80
60
40
–20
–40
Baseline Infusion 4 Infusion 7 30d follow-up
20
0
Media
n p
erc
enta
ge c
hange (
IQR
)
1400
1200
1000
800
200
–200
Baseline Infusion 4 Infusion 7 30d follow-up
600
400
0
Media
n p
erc
enta
ge c
hange (
IQR
)
100
80
60
40
–20
–40
Baseline Infusion 4 Infusion 7 30d follow-up
20
0
–60
–80
–100
O-007: Biomarker analyses of second-line Ramucirumab in patients
with advanced gastric cancer from RAINBOW, a global, randomized,
double-blind, phase 3 study – Van Cutsem E, et al
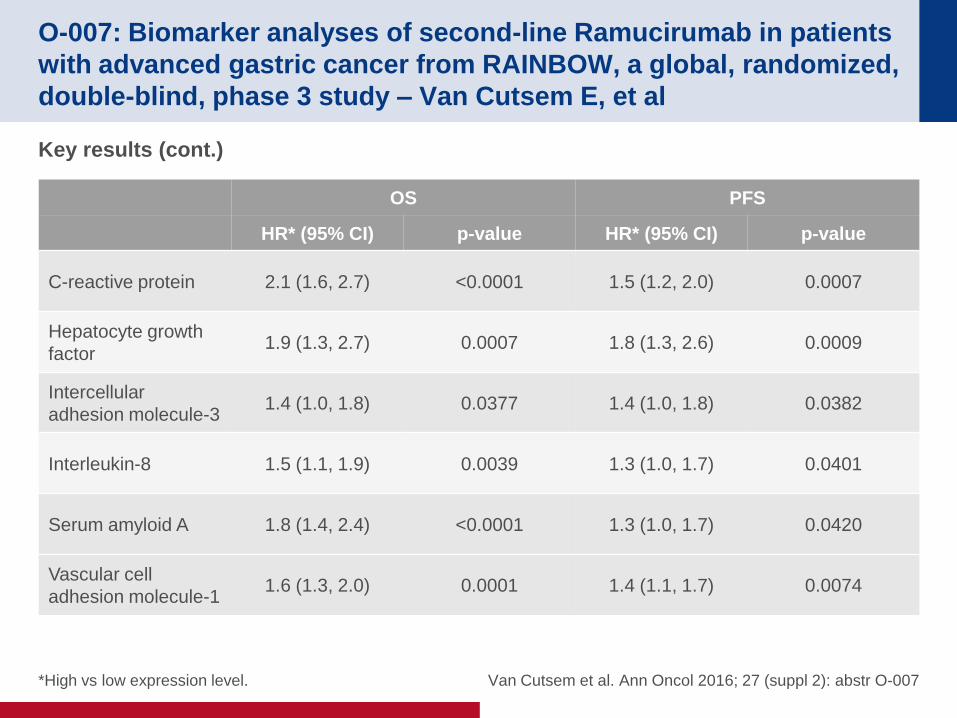
Key results (cont.)
*High vs low expression level. Van Cutsem et al. Ann Oncol 2016; 27 (suppl 2): abstr O-007
OS PFS
HR* (95% CI) p-value HR* (95% CI) p-value
C-reactive protein 2.1 (1.6, 2.7) <0.0001 1.5 (1.2, 2.0) 0.0007
Hepatocyte growth
factor 1.9 (1.3, 2.7) 0.0007 1.8 (1.3, 2.6) 0.0009
Intercellular
adhesion molecule-3 1.4 (1.0, 1.8) 0.0377 1.4 (1.0, 1.8) 0.0382
Interleukin-8 1.5 (1.1, 1.9) 0.0039 1.3 (1.0, 1.7) 0.0401
Serum amyloid A 1.8 (1.4, 2.4) <0.0001 1.3 (1.0, 1.7) 0.0420
Vascular cell
adhesion molecule-1 1.6 (1.3, 2.0) 0.0001 1.4 (1.1, 1.7) 0.0074
O-007: Biomarker analyses of second-line Ramucirumab in patients
with advanced gastric cancer from RAINBOW, a global, randomized,
double-blind, phase 3 study – Van Cutsem E, et al
Conclusions
• There are no known consistently predictive biomarkers to guide patient selection,
despite multiple approved anticancer therapies that target angiogenesis
• The exploratory plasma analyses available from the RAINBOW study do not identify a
predictive biomarker for ramucirumab
• However, this analysis revealed pharmacodynamic trends with VEGF-D, PIGF + ANG2
• Several prognostic markers were identified
Van Cutsem et al. Ann Oncol 2016; 27 (suppl 2): abstr O-007
CANCERS OF THE PANCREAS,
SMALL BOWEL AND
HEPATOBILIARY TRACT
PANCREATIC CANCER
Cancers of the pancreas, small bowel and
hepatobiliary tract
O-002: Utilization and trends in palliative therapy for stage IV
pancreatic adenocarcinoma patients: A U.S. population based
study – Kulaylat A, et al
Study objective
• To characterise the trends, factors and outcomes associated with utilisation of palliative
therapies among patients with metastatic pancreatic adenocarcinoma in the US
Study design
• Patients with clinical stage 4 pancreatic adenocarcinoma were identified from the US
National Cancer Database between 2003 and 2011
• Patients were stratified by receipt of palliative therapy (surgery, radiation, systemic
therapy, pain management or a combination thereof) and compared with those without
these designations
• Linear regression, multivariable logistic regression, and survival analyses using
multivariate proportional hazards models were performed
Note: Based on data from abstract only
Kulaylat et al. Ann Oncol 2016; 27 (suppl 2): abstr O-002
O-002: Utilization and trends in palliative therapy for stage IV
pancreatic adenocarcinoma patients: A U.S. population based
study – Kulaylat A, et al
Key results
• A total of 68,075 patients with stage IV disease were identified, 10,105 (14.8%) of whom
received specified palliative therapy
• Among the palliative cohort, the majority received systemic therapy (42.2%), followed by a
surgical intervention (21.6%), pain management alone (17.3%), radiation (9.1%) and a
combination of modalities (9.8%)
• Utilisation of palliative therapies increased from 12.2% in 2003 to 15.9% in 2011 (p<0.001)
– This trend was not observed among patients with inoperable stage 1 (7.2–8.5%,
p=0.646), stage 2 (10.1–10.2%, p=0.204) or stage 3 disease (13.5–12.5%, p=0.651)
• Patients were less likely to undergo palliation with age >60 years (OR 0.88, p<0.001), and
particularly for those >80 years (OR 0.66, p<0.001)
• Utilisation did not differ between males and females (p=0.58). Lower utilisation of palliative
measures was observed for black (OR 0.83, p<0.001) and Hispanic (OR 0.79, p<0.001)
ethnicities vs Caucasians
Note: Based on data from abstract only
Kulaylat et al. Ann Oncol 2016; 27 (suppl 2): abstr O-002
O-002: Utilization and trends in palliative therapy for stage IV
pancreatic adenocarcinoma patients: A U.S. population based
study – Kulaylat A, et al
Key results (cont.)
• Palliative therapy was used more in the presence of associated comorbidities, with 10%
higher odds in those with one comorbidity (95% CI 1.05, 1.16), and 14% higher odds in
those with two or more (95% CI 1.06, 1.23)
• Utilisation was lower for privately insured patients compared with patients with government
or no insurance (OR 0.92, p=0.004)
• Community cancer centres were less likely to offer palliative therapies than comprehensive
community and academic centres and there were significant regional variations
• Overall, survival was slightly worse in patients receiving palliative therapies (HR 1.02; 95%
CI 1.01, 1.05), with median survival of 3.6 months
• When stratifying by type of palliative therapy, those receiving surgery or combination
therapy had similar survival to non-palliative patients
– Those undergoing systemic palliative therapy, however, demonstrated prolonged
survival (median 4.7 months, HR 0.88; 95% CI 0.85, 0.91), while those undergoing
palliative radiation (median 3.2 months, HR 1.12; 95% CI 1.05, 1.20) or pain
management alone (median 1.6 months, HR 1.79; 95% CI 1.71, 1.89) experienced
worse survival
Note: Based on data from abstract only
Kulaylat et al. Ann Oncol 2016; 27 (suppl 2): abstr O-002
O-002: Utilization and trends in palliative therapy for stage IV
pancreatic adenocarcinoma patients: A U.S. population based
study – Kulaylat A, et al
Conclusions
• Palliation of symptoms remains underutilised in the US, particularly in non-
Caucasian, older patients with more comorbidities, and across all stages of
inoperable disease, despite the continued dismal prognosis of pancreatic cancer
• Although palliation does not improve survival, increased awareness of palliative
options may help increase its utilisation for end-of-life symptom control
Note: Based on data from abstract only
Kulaylat et al. Ann Oncol 2016; 27 (suppl 2): abstr O-002
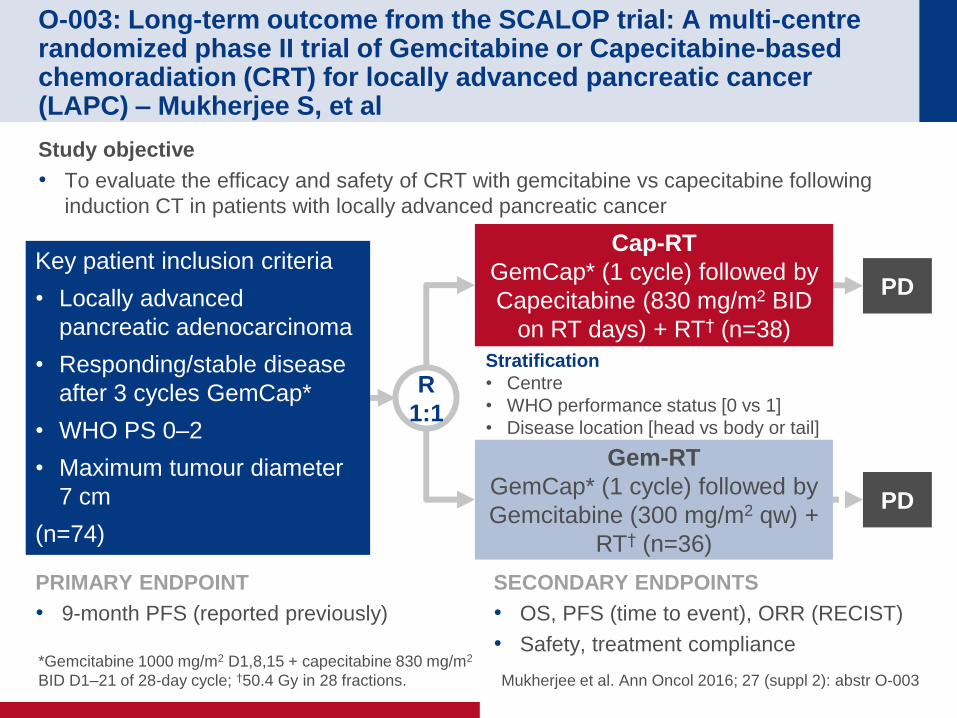
O-003: Long-term outcome from the SCALOP trial: A multi-centre randomized phase II trial of Gemcitabine or Capecitabine-based chemoradiation (CRT) for locally advanced pancreatic cancer (LAPC) – Mukherjee S, et al
Study objective
• To evaluate the efficacy and safety of CRT with gemcitabine vs capecitabine following
induction CT in patients with locally advanced pancreatic cancer
*Gemcitabine 1000 mg/m2 D1,8,15 + capecitabine 830 mg/m2
BID D1–21 of 28-day cycle; †50.4 Gy in 28 fractions. Mukherjee et al. Ann Oncol 2016; 27 (suppl 2): abstr O-003
PRIMARY ENDPOINT
• 9-month PFS (reported previously)
SECONDARY ENDPOINTS
• OS, PFS (time to event), ORR (RECIST)
• Safety, treatment compliance
R
1:1
PD
Stratification
• Centre
• WHO performance status [0 vs 1]
• Disease location [head vs body or tail]
Cap-RT
GemCap* (1 cycle) followed by
Capecitabine (830 mg/m2 BID
on RT days) + RT† (n=38)
Key patient inclusion criteria
• Locally advanced
pancreatic adenocarcinoma
• Responding/stable disease
after 3 cycles GemCap*
• WHO PS 0–2
• Maximum tumour diameter
7 cm
(n=74)
PD
Gem-RT
GemCap* (1 cycle) followed by
Gemcitabine (300 mg/m2 qw) +
RT† (n=36)
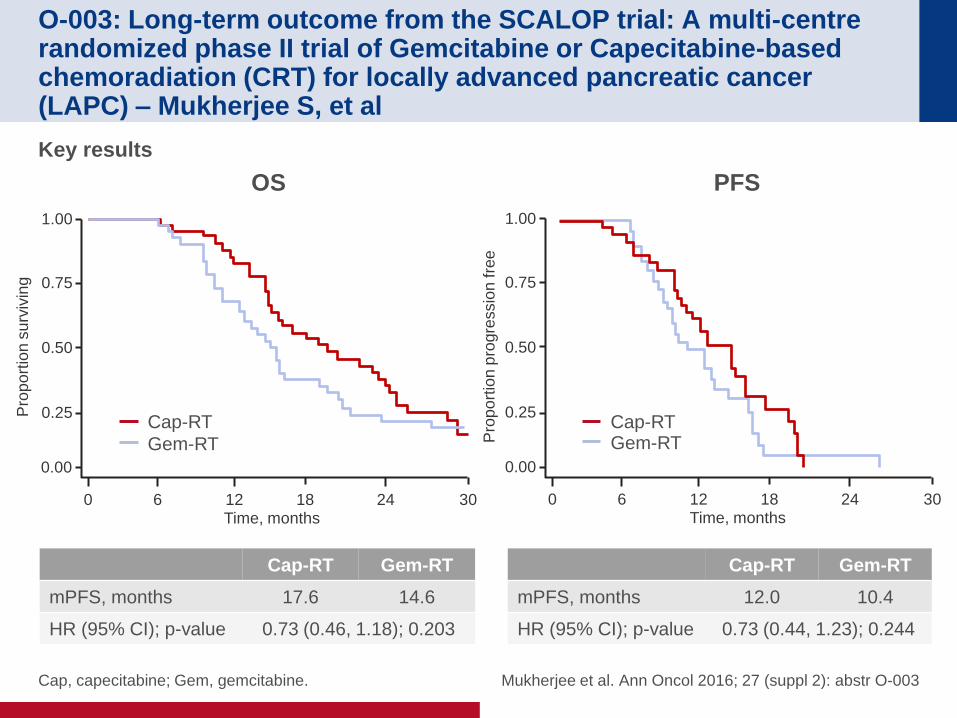
O-003: Long-term outcome from the SCALOP trial: A multi-centre randomized phase II trial of Gemcitabine or Capecitabine-based chemoradiation (CRT) for locally advanced pancreatic cancer (LAPC) – Mukherjee S, et al
Key results
Cap, capecitabine; Gem, gemcitabine. Mukherjee et al. Ann Oncol 2016; 27 (suppl 2): abstr O-003
Cap-RT Gem-RT
mPFS, months 12.0 10.4
HR (95% CI); p-value 0.73 (0.44, 1.23); 0.244
Cap-RT Gem-RT
mPFS, months 17.6 14.6
HR (95% CI); p-value 0.73 (0.46, 1.18); 0.203
OS
Pro
po
rtio
n s
urv
ivin
g
1.00
0.75
0.50
0.25
0 6
12 18 24 30 Time, months
0.00
Gem-RT
Cap-RT
PFS
Pro
po
rtio
n p
rogre
ssio
n fre
e
1.00
0.75
0.50
0.25
0 6
12 18 24 30 Time, months
0.00
Gem-RT Cap-RT
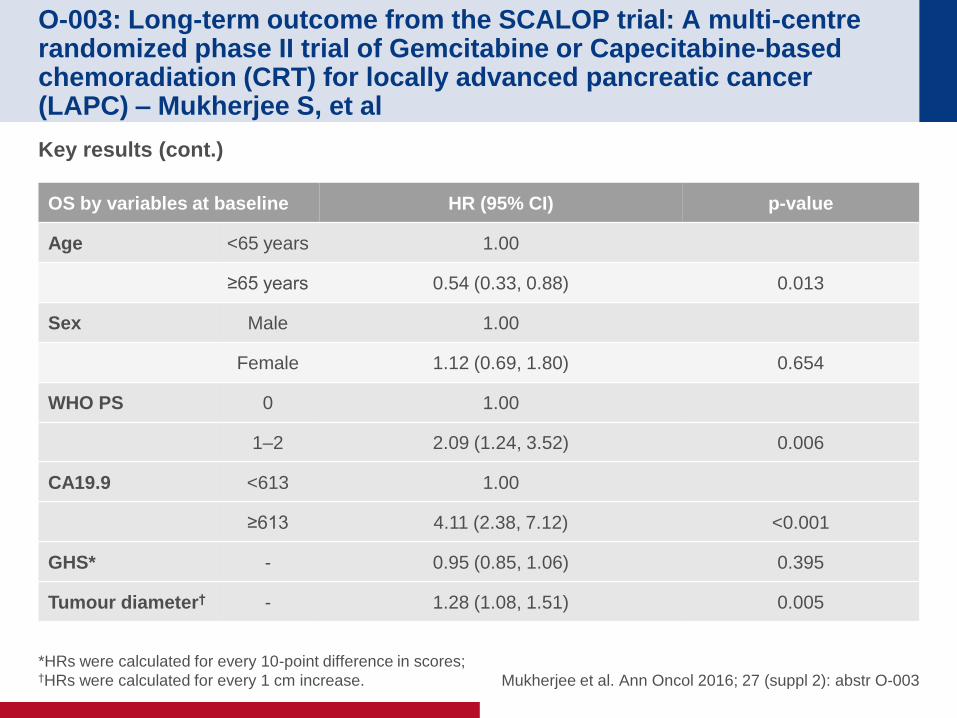
O-003: Long-term outcome from the SCALOP trial: A multi-centre randomized phase II trial of Gemcitabine or Capecitabine-based chemoradiation (CRT) for locally advanced pancreatic cancer (LAPC) – Mukherjee S, et al
Key results (cont.)
*HRs were calculated for every 10-point difference in scores; †HRs were calculated for every 1 cm increase. Mukherjee et al. Ann Oncol 2016; 27 (suppl 2): abstr O-003
OS by variables at baseline HR (95% CI) p-value
Age <65 years 1.00
≥65 years 0.54 (0.33, 0.88) 0.013
Sex Male 1.00
Female 1.12 (0.69, 1.80) 0.654
WHO PS 0 1.00
1–2 2.09 (1.24, 3.52) 0.006
CA19.9 <613 1.00
≥613 4.11 (2.38, 7.12) <0.001
GHS* - 0.95 (0.85, 1.06) 0.395
Tumour diameter† - 1.28 (1.08, 1.51) 0.005
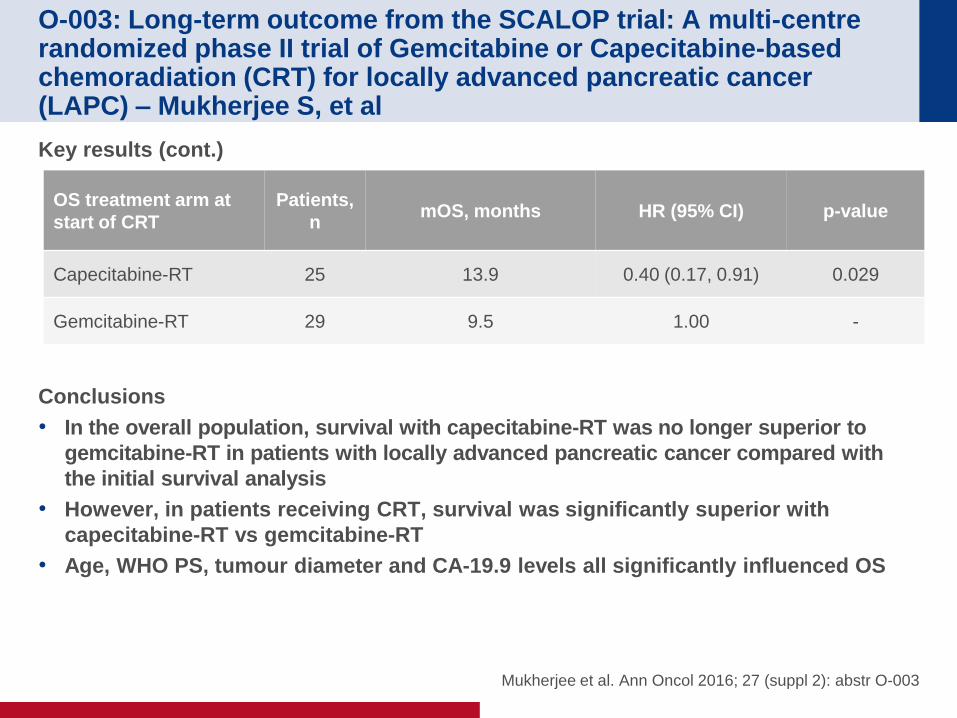
O-003: Long-term outcome from the SCALOP trial: A multi-centre randomized phase II trial of Gemcitabine or Capecitabine-based chemoradiation (CRT) for locally advanced pancreatic cancer (LAPC) – Mukherjee S, et al
Key results (cont.)
Conclusions
• In the overall population, survival with capecitabine-RT was no longer superior to
gemcitabine-RT in patients with locally advanced pancreatic cancer compared with
the initial survival analysis
• However, in patients receiving CRT, survival was significantly superior with
capecitabine-RT vs gemcitabine-RT
• Age, WHO PS, tumour diameter and CA-19.9 levels all significantly influenced OS
Mukherjee et al. Ann Oncol 2016; 27 (suppl 2): abstr O-003
OS treatment arm at
start of CRT
Patients,
n mOS, months HR (95% CI) p-value
Capecitabine-RT 25 13.9 0.40 (0.17, 0.91) 0.029
Gemcitabine-RT 29 9.5 1.00 -
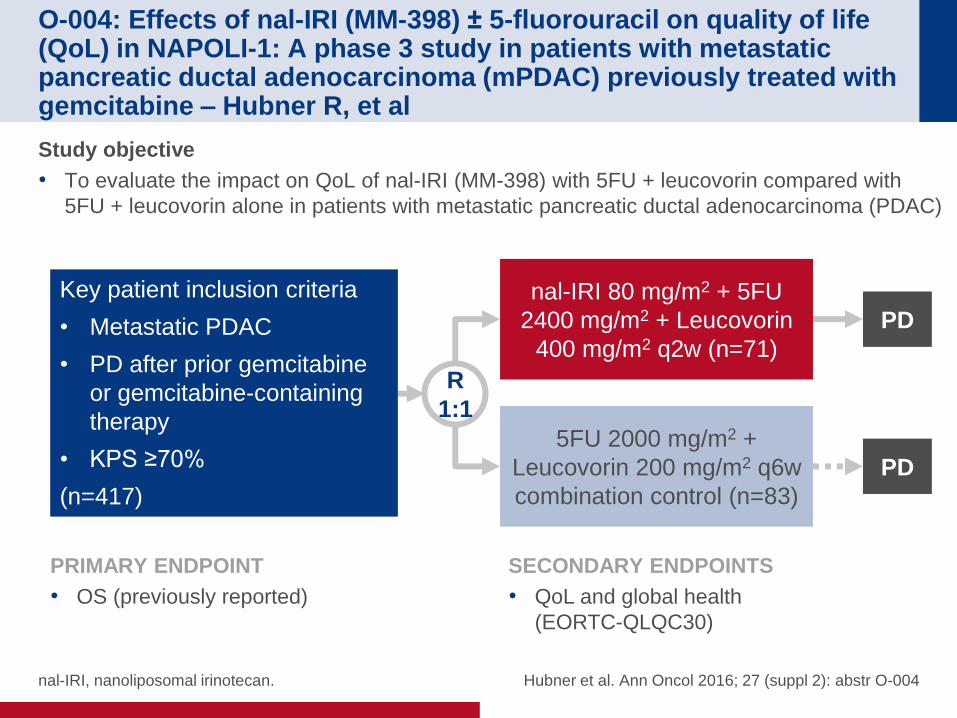
O-004: Effects of nal-IRI (MM-398) ± 5-fluorouracil on quality of life (QoL) in NAPOLI-1: A phase 3 study in patients with metastatic pancreatic ductal adenocarcinoma (mPDAC) previously treated with gemcitabine – Hubner R, et al
Study objective
• To evaluate the impact on QoL of nal-IRI (MM-398) with 5FU + leucovorin compared with
5FU + leucovorin alone in patients with metastatic pancreatic ductal adenocarcinoma (PDAC)
nal-IRI, nanoliposomal irinotecan. Hubner et al. Ann Oncol 2016; 27 (suppl 2): abstr O-004
R
1:1
nal-IRI 80 mg/m2 + 5FU
2400 mg/m2 + Leucovorin
400 mg/m2 q2w (n=71)
Key patient inclusion criteria
• Metastatic PDAC
• PD after prior gemcitabine
or gemcitabine-containing
therapy
• KPS ≥70%
(n=417)
PRIMARY ENDPOINT
• OS (previously reported)
SECONDARY ENDPOINTS
• QoL and global health
(EORTC-QLQC30)
5FU 2000 mg/m2 +
Leucovorin 200 mg/m2 q6w
combination control (n=83)
PD
PD
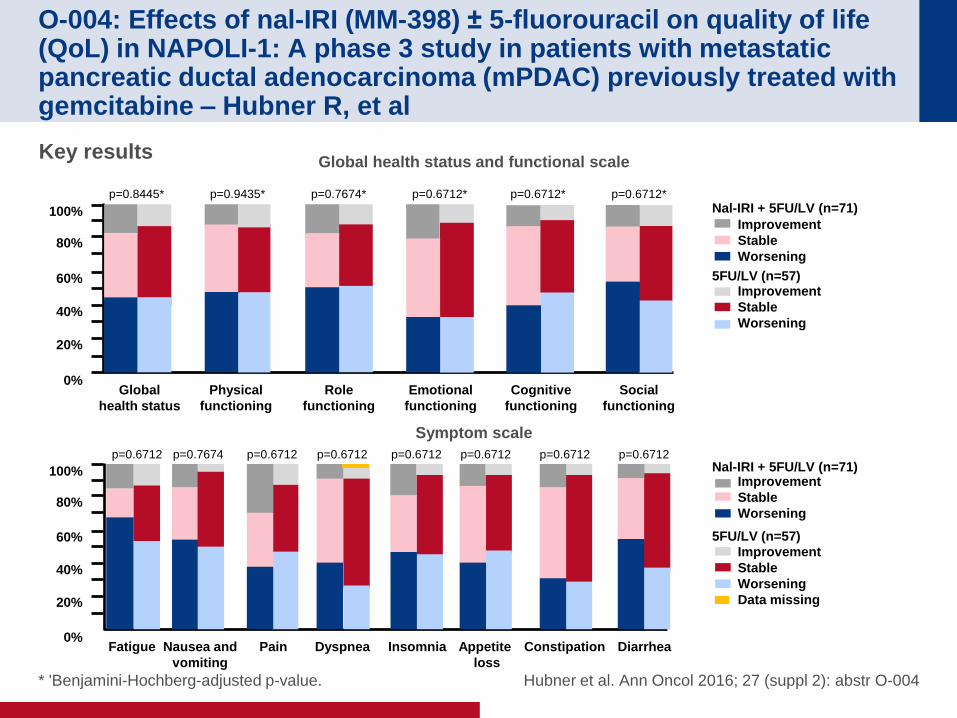
O-004: Effects of nal-IRI (MM-398) ± 5-fluorouracil on quality of life (QoL) in NAPOLI-1: A phase 3 study in patients with metastatic pancreatic ductal adenocarcinoma (mPDAC) previously treated with gemcitabine – Hubner R, et al
* 'Benjamini-Hochberg-adjusted p-value. Hubner et al. Ann Oncol 2016; 27 (suppl 2): abstr O-004
Key results
40%
60%
80%
100%
20%
0% Global
health status
Physical
functioning
Role
functioning
Emotional
functioning
Cognitive
functioning
Social
functioning
p=0.8445* p=0.9435* p=0.7674* p=0.6712* p=0.6712* p=0.6712*
Nal-IRI + 5FU/LV (n=71)
5FU/LV (n=57)
Improvement
Stable
Worsening
Improvement
Stable
Worsening
40%
60%
80%
100%
20%
0% Fatigue Nausea and
vomiting
Dyspnea Insomnia Appetite
loss
Diarrhea
Nal-IRI + 5FU/LV (n=71)
5FU/LV (n=57)
Improvement
Stable
Worsening
Improvement
Stable
Worsening
Data missing
p=0.6712 p=0.7674 p=0.6712
Pain Constipation
p=0.6712 p=0.6712 p=0.6712 p=0.6712 p=0.6712
Global health status and functional scale
Symptom scale
O-004: Effects of nal-IRI (MM-398) ± 5-fluorouracil on quality of life (QoL) in NAPOLI-1: A phase 3 study in patients with metastatic pancreatic ductal adenocarcinoma (mPDAC) previously treated with gemcitabine – Hubner R, et al
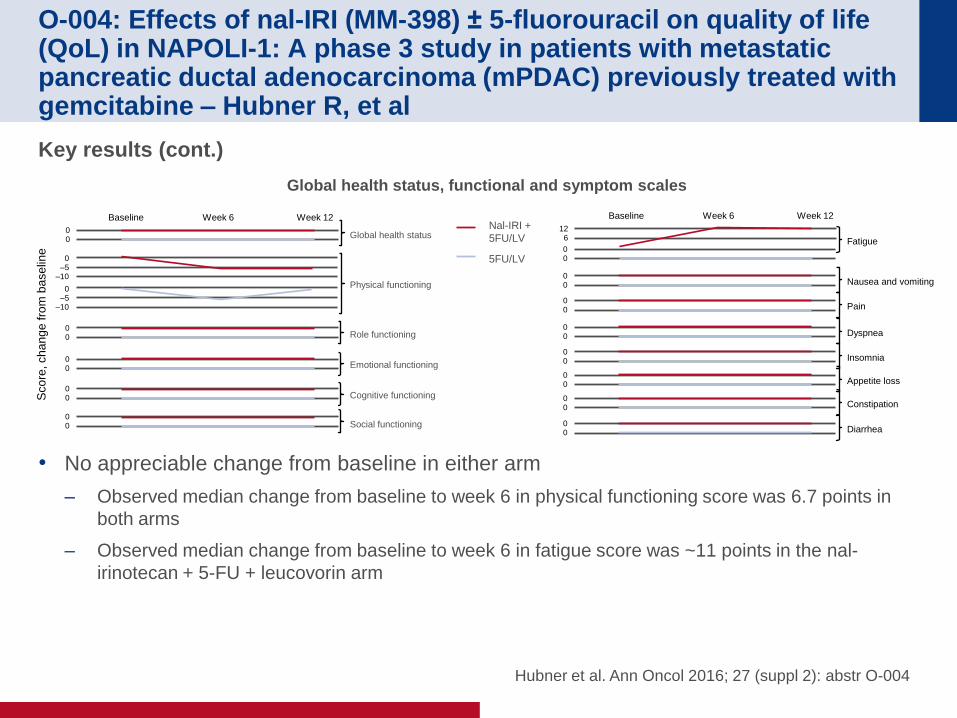
Key results (cont.)
• No appreciable change from baseline in either arm
– Observed median change from baseline to week 6 in physical functioning score was 6.7 points in
both arms
– Observed median change from baseline to week 6 in fatigue score was ~11 points in the nal-
irinotecan + 5-FU + leucovorin arm
Hubner et al. Ann Oncol 2016; 27 (suppl 2): abstr O-004
Sco
re, ch
an
ge
fro
m b
ase
line
0 0
0 –5
–10
0 –5
–10
0 0
0 0
0 0
0 0
Global health status
Physical functioning
Role functioning
Emotional functioning
Cognitive functioning
Social functioning
Baseline Week 6 Week 12 Nal-IRI +
5FU/LV
5FU/LV
0 0 Diarrhea
0 0 Constipation
0 0 Appetite loss
0 0 Insomnia
0 0 Dyspnea
0 0 Pain
0 0 Nausea and vomiting
Baseline Week 6 Week 12
0 0
Fatigue
12 6
Global health status, functional and symptom scales
O-004: Effects of nal-IRI (MM-398) ± 5-fluorouracil on quality of life (QoL) in NAPOLI-1: A phase 3 study in patients with metastatic pancreatic ductal adenocarcinoma (mPDAC) previously treated with gemcitabine – Hubner R, et al
Conclusions
• Overall, over 12 weeks, patients treated with nal-IRI + 5FU + leucovorin had no
deterioration in QoL
• No significant difference in global health status and functional scale scores were
observed between treatment arms at baseline, or over the 12 weeks of the study
• As nal-IRI has been previously shown to improve OS, these data support it as a new
treatment option for patients with metastatic PDAC previously treated with
gemcitabine-based therapy
Hubner et al. Ann Oncol 2016; 27 (suppl 2): abstr O-004
HEPATOCELLULAR CARCINOMA
Cancers of the pancreas, small bowel and
hepatobiliary tract
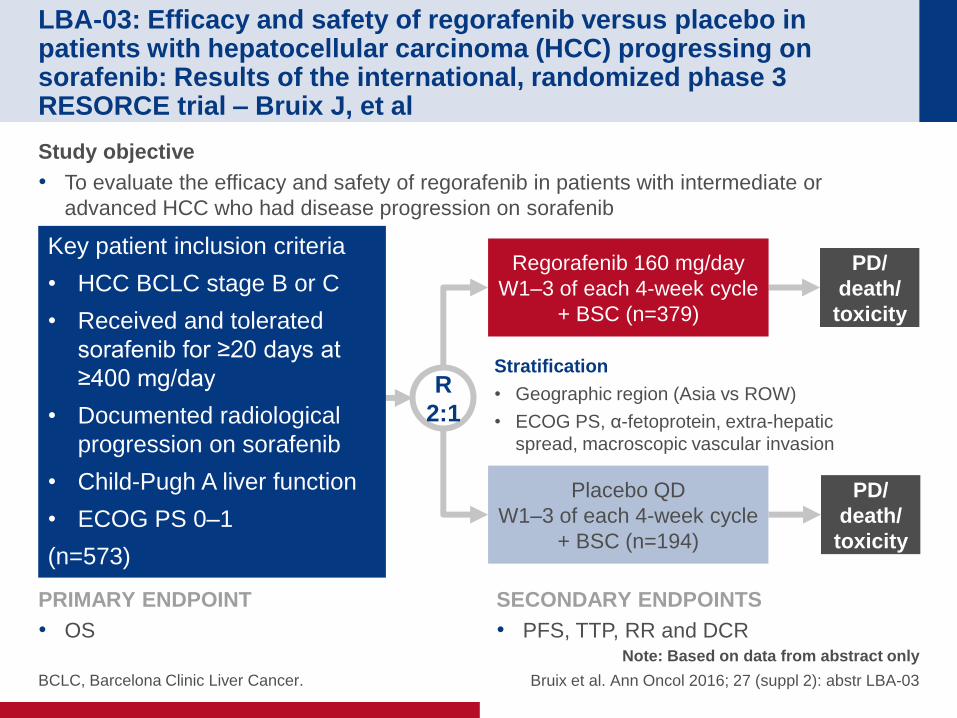
LBA-03: Efficacy and safety of regorafenib versus placebo in patients with hepatocellular carcinoma (HCC) progressing on sorafenib: Results of the international, randomized phase 3 RESORCE trial – Bruix J, et al
BCLC, Barcelona Clinic Liver Cancer.
Note: Based on data from abstract only
Bruix et al. Ann Oncol 2016; 27 (suppl 2): abstr LBA-03
Study objective
• To evaluate the efficacy and safety of regorafenib in patients with intermediate or
advanced HCC who had disease progression on sorafenib
R
2:1
PD/
death/
toxicity
Regorafenib 160 mg/day
W1–3 of each 4-week cycle
+ BSC (n=379)
Key patient inclusion criteria
• HCC BCLC stage B or C
• Received and tolerated
sorafenib for ≥20 days at
≥400 mg/day
• Documented radiological
progression on sorafenib
• Child-Pugh A liver function
• ECOG PS 0–1
(n=573)
Placebo QD
W1–3 of each 4-week cycle
+ BSC (n=194)
PD/
death/
toxicity
Stratification
• Geographic region (Asia vs ROW)
• ECOG PS, α-fetoprotein, extra-hepatic
spread, macroscopic vascular invasion
PRIMARY ENDPOINT
• OS
SECONDARY ENDPOINTS
• PFS, TTP, RR and DCR
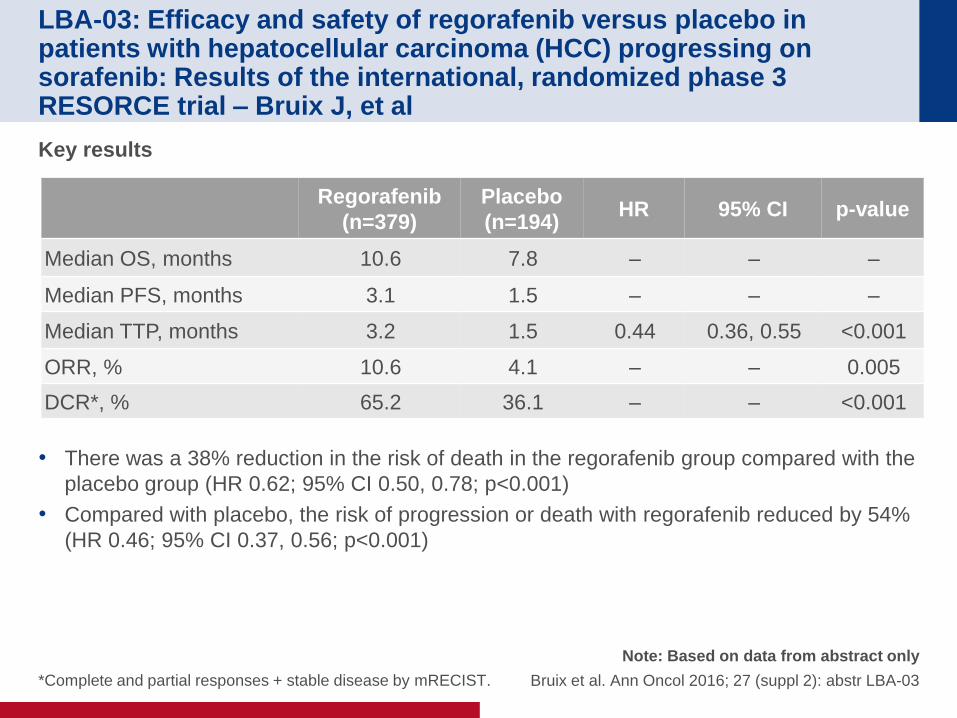
LBA-03: Efficacy and safety of regorafenib versus placebo in patients with hepatocellular carcinoma (HCC) progressing on sorafenib: Results of the international, randomized phase 3 RESORCE trial – Bruix J, et al
*Complete and partial responses + stable disease by mRECIST.
Note: Based on data from abstract only
Bruix et al. Ann Oncol 2016; 27 (suppl 2): abstr LBA-03
Key results
• There was a 38% reduction in the risk of death in the regorafenib group compared with the
placebo group (HR 0.62; 95% CI 0.50, 0.78; p<0.001)
• Compared with placebo, the risk of progression or death with regorafenib reduced by 54%
(HR 0.46; 95% CI 0.37, 0.56; p<0.001)
Regorafenib
(n=379)
Placebo
(n=194) HR 95% CI p-value
Median OS, months 10.6 7.8 – – –
Median PFS, months 3.1 1.5 – – –
Median TTP, months 3.2 1.5 0.44 0.36, 0.55 <0.001
ORR, % 10.6 4.1 – – 0.005
DCR*, % 65.2 36.1 – – <0.001
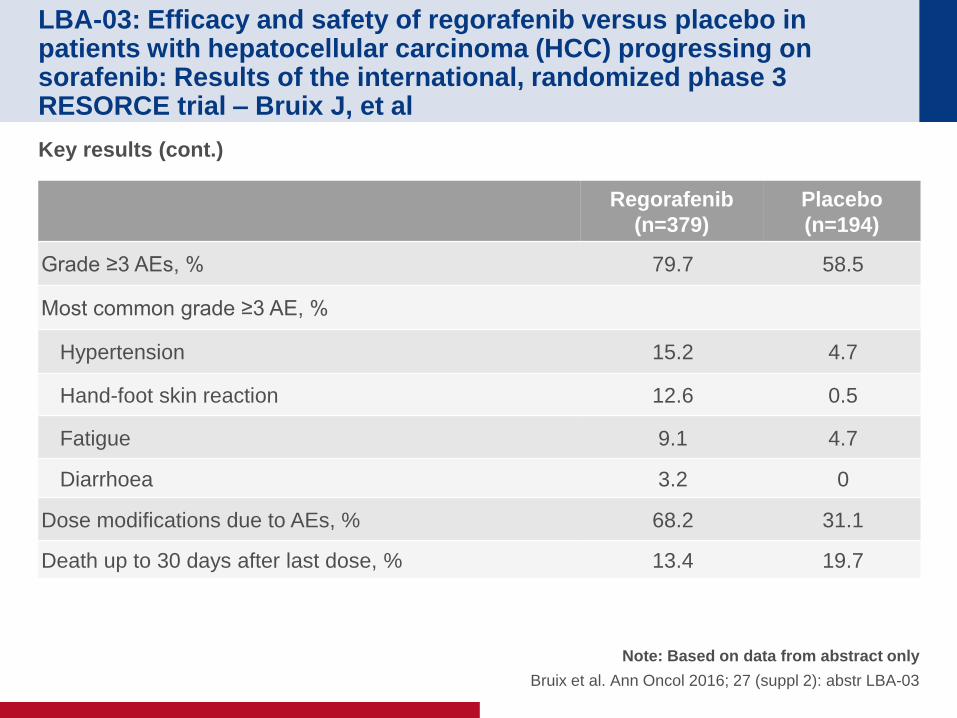
LBA-03: Efficacy and safety of regorafenib versus placebo in patients with hepatocellular carcinoma (HCC) progressing on sorafenib: Results of the international, randomized phase 3 RESORCE trial – Bruix J, et al
Note: Based on data from abstract only
Bruix et al. Ann Oncol 2016; 27 (suppl 2): abstr LBA-03
Key results (cont.)
Regorafenib
(n=379)
Placebo
(n=194)
Grade ≥3 AEs, % 79.7 58.5
Most common grade ≥3 AE, %
Hypertension 15.2 4.7
Hand-foot skin reaction 12.6 0.5
Fatigue 9.1 4.7
Diarrhoea 3.2 0
Dose modifications due to AEs, % 68.2 31.1
Death up to 30 days after last dose, % 13.4 19.7
LBA-03: Efficacy and safety of regorafenib versus placebo in patients with hepatocellular carcinoma (HCC) progressing on sorafenib: Results of the international, randomized phase 3 RESORCE trial – Bruix J, et al
Note: Based on data from abstract only
Bruix et al. Ann Oncol 2016; 27 (suppl 2): abstr LBA-03
Conclusions
• In patients with HCC who had progressed under sorafenib, treatment with
regorafenib significantly improved OS
• Regorafenib therapy was well tolerated and observed AEs were in line with its
known safety profile
NEUROENDOCRINE TUMOUR
Cancers of the pancreas, small bowel and
hepatobiliary tract

O-009: NETTER-1 phase III: Efficacy and safety results in patients
with midgut neuroendocrine tumors treated with 177Lu-dotatate
– Ruszniewski P, et al
Ruszniewski et al. Ann Oncol 2016; 27 (suppl 2): abstr O-009
Study objective
• To evaluate the efficacy and safety of 177Lu-dotatate compared with octreotide LAR in
patients with advanced, progressive somatostatin receptor positive midgut NETs
R
1:1
5-year
follow-up
177Lu-Dotatate 7.4 GBq
q8w (x4) + SSAs
(n=115)
Key patient inclusion criteria
• Grade 1–2 metastatic or
locally advanced midgut
NET
• PD on octreotide LAR
• KPS ≥60
(n=230)
PRIMARY ENDPOINT
• PFS (RECIST 1.1)
SECONDARY ENDPOINTS
• ORR, OS, TTP, safety and QoL
5-year
follow-up
Octreotide LAR 60 mg
q4w
(n=115)
O-009: NETTER-1 phase III: Efficacy and safety results in patients
with midgut neuroendocrine tumors treated with 177Lu-dotatate
– Ruszniewski P, et al
Ruszniewski et al. Ann Oncol 2016; 27 (suppl 2): abstr O-009
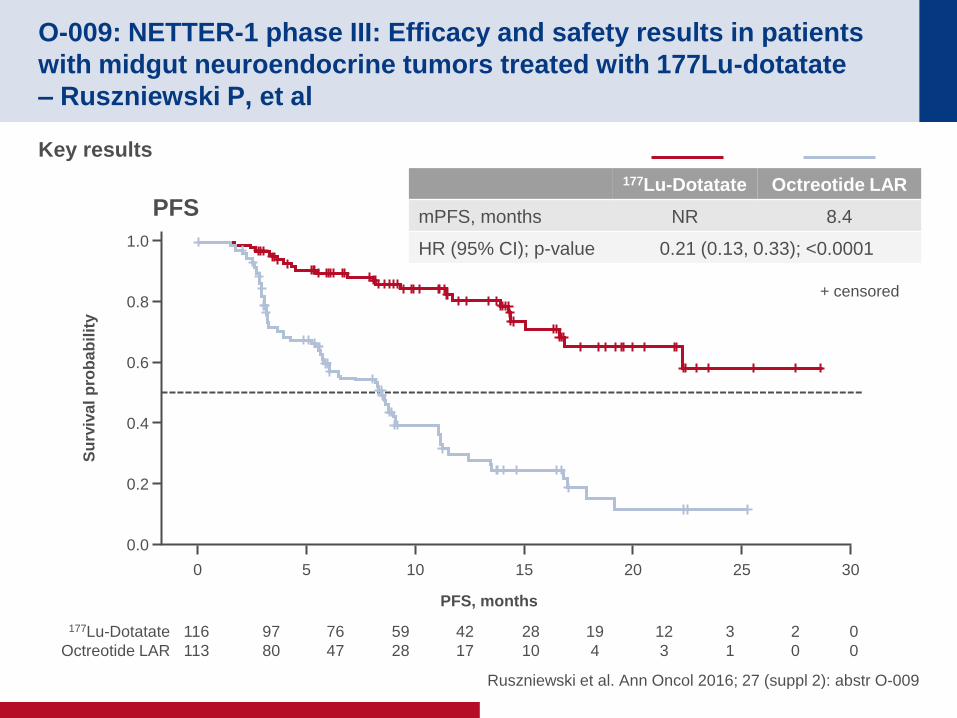
Key results
PFS
177Lu-Dotatate Octreotide LAR
mPFS, months NR 8.4
HR (95% CI); p-value 0.21 (0.13, 0.33); <0.0001 1.0
0.8
0.6
0.4
0.2
0.0
Su
rviv
al
pro
bab
ilit
y
PFS, months
0 5 10 15 20 25 30
116
113
97
80
76
47
59
28
42
17
28
10
19
4
12
3
3
1
2
0
+ censored
177Lu-Dotatate
Octreotide LAR
0
0
O-009: NETTER-1 phase III: Efficacy and safety results in patients
with midgut neuroendocrine tumors treated with 177Lu-dotatate
– Ruszniewski P, et al
Ruszniewski et al. Ann Oncol 2016; 27 (suppl 2): abstr O-009
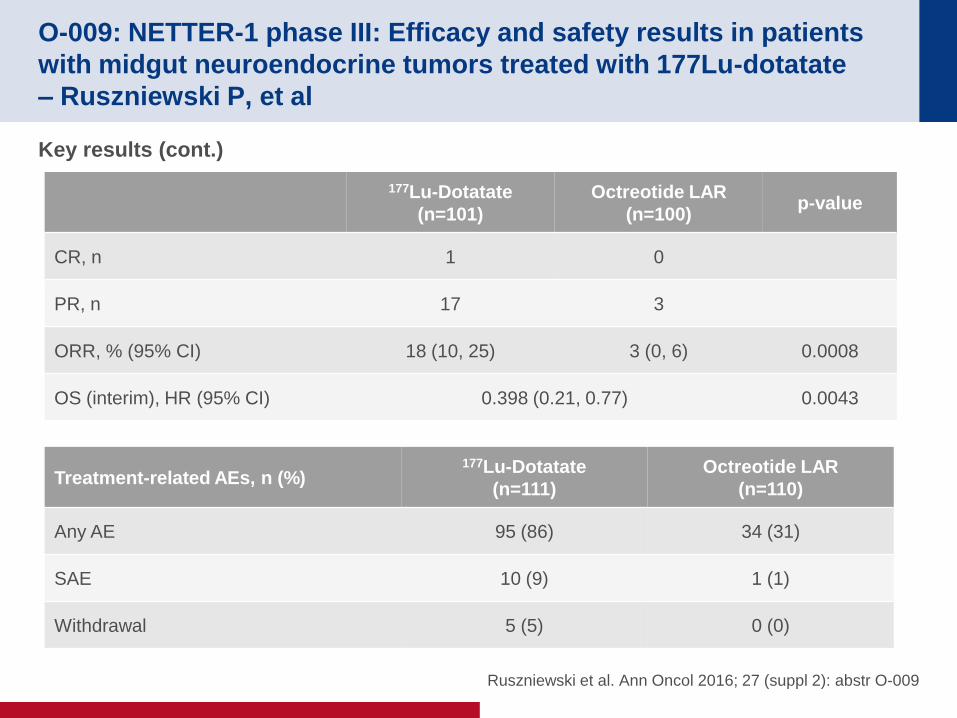
Key results (cont.)
177Lu-Dotatate
(n=101)
Octreotide LAR
(n=100) p-value
CR, n 1 0
PR, n 17 3
ORR, % (95% CI) 18 (10, 25) 3 (0, 6) 0.0008
OS (interim), HR (95% CI) 0.398 (0.21, 0.77) 0.0043
Treatment-related AEs, n (%) 177Lu-Dotatate
(n=111)
Octreotide LAR
(n=110)
Any AE 95 (86) 34 (31)
SAE 10 (9) 1 (1)
Withdrawal 5 (5) 0 (0)
O-009: NETTER-1 phase III: Efficacy and safety results in patients
with midgut neuroendocrine tumors treated with 177Lu-dotatate
– Ruszniewski P, et al
Ruszniewski et al. Ann Oncol 2016; 27 (suppl 2): abstr O-009
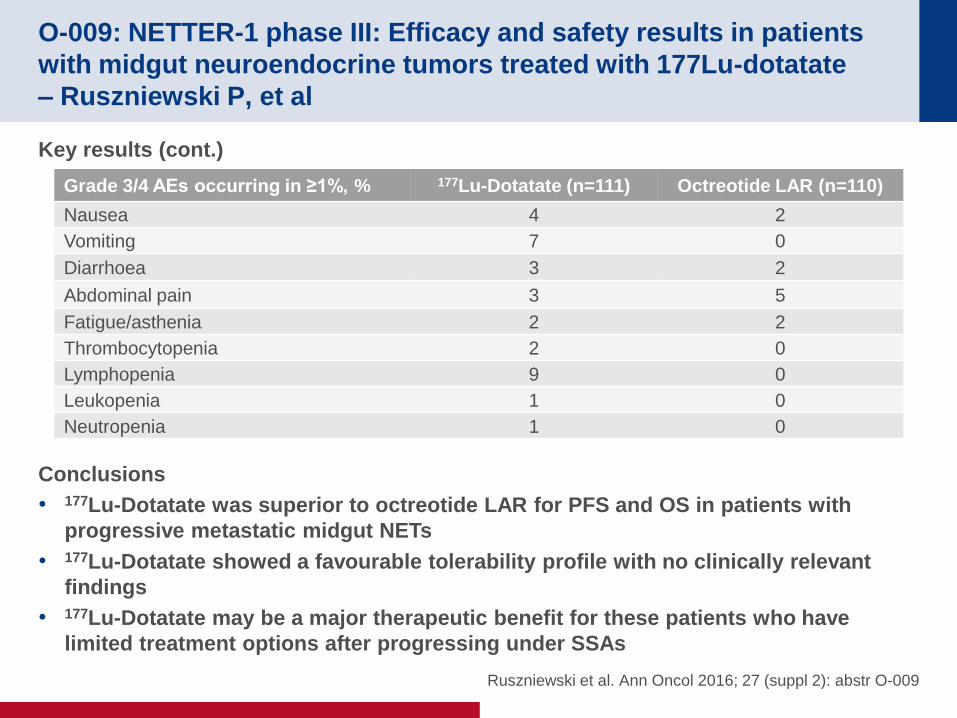
Key results (cont.)
Conclusions
• 177Lu-Dotatate was superior to octreotide LAR for PFS and OS in patients with
progressive metastatic midgut NETs
• 177Lu-Dotatate showed a favourable tolerability profile with no clinically relevant
findings
• 177Lu-Dotatate may be a major therapeutic benefit for these patients who have
limited treatment options after progressing under SSAs
Grade 3/4 AEs occurring in ≥1%, % 177Lu-Dotatate (n=111) Octreotide LAR (n=110)
Nausea 4 2
Vomiting 7 0
Diarrhoea 3 2
Abdominal pain 3 5
Fatigue/asthenia 2 2
Thrombocytopenia 2 0
Lymphopenia 9 0
Leukopenia 1 0
Neutropenia 1 0
O-008: Impact of chromogranin A, grade, and mitotic rate in small,
non-functional pancreatic neuroendocrine tumors: A U.S population
based study – Mirkin K, et al
Note: Based on data from abstract only
Mirkin et al. Ann Oncol 2016; 27 (suppl 2): abstr O-008
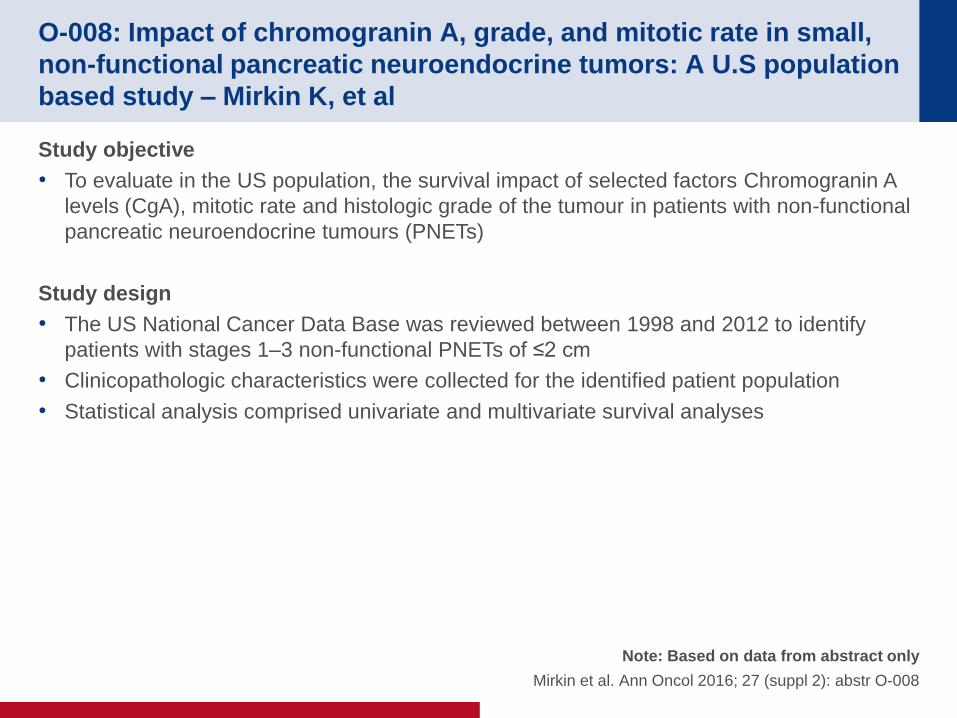
Study objective
• To evaluate in the US population, the survival impact of selected factors Chromogranin A
levels (CgA), mitotic rate and histologic grade of the tumour in patients with non-functional
pancreatic neuroendocrine tumours (PNETs)
Study design
• The US National Cancer Data Base was reviewed between 1998 and 2012 to identify
patients with stages 1–3 non-functional PNETs of ≤2 cm
• Clinicopathologic characteristics were collected for the identified patient population
• Statistical analysis comprised univariate and multivariate survival analyses
O-008: Impact of chromogranin A, grade, and mitotic rate in small,
non-functional pancreatic neuroendocrine tumors: A U.S population
based study – Mirkin K, et al
Note: Based on data from abstract only
Mirkin et al. Ann Oncol 2016; 27 (suppl 2): abstr O-008
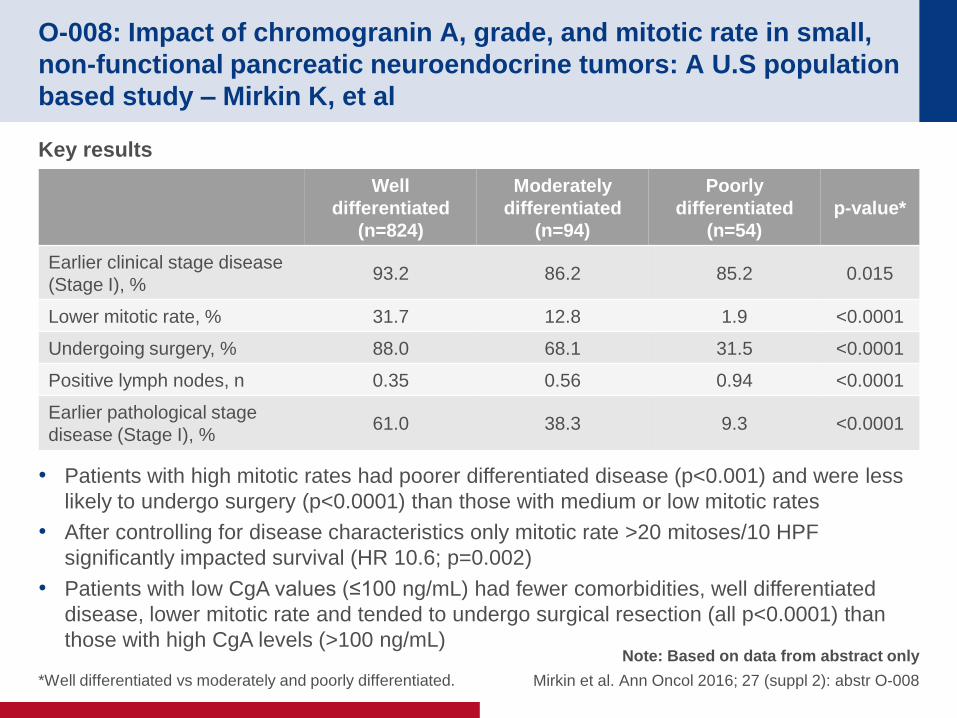
Key results
• Patients with high mitotic rates had poorer differentiated disease (p<0.001) and were less
likely to undergo surgery (p<0.0001) than those with medium or low mitotic rates
• After controlling for disease characteristics only mitotic rate >20 mitoses/10 HPF
significantly impacted survival (HR 10.6; p=0.002)
• Patients with low CgA values (≤100 ng/mL) had fewer comorbidities, well differentiated
disease, lower mitotic rate and tended to undergo surgical resection (all p<0.0001) than
those with high CgA levels (>100 ng/mL)
Well
differentiated
(n=824)
Moderately
differentiated
(n=94)
Poorly
differentiated
(n=54)
p-value*
Earlier clinical stage disease
(Stage I), % 93.2 86.2 85.2 0.015
Lower mitotic rate, % 31.7 12.8 1.9 <0.0001
Undergoing surgery, % 88.0 68.1 31.5 <0.0001
Positive lymph nodes, n 0.35 0.56 0.94 <0.0001
Earlier pathological stage
disease (Stage I), % 61.0 38.3 9.3 <0.0001
*Well differentiated vs moderately and poorly differentiated.
O-008: Impact of chromogranin A, grade, and mitotic rate in small,
non-functional pancreatic neuroendocrine tumors: A U.S population
based study – Mirkin K, et al
Note: Based on data from abstract only
Mirkin et al. Ann Oncol 2016; 27 (suppl 2): abstr O-008
Conclusions
• Both grade and very high CgA levels were significantly associated with survival in
patients with non-functional, small PNETs
• Survival appeared to be negatively impacted by mitotic rate >20 mitoses/10 HPF
only, although this was a rare occurrence
• In this select population, both poor grade and elevated CgA levels should be
considered as poor prognostic indicators, but surgical resection appears to
improve survival in these patients

GENERAL
Cancers of the pancreas, small bowel and
hepatobiliary tract
O-001: The influence of multidisciplinary teams on diagnosis and
treatment – Basta Y, et al
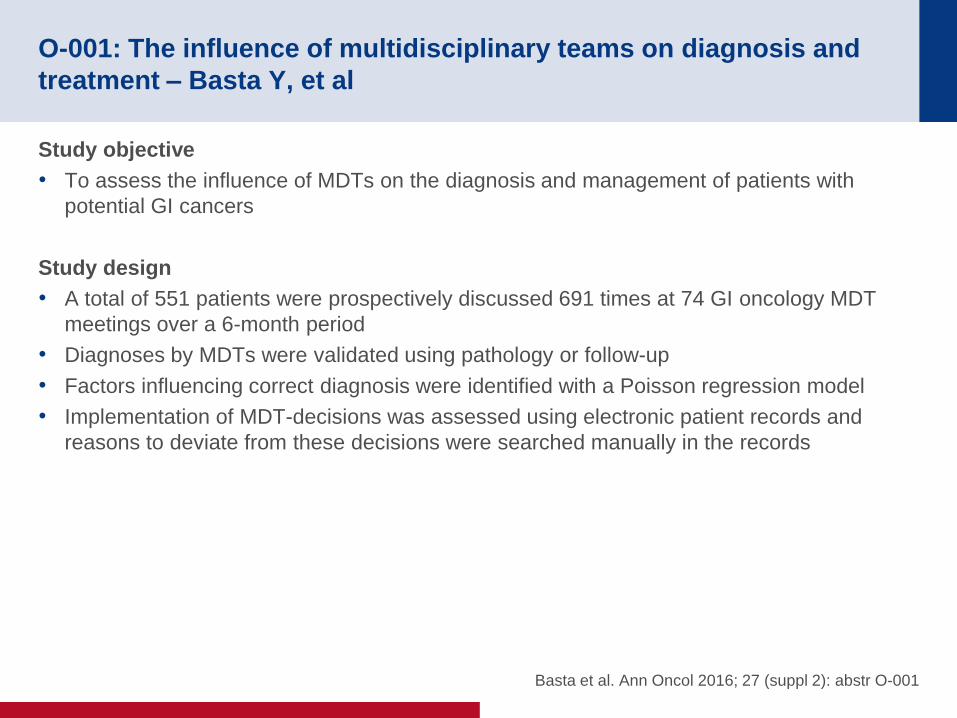
Study objective
• To assess the influence of MDTs on the diagnosis and management of patients with
potential GI cancers
Study design
• A total of 551 patients were prospectively discussed 691 times at 74 GI oncology MDT
meetings over a 6-month period
• Diagnoses by MDTs were validated using pathology or follow-up
• Factors influencing correct diagnosis were identified with a Poisson regression model
• Implementation of MDT-decisions was assessed using electronic patient records and
reasons to deviate from these decisions were searched manually in the records
Basta et al. Ann Oncol 2016; 27 (suppl 2): abstr O-001
O-001: The influence of multidisciplinary teams on diagnosis and
treatment – Basta Y, et al
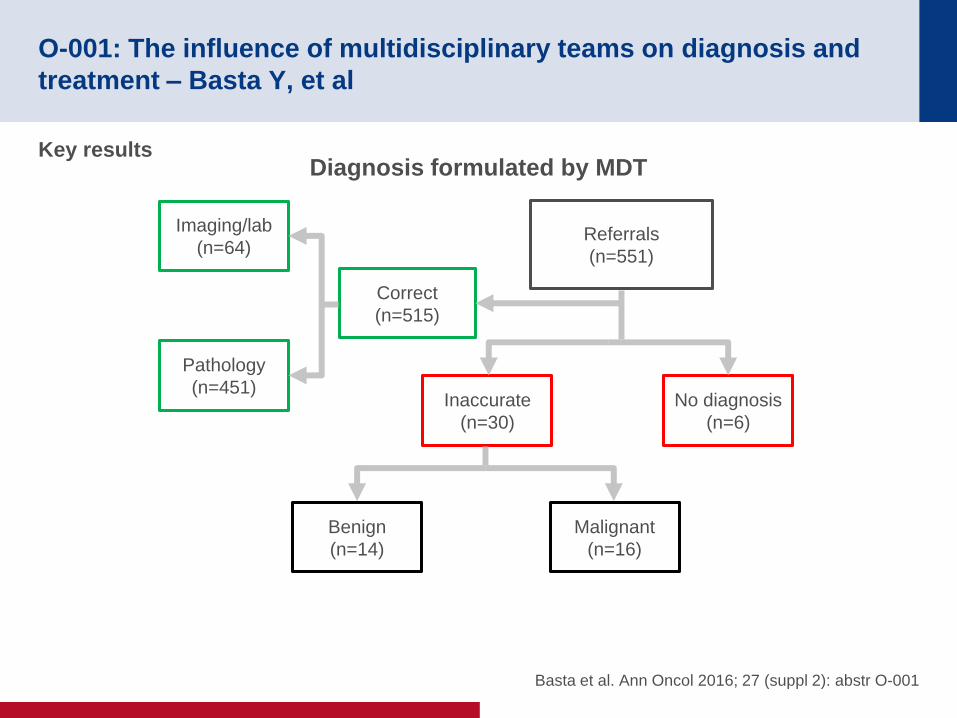
Key results
Basta et al. Ann Oncol 2016; 27 (suppl 2): abstr O-001
Imaging/lab
(n=64)
Pathology
(n=451)
Correct
(n=515)
Referrals
(n=551)
Inaccurate
(n=30)
No diagnosis
(n=6)
Benign
(n=14)
Malignant
(n=16)
Diagnosis formulated by MDT
O-001: The influence of multidisciplinary teams on diagnosis and
treatment – Basta Y, et al
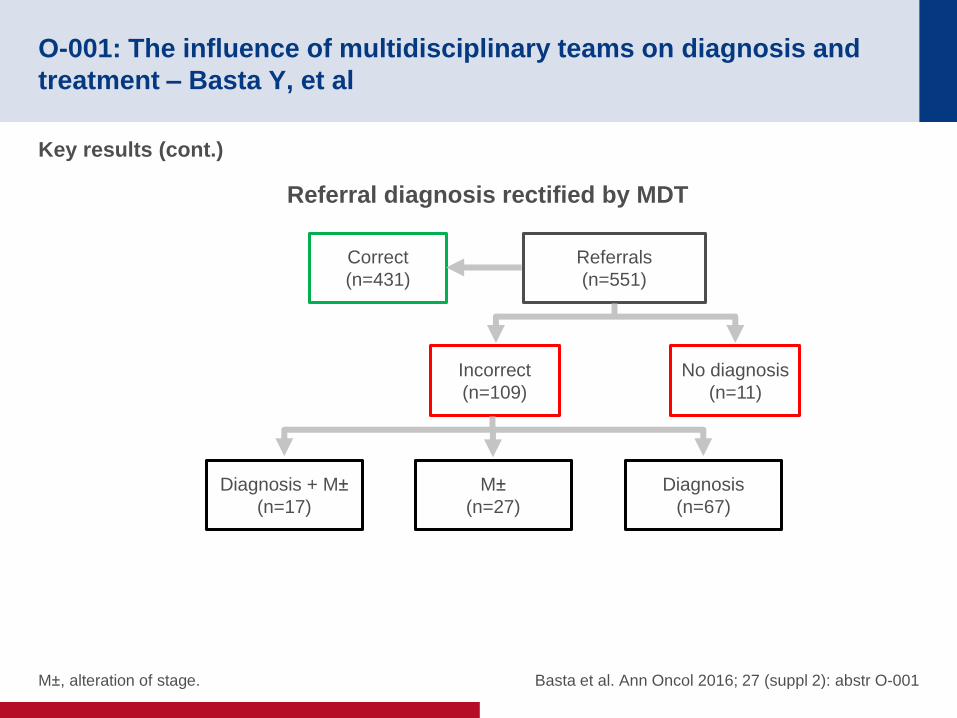
Key results (cont.)
M±, alteration of stage. Basta et al. Ann Oncol 2016; 27 (suppl 2): abstr O-001
Correct
(n=431)
Referrals
(n=551)
Incorrect
(n=109)
No diagnosis
(n=11)
Diagnosis + M±
(n=17)
M±
(n=27)
Diagnosis
(n=67)
Referral diagnosis rectified by MDT
O-001: The influence of multidisciplinary teams on diagnosis and
treatment – Basta Y, et al
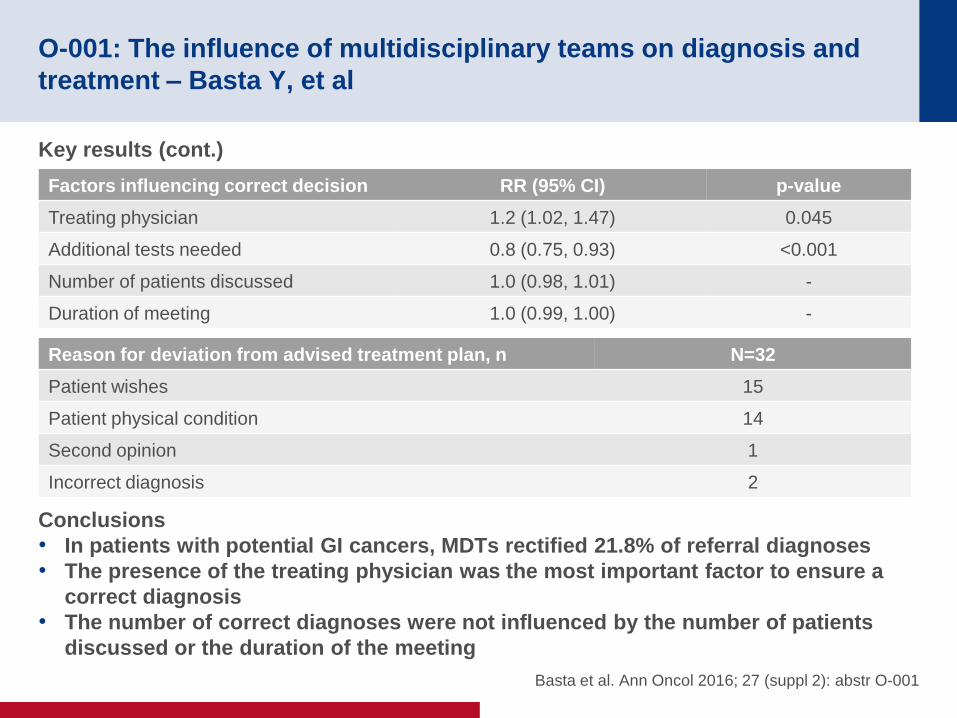
Key results (cont.)
Conclusions
• In patients with potential GI cancers, MDTs rectified 21.8% of referral diagnoses
• The presence of the treating physician was the most important factor to ensure a
correct diagnosis
• The number of correct diagnoses were not influenced by the number of patients
discussed or the duration of the meeting
Basta et al. Ann Oncol 2016; 27 (suppl 2): abstr O-001
Factors influencing correct decision RR (95% CI) p-value
Treating physician 1.2 (1.02, 1.47) 0.045
Additional tests needed 0.8 (0.75, 0.93) <0.001
Number of patients discussed 1.0 (0.98, 1.01) -
Duration of meeting 1.0 (0.99, 1.00) -
Reason for deviation from advised treatment plan, n N=32
Patient wishes 15
Patient physical condition 14
Second opinion 1
Incorrect diagnosis 2