Ghana technical note_cassava_en_feb2013
36
ANALYSIS OF INCENTIVES AND DISINCENTIVES FOR CASSAVA IN GHANA Draft Version JANUARY 2013
-
Upload
herbert-asare -
Category
Business
-
view
281 -
download
1
Transcript of Ghana technical note_cassava_en_feb2013

ANALYSIS OF INCENTIVES AND DISINCENTIVES FOR CASSAVA IN GHANA
Draft Version
JANUARY 2013

This technical note is a product of the Monitoring African Food and Agricultural Policies project (MAFAP). It is a technical document intended primarily for internal use as background for the eventual MAFAP Country Report. This technical note may be updated as new data becomes available.
MAFAP is implemented by the Food and Agriculture Organization of the United Nations (FAO) in collaboration with the Organisation for Economic Co-operation and Development (OECD) and national partners in participating countries. It is financially supported by the Bill and Melinda Gates Foundation, the United States Agency for International Development (USAID), and FAO.
The analysis presented in this document is the result of the partnerships established in the context of the MAFAP project with governments of participating countries and a variety of national institutions.
For more information: www.fao.org/mafap
Suggested citation:
Angelucci F., 2013. Analysis of incentives and disincentives for cassava in Ghana. Technical notes series, MAFAP, FAO, Rome.
© FAO 2013
FAO encourages the use, reproduction and dissemination of material in this information product. Except where otherwise indicated, material may be copied, downloaded and printed for private study, research and teaching purposes, or for use in non-commercial products or services, provided that appropriate acknowledgement of FAO as the source and copyright holder is given and that FAO’s endorsement of users’ views, products or services is not implied in any way.
All requests for translation and adaptation rights, and for resale and other commercial use rights should be made via www.fao.org/contact-us/licence-request or addressed to [email protected].
FAO information products are available on the FAO website (www.fao.org/publications) and can be purchased through [email protected].
2

SUMMARY OF THE NOTE Product: Cassava Period analyzed: 2005 – 2010 Trade status: Export in all years Cassava is a thinly traded commodity. Exports of dried chips stopped completely in year
2007. Total production from 2,717,000tons in 1990 to 13,504,100 tons in 2010. Cassava is mainly used for household consumption. Only a small share is marketed either in
the form of fresh roots, granulated cassava (gari) or flour. Important commodity for the country’s food security No relevant specific policy intervention was implemented in Ghana apart from the
Presidential Special Initiative (PSI) aiming at developing starch production from cassava.
The observed Nominal Rate of Protection (NRP, green line) indicates that cassava farmers have received disincentives under the prevailing cost structure in the value chain. The adjusted NRP (blue line) captures the effects of market inefficiencies on farmers. The area in red shows the cost that these inefficiencies represent for producers.
Our results show that disincentives arise from 1) levies and taxation, and 2) excessive transport costs.
Notwithstanding the disincentives, production has increased in most years due to high accessibility to seeds and technical assistance, as well as the farm input subsidy programme.
Actions to be taken to reduce disincentives could include: 1) carrying out a review of existing taxes, duties and levies; 2) undertake a thorough cost benefit analysis to assess the profitability of value added processing for cassava.
-70%
-60%
-50%
-40%
-30%
-20%
-10%
0%
10%
20%
2005 2006 2007 2008 2009 2010
Disin
cent
ives
In
cent
ives
Observed NRP at farm gate Adjusted NRP at farm gate
3

CONTENTS
SUMMARY OF THE NOTE .......................................................................................................................... 3
CONTENTS ................................................................................................................................................ 4
PURPOSE OF THE NOTE ............................................................................................................................ 5
COMMODITY CONTEXT ............................................................................................................................ 6
Production ................................................................................................................................................... 6
Consumption/Utilization ............................................................................................................................. 8
Marketing and Trade ................................................................................................................................. 10
Description of the Value Chain and Processing......................................................................................... 14
Policy Decisions and Measures ................................................................................................................. 17
DATA REQUIREMENTS, DESCRIPTION AND CALCULATION OF INDICATORS ..........................................19
TRADE STATUS OF THE PRODUCTS ........................................................................................................... 19
BENCHMARK PRICES .................................................................................................................................. 20
DOMESTIC PRICES ..................................................................................................................................... 21
EXCHANGE RATES ...................................................................................................................................... 21
ACCESS COSTS ........................................................................................................................................... 22
EXTERNALITIES .......................................................................................................................................... 24
BUDGET AND OTHER TRANSFERS ............................................................................................................. 24
QUALITY AND QUANTITY ADJUSTMENTS .................................................................................................. 24
CALCULATION OF INDICATORS .................................................................................................................. 25
INTERPRETATION OF THE INDICATORS ..................................................................................................29
PRELIMINARY CONCLUSIONS AND RECOMMENDATIONS .....................................................................31
MAIN MESSAGE ......................................................................................................................................... 31
PRELIMINARY RECOMMENDATIONS ......................................................................................................... 31
LIMITATIONS ............................................................................................................................................. 32
FURTHER INVESTIGATION AND RESEARCH ............................................................................................... 32
BIBLIOGRAPHY ........................................................................................................................................33
ANNEX I: Methodology Used ..................................................................................................................34
ANNEX II: Data and calculations used in the analysis ............................................................................35
4

PURPOSE OF THE NOTE This technical note aims to describe the market incentives and disincentives for Cassava in Ghana. The note is a technical document and serves as input for the MAFAP Country Report.
For this purpose, yearly averages of farm gate and wholesale prices are compared with reference prices calculated on the basis of the price of the commodity in the international market. The price gaps between the reference prices and the prices along the value chain indicate to which extent incentives (positive gaps) or disincentives (negative gaps) are present at farm gate and wholesale level. In relative terms, the price gaps are expressed as Nominal Rates of Protection. These key indicators are used by MAFAP to highlight the effects of policy and market development gaps on prices.
The note starts with a brief review of the production, consumption, trade and policies affecting the commodity and then provides a detailed description of how the key components of the price analysis have been obtained. The MAFAP indicators are then calculated with these data and interpreted in the light of existing policies and market characteristics. The analysis that has been carried out is commodity and country specific and covers the period 2005-2010. The indicators have been calculated using available data from different sources for this period and are described in Part 0.
The outcomes of this analysis can be used by those stakeholders involved in policy-making for the food and agricultural sector. They can also serve as input for evidence-based policy dialogue at country or regional level.
This technical note is not to be interpreted as an analysis of the value chain or detailed description of production, consumption or trade patterns. All information related to these areas is presented merely to provide background on the commodity under review, help understand major trends and facilitate the interpretation of the indicators.
All information is preliminary and still subject to review and validation.
5

COMMODITY CONTEXT Cassava is a starchy root crop. The edible parts are constituted by the tuberous root and the leaves. In Ghana cassava leaves do not have a market value since they are not consumed as a vegetable such as in Congo or Tanzania. The root part may vary significantly in size from 15 to 100 cm as well as in terms of weight from 0.5 to 2.0 kg. Cassava can be considered as a primary food security crop in Africa due to its resistance to drought and plant disease, flexible planting and harvesting cycles. Cassava can remain in the field up to around 18 months (Meridian Institute, 2009). However, late harvesting might entail high opportunity costs as the quality and starchy content of the roots tends to diminish with time.
In Africa, cassava is cultivated in small farms and often in fields which are left aside as fallow or marginal areas. Sub-Saharan countries are the main producers of cassava all together accounting for 62 percent of world production. However, Thailand thanks to its highly developed processing industry is the leading world exporter of dried cassava chips mainly shipped to Europe and China as an ingredient for animal feed (Meridian Institute, 2009; FAO, 2002).
African countries are still suffering from poorly developed post-harvest systems and processing technologies which in the case of cassava need to be particularly effective and timely given the high perishability of the fresh roots and the presence of cyanogenic compounds in the cassava roots. Fresh roots need to be processed within 48 hours from harvest. Their deterioration can be delayed through special post-harvest treatments such as waxing or storage in plastic bags after fungicidal treatment. The level of cyanogenic glucosides is controlled through specific water treatments (Meridian Institute, 2009). Available data shows that up to 34 percent of the cassava produced in Ghana is lost along the chain (MOFA, 2009).
The main cassava specific policy intervention that was implemented in Ghana is the Presidential Special Initiative (PSI) aiming at developing starch production from cassava by means of establishing a starch processing plant. The PSI in Ghana is one of similar initiatives undertaken in other cassava producing countries, supported by the NEPAD’s Pan-African Cassava Initiative (NPACI) launched in January 2004.
Ghana Agricultural Policy gives particular attention to the development of the cassava sector and the intensification of industrial processing to increase the value added from cassava. As a consequence, cassava is one of the priority staple crops as defined in FASDEP II together with maize, rice, yam and cowpea. However, apart from the Presidential Special Initiative, no specific policy measure has been adopted to boost the sector yet.
Production Ghana is the 6th world producer of cassava in terms of value. Ghana’s ranking remained unchanged over the period of analysis 2005-2010 (Figure 1).
6

Figure 1: World top ten producers of cassava in 2010 (‘000 USD, MT)
Source: FAOSTAT
Cassava constitutes 22 percent of Ghana’s agricultural GDP and one of Ghana’s main staple crops with an annual production above 10 million metric tonnes in the last decade. In terms of area harvested, cassava is now the second largest crop as it has been recently superseded by maize (Figure 2).
Yields show a slight increase starting from 2008 up to 15 MT per hectare in 2010 thanks to the introduction of high yielding and disease resistant varieties. However, the level of average yields in Ghana is well below the achievable yield of around 28 MT as estimated by the Ministry of Agriculture (2010).
Figure 2: Cassava production and area planted in Ghana, 1990-2010
Source: FAOSTAT
0
500000
1000000
1500000
2000000
2500000
3000000
3500000
4000000
4500000
0
5000000
10000000
15000000
20000000
25000000
30000000
35000000
40000000
MT
1000 $US
0
100,000
200,000
300,000
400,000
500,000
600,000
700,000
800,000
900,000
1,000,000
0
2,000,000
4,000,000
6,000,000
8,000,000
10,000,000
12,000,000
14,000,000
16,000,000
1990
1991
1992
1993
1994
1995
1996
1997
1998
1999
2000
2001
2002
2003
2004
2005
2006
2007
2008
2009
2010
Production (tonnes)
7

Figure 3: Cassava yield per hectare in Ghana (1990/2010)
Source: FAOSTAT, MOFA (data from FAOSTAT are consistent with MOFA data for production, yields and area
harvested)
Apart from the two northern regions of Ghana, Upper East and Upper West regions, cassava is cultivated in all eight regions with a prevalence of the Eastern and Central regions (Figure 3).
Cassava is generally intercropped with yams, maize or beans. However the dominants crop portfolios consist in a combination of yam and cassava (FAO, 2002).
Figure 4: Ghana Cassava production by Region, 2010
Source: MOFA
Consumption/Utilization Cassava is the first crop in terms of calories intake and per capita consumption in Ghana. According to the latest Food Balance Sheet by FAOSTAT referring to year 2007, per capita daily intake is 551
0.00
2.00
4.00
6.00
8.00
10.00
12.00
14.00
16.00
18.0019
9019
9119
9219
9319
9419
9519
9619
9719
9819
9920
0020
0120
0220
0320
0420
0520
0620
0720
0820
0920
10
Cassava yield (tonne/ha)
Yield (Ton/Ha)
BRONG AHAFO 20%
NORTHERN 8%
EASTERN 27%
UPPER WEST 0%
ASHANTI 14%
VOLTA 11%
WESTERN 5%
CENTRAL 14%
GREATER ACCRA 1%
UPPER EAST 0%
Cassava production per region
8

grams which accounts for around 26 percent of total per capita daily intake. In terms of calories, cassava consumption per day per person provides 599 kcal (20 percent of total daily calories’ intake).
The form under which cassava is consumed varies a lot across different African countries. In Ghana, cassava is employed to produce the following products (Ugwu and Ay, 1992):
1. Cooked fresh roots (that include pounded fresh cassava, known as fufu in Ghana); 2. Flour (fermented and un-fermented); 3. Granulated roasted cassava (known as gari); 4. Fermented pastes (known as agbelima); 5. Sedimented starches; 6. Bio-ethanol.
However, Ghana’s most popular ways of consuming cassava are fufu from fresh roots, gari and flour as well as starch production for the processing industry. Cassava is consumed in all of the ten administrative regions of the country (World Bank, 2010).
Figure 5: Ghana cassava consumption per capita, 2000-2007 (kg/year)
Source: FAOSTAT Food Balance Sheets
The picture emerging from the cassava balance sheet provided by the Ministry of Food and Agriculture (Table 1) confirms the high level of self-sufficiency that Ghana achieves with reference to cassava for human consumption. About 85 percent of production is eaten as food with the remaining being processed into dry chips for export and 'gari' for local consumption (IITA, 2011 and Ghana Customs Authority). Up to 2008, part of the cassava was used for starch production. However, figures about the cassava devoted to starch production are not available.
570
580
590
600
610
620
630
640
650
660
2000 2001 2002 2003 2004 2005 2006 2007
Cassava
Cassava
9

Table 1: Domestic Food Supply and Demand of cassava (2005 -2008), ‘000 Mt 2005 2006 2007 2008
Total Domestic Production 9,739.0 9,638.0 10,217.9 10,321.0
Production Available for Human Consumption*
6,817.0 6,746.6 7,153.0 7,224.7
Estimated National Consumption* 3,186.0 3,346.0 3,486.1 3,576.3
Deficit/Surplus ('000 MT) 3,632.0 3,400.6 3,666.4 3,648.4
Source: MOFA, SRID * 70 percent of domestic production for cassava. Livestock feed, wastage and seed account for the discount
Marketing and Trade Cassava for human consumption: fresh roots and gari
The acquisition of mechanical graters during the last two decades contributed to an increase in the supply of gari which thanks to its convenience is one of the main cassava derived products consumed in urban centers (Nweke, 2004).
Processing of cassava into gari is one of the most promising value adding activities given the high demand, and income elasticity which results in particularly favorable prices as opposed to fresh roots.
10

Figure 6: Cassava market price dynamics for fresh roots and gari (GHc/tonne)
Source: MOFA, SRID
Trade figures do not take into account gari or cassava flour which are exported to neighboring countries, such as Togo or Cote d’Ivoire, mostly on an informal basis.
Trade data is only available with respect to dried cassava for animal feed and starch. In both cases, there are significant inconsistencies across sources. Below data extracted from FAOSTAT and UN Comtrade are presented while extremely scattered information on trade flows for either dried cassava and cassava starch is available on the Global Trade Atlas.
Dried cassava
On both FAOSTAT and UN Comtrade there are no records on imports of dried cassava and 2008 is the only year when both sources depict similar figures (Table 2).
0
200
400
600
800
1000
1200Ja
n-05
Apr-
05
Jul-0
5
Oct
-05
Jan-
06
Apr-
06
Jul-0
6
Oct
-06
Jan-
07
Apr-
07
Jul-0
7
Oct
-07
Jan-
08
Apr-
08
Jul-0
8
Oct
-08
Jan-
09
Apr-
09
Jul-0
9
Oct
-09
Jan-
10
Apr-
10
Jul-1
0
Oct
-10
Accra cassava fresh roots wholesale(GHc/Ton)
Accra wholesale price gari (GHc/Ton)
Ejura farm gate price cassava roots(GHc/Ton)
11

Table 2: Ghana, dried cassava trade flows (USD, tonne) FAOSTAT
Cassava Dried 2005 2006 2007 2008 2009 2010
Export Quantity (tonne) 3 450 5 690 3 592 27 27 NA
Export Value (USD) 2 960 000 3 500 000 2 400 000 10 000 10 000 NA
UN COMTRADE
Manioc (cassava), fresh or dried, weather or not sliced or in pellets
2005 2006 2007 2008 2009 2010
Export quantity (tonne) 15 49 12 27 NA NA
Export value (USD) 6 720 38 740 7 564 9 684 NA NA Source: FAOSTAT and UNComtrade
Considering the consumption patterns and the level of domestic supply, it can be concluded that the absence of import flows for dried cassava is simply due to the fact that Ghana is not formally importing cassava. On the contrary, the high level of self-sufficiency justifies the government strategy aiming at promoting exports of cassava derived products, mainly starches and dried chips.
Dried cassava is mainly exported to the US, UK, Canada and Gambia (Figure 7).
Figure 7: Main importers of dried cassava from Ghana (average quantities 2005/2008, %)
Source: UNComtrade
Starch
A slightly higher degree of consistency between FAOSTAT and UNComtrade can be found in the data concerning starch trade flows which however appear negligible if compared to exports of dried cassava (Table 3).
USA 40%
United Kingdom
16% Germany
6%
Belgium 3%
Areas, nes 0%
Netherlands 0%
Italy 1%
Gambia 20%
Canada 14%
Egypt 0%
Main importers of dried cassava from Ghana (average quantities 2005-2008)
USA
United Kingdom
Germany
Belgium
Areas, nes
Netherlands
Italy
Gambia
Canada
12
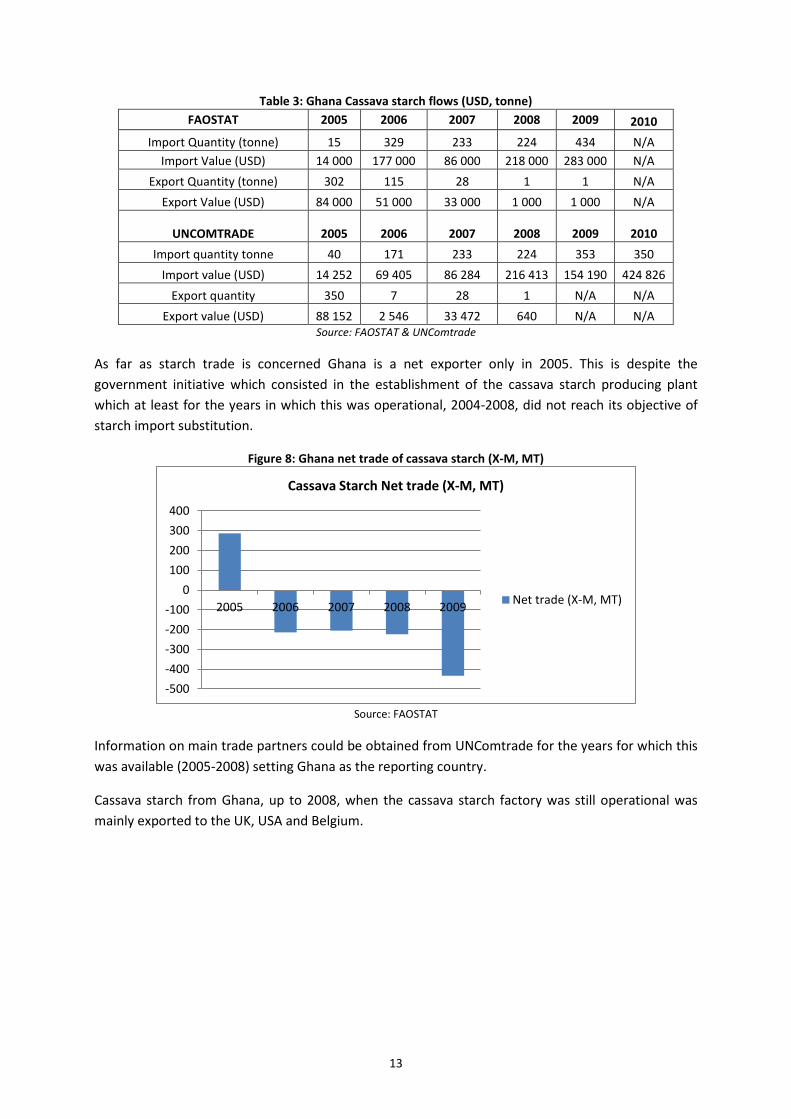
Table 3: Ghana Cassava starch flows (USD, tonne) FAOSTAT 2005 2006 2007 2008 2009 2010
Import Quantity (tonne) 15 329 233 224 434 N/A Import Value (USD) 14 000 177 000 86 000 218 000 283 000 N/A
Export Quantity (tonne) 302 115 28 1 1 N/A Export Value (USD) 84 000 51 000 33 000 1 000 1 000 N/A
UNCOMTRADE 2005 2006 2007 2008 2009 2010 Import quantity tonne 40 171 233 224 353 350
Import value (USD) 14 252 69 405 86 284 216 413 154 190 424 826 Export quantity 350 7 28 1 N/A N/A
Export value (USD) 88 152 2 546 33 472 640 N/A N/A Source: FAOSTAT & UNComtrade
As far as starch trade is concerned Ghana is a net exporter only in 2005. This is despite the government initiative which consisted in the establishment of the cassava starch producing plant which at least for the years in which this was operational, 2004-2008, did not reach its objective of starch import substitution.
Figure 8: Ghana net trade of cassava starch (X-M, MT)
Source: FAOSTAT
Information on main trade partners could be obtained from UNComtrade for the years for which this was available (2005-2008) setting Ghana as the reporting country.
Cassava starch from Ghana, up to 2008, when the cassava starch factory was still operational was mainly exported to the UK, USA and Belgium.
-500-400-300-200-100
0100200300400
2005 2006 2007 2008 2009
Cassava Starch Net trade (X-M, MT)
Net trade (X-M, MT)
13

Figure 9: Main importers of cassava starch from Ghana (average quantities 2005/2008, %)
Source: UNComtrade
The share of exports of cassava on total cassava production is limited. The share remains unchanged if exports of starch, converted in cassava fresh tubers equivalent are included1 (Table 4).
Table 4: Cassava production, import and export in Ghana, MT (2005-2009)
2005 2006 2007 2008 2009 2010
Production tonne 9 567 000 9 638 000 10 217 900 11 351 100 12 230 600 13 504 100
I. Export quantity of dried cassava (tonne) 3 450 5 690 3 592 27 27 N/A
II. Export quantity of starch in cassava tubers
equivalent (tonne) 1 661 632.5 154 5.5 5.5 N/A
Exports of cassava (I+II) as a % of production 0.0534% 0.0656% 0.0367% 0.0003% 0.0003% N/A
N/A = data not available. Source: FAOSTAT, 2012
Description of the Value Chain and Processing Ghana’s cassava value chain is still in its infancy (WB, 2009). However, nascent growth opportunities can be identified with reference to different cassava derived products.
1 The conversion factor from cassava tubers to starch is 5.5:1. Meaning 5.5 tonnes of cassava tubers are needed to produce a ton of starch (IITA, 1994).
Costa Rica 6% Lithuania
3% Senegal 3%
South Africa 8%
United Kingdom 34% USA
26%
Switzerland 1%
Belgium 17%
Lebanon 2%
Netherlands 0%
Main importers of cassava starch from Ghana (2005-2008, %)
Costa Rica
Denmark
Germany
Lithuania
Senegal
South Africa
United Kingdom
USA
Switzerland
Belgium
14

In addition to the production and marketing of fresh roots there are at least three different supply chains for cassava depending on the type of end product: (i) gari and cassava flour; (ii) starch and (iii) dried chips for export. There also seems to be some bio-ethanol production for which no updated information is available.
Gari
With the introduction of mechanical graters to prepare gari in the late 90’s, cassava is increasingly being produced and processed as a cash crop for urban consumption in Ghana.
The largest food processing enterprises, whose products include gari and cassava flour, employ between 20 and 50 workers. These enterprises had modernized the traditional processing technologies adopting better manufacturing processes in production. The distinguishing characteristics are the packaging materials with the appropriate labels and the orientation to the export market. These enterprises operate with generic technologies which enable them process a range of commodities such as plantain, maize and legumes and hence diversify their risk across a wider number of commodities.
The upgrade of processing technologies in Ghana was possible also thanks to the public/private partnerships that are in place between private investors and institutions engaged in business promotion and agro-industrial research such as the Food Research Institute (FRI) of the Council for Scientific and Industrial Research (CSIR) (Essegbey, 2008).
The wide spreading of mechanical graters for gari has placed Ghana as one of the main producers in the West Africa region attracting traders from the sub-region. The better prices that farmers get for gari as opposed to chips are causing a reduction in farmers’ supplies of chips (FAO 2002).
Starch
As mentioned earlier, the production of cassava for industrial starch came under the Presidential Special Initiative (PSI) on Cassava Starch. It was the goal of the government to move Ghana into the club of nations producing industrial starch for the global market.
To achieve this, the concept of Corporate Village Enterprise (COVE) by which a limited liability company whose shareholders are the farmers and strategic investors, was considered to be the best approach. To facilitate the sustainable production of cassava for the Ayensu Starch Company ASCO, established in 2004, the cassava farmers were organized into an association and assisted to cultivate large acreages. Contracts were signed between the farmers and the company. Apparently there was an effort to orientate the farmers towards cash crop production of the commodity. But unlike cocoa, cassava is also a food crop and as such has alternative market outlets. Hence, apart from the industrial raw material market, and depending on the respective price relativities, farmers might choose to sell or not sell to the ASCO factory. This kind of duality in the marketing of cassava has led to problems both for the supply and demand sides.
On the demand side, the factory was closed in January 2008 due to the impossibility to operate at its full capacity as farmers ‘supplies of fresh roots reduced. On the supply side the variety being produced for the starch industry had higher starch content and therefore not very suitable for traditional processing. Buyers for traditional processing therefore paid lower prices for the produce.
15

Clearly the organizational innovation of contracting farmers to produce cassava as an industrial raw material had not been very successful.
Chips
Ghana started to export chips for animal feed to Europe in 1994 when the EEC quota (140 000 MT in 1994) was given to African countries up to 1995. Companies have introduced quality standards, such as 12-14 percent m.c., minimum 70 percent starch, and composition free of pests, extraneous material and aflatoxin.
Today, mechanized cassava processing is a fairly well established activity given the presence of several cassava processing plants in the country mainly in the regions of Brong Ahafo, Ashanti and Eastern Region in proximity of main producing areas. The establishment of cassava processing industry is in combination with the appearance of export-driven large-scale farms. Given the higher transport costs for raw fresh roots the large majority of farmers produces chips through on-farm processing either using chipping machines or manually. In the latter case the cost of labour increases significantly.
The fact that the export companies are the sole buyers of cassava chips makes the structure of the cassava chips value chain different from the previously described ones as it is the company itself which sets up the chipping/buying centers in the producing districts.
Hence, in the case of cassava chips for the export market there is no wholesale market as it is the exporter who deals directly with the thousands of small farmers and small scale processors to gather economically viable volumes of chips2 for exports. The achievement of a certain volume of chips to be exported is also essential to make internal transport costs affordable for the exporters.
2 In those cases where farmers are selling fresh cassava roots for chipping the export company provides transport to the farmer to the buying center at a discounted rate depending on the volumes of chips that will be produced.
16

Figure 10: The Cassava Value Chain in Ghana
Source: Essegbey, 2009
Policy Decisions and Measures Other than trade measures applied to cassava chips’ exports there are no specific policies in place which affect the cassava sector in particular. The Presidential Support Initiative aimed at developing the cassava starch industry was not very successful and we are not aware of ongoing or planned interventions aimed at revamping the starch industry. The main agricultural policy documents, FASDEP II and METASIP set a range of policy objectives for the development of the cassava sector against which no concrete action has been planned in the near future (See ANNEX I: Methodology Used for further details)
The Presidential Support Initiative (PSI) for starch production from cassava
Several problems confronted the implementation of the PSI on cassava starch. The set up of the starch processing plant was not preceded by an assessment of the processing potential which was defined without considering the competition of other cassava products and hence the willingness and profitability for the farmers to supply the processing plant. Main issues raised by the farmers are: low price per metric tonne of fresh cassava, non-fulfillment of promises made to farmers before implementation in terms of upgrading of feeder rural roads, inadequate extension services, difficulties in transporting fresh cassava from the farms to the factory.
These problems led to the under-utilization and eventual shut down of the model cassava processing factory in 2008.
Trade Policies
Cassava chips attract the following duties and taxes. Information on duties and taxes is not available for all the years under analysis and will have to be further investigated with the Ghana Customs Authority.
17

Table 5: Duties and taxes on cassava chips in Ghana (%) 2005 2006 2007 2008 2009 2010
Export tax N/A N/A 20% 20% 20% N/A Import duty N/A N/A 20% 20% 20% N/A
Source: WITS
Market stabilization mechanisms in importing countries
The decline in demand of cassava chips in Europe can also be attributed to the level of intervention prices for feed grains in the European Union which favors the use of domestic grains (Henry and Gottret, 1995; USDA GAIN Report, 2012;
EU legislation also allows for special measures in addition to intervention to be taken to support the market for grains in time of crisis. These measures would take place on an ad hoc basis and be proposed by the European Commission and decided by the Member States at the Management Committee. (USDA GAIN Report, 2012).
18

DATA REQUIREMENTS, DESCRIPTION AND CALCULATION OF INDICATORS In order to calculate the indicators necessary for estimating market incentives and disincentives (NRP, NRA) and the market development gap, data on prices and costs are required. These have been collected and are presented and analyzed below.
TRADE STATUS OF THE PRODUCTS
Given the negligible amounts of cassava traded under the period under analysis as well as the unavailability of information on trade flows with neighboring countries for cassava flour or gari, cassava is considered as a non-traded commodity for the period under review.
The analysis of price incentives and disincentives will be undertaken with reference to dried cassava chips, which is the main exported item.
Ghana exports of dried cassava dropped significantly in 2008 and 2009. This can be explained with the increase of domestic demand for cassava during the soaring food prices biennium. Cassava starch exports dropped as well in those years, due to the shutdown of the starch processing facility set up by the government under the Presidential Initiative, and consequential re-direction of cassava for domestic human consumption. The unavailability of data on cassava imports for the whole period under analysis does not allow for a clear understanding of the trade status for dried cassava especially during those years when exports are particularly negligible.
Further verification was done by looking at trade flows of the main cassava producing and neighboring countries in Africa, namely Nigeria and the Democratic Republic of Congo as well as main world cassava exporters, Thailand and Vietnam. As far as dried cassava is concerned, none of the analyzed countries shows evidence of export flows directed to Ghana.
Hence, considering the nature of trade flows and the degree of self-sufficiency that Ghana has, it was concluded that Ghana is not importing, at least formally, any dried cassava for the period under analysis.
On the contrary, additional evidence on the existence of trade flows between Ghana and major recipient countries of cassava chips is corroborated by records on imported cassava chips to the USA and UK during the whole period of analysis (Table 7). However, since some minor exports have taken place for dried cassava, cassava will be treated as an export for the calculation of the market incentives and disincentives.
Table 6: Ghana exports and imports of dried cassava (tonne) Cassava Dried 2005 2006 2007 2008 2009 2010
Export Quantity (tonne) 3,450 5,690 3,592 27 27 NA
Import Quantity (tonne) N/A N/A N/A N/A N/A N/A Source: FAOSTAT, 2012
19

Table 7: Imported quantities of dried cassava from Ghana by the US and the UK as reporting countries (tonne)
2005 2006 2007 2008 2009 2010
UK: Imported quantity (tonne) 80.00 192.12 193.81 146.32 260.76 226.48
USA: Imported quantity (tonne) 844.57 989.51 848.36 901.53 1,318.81 1,150.83
TOTAL 924.57 1,181.63 1,042.17 1,047.85 1,579.57 1,377.31 Source: UNComtrade
BENCHMARK PRICES Information on dried cassava exports of Ghana is only available on FAOSTAT for the period 2005-2009. On the other hand, UNComtrade database allows for the identification of main trade partners of Ghana at least for years 2005-2008. During this period Ghana exports of dried cassava are directed mainly to the US and the UK.
Once main partners were identified, data on imported volumes and values were double-checked by extracting main destination countries data on imported volumes and values of dried chips from Ghana. This allowed for the gathering of figures for year 2010 as well.
Since the USA is the main recipient country, Ghana FOB prices were obtained from USA CIF unit values of cassava by deducting the cost of freight and insurance. The cost of freight and insurance was computed as the difference between the CIF and the FOB prices for roots and tubers3, cassava time series was incomplete, traded between USA and Ghana (Table 8).
Table 8: Estimated FOB prices for Ghana dried cassava USD/tonne
USA CIF prices for imported cassava
from Ghana
Cost of insurance and freight for roots and
tubers traded between USA and Ghana
Ghana FOB prices for exported cassava to
the USA 2005 792.73 201.70 591.03 2006 1024.18 448.70 575.48 2007 1103.2 407.30 695.90 2008 1073.95 409.40 664.55 2009 994.35 344.30 650.05 2010 1045.87 324.90 720.97
Source: own calculations based on UNComtrade data
The estimated FOB prices appear to be particularly high hence they were compared to Thailand FOB prices. It appears that also FOB unit values of cassava chips from Thailand, directed to the USA or European countries are particularly high as opposed to FOB prices to Asia and China. This can be explained by the high freight costs that characterize international trade of cassava.
Adjusted benchmark price
No adjustment to the benchmark price was made.
3 Manioc, arrowroot, salep, Jerusalem artichokes, sweet potatoes and similar roots and tubers with high starch or inulin content, fresh, chilled, frozen or dried, whether or not sliced or in the form of pellets; sago pith.
20

DOMESTIC PRICES As discussed in section D above the cassava chips’ value chain has a different structure if compared to cassava derived products for local consumption as cassava chips are purchased by the exporters directly from the farmers and are not being traded on the domestic wholesale markets.
As far as cassava chips production and marketing are concerned, the choice of the most representative commodity pattern was based on information about operations of one of the main exporters of cassava chips in Ghana, the Trade and Commodity Group (TGC), which buys cassava chips and roots in the Ashanti, Volta and Brong Ahafo regions and then transports the chips to the port of Tema for export.
Farm gate prices used for the analysis are those of cassava fresh roots in one of the main producing areas in the Ashanti region, Ejura.
Farm gate prices of fresh roots are collected on a monthly basis by the Ministry of Agriculture and refer to a 91 kg bag. Annual averages for 1 tonne of fresh cassava roots were calculated and used for the analysis. With respect to year 2009, monthly data on farm gate prices in Ejura are available up to April and to obtain the average price for 2009 national averages were used for the missing months May-December 2009.
Although, consultation of the literature on the cassava sector highlighted that most of the farmers prefer to process the cassava into chips to be sold to the exporter, farm gate prices for cassava chips are not available.
This could be attributed to the peculiar structure of the value chain for cassava dried chips which does not entail the marketing of the product on the wholesale market. Wholesale prices are available for another cassava derived product, gari, which as opposed to chips is traded on the domestic market.
Table 9: Farm gate prices of cassava fresh roots in Ejura, Ashanti Region (yearly averages GHC/tonne) 2005 2006 2007 2008 2009 2010 Cassava Fresh Roots (GHc/tonne) 57.14 67.67 66.21 71.70 136.95* 97.07
Source: own calculations based on MOFA, SRID statistics *Estimate
EXCHANGE RATES Ghana has a floating exchange rate regime for its currency, the Ghana cedi. With the 2006 Foreign Exchange Act Ghana shifted away from exchange controls. In July 2007, the national currency was re-denominated by setting 10 000 Cedis to 1 new Ghana cedi. Therefore no adjustment was made to the nominal exchange rate.
Table 10: Exchange rate Ghana Cedis/USD
2005 2006 2007 2008 2009 2010
National currency per US dollar (principal rate, period average) 0.91 0.92 0.94 1.06 1.41 1.43
Source: IMF
21

ACCESS COSTS The choice of not considering wholesale prices in the analysis has also implications on the way access costs have been calculated. These are considered as one leg from the farm gate to the border instead of considering the two sections separately, from the farm gate to the wholesale market and from the wholesale market to the border.
The bad conditions of feeder roads are one of the main issues that hinder cassava profitability. The difficulties in transporting cassava from the farms to the ASCO starch factory was one of the elements that caused the interruption of the business and is also one of the elements that is affecting the cassava chips value chain.
Information on access costs for the cassava sector is very scarce. Access costs were calculated on the basis of research work undertaken by FAO in 2002 which gathered information on costs borne by the cassava chip exporter to collect chips from the farmers, located in the Ashanti region, and take them to the port of Tema.
Table 11: Cassava chips value chain average access costs (USD/tonne) Transport (from village buying centre to district depot) 2.90 Transport (district depot to Tema) 6.00 Operation of village buying centre 1.28 Operation of district depot 3.40 Packaging and Handling 1.99
Source: FAO, 2002
Observed access cost from farm gate to point of competition
As mentioned above, the information available on access costs for cassava chips dates back to 2002. This was updated by applying the GDP price deflator for the whole period starting from 1998 up to 2010 and by converting the figures in GHCedis. Table 12 below shows estimated values for the period 2005-2010. The exporters’ margins were calculated as a share of 5 percent on the FOB price in US dollars drawing from the FAO value chain analysis (2002). The table below shows the estimated access costs.
22

Table 12: Estimates of access costs (2005-2010) currency 2005 2006 2007 2008 2009 2010 Transport (from village buying centre to district depot) USD/tonne 11.86 13.26 15.41 18.53 21.61 25.34 Transport (district depot to Tema) USD/ tonne 24.55 27.43 31.89 38.33 44.70 52.43 Operation of village buying centre USD/ tonne 5.24 5.85 6.80 8.18 9.54 11.18
Operation of district depot USD/ tonne 13.91 15.54 18.07 21.72 25.33 29.71
Packaging and Handling USD/ tonne 8.14 9.10 10.58 12.71 14.83 17.39
Exporters’ margins on FOB (5%) USD/ tonne 30.01 38.54 39.89 40.43 37.32 39.48
Total access costs USD/ tonne 93.71 109.71 122.64 139.90 153.32 175.52
Total access costs GHC/tonne 85.27 100.93 115.28 148.29 216.18 251.00 Source: own calculations based on FAO cassava value chain analysis (Table 11); GDP deflator for Ghana from
1998 to 2010 (IMF, 2012) and exchange rate data (IMF, 2012)
Adjusted access cost from farm gate to point of competition
It is estimated that while production costs for producing chips in Ashanti is 48 percent cheaper than in the Greater Accra Region, the cost of transporting chips from the Brong Ahafo region (where the processing facilities are located) to Tema is 80 percent more expensive than the costs of transporting the chips from Greater Accra to Tema port (Technoserve Ghana, 1994). The distance between Accra and Tema is around 30 km. Accra and Tema are connected by a road which is in good conditions if compared with other internal roads in Ghana. Hence the road between Accra and Tema has been taken as a benchmark which implied an adjustment of the observed transport costs between the Ashanti region and Tema. Table 13 below shows the adjusted access costs where the transport costs were reduced by 80 percent.
23

Table 13: Adjusted access costs (2005-2010)
2005 2006 2007 2008 2009 2010
Adjusted transport costs (USD/tonne) Ashanti region – Tema Port 7.28 8.14 9.46 11.37 13.26 15.55
Operation of village buying centre (USD/tonne) 5.24 5.85 6.80 8.18 9.54 11.18
Operation of district depot (USD/tonne) 13.91 15.54 18.07 21.72 25.33 29.71
Packaging and Handling (USD/tonne) 8.14 9.10 10.58 12.71 14.83 17.39
Exporters' margins on FOB (5%) 30.01 38.54 39.89 40.43 37.32 39.48
Total adjusted access costs 64.58 77.16 84.80 94.41 100.27 113.31
Adjusted access costs Ghana Cedis/tonne 58.77 70.99 79.71 100.08 141.38 162.03
Source own calculations drawing from Technoserve Ghana, 1994
EXTERNALITIES No externalities were considered in our analysis at this stage.
BUDGET AND OTHER TRANSFERS Cassava producers are not benefiting from any specific budget transfer. The fertilizer subsidy programme is irrelevant to cassava as fertilizer is not applied on this crop.
Some credit facility is provided by the exporter to help the farmer face the high labour costs of weeding and harvesting the roots as well as peeling and chipping. However, more detailed information will have to be gathered concerning this aspect.
QUALITY AND QUANTITY ADJUSTMENTS A quantity adjustment was factored in the analysis to account for the transformation of fresh cassava roots into chips between the farm gate and the point of competition. There are many different conversion factors in the literature which depend from the starch and water content of the roots. The most widely used, which was applied in the analysis is 2.5: 1 (IITA, 1998)4.
4 The conversion rate of 2.5: 1 means that 2.5 tonnes of cassava fresh roots are needed to obtain 1 tonne of cassava dried chips.
24

CALCULATION OF INDICATORS The indicators and the calculation methodology used are described in Box 1. A detailed description of the calculations and data requirements is available on the MAFAP website or by clicking here.
Following the discussions above, here is a summary of the main sources and methodological decisions taken for the analysis of price incentives and disincentives for Cassava in Ghana.
Table 14: Summary table for data description in MAFAP technical notes Description
Concept Observed Adjusted
Benchmark price
Estimated FOB unit value calculated from the unit value of imported dried cassava from Ghana to the United States minus: freight and insurance costs calculated as the difference between the CIF and the FOB prices of roots and tubers traded between USA and Ghana.
N.A.
Domestic price at point of competition
The wholesale market price of cassava was not considered in the analysis as cassava chips are not traded on the wholesale market but purchased directly from farmers and exported
N.A.
Domestic price at farm gate
Farm gate prices for fresh cassava roots in Ejura (Ashanti region) except for 2009 which was estimated using national average farm gate prices for fresh roots
N.A.
Exchange rate Annual average of exchange rate as reported by IMF N.A.
Access cost to point of competition
Not applicable. As a consequence of excluding the wholesale stage from the analysis, access costs have been considered in one leg from the farm gate to the border
Access costs to farm gate
Estimated (for the route from the Ashanti region (Ejura to Tema Port) drawing from an FAO cassava value chain analysis undertaken in 1998 using GDP deflator for Ghana for all years from 1998 to 2010
Excessive transport costs were adjusted drawing from indications from a Technoserve Ghana study which estimated transport costs to be excessive by 80% for the same route (Ashanti region-Tema Accra)
QT adjustment
Bor-Wh N.A N.A.
Wh-FG
Based on a conversion factor from cassava fresh roots to cassava dried chips of 2.5: 1(2.5 tonnes of
cassava fresh roots to obtain 1 tonne of dried cassava chips)N.A.
N.A.
QL adjustment Bor-Wh N.A. N.A. Wh-FG N.A. N.A.
25

The data used for the analysis is summarized in the following table:
Table 15: data used for the analysis Year 2005 2006 2007 2008 2009 2010 trade status x x x x x x
DATA Unit Symbol Benchmark Price
Observed USD/TONNE Pb(int$) 591.03 575.48 695.90 664.55 650.05 720.97 Adjusted USD/TONNE Pba
Exchange Rate Observed GHC/USD ERo 0.91 0.92 0.94 1.06 1.41 1.43 Adjusted GHC /USD ERa
Access costs border - point of competition
Observed GHC /TONNE ACowh Adjusted GHC /TONNE ACawh
Domestic price at point of competition GHC /TONNE Pdwh
Access costs point of competition - farm gate
Observed GHC /TONNE ACofg 85.27 100.93 115.28 148.29 216.18 251.00 Adjusted GHC /TONNE ACafg 58.77 70.99 79.71 100.08 141.38 162.03
Farm gate price GHC /TONNE Pdfg 57.14 67.67 66.21 71.70 136.95 97.07 Externalities associated with production GHC /TONNE E
Budget and other product related transfers GHC /TONNE BOT
Quantity conversion factor (border - point of competition) Fraction QTwh
Quality conversion factor (border - point of competition) Fraction QLwh
Quantity conversion factor (point of competition – farm gate) Fraction QTfg 0.40 0.40 0.40 0.40 0.40 0.40 Quality conversion factor (point of competition – farm gate) Fraction QLfg
26

Box 1: MAFAP POLICY INDICATORS MAFAP analysis uses four measures of market price incentives or disincentives. First, are the two observed nominal rates of protection one each at the wholesale and farm level. These compare observed prices to reference prices free from domestic policy interventions.
Reference prices are calculated from a benchmark price such as an import or export price expressed in local currency and brought to the wholesale and farm levels with adjustments for quality, shrinkage and loss, and market access costs.
The Nominal Rates of Protection - observed (NRPo) is the price gap between the domestic market price and the reference price divided by the reference price at both the farm and wholesale levels:
𝑁𝑅𝑃𝑜𝑓𝑔 = (𝑃𝑓𝑔 − 𝑅𝑃𝑜𝑓𝑔) 𝑅𝑃𝑜𝑓𝑔; ⁄ 𝑁𝑅𝑃𝑜𝑤ℎ = (𝑃𝑤ℎ − 𝑅𝑃𝑜𝑤ℎ) 𝑅𝑃𝑜𝑤ℎ; ⁄
The NRPofg captures all trade and domestic policies, as well as other factors which impact on the incentive or disincentive for the farmer. The NRPowh helps identify where incentives and disincentives may be distributed in the commodity market chain.
Second are the Nominal Rates of Protection - adjusted (NRPa) in which the reference prices are adjusted to eliminate distortions found in developing country market supply chains. The equations to estimate the adjusted rates of protection, however, follow the same general pattern:
𝑁𝑅𝑃𝑎𝑓𝑔 = (𝑃𝑓𝑔 − 𝑅𝑃𝑎𝑓𝑔) 𝑅𝑃𝑎𝑓𝑔; ⁄ 𝑁𝑅𝑃𝑎𝑤ℎ = (𝑃𝑤ℎ − 𝑅𝑃𝑎𝑤ℎ) 𝑅𝑃𝑎𝑤ℎ; ⁄
MAFAP analyzes market development gaps caused by market power, exchange rate misalignments, and excessive domestic market costs which added to the NRPo generate the NRPa indicators. Comparison of the different rates of protection identifies where market development gaps can be found and reduced.
With the data described above we obtain the price gaps summarized in Table 16, nominal rates of protection in Table 16 and Market Development Gaps in Table 18 for the period 2005-2010.
Price gaps and NRPs are calculated only at the farm level as the cassava chips value chain does not have an intermediate wholesale market for chips destined to exports. Calculations of the NRA were not possible given the lack of reliable information on the amount of budget transfers to cassava producers throughout the period of analysis.
Table 16: MAFAP price gaps for Cassava in Ghana 2005-2010 (GHC per Mt) 2005 2006 2007 2008 2009 2010
Trade status for the year x x x x x x
Observed price gap at farm gate (72.72) (43.17) (80.17) (61.77) (13.50) (64.33)
Adjusted price gap at farm gate (99.23) (73.11) (115.74) (109.99) (88.29) (153.29)
Source: Own calculations using data as described above.
27

Table 17: MAFAP nominal rates of protection (NRP) for Cassava in Ghana 2005-2010 (%) 2005 2006 2007 2008 2009 2010
Trade status for the year x x x x x x
Observed NRP at farm gate -56.00% -38.95% -54.77% -46.28% -8.97% -39.86%
Adjusted NRP at farm gate -63.46% -51.93% -63.61% -60.54% -39.20% -61.23%
Source: Own calculations using data as described above.
Table 18: MAFAP Market Development Gaps for Cassava in Ghana 2005-2010 (GHC per Mt) 2005 2006 2007 2008 2009 2010
Trade status for the year x x x x x x
International markets gap (IRG) 0 0 0 0 0 Exchange policy gap (ERPG) 0 0 0 0 0
Access costs gap to point of competition (ACGwh)
ND ND ND ND ND
Access costs gap to farm gate (ACGfg) (26.51) (29.94) (35.57) (48.22) (74.79) (88.96) ND: No data available for calculation
Source: Own calculations using data as described above.
28

INTERPRETATION OF THE INDICATORS The indicators generated from the price incentives and disincentives analysis can be considered representative of a small portion of the cassava sector which only covers cassava chips for exports.
Price gaps at the farm gate are negative for all years under review. There seems to be a decrease in the disincentives up to year 2009 to rise again in 2010. However, while the decrease in 2009 might be attributable to the fact that farm gate prices had to be estimated using the national average which generated a higher producer price as opposed to all other years under analysis, in 2010 there is an unprecedented negative gap.
Adjusted price gaps follow a similar trend and are higher that the observed due to the high transaction costs which are affecting the cassava value chain and the industry of dried chips in particular. The difference between observed and adjusted price gaps is increasing in 2009 and 2010.
This can be attributed to the fact that while prices paid to the producers are increasing, access costs and transport costs in particular are not becoming more efficient.
Figure 11: Observed and Adjusted Price Gaps for cassava in Ghana (GHC/tonne)
The observed NRPs provide a good indicator of the disincentive at the farmer level of selling cassava to the chip industry because of the low prices and high transport costs.
Disincentives in terms of particularly negative price gaps and higher than the 20 percent export tax which was in place, 2007, 2008 and 2009. However, in 2009 the observed price gap is smaller which again might be due to the fact that 2009 prices at the farm gate level had to be estimated using national averages.
(180.00)
(160.00)
(140.00)
(120.00)
(100.00)
(80.00)
(60.00)
(40.00)
(20.00)
-2005 2006 2007 2008 2009 2010
Observed Price Gap at FarmGate (GHC/Ton)
Adjusted Price Gap at FarmGate (GHC/Ton)
29

Figure 12: Observed and Adjusted Nominal Rate of protection for cassava in Ghana (%)
-70.00%
-60.00%
-50.00%
-40.00%
-30.00%
-20.00%
-10.00%
0.00%2005 2006 2007 2008 2009 2010
Observed Nominal Rate ofProtection at farm Gate (%)
Adjusted Nominal Rate ofProtection at farm Gate (%)
30

PRELIMINARY CONCLUSIONS AND RECOMMENDATIONS
MAIN MESSAGE Results have to be taken with caution as cassava is not traded extensively and estimates on informal trade are unavailable. Nevertheless, the analysis contributed to show the extent to which the dried chips industry is still and increasingly penalized by the high transport costs within Ghana and the low prices that are paid to farmers by the exporters which can be also considered as a consequence of the high infrastructural and processing costs incurred by the processors/ exporters. These aspects together with the presence of protective policies in Europe were highlighted as limiting factors by research on economic viability of chips exports undertaken in the late 90’s early 2000.
The Government of Ghana with the Medium Term Investment Plan has clearly stated its intention to increase value added from crops such as cassava, yam and plantain. In this context the MAFAP methodology could provide elements for a deeper understanding of opportunities and incentives generated by the different cassava derived products both traditional (gari) and innovative products (bio-ethanol and starch). However, to perform this type of analysis we would need more disaggregated data.
Even now, there is a strong incentive for many farmers to produce traditional processed products instead of chips. If the export market continues to falter, this trend is likely to continue.
Collapse of the export market could lead to a dramatic reduction in demand for cassava and a reduction in the price for all processed cassava products. This will limit the beneficial linkages between cassava production and processing and the employment market, erode incomes and reduce expenditure linkages.
PRELIMINARY RECOMMENDATIONS The results of the analysis on cassava dried chips together with the observed favorable prices that other cassava by-products, such as gari, are receiving at least on the wholesale market is an indication of the incentives that producers are receiving from alternative cassava value chains.
The high costs of processing and transporting cassava make exports from Ghana less competitive on the world market. It was estimated that freight charges from Ghana are not globally competitive, especially if compared to Thailand (ranging between USD 35/MT and USD 40/MT, compared with only USD 9/Mt from Thailand).
The high cost of freight has been attributed to inefficient handling at the port in Ghana (FAO, 2002). The improvement of handling procedures at the port together with interventions on road infrastructure is often recalled in policy documents. This analysis showed how the lack of interventions is negatively affecting operations in the cassava chips’ industry and how relevant it is to take action in this area.
Increased transparency on trade flows of traditional cassava products to neighboring countries would contribute to an increased understanding of the potential of cassava products different from chips.
31

LIMITATIONS Prices at farm gate for chips were estimated using the conversion factor from fresh roots to dried chips. More detailed information will need to be collected on prices paid by the exporters to those farmers who are selling chips as well as charges for processing fresh cassava into chips by small processing units at the village level.
Lack of information on formal trade of cassava traditional by-products for human consumption such as gari and fufu limited the understanding of incentives with respect to high value added traditional cassava products which are mainly traded with neighboring countries such as Togo and Cote d’Ivoire and on which freight costs should not be as penalizing as those for shipping chips to Europe or the United States
FURTHER INVESTIGATION AND RESEARCH Further details on the prices paid to the farmers for their on-farm produced cassava chips will be gathered from the exporting company.
The understanding of the determinants of disincentives at the farmer level would be complete if calculations of market incentives and disincentives could be made with reference to traditional products such as gari. This would require the availability of reliable information on the benchmark price for the specific cassava by-product, information on prices paid to farmers and the type of product sold by the farmers, if this is in-country processed gari or fresh roots and the related access costs.
32

BIBLIOGRAPHY Essegbey, George Owosu: Agribusiness Innovation Study. The Ghana Experience. Science and Technology Policy Research Institute (STEPRI-CSIR), 2008
FAO International Trade in Cassava Products. An African Perspective. Prepared by the
Basic Foodstuffs Service (ESCB) of the FAO Commodities and Trade Division. September 2000
Heintz, James, Elements of an Employment Framework
For Poverty Reduction in Ghana Report of a joint ILO/UNDP mission Political Economy Research Institute University of Massachusetts, Amherst
IFAD Proceedings on the validation forum on the Global Cassava Development Strategy. A review of Cassava in Africa with country case studies on Ghana Nigeria, United Republic of Tanzania, Uganda and Benin, IFAD, Rome 2005
Larsen K., Kim R. Theus F. Agribusiness and Innovation Systems in Africa, World Bank, 2009
Meridian Institute, Innovations for Agricultural Value Chains in Africa: Applying Science and Technology to Enhance Cassava, Dairy, and Maize Value Chains. Cassava Value Chain Overview, 2009.
Mitsubishi Institute Study on Measures to Enhance Investment into Agricultural Sector in Africa, Summary Report, 2010
Nweke, Felix New Challenges in the Cassava Transormation in Ghana and Nigeria. IFPRI Discussion Paper no. 118, 2004
Nweke Felix Controlling Cassava Mosaic Virus and Cassava Mealybug in Sub-Saharan Africa IFPRI Discussion Paper 00912 November 2009Ramatu, Al-Hassan and Egyir, Irene “The potential for farm/non-farm linkages in the cassava subsector in Ghana”, FAO 2002.
Westby A. Cassava Utilization, Storage and Small-Scale processing, NRI University of Greenwich, 2002
WFP, Ghana Logistics Capacity Assessment, 2011
33

ANNEX I: Methodology Used A guide to the methodology used by MAFAP can be downloaded from the MAFAP website or by clicking here.
34

ANNEX II: Data and calculations used in the analysis
Name of product CassavaInternational currency USD Local currency GHC
Year 2005 2006 2007 2008 2009 2010DATA Unit Symbol trade status x x x x x x
Benchmark Price1 Observed USD/TON Pb(int$) 591.03 575.48 695.90 664.55 650.05 720.97
1b Adjusted USD/TON Pba
Exchange Rate2 Observed GHC/USD ERo 0.91 0.92 0.94 1.06 1.41 1.43
2b Adjusted GHC/USD ERa 0.91 0.92 0.94 1.06 1.41 1.43 Access costs border - point of competition
3 Observed GHC/TON ACowh
3b Adjusted GHC/TON ACawh
4 Domestic price at point of competition GHC/TON Pdwh
Access costs point of competition - farm gate5 Observed GHC/TON ACofg 85.27 100.93 115.28 148.29 216.18 251.00
5b Adjusted GHC/TON ACafg 58.77 70.99 79.71 100.08 141.38 162.036 Farm gate price GHC/TON Pdfg 57.14 67.67 66.21 71.70 136.95 97.07 7 Externalities associated w ith production GHC/TON E8 Budget and other product related transfers GHC/TON BOT
Quantity conversion factor (border - point of competition) Fraction QTwh
Quality conversion factor (border - point of competition) Fraction QLwh
Quantity conversion factor (point of competition - farm gate) Fraction QTfg 0.40 0.40 0.40 0.40 0.40 0.40 Quality conversion factor (point of competition - farm gate) Fraction QLfg 1.00 1.00 1.00 1.00 1.00 1.00
CALCULATED PRICES Unit Symbol 2005 2006 2007 2008 2009 2010Benchmark price in local currency
9 Observed GHC/TON Pb(loc$) 537.84 529.44 654.15 704.42 916.57 1,030.99 10 Adjusted GHC/TON Pb(loc$)a 537.84 529.44 654.15 704.42 916.57 1,030.99
Reference Price at point of competition11 Observed GHC/TON RPowh 537.84 529.44 654.15 704.42 916.57 1,030.99 12 Adjusted GHC/TON RPawh 537.84 529.44 654.15 704.42 916.57 1,030.99
Reference Price at Farm Gate 13 Observed GHC/TON RPofg 129.86 110.85 146.38 133.47 150.45 161.40 14 Adjusted GHC/TON RPafg 156.37 140.79 181.95 181.69 225.25 250.36
INDICATORS Unit Symbol 2005 2006 2007 2008 2009 2010Price gap at point of competition
15 Observed GHC/TON PGowh (537.84) (529.44) (654.15) (704.42) (916.57) (1,030.99) 16 Adjusted GHC/TON PGawh (537.84) (529.44) (654.15) (704.42) (916.57) (1,030.99)
Price gap at farm gate17 Observed GHC/TON PGofg (72.72) (43.17) (80.17) (61.77) (13.50) (64.33) 18 Adjusted GHC/TON PGafg (99.23) (73.11) (115.74) (109.99) (88.29) (153.29)
Nominal rate of protection at point of competition19 Observed % NRPowh -100.00% -100.00% -100.00% -100.00% -100.00% -100.00%20 Adjusted % NRPawh -100.00% -100.00% -100.00% -100.00% -100.00% -100.00%
Nominal rate of protection at farm gate21 Observed % NRPofg -56.00% -38.95% -54.77% -46.28% -8.97% -39.86%22 Adjusted % NRPafg -63.46% -51.93% -63.61% -60.54% -39.20% -61.23%
Nominal rate of assistance23 Observed % NRAo -56% -0.38947695 -0.54768978 -0.46279568 -0.08973156 -0.3985690824 Adjusted % NRAa -63.46% -51.93% -63.61% -60.54% -39.20% -61.23%
Decomposition of PWAfg Unit Symbol 2005 2006 2007 2008 2009 201025 International markets gap GHC/TON IRG - - - - - - 26 Exchange policy gap GHC/TON ERPG - - - - - - ([2]-[2b])*[1]27 Access costs gap to point of competition GHC/TON ACGwh - - - - - - '28 Access costs gap to farm gate GHC/TON ACGfg (26.51) (29.94) (35.57) (48.22) (74.79) (88.96) [5b]-[5]29 Externality gap GHC/TON EG - - - - - -
Market Development Gap GHC/TON MDG (26.51) (29.94) (35.57) (48.22) (74.79) (88.96) [25]+[26]+[27]+[28]+[29]Market Development Gap % MDG (0.17) (0.21) (0.20) (0.27) (0.33) (0.36) MDG/RPafg
([17]+[8])/[13]([18]+[8])/[14]
Formula
[15]/[11][16]/[12]
[17]/[13][18]/[14]
[4]-[12]
[6]-[13][6]-[14]
(([11]*[QLfg])*[QTfg])-[5](([12]*[QLfg])*[QTfg])-[5b]
Formula
[4]-[11]
[1]*[2b]
[9]-[3][10]-[3]
Formula
[1]*[2]
From PE Analysis
Notes
FOB Price
35