GHANA 2015ierc-publicfiles.s3.amazonaws.com/public/resources/Ghana...GHANA 2015 Early Grade Reading...
173
GHANA 2015 Early Grade Reading Assessment and Early Grade Mathematics Assessment: Report of Findings
Transcript of GHANA 2015ierc-publicfiles.s3.amazonaws.com/public/resources/Ghana...GHANA 2015 Early Grade Reading...

GHANA 2015 Early Grade Reading Assessment
and Early Grade Mathematics Assessment:
Report of Findings


GHANA 2015 Early Grade Reading Assessment and Early Grade Mathematics Assessment: Report of Findings
November 2016
Report prepared by
Ghana Education Service, National Education Assessment Unit
RTI International
Education Assessment and Research Centre
This report was made possible by the support of the American people through the United States Agency for International Development (USAID). The contents of this report are the sole responsibility of RTI International and do not necessarily reflect the views of USAID or the United States Government.
Prepared under the Education Data for Decision Making (EdData II) project, Task Order No. AID-641-BC-13-00001 (RTI Task 21). Submitted to Contracting Officer’s Representative (COR), USAID/Ghana.
RTI International, 3040 Cornwallis Road, Post Office Box 12194, Research Triangle Park, North Carolina 27709-2194, USA. RTI International is a registered trademark and a trade name of Research Triangle Institute.


2015 EGRA and EGMA in Ghana | iii
TABLE OF CONTENTS
Figures ................................................................................................ v
Tables ................................................................................................ vii
Abbreviations ......................................................................................ix
Acknowledgements ............................................................................xi
1 Executive Summary ................................................................ 13
1.1 Overview of EGRA Trends ........................................... 14 1.1.1 Listening Comprehension Subtask ................ 15 1.1.2 Letter-Sound Identification Subtask .............. 15 1.1.3 Nonword Decoding Subtask .......................... 16 1.1.4 Oral Passage Reading Subtask .................... 17 1.1.5 Reading Comprehension Subtask ................. 18
1.2 Overview of EGMA Trends .......................................... 19 1.3 Overview of Findings on Teachers’ Language............. 21 1.4 Overview of Findings from Pupil Interviews ................. 22 1.5 Summary of Conclusions ............................................. 23
2 Introduction ............................................................................. 25
2.1 Primary Education in Ghana ........................................ 25 2.2 Background of the Early Grade Reading and
Mathematics Assessments in Ghana ........................... 26 2.3 Overview of the Early Grade Reading Assessment
Tool and How It Was Adapted for Ghana .................... 27 2.4 Overview of Early Grade Mathematics
Assessment Tool .......................................................... 30 2.5 Pupil Questionnaire ...................................................... 32 2.6 Teacher Questionnaire ................................................. 33 2.7 Dissemination of Results .............................................. 33 2.8 Structure of This Report ............................................... 33 2.9 Sample Design ............................................................. 34
2.9.1 Population of Interest ..................................... 34 2.9.2 Sample Methodology ..................................... 34
2.10 Assessor Training and Pilot Test ................................. 36 2.11 Data Collection ............................................................. 40 2.12 Data Collection Challenges .......................................... 41
3 EGRA Outcomes .................................................................... 42
3.1 Overview of EGRA Trends ........................................... 42

iv | 2015 EGRA and EGMA in Ghana
3.2 EGRA Results by Subtask ........................................... 42 3.2.1 Listening Comprehension Subtask ................ 42 3.2.2 Letter-Sound Identification Subtask .............. 45 3.2.3 Nonword Decoding Subtask .......................... 47 3.2.4 Oral Passage Reading Subtask .................... 50 3.2.5 Reading Comprehension Subtask ................. 54
3.3 What Do We Know about Pupils Who Can Read? ...... 57
4 EGMA Outcomes .................................................................... 59
4.1 Overview of EGMA Trends .......................................... 59 4.2 EGMA Results by Subtask ........................................... 61
4.2.1 Number Identification ..................................... 61 4.2.2 Addition and Subtraction Level 1 ................... 62 4.2.3 Quantity Discrimination .................................. 66 4.2.4 Missing Number ............................................. 67 4.2.5 Addition and Subtraction Level 2 ................... 69 4.2.6 Word Problems .............................................. 71
4.3 EGMA Results by Sex .................................................. 74 4.4 EGMA by Geographic Variations ................................. 74
4.4.1 Urban/Rural ................................................... 74 4.4.2 Regions.......................................................... 75
4.5 What Do We Know about Pupils Who Can Do Mathematics? ............................................................... 76
5 Pupil Demographics ............................................................... 78
6 Findings on Language of Instruction ...................................... 81
6.1 Teacher Questionnaire ................................................. 81 6.1.1 Questionnaire Administration ........................ 81 6.1.2 Teachers’ Language Ability ........................... 81
7 Conclusions ............................................................................ 90
7.1 EGRA – Major Findings ............................................... 90 7.2 EGMA – Major Findings ............................................... 92
Annex A: 2015 Ghana EGRA Analyses by Language ................... A-1
Annex B: Sample Size Data ........................................................... B-1

2015 EGRA and EGMA in Ghana | v
FIGURES
Figure 1: 2015 performance on EGMA subtasks ................ 21
Figure 2: Listening comprehension – Percentage of pupils scoring zero, by language and region ................. 44
Figure 3: Letter-sound identification – Percentage of pupils scoring zero, by language and region ................. 46
Figure 4: Nonword decoding – Percentage of pupils scoring zero, by language and region ............................ 49
Figure 5: Oral passage reading – Percentage of pupils scoring zero, by language and region ............................ 52
Figure 6: English oral reading fluency, item analysis .......... 53
Figure 7: Reading comprehension – Percentage of pupils scoring zero, by language and region, of those who attempted the subtask .................................. 56
Figure 8: 2015 performance on EGMA subtasks ................ 60
Figure 9: 2015 item-level performance on the addition level 1 subtask ................................................................ 63
Figure 10: 2015 item-level performance on the subtraction level 1 subtask ............................................. 64
Figure 11: 2015 item-level performance on the missing number subtask .............................................................. 69
Figure 12: 2015 item-level performance on the addition level 2 and subtraction level 2 subtasks ........................ 70
Figure 13: 2015 item-level performance on the word problem subtask ............................................................. 72
Figure 14: 2015 performance on EGMA subtasks, by boys/girls ........................................................................ 74
Figure 15: 2015 performance on EGMA subtasks, by urban/rural classification of schools ............................... 75

vi | 2015 EGRA and EGMA in Ghana
Figure 16: 2015 performance on EGMA addition and subtraction subtasks (levels 1 and 2 combined), by region ............................................................................. 76
Figure 17: Percentages of pupils who had readers, by language ......................................................................... 79
Figure 18: Percentages of pupils who had exercise books, by language ........................................................ 80
Figure 19: Teachers’ reported speaking ability in school LOI .................................................................................. 82
Figure 20: Percentage of pupils whose teacher studied same or different language in college ............................ 83
Figure 21: Teachers’ reasons for not teaching in the school’s LOI .................................................................... 84
Figure 22: Comparison of pupils’ LOI to their primary home language, by language of assessment (%) .......... 86

2015 EGRA and EGMA in Ghana | vii
TABLES
Table 1: 2015 performance on EGMA subtasks ................. 20
Table 2: EGRA instrument subtasks in Ghana ................... 28
Table 3: EGMA instrument subtasks in Ghana ................... 31
Table 4: Summary of the expected sample for Ghana national grade 2 EGRA/EGMA, mother tongue and English, 2015 .................................................................. 35
Table 5: Methodology used to determine the number of schools to sample in any given region/language ........... 36
Table 6: Listening comprehension – Percentage of pupils scoring zero, by district type, urban/rural status, and male/female ................................................. 45
Table 7: Letter sound knowledge – Percentage of pupils scoring zero, by district type, urban/rural status, and male/female .................................................................... 47
Table 8: Nonword decoding – Percentage of pupils scoring zero, by district type, urban/rural status, and male/female .................................................................... 49
Table 9: Oral passage reading – Percentage of pupils scoring zero, by district type, urban/rural status, and male/female .................................................................... 54
Table 10: Reading comprehension – Percentage of pupils scoring zero, by district type, urban/rural status, and male/female ................................................. 57
Table 11: 2015 performance on EGMA subtasks ............... 60
Table 12: Number identification – mean score and percentage of pupils scoring zero, by district type, urban/rural status, and male/female............................... 62
Table 13: Addition level 1 – mean score and percentage of pupils scoring zero, by district type, urban/rural status, and male/female............................... 65

viii | 2015 EGRA and EGMA in Ghana
Table 14: Subtraction level 1 – mean score and percentage of pupils scoring zero, by district type, urban/rural status, and male/female............................... 65
Table 15: Quantity discrimination – mean score and percentage of pupils scoring zero, by district type, urban/rural status, and male/female............................... 67
Table 16: Missing number – mean score and percentage of pupils scoring zero, by district type, urban/rural status, and male/female............................... 68
Table 17: Addition and subtraction (level 2) – mean score and percentage of pupils scoring zero, by district type, urban/rural status, and male/female .......... 71
Table 18: Word problems – mean score and percentage of pupils scoring zero, by district type, urban/rural status, and male/female............................... 73
Table 19: Pupil demographics ............................................. 78
Table 20: Percentage of pupils who reported that teacher taught mathematics in English .......................... 85
Table 21: Analysis of LOI results by region ......................... 87

2015 EGRA and EGMA in Ghana | ix
ABBREVIATIONS
BECE Basic Education Certification Examination
clpm correct letters per minute
clspm correct letter sounds per minute
cnonwpm correct nonwords per minute
COR Contracting Officer’s Representative
CRDD Curriculum Research and Development Division
cwpm correct words per minute
DAT District Advocacy Team
DCF District Cluster Forum
DFID UK Department for International Development
EARC Education Assessment and Research Centre
EGMA Early Grade Mathematics Assessment
EGRA Early Grade Reading Assessment
EMIS Education Management Information System
EQUALL Education Quality for All
FCUBE Free Compulsory and Universal Basic Education
GDP gross domestic product
GER gross enrolment rate
GES Ghana Education Service
GRAP Ghana Reading Action Plan
IRR interrater reliability
KG kindergarten
LOI language of instruction
NALAP National Literacy Acceleration Programme
NCRIBE National Centre for Research into Basic Education
NEA National Education Assessment
NEAU National Education Assessment Unit
P1–P6 Primary 1 through Primary 6
QUIPS Quality Improvements in Primary Schools
RTI RTI International (registered trademark and trade name of Research Triangle Institute)

x | 2015 EGRA and EGMA in Ghana
SEA School Education Assessment
USAID United States Agency for International Development
WSD Whole School Development

2015 EGRA and EGMA in Ghana | xi
ACKNOWLEDGEMENTS
This report is the culmination of the efforts of many individuals – all committed to supporting Ghana’s education system by collecting and disseminating high-quality data to drive decision-making. The following organizations and people contributed to analysing and reporting on the data collected during the 2015 National Early Grade Reading and Mathematics Assessment (EGRA and EGMA) survey in Ghana. From the National Education Assessment Unit (NEAU): Antwi Aning, Clara Anumel, Anthony Sarpong, Joana Vanderpuije, and Joachim Honu. From the Ministry of Education’s Education Management Information System (EMIS) unit: Herbert Gorman. From the Curriculum Research and Development Department (CRDD): Veronica Odom. From the National Centre for Research into Basic Education (NCRIBE) at the University of Education at Winneba: Patricia Amos. From the Education Assessment and Research Centre (EARC): Elorm Matanawui, Emmanuel Mankattah, and Richard Vormawor. From RTI International: Emmanuel Sam-Bossman, Irene Arthur, Elizabeth Randolph, Christopher Cummiskey, Jennifer Pressley, Pierre Varly, and Emily Kochetkova. Ms. Kochetkova also was responsible for the crafting and incorporation of the teacher questionnaire into the 2015 EGRA/EGMA – with strong concurrence from the NEAU – as a companion product of her RTI-funded research on Ghana’s language policy and the demand- and supply-side factors that affect its implementation in classrooms.
Although not involved in analysis and reporting, other individuals from across these organizations also played integral roles in the overall successful completion of the survey: Megan McCune, Joseph Azuntaaba, and Maria Dzula (RTI); Emma Gyamera, Rosemond Owusu, Akosua Adu, Phyllis Ahugah, Charity Owusu, and Isaac Ablorh (EARC).
We are, of course, exceedingly grateful to the many Ghana Education Service personnel who worked hard to prepare and collect high-quality EGRA and EGMA data, as well as to the hundreds of school administrators and teachers, and the thousands of pupils across the country, who agreed to participate in this study, and thereby contributed important knowledge to the community of stakeholders seeking to improve education in Ghana.

xii | 2015 EGRA and EGMA in Ghana
Finally, this effort would not have been possible without the generous support of the United States Agency for International Development. The authors are especially grateful to Sarah Banashek, as the USAID/Ghana Contracting Officer’s Representative for this activity, for her tireless support and advocacy on behalf of the NEAU and its partners.

2015 EGRA and EGMA in Ghana | 13
1 EXECUTIVE SUMMARY
The National Education Assessment Unit (NEAU) of the Ghana Education Service (GES) conducted a national Early Grade Reading Assessment (EGRA) and Early Grade Mathematics Assessment (EGMA) in July 2015. This was the second administration of EGRA and EGMA in Ghana; the first took place in 2013, and both were conducted as part of the USAID Partnership for Education: Testing activity. Unlike other testing approaches in Ghana, such as the National Education Assessment (NEA), the EGRA and EGMA were administered orally by an assessor to a single pupil, rather than being a paper-and-pencil, multiple-choice test administered to an entire class of pupils. The purpose of the EGRA and EGMA is to provide data about the current state of reading and mathematics performance among a population of interest. In Ghana, this was Primary 2 (P2) pupils in public schools. The data collected are useful for informing stakeholder decisions about policy and practice.
The 2015 assessments were administered to a random sample of P2 pupils in public schools across all ten regions of the country. The final sample included 738 schools and 7,311 pupils (3,645 males and 3,666 females). The EGRA was administered in the Ghanaian language of instruction (LOI) at that school (Akuapem Twi, Asante Twi, Dagaare, Dagbani, Dangme, Ewe, Ga, Gonja, Fante, Kasem, or Nzema), as well as in English.
At each sampled school, ten pupils (five males and five females) were randomly selected from a P2 classroom. Trained GES assessors administered the two EGRAs, the EGMA, and an interview questionnaire to each pupil individually. The pupil questionnaire provided demographic information about the pupils. In addition, the assessor interviewed the P2 teacher from whose classroom the pupils were selected, to learn specific information about how LOI factored into instructional practice.
Locally adapted versions of the EGRA and EGMA have been administered in countries around the world. The EGRA and EGMA instruments used in Ghana were developed in 2013 over three weeks of workshops. International experts in early grade reading and math joined Ghanaian experts in teaching, curriculum, and linguistics to develop the instruments in accordance with Ghana’s P2 curriculum

14 | 2015 EGRA and EGMA in Ghana
and teaching and learning materials. The same experts convened again in 2015 to revise the instruments such that the results would be comparable across years.
The EGRA contained five subtasks that measured a range of literacy skills, from prereading through reading with fluency and comprehension. The subtasks were: listening comprehension, letter-sound identification, nonword decoding, oral passage reading, and reading comprehension.
The EGMA contained six subtasks that measured a range of numeracy skills, from procedural to conceptual. The subtasks were: number identification, addition and subtraction level 1, quantity discrimination, missing number, addition and subtraction level 2, and word problems.
1.1 OVERVIEW OF EGRA TRENDS
Like the 2013 EGRA, the 2015 EGRA showed that by the end of P2, the majority of public school pupils struggled with even foundational reading skills and could not yet read with comprehension – either in a Ghanaian LOI or in English. In every language, at least half, and often more, of the pupils assessed could not read a single word correctly. Some pupils had the ability to recognize a few words, but this was not sufficient to be able to comprehend what they read. Of the pupils assessed in each language, in general 2% or less were able to read with fluency and comprehension.1 An overview of pupil performance by subtask is below. Because of how languages differ, it is not appropriate to compare pupils’ fluency rates and scores between them. It is permissible, however, to compare the percentages of pupils who were unable to provide a single correct response on a given subtask, because rather than comparing ability across different languages, one is comparing inability. This is alternately referred to as ‘scoring zero’ or obtaining a ‘zero score’. In this report, therefore, most discussions of findings focus on zero-score percentages. Performance scores are discussed only in the context of a range, rather than performance results being presented for every language. For reference, an annex to the report contains more detailed summaries of the EGRA results for each language individually.
1 ‘…able to read with fluency and comprehension’ was defined as being able to correctly answer at least 4 (80%), or all 5 (100%) of the reading comprehension questions. In each language assessed, 2% or less of the pupils were able to read at this level, with the exception of pupils in Ewe schools, where 5% of pupils could read with fluency and comprehension.

2015 EGRA and EGMA in Ghana | 15
The following subsections summarize the key findings from the EGRA, following the subtask sequence, which begins with measuring pre-reading skills and ends with measuring fluency and comprehension.
1.1.1 LISTENING COMPREHENSION SUBTASK
The listening comprehension subtask measured oral language comprehension and vocabulary. For this subtask, each child listened to a story that the assessor read out loud, then orally answered three questions about the story. Listening comprehension is a prereading skill, and there is a strong link between a child’s ability to speak and understand a language and his or her ability to learn to read in that language.
Listening comprehension was the only subtask in the EGRA in which the percentage of pupils who scored zero was less than half across the Ghanaian LOIs (with the exception of Dagbani, for which 52.8% of pupils scored zero). In ten of the Ghanaian LOIs, most pupils were able to correctly answer at least one question, with zero-score percentages in the single digits and teens in Fante (6.0%), Nzema (7.3%), Dangme (16.8%), and Ewe (19.1%) schools, up to just under half in Gonja schools (48.9%). In contrast, 81% of pupils scored zero on the English listening comprehension subtask. Thus, pupils performed better on the listening comprehension subtask in a Ghanaian LOI than English, as would be expected and as current research indicates.2
1.1.2 LETTER-SOUND IDENTIFICATION SUBTASK
The letter-sound identification subtask measured pupils’ ability to provide the sound (i.e., phoneme) related to an individual letter. This foundational literacy contributes to word identification. All selected pupils were shown 100 letters, both upper and lower case, arranged in a random sequence, and were asked to identify the sounds of as many letters as they could within one minute. If a pupil named the letter instead of the sound, failed to say anything at all, or gave the wrong sound, the response was marked as incorrect. Research has
2 Scarborough, H. S. (2009). Connecting early language and literacy to later reading (dis)abilities: Evidence, theory, and practise. In F. Fletcher-Campbell, G. Reid, & J. M. Soler (Eds.), Approaching difficulties in literacy development: Assessment, pedagogy and programmes (pp. 23–38). London: Sage.

16 | 2015 EGRA and EGMA in Ghana
established letter-sound identification as a strong predictor of future reading ability.3
The proportion of pupils who could not identify the sound for a single letter (i.e., scored zero) ranged widely across the Ghanaian LOIs, from 14.8% to 71.5%. In English, 73.1% of pupils scored zero. (The data from which these averages and ranges are extracted can be seen in Annex A of the report.)
In the Ghanaian LOI assessments, the average score pupils received on letter-sound identification for each language was below 50% correct. Pupils’ performance ranged from 7.9% to 40.8% correct of those they attempted before running out of time, across languages. The fluency rate for this task ranged from 2 to 16 correct letter sounds per minute across languages. The national benchmarks for reading in Ghana, established in 2014, proposed 40 correct letter sounds per minute in Ghanaian language. Similarly, the average score for English was 10.7% correct letter sounds out of those attempted, resulting in an average fluency rate for expressing letter sounds of 3 correct letter sounds per minute. The benchmark proposed for English on this task is 35.4
1.1.3 NONWORD DECODING SUBTASK
The nonword decoding subtask measured pupils’ ability to decode words and blend letter sounds together to pronounce words. Each pupil was shown 50 nonwords, mostly 3 letters in length. The pupil was given one minute to read as many nonwords as possible. Although the nonwords were not real words in the language of the assessment, they did follow the structure and orthography of the language. Using nonword decoding is helpful for
noting a pupil’s facility to apply phonics knowledge to unfamiliar words. The results suggest they did not have phonics knowledge.
Across the languages, whether LOI or English, most pupils scored zero on nonword decoding, which brings down the overall average scores. The highest average score out of the items pupils attempted was 16.2% correct, while the lowest was 1.3% correct, for Ewe and
3 Adams, M. J. (1990). Beginning to read: Thinking and learning about print. Cambridge, Massachusetts, USA: Massachusetts Institute of Technology (MIT) Press. 4 A four-page report on the 2014 Ghana benchmarking activity can be found here: http://pdf.usaid.gov/pdf_docs/PA00KS7N.pdf
Sample nonword decoding items: Ewe language

2015 EGRA and EGMA in Ghana | 17
Kasem respectively. The fluency rate for this subtask ranged from 0.3 to 4.5 correct nonwords per minute (cnonwpm).
For the percentage of pupils who did not score zero, the highest average score of items pupils attempted was 58.3% correct for Ewe and the lowest was 37.3% correct for Dagaare. The average fluency rates for this category ranged from a low of approximately 9 cnonwpm to a high of 16 cnonwpm across all languages. The average score for pupils who scored above zero in English was 11.7 cnonwpm.
The benchmark proposed for this task is 25 correct nonwords per minute for Ghanaian language and 20 for English.
1.1.4 ORAL PASSAGE READING SUBTASK
The oral passage reading subtask measured pupils’ ability to read connected text. Each pupil was shown a grade-appropriate short story and given one minute to read.
When beginning readers start to read connected text, they initially employ most of their cognitive resources in decoding and identifying the individual words of the text. They are attending to accuracy. Because they do not yet read words automatically, their short-term memory is almost entirely engaged in the decoding of words, leaving minimal cognitive resources to process meaning. As pupils gain decoding fluency (accuracy and automaticity), they use less short-term memory for decoding and are able to use sufficient cognitive resources to comprehend the meaning of the text. Thus, fluency in reading connected text is a prerequisite for comprehension.5
Overall, pupils’ performance was low for this task. The proportion of pupils scoring zero ranged from 54.5% to 92.5% in the Ghanaian LOIs. Just over half (51.1%) of pupils scored zero in English. Thus, more than half of the pupils assessed could not read aloud a single word in a passage in either the Ghanaian LOI or English.
In the Ghanaian languages, the lowest average score out of items pupils attempted was 2.9% correct and the highest score was 18.6% correct. The fluency rate in the Ghanaian languages ranged from 0.7 to 7.6 correct words per minute. Pupils scored an average of 20.3% correct of items attempted in English, with an average fluency rate of
5 Research on reading automaticity and working memory: Abadzi, H. (2006). Efficient learning for the poor. Washington, DC: The World Bank. https://openknowledge.worldbank.org/handle/10986/7023; and Hirsch Jr., E. D. (2003). Reading comprehension requires knowledge of words and the world: Scientific insights into the fourth-grade slump and the nation’s stagnant comprehension scores. American Educator (Spring), 10–44.

18 | 2015 EGRA and EGMA in Ghana
6.3 correct words per minute. The EGRA reading passages were written and levelled to match Primary 2 expectations. These accuracy percentages suggest that the pupils did not have the facility to read grade-level text.
An item analysis supported and explored this point further. These pupils were not skilled at identifying decodable words that represented the most common orthographic patterns learned in beginning-reading texts, such as the vowel-consonant pattern in the English word ‘in’. Phonics instruction should develop this skill. The item analysis also suggested that they were not learning high-frequency words that are common in connected text (e.g., ‘the’ and ‘she’ in English). High-frequency words are often taught as whole units so that pupils can engage with connected text while they learn phonics. Furthermore, the item analysis suggested minimal skill with words that represented the lexicon expectations of P2 pupils. Words that are in a pupil’s expressive and receptive vocabulary, such as the word ‘teacher’ in English, are used in levelled text.
Among pupils who did not score zero in the Ghanaian language, the lowest average score by language was 34.0% correct of those attempted and the highest was 66.7%. The fluency rate ranged from 6 to 32 words per minute. Among pupils who did not score zero in English on this subtask, the average performance was 41.5% correct of those attempted. The benchmark proposed for oral reading fluency is 40 correct words per minute for Ghanaian language and 45 for English.
Although there was a range of zero score percentages, among pupils who were able to read at least one word, the average fluency rates across all languages were lower than what is generally necessary to read with comprehension, as is shown in the next section, although there is no single fluency rate that is standard for all languages.
1.1.5 READING COMPREHENSION SUBTASK
The reading comprehension subtask measured pupils’ ability to understand the text that they had just read aloud. This skill is the ultimate goal of literacy instruction. For each short story used in the oral passage reading subtask, there were five comprehension questions. Once the oral passage reading subtask was completed, the assessor asked the pupil the comprehension questions, but only those that corresponded to the portion of the story passage the pupil was able to read within the one-minute time limit. Thus, if the pupil

2015 EGRA and EGMA in Ghana | 19
was able to read only the first sentence of the passage, the assessor asked the pupil only the first question. The preliminary questions assessed direct recall, while subsequent questions were inferential in nature.
Among those who attempted to answer at least one comprehension question, zero score percentages ranged broadly across the Ghanaian LOIs, from 29.3% scoring zero in Dangme schools to 89.6% in Kasem schools. Except in Akuapem Twi and Ga schools (many of which were in metropolitan settings), pupils performed worse in English reading comprehension than they did in Ghanaian LOI reading comprehension, in all languages.
More importantly, the difference in average reading accuracy of 11.1% (Ghanaian languages) and 20.3% (English) is not that meaningful. These pupils had minimal to no word recognition skills. Without the ability to read words, the pupils should not be expected to understand (what they cannot read). This finding may seem contrary to pupil performance on the oral passage reading subtask, where pupils seemed to perform better in English, but an in-depth item analysis of pupil performance on the English reading passage revealed that pupils were frequently able to correctly ‘read’ a few very basic English words in the text (such as ‘is’ and ‘the’). Correctly giving even one word was enough to prevent pupils from receiving a zero score.
For all 12 languages assessed, the percentages of pupils not scoring zero – i.e., they were able to answer at least one of the comprehension questions correctly – averaged about 9%, with the range being 21.7% (Dangme) to 0.8% (Kasem). The benchmark proposed for reading comprehension is 80% for both Ghanaian language and English.
Thus, it remains true that pupils who were able to read with comprehension at the end of P2, in any language, were a distinct minority in Ghana. All told, the findings from the combined EGRA subtasks indicate that pupils in Ghana are not receiving instruction needed to master foundational literacy skills that would enable them to read with fluency and comprehension.
1.2 OVERVIEW OF EGMA TRENDS
Like the 2013 EGMA, the 2015 EGMA (see Table 1) showed that by the end of P2, the majority of public school pupils were not doing mathematics beyond the most procedural level. The most evident

20 | 2015 EGRA and EGMA in Ghana
trend (see Figure 1) is that at the end of P2, pupils were doing reasonably well on the most procedural items – number identification, addition level 1 and subtraction level 1 – with pupils scoring on average between 46% and 72% correct on these subtasks.6 That said, the pupils did better on addition level 1 (with an average of only 9.6% zero scores) than on subtraction level 1, with 22.1% of the pupils unable to answer a single subtraction level 1 item correctly – the easiest of these items being: 4 – 1 = iiii. When it came to the more conceptual items, the pupils still fared reasonably well on the quantity discrimination subtask, averaging 65.4% correct out of the items attempted. However, on the missing number, addition level 2 and subtraction level 2 subtasks, there was a sharp drop-off in performance, with 73.2% of the pupils unable to answer a single subtraction level 2 item correctly – the easiest of these being 19 – 6 = iiii. This stark difference in performance between the procedural and conceptual subtasks suggests a lot about how children in Ghana are likely to experience school mathematics.
It is clear from the EGMA data that Ghanaian pupils have difficulty with mathematics beyond the memorisable level. Pupils tend to memorize facts, rules and procedures rather than learning the basic concepts needed to make meaning. The EGMA results show that as a whole, Ghana’s pupils do not have the foundational skills required to grasp the basic concepts in mathematics, or to use these skills in situations that require them to understand these basic concepts.
Table 1: 2015 performance on EGMA subtasks
EGMA subtasks
% correct / attempted
% correct / total
% zero scores
Number identification‡ 71.5% (71.7%)
0.8%
(0.6%)
Addition (level 1) ‡ 62.5 (63.3%)
9.6%
(8.1%)
Subtraction (level 1) ‡ 45.8 (48.7%)
22.1%
(19.3%)
Quantity discrimination
65.4% (64.9%)
3.3% (3.5%)
Missing number
26.7% (26.2%)
6.5% (7.6%)
6 The 2014 Ghana benchmarking exercise (see http://pdf.usaid.gov/pdf_docs/PA00KS7N.pdf) set mathematics benchmarks for addition and subtraction level 2, missing number, and problem solving (word problems). Comparisons of 2015 average scores to these benchmarks appear in the relevant detailed subsections in Section 3, EGRA Outcomes.

2015 EGRA and EGMA in Ghana | 21
Table 1: 2015 performance on EGMA subtasks
EGMA subtasks
% correct / attempted
% correct / total
% zero scores
Addition (level 2)
19.6% (21.4%)
51.7% (50.6%)
Subtraction (level 2)
9.7% (11.8%)
73.2% (69.9%)
Word problems
40.1% (40.0%)
8.7% (9.1%)
Note: the values in parentheses represent the scores from the 2013 survey, for comparison. ‡ These tasks were timed, and the means reported for these subtasks are the mean number of correct responses in terms of the number of items attempted. For all other subtasks, the means reported represent the number of correct responses in terms of the number of items.
Figure 1: 2015 performance on EGMA subtasks
1.3 OVERVIEW OF FINDINGS ON TEACHERS’ LANGUAGE
Data collected from teachers and pupils about implementation of the LOI policy in classrooms is evidence of the complex linguistic landscape in Ghana and how it impacts education. Some LOIs had trained, native speaking teachers available (the majority of teachers in Dagaare, Ewe, Kasem, and Nzema schools were native speakers).
NumberIdent. Addition L1 Subtraction
L1QuantityDiscrim.
MissingNumber Addition L2 Subtraction
L2Word
ProblemsProcedural knowledge (recall)
(%correct/attempted) Conceptual knowledge (application) (%correct)
All 71.5 62.5 45.8 65.4 26.7 19.6 9.7 40.1
0
10
20
30
40
50
60
70
80
90
100
Mea
n P
erce
ntag
e C
orre
ct

22 | 2015 EGRA and EGMA in Ghana
Other LOIs had too few teachers (most notably Ga schools, where 53% of teachers said they had only ‘limited working ability’ in the language and 20% said they did not speak the LOI at all). This sometimes results in schools where there is no available teacher who can teach in the LOI, or a ‘detached’ teacher is brought in specifically for the Ghanaian language portion of the reading lesson. Of teachers interviewed, 20% reported that their pupils were not taught in the LOI, and the most common reason given was that they did not know the language and there was no detached teacher available. These findings indicate that the teacher-posting process should take care to include language ability in order to ensure that teachers are assigned to schools where they are equipped to teach in the LOI.
Certain regions, such as Upper East and Upper West, enjoy extensive agreement between home language and language of instruction. In other regions, such as Northern and Greater Accra, there is disagreement between the LOI and the predominant home language of the pupils and, on average, only 49% of pupils are being instructed in their home language.
Furthermore, in some schools – especially in urban areas – the pupil population was multilingual, such that a single Ghanaian LOI could not serve all pupils. While the intent of the LOI policy is to allow pupils to learn in a familiar language before (and to aid in) transitioning to an unfamiliar one (frequently described as ‘going from the known to the unknown’), in these cases, some pupils are faced with receiving instruction in essentially a third language – a LOI that is not their own and is also not English. In truly multilingual classrooms, adhering to the LOI policy may hinder, rather than benefit the learning process.
Thus, in addition to revisiting the criteria for posting teachers to schools, education officials should also explore options for better serving pupils in places where the context is not conducive to all pupils learning in the LOI that they already know.
1.4 OVERVIEW OF FINDINGS FROM PUPIL INTERVIEWS
Although they were not in the majority, analyses of those pupils who were able to perform well in reading and mathematics indicated that they shared several key traits related to availability of resources and time spent practicing these skills. These high-performing pupils were significantly more likely to:

2015 EGRA and EGMA in Ghana | 23
• Be of normal age for P2 (compared with being over age)
• Have attended preschool and/or kindergarten
• Attend school regularly
• Have an exercise book
• Have books and reading materials at home (apart from school textbooks)
• Spend time at school reading on their own
• Practise reading out loud at home
• Have someone at home who reads to them
Given that these characteristics are not the norm, more should be done to explore how to strengthen these factors which are known to be associated with stronger reading and mathematics performance.
1.5 SUMMARY OF CONCLUSIONS
Like in 2013, the results from the 2015 EGRA showed that most pupils in Ghana were not yet able to read with fluency and accuracy, which prevented them from reading with comprehension. These pupils generally lacked the pre- and early-reading skills they will need to become strong, fluent readers who understand text. Although there were some variations among the languages, this trend of pupils struggling with letter sounds, decoding, and comprehending was apparent in all languages assessed.
As in 2013, the results of the 2015 EGMA study in Ghana strongly suggest that the teaching of mathematics focuses on memorization of facts, rules and formulas. Based on the EGMA results, particularly on the conceptual knowledge items, this approach does not appear to be working. While it may contribute to the impression that children ‘know their mathematics’ in the very early grades (e.g., P1), the EGMA in Ghana has shown that pupils are unable to apply their memorized knowledge and hence they are not well prepared to learn more complex and important mathematics in the higher grades.
The differences seen in pupil performance between English listening comprehension and Ghanaian LOI listening comprehension highlight the promise of local-language instruction. Pupils arrive at school better equipped to understand in their home language. However, effective implementation of the LOI policy faces challenges in Ghana’s multilingual context. Careful review of the policy regarding schools’ selection of LOI, teacher assignment protocols, and how to

24 | 2015 EGRA and EGMA in Ghana
apply local-language instruction in multilingual classrooms should be considered.
Efforts should be made to increase availability of reading materials and to increase the opportunity to practice reading, both at home and in school.

2015 EGRA and EGMA in Ghana | 25
2 INTRODUCTION
2.1 PRIMARY EDUCATION IN GHANA
Ghana is committed to high-quality basic education. Over the past decade, this commitment has been evidenced by substantial improvements in access, quality, funding for basic education, policy reforms, and community mobilization.
With the introduction of the Free Compulsory and Universal Basic Education (FCUBE) in 1999, enrolment in primary school increased from 2.4 million pupils in the 1999/2000 academic year to 4.3 million in 2014/2015.7 Funding to the education sector as a whole also increased in recent years. The sector saw overall growth from 15.6% of total government spending in 2001 to 21.7% in 2013.8
Furthermore, Ghana’s commitment to quality education and improved reading in particular is reflected in several policy and curriculum reforms that involve teaching children to read in the Ghanaian language of the school community and gradually introducing English over the first three years of school. To support these curriculum reforms and Ghana’s language policy, the GES introduced the National Literacy Acceleration Programme (NALAP) in 2010 – which aims to improve literacy through instruction in mother tongue in kindergarten through P3, with transition to English from the end of P3 into P4 – and developed the Ghana Reading Action Plan (GRAP), a comprehensive work plan leading to the achievement of a set of agreed-upon reading targets. Several externally funded programmes, such as Whole School Development (WSD), Quality Improvements in Primary Schools (QUIPS) and Education Quality for All (EQUALL), have supported improvements in primary school quality since 1997. Currently, activities under the USAID Partnership for Education, the multilateral Global Partnership for Education in Ghana, and the Department for International Development (DFID) Complementary Basic Education Programme are all working towards furthering
7 UNESCO Institute for Statistics. (2015). Education: Participation. Enrolment. Enrolment by level of education. Enrolment in primary education, both sexes (number). [Table in data set]. Retrieved from http://data.uis.unesco.org/?queryid=142 8 UNESCO Institute for Statistics. (2015). Education: Financial resources. Expenditure on education as % of total government expenditure (all sectors). Expenditure on primary as % of total government expenditure (%) [Table in data set]. Retrieved from http://data.uis.unesco.org/?queryid=142

26 | 2015 EGRA and EGMA in Ghana
improvements in basic education, with a focus on improving basic literacy and numeracy attainment.
In 2013, the GES conducted a first national study of early grade reading and mathematics: the Early Grade Reading Assessment (EGRA) and Early Grade Math Assessment (EGMA).9 The EGRA and EGMA instruments were adapted for each of 11 official local languages used in Ghanaian government schools and English. The findings from the 2013 EGRA and EGMA led to the establishment of a set of national benchmarks10 in reading and mathematics to guide targeted support to schools and measure progress towards their achievement.
2.2 BACKGROUND OF THE EARLY GRADE READING AND MATHEMATICS ASSESSMENTS IN GHANA
Until 2013, there was inadequate national-level data on how pupils in the early grades are acquiring literacy and numeracy skills. Even though the School Education Assessment (SEA) was, in the past, administered to grades 2 and 4, it was meant to be a diagnostic assessment tool at the school level but not a nationally representative test.
The 2005 National Education Assessment (NEA) was the earliest national assessment conducted in Ghana for children in the primary grades. The NEA is a paper-and-pencil, multiple-choice test of pupils’ acquisition of skills in mathematics and language, administered only in English, to Primary 311 and 6 (P3 and P6) pupils. The NEA is administered nationally every two years, to a representative sample of pupils, to generate an overall summary report card for the country in mathematics and English. However, the NEA is not designed to provide data on nonreaders, emerging readers, or reading fluency rates – data that are critical to understanding reading achievement
9 See the Ghana 2013 EGRA and EGMA findings report for more details: Ministry of Education, Ghana Education Service, National Education Assessment Unit. (2014, May). Ghana 2013 National Education Assessment: Summary of results. Final version. Prepared under the USAID Education Data for Decision Making (EdData II) project, Ghana Testing, Task Order No. AID-641-BC-13-00001 (RTI Task 21). Research Triangle Park, NC: RTI International. http://pdf.usaid.gov/pdf_docs/PA00KS7M.pdf 10 See the Ghana benchmarking activity report for more details: United States Agency for International Development (USAID). Proposing benchmarks for early grade reading and mathematics in Ghana. Prepared under the USAID Education Data for Decision Making (EdData II) project, Measurement and Research Support to Education Strategy Goal 1, Task Order No. AID-OAA-BC-12-00003 (RTI Task 20). Research Triangle Park, NC: RTI International. http://pdf.usaid.gov/pdf_docs/PA00KS7N.pdf 11 In 2016, the assessment was given in P4 rather than P3, to better align with pupils’ exposure to English, per Ghana’s language-of-instruction policies.

2015 EGRA and EGMA in Ghana | 27
and challenges in the early grades. Through the Ghana Partnership for Education, the Ghana Education Service and USAID forged a commitment to improving early grade reading outcomes in Ghana. Testing is a key component of the partnership, as the first national-scale mechanism for measuring early grade reading outcomes in Ghanaian languages and English.
This partnership agreement led to two new assessments for Ghana in 2013: the EGRA and EGMA.12 These two assessments – described in the next section – were designed to collect data on early grade reading skills in the 11 official Ghanaian languages plus English, and also data on mathematics skills.
2.3 OVERVIEW OF THE EARLY GRADE READING ASSESSMENT TOOL AND HOW IT WAS ADAPTED FOR GHANA13
Previous to the current EGRA activity in Ghana, USAID and the World Bank supported RTI and a team of reading experts to develop a 15-minute, individual oral assessment for measuring five core skills considered globally to be the building blocks of reading: phonemic awareness, alphabetic principle, fluency, vocabulary, and comprehension. The Early Grade Reading Assessment tool translates the core skills into observable tasks (i.e., recognizing letters, distinguishing sounds within words, reading simple words and passages, and understanding the meaning of sentences and paragraphs).
The components that assess these five core skills are aligned with essential and teachable reading skills, and the results of pupils’ performance on the EGRA provide clear guidance for improving instructional methods that will lead to better learning outcomes in the early grades.
In 2013, with the help of Ghanaian educators – including primary school teachers, faculty from colleges of education, representatives from the Curriculum Research and Development Division (CRDD), and language experts from university linguistic departments – the EGRA was adapted to suit the Ghanaian context. The EGRA was used in 11 official Ghanaian languages of instruction, or LOIs –
12 The 2013 and 2015 instruments are available from the EdData II project website, www.eddataglobal.org, Countries > Ghana. 13 For ease of reference and comparison, some of the background and descriptive material on the EGRA and EGMA from the 2013 analysis report (cited in footnote 9) is repeated in this document.

28 | 2015 EGRA and EGMA in Ghana
Akuapem Twi, Asante Twi, Dagaare, Dagbani, Dangme, Ewe, Ga, Gonja, Fante, Kasem, Nzema – as well as English. The 11 national languages are written using Latin script as a base, with some having additional unique letters that are specific to the language.
During the instrument adaptation process in 2013, which spanned two weeks and took place in Winneba and in Accra, the educators and language experts ensured that the instruments:
• were culturally appropriate
• corresponded to the grade-level material pupils were expected to read
• reflected the way the language was being used locally in reading materials for the target grade level
• took into consideration the linguistic structure of the languages.
In 2015, it was important to ensure that the instruments were different enough from the 2013 versions to prevent schools from preparing in advance of the assessment by using them, but also similar enough to allow for comparability. To achieve these goals, in April 2015 international EGRA experts again gathered with Ghanaian language, curriculum, and assessment experts in Accra for an instrument update workshop. Many participants had been part of the original 2013 instrument adaptation workshops. In some subtasks (letter-sound identification and nonword reading), the items were all retained but the order in which they appeared was changed; in other subtasks (listening comprehension and oral passage reading), the story remained structurally the same but certain nouns and verbs were changed.
The final instrument for Ghana – in both 2013 and 2015 – included the subtasks summarized in Table 2.
Table 2: EGRA instrument subtasks in Ghana
Subtask Skill
Description The child is asked to…
Listening comprehension
Oral language comprehension and vocabulary
…listen to a story that the assessor reads out loud, then orally answer 3 questions about the story. Untimed.
Letter-sound identification
Alphabetic principle—letter-sound correspondence
… say the sound each letter makes, while looking at a printed page of 100 letters of the alphabet in random order, upper and lower case. Timed, one minute.

2015 EGRA and EGMA in Ghana | 29
Table 2: EGRA instrument subtasks in Ghana
Subtask Skill
Description The child is asked to…
Nonword reading Alphabetic principle—letter-sound correspondence; and Fluency—automatic decoding
… read a list of 50 nonwords printed on a page. Timed. Words were constructed from actual orthography, but were not real words. For example ‘jaf’, ‘tob’. Timed, one minute.
Oral passage reading
Fluency—automatic word reading in context
…read a grade-level-appropriate short story out loud from a printed page. Timed, one minute.
Reading comprehension
Comprehension … orally respond to 5 questions that the assessor asks about the short story. Untimed.
The EGRA subtasks are either timed or untimed. Timed subtasks are administered over a one-minute period during which the child responds to as many test items within the subtask as possible. The assessor notes the total number of letters or words read during one minute and also notes which letters or words are read incorrectly. For these timed subtasks, fluency is calculated and expressed as ‘correct items per minute’. The results of the untimed subtasks, which do not measure fluency, are calculated and expressed as ‘percentage of items correct out of the items attempted’. It takes about 15 minutes to administer EGRA to an individual pupil.14
As noted, for the EGRAs in Ghana, pupils were assessed in English and in the GES-designated language of instruction at the school. The LOI was determined by the predominant Ghanaian language of the locality. About 6.7% of the pupils sampled for the 2015 EGRA were assessed only in English. This was because their school could not be identified with a Ghanaian LOI in the Education Management Information System (EMIS) data. Nevertheless, these schools were necessary to include within the sample to achieve the desired levels of representation.
14 The average length of time to administer the entire pupil assessment, which included the EGRA, EGMA, and pupil questionnaire, was 39.6 minutes.

30 | 2015 EGRA and EGMA in Ghana
2.4 OVERVIEW OF EARLY GRADE MATHEMATICS ASSESSMENT TOOL
The Early Grade Mathematics Assessment was designed by a panel of international experts in mathematics teaching.15 In developing the standard EGMA protocol for global use, the experts systematically sampled early numeracy skills, particularly those underlying number sense. These abilities and skills are key in the progression towards the ability to solve more advanced problems and the acquisition of more advanced mathematics skills.16 The conceptual framework for the mathematical development on which the assessment is based is grounded in extensive research.17 In Ghana, a week-long workshop was held in 2013 with local mathematics experts and language experts to ensure that the EGMA was appropriate for the Ghanaian context, the schooling levels of the children to be tested, and the Ghanaian languages of administration.
The conceptual framework includes the expectation that the EGMA tasks:
• represent skills that countries have specified in their curricula to be acquired in early grades;
• reflect skills that are most predictive of future performance;
• represent a progression of skills that lead toward proficiency in mathematics;
• target both conceptual and computational skills; and
• represent skills and tasks that can be improved through instruction.
The EGMA is administered orally to ensure that the test is truly assessing these young pupils’ mathematics skills, as opposed to their ability to read and understand written instructions. Each question focuses on targeted skills. In Ghana, the test was administered in the language of instruction of the school, or in English, or using a
15 For more background and early history of the EGMA, see RTI International. (2009). Early Grade Mathematics Assessment (EGMA): A conceptual framework based on mathematics skills development in children. Prepared for USAID under the EdData II project, Task Order No. EHC-E-02-04-00004-00 (RTI Task 2). Research Triangle Park, NC: RTI International. http://pdf.usaid.gov/pdf_docs/PNADS439.pdf 16 Examples are (1) Baroody, A. J., Lai, M.-L., & Mix, K. S. (2006). The development of number and operation sense in early childhood. In O. Saracho & B. Spodek (Eds.), Handbook of research on the education of young children (pp. 187–221). Mahwah, New Jersey, USA: Erlbaum. (2) Clements, D., & Samara, J. (2007). Early childhood mathematics learning. In F. K. Lester, Jr. (Ed.), Second handbook on mathematics teaching and learning (pp. 461–555). Charlotte, North Carolina, USA: Information Age. (3) Foegen, A., Jiban, C., & Deno, S. (2007). Progress monitoring measures in mathematics: A review of literature. The Journal of Special Education, 41(2), 121–139. 17 For example: (1) Baroody, et al. (2006); (2) Chard, D. J., Clarke, B., Baker, S., Otterstedt, J., Braun, D., & Katz, R. (2005). Using measures of number sense to screen for difficulties in mathematics: Preliminary findings. Assessment for Effective Intervention, 30(2), 3–14. (3) Clements & Samara (2007)

2015 EGRA and EGMA in Ghana | 31
combination of the two so that pupils had the greatest chance of understanding the questions.
Table 3: EGMA instrument subtasks in Ghana
Subtask Skill
Description The child is asked to…
Subtasks that assess procedural (recall) knowledge Number identification
The ability to identify written number symbols
State the names of numbers presented on a page with 20 numbers (i.e., items). The numbers had one, two or three digits. Timed (one minute).
Addition and subtraction level 1 (basic facts)
Knowledge of and confidence with basic addition and subtraction
Solve addition/subtraction problems, with sums/differences below 20, without the aid of paper and pencil. The items ranged from problems with single digits only to problems that involved the bridging of the ten.18 Twenty items for each addition and subtraction subtask (40 total items). Timed (one minute).
Subtasks that assess conceptual (applied) knowledge Quantity discrimination (number comparison)
The ability to make judgments about differences by comparing quantities represented by numbers
Identify the larger of a pair of numbers. The number pairs used ranged from a pair of single-digit numbers to five pairs of double-digit numbers and four pairs of three-digit numbers. Ten items. Not timed.
Missing number (number patterns)
The ability to discern and complete number patterns
Determine the missing number in a pattern of four numbers. Patterns used included counting forward and backward by ones, by fives, by tens and by twos. Ten items. Not timed.
Addition and subtraction level 219
The ability to use and apply the procedural addition and subtraction knowledge assessed in the level 1 subtask (sometimes referred to as the ‘basic facts’) to solve more complicated addition and subtraction problems
Solve addition/subtraction problems by applying the basic addition and subtraction facts assessed in the level 1 subtask. Pupils were allowed to use any strategy that they wanted, including using the paper and pencil supplied by the assessor. The problems required adding or subtracting two-digit numbers involving bridging. Five items per addition and subtraction subtask. Not timed.
Word problems The ability to interpret a situation (presented orally to the pupil), make a plan and solve the problem.
Solve problems presented orally using any strategy, including using the paper and pencil and/or counters supplied by the assessor. The numerical values involved in the problem were deliberately small to allow for the targeted skills to be assessed without confounding problems with calculation skills that might otherwise impede performance. Six items. Not timed.
18 ‘Bridging the ten’ refers to addition and subtraction situations where the addition and/or subtraction involves moving from one decade to the next. For example, 8 + 6 and 28 + 6 both involve ‘bridging the ten’. A common strategy that may be adopted by children when bridging the ten mentally is first to ‘make’ or ‘complete the ten’ – e.g.: 8 + 6 = 8 + 2 + 4 = 10 + 4 = 14, and 28 + 6 = 28 + 2 + 4 = 30 + 4 = 34. 19 The addition and subtraction level 2 subtasks were more conceptual than the addition and subtraction level 1 subtasks because the pupils had to understand what they were doing, and apply the level 1 skills. In other words, while the level 2 subtasks were not purely conceptual – because with time and practice, pupils will develop some automaticity with the types of items in these subtasks – they were more conceptual than the level 1 subtasks, especially for Primary 2 pupils.

32 | 2015 EGRA and EGMA in Ghana
Before responding to the items on most subtasks, pupils completed two practice items to ensure that they understood the instructions of the assessor. For the addition and subtraction level 2 and the word problem subtasks, pupils were allowed to use paper and pencil in order to help them solve problems if they wanted to, but they did not have to use these resources.
Both the addition and subtraction subtasks incorporated problems at two difficulty levels. Generally, the higher level 2 subtask items involved two-digit numbers and were not timed.
The 2015 EGMA was updated in a manner similar to the 2015 EGRA (described previously). The vast majority of items remained the same as in the 2013 instrument. Thus, the difficulty level of the 2015 instrument remained the same as that of 2013.
Accuracy scores were calculated and are reported for all of the subtasks. For the timed subtasks, accuracy was determined as the percentage of correct responses from the items attempted. For the untimed subtasks, accuracy was determined as the percentage of correct responses for the subtask. In addition, and to give a sense of fluency, the percentage of correct responses for the subtask was calculated and reported for the timed subtasks.
The skills tested in the EGMA subtasks were skills that Ghanaian pupils were expected to be familiar with, given curricular expectations. The EGMA usually takes from 15 minutes to 20 minutes to administer.
2.5 PUPIL QUESTIONNAIRE
The instrument set in both 2013 and 2015 also included a pupil questionnaire in each language, which the assessor administered before the EGRA/EGMA. It contained around 25 questions. Pupils were asked whether they had attended preschool or kindergarten, or spent time practicing reading at school and home. They were also asked if they had access to reading materials, had help to do their homework from a family member, and had been absent from school recently. Assessors asked pupils to show their textbooks and exercise books to ascertain resource availability and use. Questions about specific items they children might have at home (radio, phone, etc.) served as a proxy to roughly gauge families’ relative socioeconomic status.

2015 EGRA and EGMA in Ghana | 33
2.6 TEACHER QUESTIONNAIRE
In the 2015 EGRA/EGMA, a teacher questionnaire was introduced, in response to the 2013 pupil results, as well as other school-based assessment activities conducted by NEAU, which revealed that pupils are not always taught in the Ghanaian language assigned to the school, and in some cases, not taught in a Ghanaian language at all. Thus, NEAU and other stakeholders associated with the EGRA/EGMA wished to learn more about the language policy’s implementation from the teacher perspective.
The questionnaire was administered to P2 teachers of the pupils who took the assessments. The teacher questionnaire primarily sought to situate in context whether teachers had the requisite knowledge in Ghanaian language to use it as the language of instruction and to obtain information about their use of national languages as a language of instruction. The questionnaire also included a few items relating to supervision and support.
2.7 DISSEMINATION OF RESULTS
The 2013 EGRA/EGMA was conducted with a national sample of P2 pupils. At that time, the data were analysed and findings disseminated. Following the 2013 EGRA/EGMA and NEA, the GES’s National Education Assessment Unit disseminated results by leading District Cluster Forums (DCFs) that included all 216 districts throughout Ghana. These fora promoted dialogue among a broad base of district-level education stakeholders on the results of these assessments, and established District Advocacy Teams (DATs) for each district. The DATs planned and implemented community advocacy programs to further disseminate results and mobilize actions to support early grade learning around the country.
The dissemination of the results created awareness and attracted the attention of the media and the population, with each trying to reinforce
the need to strengthen the foundation of education through reading and numeracy.
2.8 STRUCTURE OF THIS REPORT
Sections 2.9 to 2.11 describe the methodology: sample design framework adopted, assessor train6ing, pilot testing, and how data were collected. Sections 3 and 4 then show the core EGRA and EGMA outcomes for each of Ghana’s 10 regions, with

34 | 2015 EGRA and EGMA in Ghana
disaggregations by deprived/non-deprived district, by urban/rural location, and by sex. Sections 5 and 6 describe pupil, teacher, and school characteristics, as well as key response trends from the pupil and teacher questionnaires. The report identifies key factors that influence pupils’ reading performance, as revealed by analysing the pupil questionnaire responses in conjunction with EGRA scores. Finally, Section 7 offers some overall conclusions from the study.
2.9 SAMPLE DESIGN
The 2015 sample was selected to be representative by language, region, deprived/non-deprived districts,20 urban/rural, and pupil sex. The subsections that follow explain the sampling procedures used.
2.9.1 POPULATION OF INTEREST
The population of interest for the EGRA and EGMA consisted of all schools, P2 classrooms, and P2 students who were attending a primary government school that had P2 enrolment of at least 10 pupils. The 2013–2014 EMIS data were used as the list frame for school selection. After exclusion of all non-primary schools, non-government schools, and schools with low P2 enrolment, the population of interest consisted of 13,442 schools with approximately half a million P2 pupils.
2.9.2 SAMPLE METHODOLOGY
The sample methodology called for a three-stage sample of schools, P2 teachers, and P2 pupils (see Table 4). First, 740 schools across 10 regions and 11 Ghanaian languages were sampled proportional to the P2 grade enrolment according the 2013–2014 EMIS data. Within each selected school, one P2 classroom was sampled with equal probability. Within the selected P2 classroom, ten P2 pupils (five boys and five girls) were sampled.
20 As noted in the data analysis report for the 2013 NEA: ‘Since 1999, Ghana’s government has classified roughly one third of the districts as deprived, based on various education outcome and resource indicators, including: gross enrolment rate (GER) in primary, gender parity, seats and core textbooks per pupil, share of schools needing major repairs, Basic Education Certificate Examination (BECE) pass rates in both English and mathematics, per pupil expenditure in primary, pupil–teacher ratio in primary, and the share of qualified primary teachers. The majority of districts in Ghana that are classified as ‘deprived’ are in one of the three northern regions (Northern, Upper East, Upper West)’ (p. 18). Source: Ministry of Education, Ghana Education Service, National Education Assessment Unit. (2014, May). Ghana 2013 National Education Assessment: Summary of results. Prepared for USAID under Ghana Testing, EdData II Task Order No. AID-641-BC-13-00001 (RTI Task 21). Research Triangle Park, NC: RTI International. http://pdf.usaid.gov/pdf_docs/PA00KS7M.pdf

2015 EGRA and EGMA in Ghana | 35
If there were fewer than five P2 girls at any given school, all the P2 girls in attendance were selected and additional P2 boys were chosen to obtain a total of 10 pupils (the same procedure was followed if there were fewer than five P2 boys). This situation of low numbers of pupils across both sexes occurred in only 8% of schools.
Table 4: Summary of the expected sample for Ghana national grade 2 EGRA/EGMA, mother tongue and English, 2015
Stage number Item sampled Stratified by… Probability of selection
Stage 1 Schools:
740 Region–language*
(25 strata) Proportional to school’s P2 enrolment**
Stage 2 P2 classrooms /
(teacher): 740
<none> 1 classroom (teacher)
per school Equal
Stage 3 Students:
7,400
Sex ~5 P2 boys ~ 5 P2 girls per school
Equal
*Sample size for a specific region–language was based on the percentage of P2 pupils who were instructed in the mother tongue in each given region.
**As indicated by the 2013–2014 EMIS data.
In order for the sample to be (1) linguistically representative at the national level, (2) regionally representative for the major language spoken in each region, and (3) regionally representative for English reading and math, a predetermined sampling methodology was established.
The sampling methodology was determined in the following manner, by region, and by language:
• Major language in the region: Either 45 or 55 schools were sampled, depending on the expected variability in pupil performance (according to 2013 EGRA data)21
• Language found in only one region: Either 45 or 55 schools were sampled, depending on the expected variability in pupil performance (according to 2013 EGRA data)
21 To explain further: 45 schools were chosen in regions that, in 2013, had a variability in scores (i.e., a smaller standard deviation); and 55 schools were chosen in regions that, in 2013, had greater variability in scores (i.e., a larger standard deviation). In this way the anticipated standard error in the point estimates would be at a level that would allow for comparisons over time.

36 | 2015 EGRA and EGMA in Ghana
• Language of instruction not the major language in the region: 5 to 25 schools were sampled, depending on proportion of language speakers in the population
The specific breakdown can be found in Table 5.
Table 5: Methodology used to determine the number of schools to sample in any given region/language
Percentage of enrolled P2 pupils instructed in the given mother tongue within each region Number of schools sampled
0–2% Exclude (too small of a representation) 2.1%–5.0% of region 5 schools 5.1%–10% of region 10 schools 10.1%–20% of region 20 schools
20+% of region 25 schools
Major language 45 or 55 schools
For example, if looking at the Greater Accra region (refer to Annex B, Table B1), the major LOI was Ga, with 70.5% of the P2 pupils in Greater Accra attending Ga schools, according to the 2013–2014 EMIS. Therefore, either 45 or 55 schools would be selected. It was determined that 55 schools should be selected for Greater Accra because the variance in pupils’ reading ability was much larger than the variance found in other regions/languages, according to the 2013 EGRA/EGMA data. Furthermore, 17.9% of the Greater Accra P2 students were attending schools where the LOI was Dangme, so 20 Dangme schools were randomly selected. Finally, 5 Akuapem Twi schools, 5 Asante Twi schools, and 5 Ewe schools were selected, because they each represented between 2.1% and 5.0% of the P2 students attending schools with those LOIs in Greater Accra.
The final 2015 sample size was 738 schools and 7,311 pupils (3,645 males and 3,666 females). Annex B contains additional tables with the final school sample counts for each region/language, final P2 pupil sample counts, and a full list of the region/language breakdowns.
2.10 ASSESSOR TRAINING AND PILOT TEST
Master trainers and assessors were trained in June 2015. Master trainers came from NEAU, EARC, and various GES offices, and were

2015 EGRA and EGMA in Ghana | 37
either experienced assessors from 2013 or high-level GES officials who had contributed to the instrument development process. Subsequently, the master trainers trained 174 assessors (134 male, 40 female) in an eight-day workshop at four regional training centres:
Accra, Tamale, Kumasi and Cape Coast. The majority of the assessors were recruited from among teachers and district officials of the GES, and about 70% of the assessors had experience with the 2013 EGRA/EGMA study. A total of 33 master trainers (26 male, 7 female) participated in a five-day workshop in Accra. Criteria for assessors were as follows:
• Background in teaching or working with children
• Able to read and speak a Ghanaian language fluently
• Comfortable using electronic devices
• Experience with research or data collection.
Assessors received training to establish a child-friendly atmosphere for testing, and to administer and score the EGRA and EGMA subtasks. Assessors learned how to administer the assessment on electronic tablets using a touch screen with Tangerine® software. Below are several screen captures from Tangerine to illustrate how the software appeared to the assessors.

38 | 2015 EGRA and EGMA in Ghana
Tangerine home screen, Akuapem Twi

2015 EGRA and EGMA in Ghana | 39
Letter-sound identification subtask with autostop invoked
Number identification subtask, Akuapem Twi
During training, assessor performance was monitored in a variety of ways. Master trainers observed assessors during practice sessions at the training venue and at a few selected schools located nearby, and looked for signs of improvement in assessors’ knowledge of instrument content, expertise in using the tablet, comfort engaging with pupils, and overall confidence and aptitude. Additionally, at three points during the training, assessors’ accuracy was formally measured to ensure that they were honing their EGRA administration

40 | 2015 EGRA and EGMA in Ghana
skills.22 This involved all assessors within a given language group administering the EGRA and EGMA to the same ‘child’ (a role played by a language expert), who made predetermined mistakes at various points in each subtask according to a script. In other words, the script was prepared ahead of time so that the ‘child’ would make the mistakes and the trainers would know later which responses all the assessors were expected to mark as correct or incorrect. Afterwards, assessors’ marked responses were compared to the script and scored. At the end of the training, the assessors, on average, attained a 99% score, which was higher than the required benchmark score of 90%. No assessors finished below the benchmark score.
The assessor training workshops were immediately followed by a pilot test, which took place over four days in May 2015. The pilot test was administered in 156 schools to 1,514 pupils (762 boys and 782 girls). Pilot data were then analysed to ensure that the instruments measured pupil performance as intended. The pilot test also provided another opportunity to evaluate assessors’ proficiency with the entire data collection exercise.
2.11 DATA COLLECTION
Data collection took place from July 2 to 17, 2015. This period marked the end of the school year for basic schools in Ghana.
The Tangerine software, which was designed specifically for education survey data collection, allowed assessors to gather all the data on the tablets rather than on paper, thus streamlining the data collection and cleaning process.
At the end of each school visit, the assessors uploaded the data from the tablet to a cloud-based central database via a mobile wireless router and modem. When a school was too remote for the team to locate an Internet WiFi signal using the router, or to tether by smartphone, the team waited until they were back in the nearest town to establish Internet access and upload the data. To prevent data loss, assessors would synchronize their tablets with one another, so that both tablets held all data from the school.
Supervisors, the majority of whom were master trainers, provided quality control checks during data collection. This included making daily visits to assessor teams at schools, being on call to provide
22 In previous EGRA/EGMA assessor training workshops, this process was referred to as interrater reliability (IRR) testing. However, because the process is not technically IRR by definition, it is now referred to as the assessor accuracy measure.

2015 EGRA and EGMA in Ghana | 41
guidance in the event that a team had trouble locating a school, identifying a replacement school, troubleshooting problems with the tablet devices, or speaking to school staff who had questions about the activity.
2.12 DATA COLLECTION CHALLENGES
Most of the challenges encountered during data collection were weather-related, given that the period for data collection, near the end of the school year, coincided with the rainy season. This could not be avoided, so assessor teams were outfitted with rain jackets and bags to protect materials. Roads were sometimes difficult to traverse, especially in the northern regions. Low or non-existent Internet connectivity at some schools also added a challenge to teams, which sometimes had to extend their day’s travel until they found a location from which to upload their data. Assessors were highly committed to carrying out their assigned tasks, and data quality was never negatively affected by the weather or connectivity challenges.

42 | 2015 EGRA and EGMA in Ghana
3 EGRA OUTCOMES
3.1 OVERVIEW OF EGRA TRENDS
Like the 2013 EGRA, the 2015 EGRA showed that by the end of P2, the majority of public school pupils could not yet read with comprehension – either in a Ghanaian language or in English. In every language, at least half, and often more, of the pupils assessed could not read a single word correctly. Some pupils had the ability to recognize a few words, but most of these pupils could not yet comprehend what they read. Of the pupils assessed in each language, in general 2% or less were able to read with fluency and comprehension.23
Most deprived districts (47 out of 74) are located in the northern regions and, therefore, when data were disaggregated to isolate pupils in schools in the three northern regions and pupils in the deprived regions, the performance results between the two groups were similar. Analyses showed that with the exception of the listening comprehension subtask, differences between boys’ and girls’ performance were small and not statistically significant. Finally, whereas there was a gap of only a few percentage points between urban and rural pupils scoring zero on the listening comprehension subtask, the gap rose to 14 percentage points for the oral reading fluency subtask.
3.2 EGRA RESULTS BY SUBTASK
3.2.1 LISTENING COMPREHENSION SUBTASK
The listening comprehension subtask measured oral language comprehension and vocabulary. For this subtask, each child listened to a story that the assessor read out loud, then orally answered three questions about the story. Listening comprehension is a prereading skill, and there is a strong link between a child’s ability to speak and
23 ‘…able to read with fluency and comprehension’ was defined as being able to correctly answer at least 4 (80%), or all 5 (100%) of the reading comprehension questions. In each language assessed, 2% or less of the pupils were able to read at this level, with the exception of pupils in Ewe schools, where 5% of pupils could read with fluency and comprehension.

2015 EGRA and EGMA in Ghana | 43
understand a language and his or her ability to learn to read in that language.
Listening comprehension was the only subtask in the EGRA where the percentage of pupils who scored zero was less than half across the Ghanaian LOIs (with the exception of Dagbani, for which 52.8% of pupils scored zero). In ten of the Ghanaian LOIs, most pupils were able to correctly answer at least one question, with zero score percentages in the single digits and teens in Fante (6.0%), Nzema (7.3%), Dangme (16.8%), and Ewe (19.1%) schools, up to just under half in Gonja schools (48.9%). In contrast, 81% of pupils scored zero on the English listening comprehension subtask. Thus, pupils performed better on the listening comprehension subtask in a Ghanaian LOI than English, as would be expected and as current research indicates.24
Figure 2 shows the percentage of pupils with zero scores for listening comprehension, by region and language. Scoring zero on this subtask indicates that, after listening to a short story that was read aloud to them by the assessor, pupils could not answer a single question about the story. With the exception of Greater Accra, where children are likely exposed to more oral English than elsewhere in Ghana’s other nine regions, there was a large difference between the percentage of zero scores for Ghanaian LOIs and English. The results show that pupils in nine of the ten regions (Ashanti, Brong Ahafo, Central, Eastern, Northern, Upper East, Upper West, Volta and Western) could understand the stories in the Ghanaian languages better than they could in English.
24 Scarborough, H. S. (2009). Connecting early language and literacy to later reading (dis)abilities: Evidence, theory, and practise. In F. Fletcher-Campbell, G. Reid, & J. M. Soler (Eds.), Approaching difficulties in literacy development: Assessment, pedagogy and programmes (pp. 23–38). London: Sage.

44 | 2015 EGRA and EGMA in Ghana
Figure 2: Listening comprehension – Percentage of pupils scoring zero, by language and region
Table 6 presents the zero scores for listening comprehension by sex and location. In the Ghanaian language, 24.7% of the males scored zero and 27.8% of the females scored zero, a difference that was only marginally statistically significant. The fact that a quarter of both boys and girls could not answer a single listening comprehension question correctly may say more about overall deficiencies in oral language learning in the Ghanaian languages than about differential instruction in this regard, with teachers generally not focusing or spending intentional instructional time on this.
For the English language, 79.5% of the males scored zero as opposed to 79.4% of the females, nearly identical rates whose difference was not statistically significant. Zero scores were significantly higher in deprived districts for both Ghanaian language and English. This is not surprising given the additional economic stressors that pupils, their families, and their schools experience in the deprived districts. Finally, because of the likely patterns of urban English usage (discussed in more depth in conjunction with oral passage reading), it is not surprising to see greater differences between urban and rural zero scores in English than in Ghanaian languages.
24.3% 24.6%
8.5%
19.5%
38.6%
51.3%47.3%
28.2% 25.4%
12.0%
82.2%87.8%
77.0%81.7%
39.0%
85.9%82.0%
92.1%
80.5% 79.0%
0.0%
20.0%
40.0%
60.0%
80.0%
100.0%
% z
ero
scor
es
Ghanaian Language English

2015 EGRA and EGMA in Ghana | 45
Table 6: Listening comprehension – Percentage of pupils scoring zero, by district type, urban/rural status, and male/female
Status Ghanaian LOI English
Non-deprived district 19.3%^ 76.1%^
Deprived district 43.1%*** 86.6%***
Urban 23.5%*** 65.8%***
Rural 27.3%^ 84.8%^
Male 24.7%^ 79.5%^
Female 27.8%** 79.4%
^ = reference value; *** p < 0.001.
3.2.2 LETTER-SOUND IDENTIFICATION SUBTASK
The letter-sound identification subtask measured pupils’ ability to provide the sound (i.e., phoneme) related to an individual letter. This foundational literacy contributes to later word identification. All selected pupils were shown 100 letters, both upper and lower case, arranged in a random sequence, and were asked to identify the sounds of as many letters as they could within one minute. If a pupil named the letter instead of the sound, failed to say anything at all, or gave the wrong sound, the response was marked as incorrect. Research has established letter-sound identification as a strong predictor of future reading ability.25
The proportion of pupils who could not identify the sound for a single letter (i.e., scored zero) ranged widely across the Ghanaian LOIs, from 14.8% to 71.5%. In English, 73.1% of pupils scored zero.
In the Ghanaian LOI assessments, the average score pupils received on letter-sound identification for each language was below 50% correct. Pupils’ performance ranged from 7.9% to 40.8% correct of those they attempted before running out of time, across languages. The fluency rate for this task ranged from 2 to 16 correct letter sounds per minute across languages. The national benchmarks for reading in Ghana, established in 2014, proposed 40 correct letter sounds per minute in Ghanaian language. Similarly, the average score for English was 10.7% correct letter sounds out of those attempted,
25 Adams, M. J. (1990). Beginning to read: Thinking and learning about print. Cambridge, Massachusetts, USA: Massachusetts Institute of Technology (MIT) Press.

46 | 2015 EGRA and EGMA in Ghana
resulting in an average fluency rate for expressing letter sounds of 3 correct letter sounds per minute. The benchmark proposed for English on this task is 35.26
Figure 3 shows performance in letter-sound identification in Ghanaian languages and English across regions. The percentages of zero scores for Ghanaian language ranged from 26.5% to 71.5% while those for English language ranged from 26.2% to 78.9%. More than half of the pupils in four regions (Brong Ahafo and the three northern regions) scored zero. If students are unable to decode letter sounds to this degree, their ability to advance to a higher order of reading skills is compromised. These findings may improve if teachers spend more time and emphasis on letter-sound instruction and practice in their classrooms.
Figure 3: Letter-sound identification – Percentage of pupils scoring zero, by language and region
Table 7 represents the percentages of pupils scoring zero on the letter-sound identification subtask, by district type, urban or rural status, and sex. In all cases except sex, the differences were statistically significant (p < 0.001).
26 A four-page report on the 2014 Ghana benchmarking activity can be found here: http://pdf.usaid.gov/pdf_docs/PA00KS7N.pdf
40.6%
57.5%
37.3%
26.5%
37.2%
52.1%
71.5%65.1%
33.8%
47.2%
38.3%
64.1%
39.8%
37.9%
26.2%
51.4%
73.6% 78.9%
48.8%50.7%
0.0%
20.0%
40.0%
60.0%
80.0%
100.0%
% z
ero
scor
es
Ghanaian Language English

2015 EGRA and EGMA in Ghana | 47
In the non-deprived districts, over a third (38.2%) of pupils scored zero in the Ghanaian LOI, as opposed to more than half (57.8%) in the deprived districts. The zero scores were even higher in both cases for English, as 42.0% of the pupils in the non-deprived districts scored zero and 62.8% in the deprived districts.
The percentage of pupils living in urban areas who scored zero was 33.5% in Ghanaian LOI and 32.9% in English. This result shows a striking similarity of urban pupils’ performance in English and Ghanaian LOI with respect to letter sounds. Pupils from rural areas had a higher proportion of zero scores in both Ghanaian LOI (48.1%) and English (54.8%) than did urban pupils, as well as a greater difference in average scores between the languages.
As noted above, the percentages of zero scores among males and females were not significantly different from a statistical perspective – 43.0% and 44.8% for Ghanaian language, and 47.8% and 49.6% for English – which diminishes the likelihood of classroom treatment that would have advantaged one sex over the other.
Table 7: Letter sound knowledge – Percentage of pupils scoring zero, by district type, urban/rural status, and male/female
Status Ghanaian LOI English
Non-deprived district 38.2%^ 42.0%^
Deprived district 57.8%*** 62.8%***
Urban 33.5%*** 32.9%***
Rural 48.1%^ 54.8%^
Male 43.0%^ 47.8%^
Female 44.8% 49.6%
^ = reference value; *** p < 0.001.
3.2.3 NONWORD DECODING SUBTASK
The nonword decoding subtask measured pupils’ ability to decode words and blend letter sounds together to pronounce words. Each pupil was shown 50 nonwords, mostly 3 letters in length. The pupil was given one minute to read as many nonwords as possible. Although the nonwords were not real words in the language of the assessment, they did follow the structure and orthography of the language. Using nonword decoding is helpful for noting a pupil’s

48 | 2015 EGRA and EGMA in Ghana
facility to apply phonics knowledge to unfamiliar words. The results suggest they did not have phonics knowledge.
Across the languages, whether LOI or English, most pupils scored zero on nonword decoding, which brings down the overall average scores. The highest average score out of the items pupils attempted was 16.2% correct, while the lowest was 1.3% correct, for Ewe and Kasem respectively. The fluency rate for this subtask ranged from 0.3 to 4.5 correct nonwords per minute (cnonwpm).
For the percentage of pupils who did not score zero, the highest average score of items pupils attempted was 58.3% correct for Ewe and the lowest was 37.3% correct for Dagaare. The average fluency rates for this category ranged from a low of approximately 9 cnonwpm to a high of 16 cnonwpm across all languages. The average score for pupils who scored above zero in English was 11.7 cnonwpm.
The benchmark proposed for this task is 25 correct nonwords per minute for Ghanaian language and 20 for English.
Figure 4 represents the percentage of pupils scoring zero in nonword decoding, by language and region. The graph shows a high proportion of zero scores for this subtask across the regions. The performance ranged from 73.8% to 97.2% zero scores for the Ghanaian languages, while English performance ranged from 52.6% to 92.0% zero scores. In other words, the majority of the pupils could not decode any of the nonwords presented in this subtask.
Table 8 shows the percentage of pupils scoring zero by district type, urban/rural status, and sex (p values for the level of statistical significance for each difference appear in a note to the table). Overall, pupils’ performance on the nonword decoding subtask was poor in both English and Ghanaian language. In non-deprived districts, the percentages of pupils who scored zero in Ghanaian language and in English were high (i.e., 79.7% and 72.1% respectively). Pupils in deprived districts recorded higher zero scores than those in non-deprived districts, both in English and in Ghanaian language.
As described above, the purpose of the nonword decoding subtask is to measure the extent to which pupils have learned how to blend individual letter sounds into new words. These findings showed that this skill is underdeveloped across Ghana, but most lacking in underresourced areas.
Sample nonword decoding items: Ewe language

2015 EGRA and EGMA in Ghana | 49
Figure 4: Nonword decoding – Percentage of pupils scoring zero, by language and region
Table 8: Nonword decoding – Percentage of pupils scoring zero, by district type, urban/rural status, and male/female
Status Ghanaian LOI English
Non-deprived district 79.7%^ 72.1%^
Deprived district 88.0%*** 83.1%***
Urban 75.4%*** 64.1%***
Rural 84.8%^ 80.2%^
Male 80.0%^ 73.9%^
Female 84.2%*** 77.5%**
^ = reference value; **p < 0.01, *** p < 0.001.
In both rural and urban areas, most pupils had difficulty decoding invented words, hence high zero scores (i.e., 84.8% and 75.4% respectively). Pupils’ performance, both urban and rural, in English showed similar high zero scores, although once again the zero scores for urban pupils on the English assessment were comparatively lower
84.7%90.8%
79.1% 74.9%73.8%
84.5%
97.2% 91.5%
76.2% 80.6%74.2%
86.1%
73.6%67.6%
52.6%
78.1%
92.0% 90.6%
72.0%76.4%
0.0%
20.0%
40.0%
60.0%
80.0%
100.0%
% z
ero
scor
e
Ghanaian Language English

50 | 2015 EGRA and EGMA in Ghana
than the others, suggesting some dissimilarities among that group in their exposure to English sounds and words.
By sex, on the Ghanaian LOI and English assessments, females had a higher rate of zero scores than their male counterparts, at 84.2% as opposed to 80.0% for Ghanaian LOI, and 77.5% compared to 73.9% for English. These findings were statistically significant and may be indicative of differences in instruction by sex.
3.2.4 ORAL PASSAGE READING SUBTASK
The oral passage reading subtask measured pupils’ ability to read connected text. Each pupil was shown a grade-appropriate short story and given one minute to read.
When beginning readers start to read connected text, they initially employ most of their cognitive resources in decoding and identifying the individual words of the text. They are attending to accuracy. Because they do not yet read words automatically, their short-term memory is almost entirely engaged in the decoding of words, leaving minimal cognitive resources to process meaning. As pupils gain decoding fluency (accuracy and automaticity), they use less short-term memory for decoding and are able to use sufficient cognitive resources to comprehend the meaning of the text. Thus, fluency in reading connected text is a prerequisite for comprehension.27
Overall, pupils’ performance was low for this task. The proportion of pupils scoring zero ranged from 54.5% to 92.5% in the Ghanaian LOIs. Just over half (51.1%) of pupils scored zero in English. Thus, more than half of the pupils assessed could not read aloud a single word in a passage in either the Ghanaian LOI or English.
In the Ghanaian languages, the lowest average score out of items pupils attempted was 2.9% correct and the highest score was 18.6% correct. The fluency rate in the Ghanaian languages ranged from 0.7 to 7.6 correct words per minute. Pupils scored an average of 20.3% correct of items attempted in English, with an average fluency rate of 6.3 correct words per minute. The EGRA reading passages were written and levelled to match Primary 2 expectations. These accuracy
27 Research on reading automaticity and working memory: Abadzi, H. (2006). Efficient learning for the poor. Washington, DC: The World Bank. https://openknowledge.worldbank.org/handle/10986/7023; and Hirsch Jr., E. D. (2003). Reading comprehension requires knowledge of words and the world: Scientific insights into the fourth-grade slump and the nation’s stagnant comprehension scores. American Educator (Spring), 10–44.

2015 EGRA and EGMA in Ghana | 51
percentages suggest that the pupils did not have the facility to read grade-level text.
An item analysis supported and explored this point further. These pupils were not skilled at identifying decodable words that represented the most common orthographic patterns learned in beginning-reading texts, such as the vowel-consonant pattern in the English word ‘in’. Phonics instruction should develop this skill. The item analysis also suggested that they were not learning high-frequency words that are common in connected text (e.g., ‘the’ and ‘she’ in English). High-frequency words are often taught as whole units so that pupils can engage with connected text while they learn phonics. Furthermore, the item analysis suggested minimal skill with words that represented the lexicon expectations of P2 pupils. Words that are in a pupil’s expressive and receptive vocabulary, such as the word ‘teacher’ in English, are used in levelled text.
Among pupils who did not score zero in the Ghanaian language, the lowest average score by language was 34.0% correct of those attempted and the highest was 66.7%. The fluency rate ranged from 6 to 32 words per minute. Among pupils who did not score zero in English on this subtask, the average performance was 41.5% correct of those attempted. The benchmark proposed for oral reading fluency is 40 correct words per minute for Ghanaian language and 45 for English.
Although there was a range of zero score percentages, among pupils who were able to read at least one word, the average fluency rates across all languages were lower than what is generally necessary to read with comprehension, as is shown in the next section, although there is no single fluency rate that is standard for all languages.
Figure 5 shows the proportion of zero scores on the oral passage reading subtask for Ghanaian LOI and English by region. There was a large difference in the percentages of zero scores between the Ghanaian LOIs and in English, with Ghanaian LOI zero scores ranging from 54.4% of pupils in Eastern region to 92.5% in Upper East, and English zero scores ranging from 17.1% in Greater Accra to 74.4% in Upper West. It is noteworthy that this difference between Ghanaian languages and English was minimal in the letter-sound and nonword subtasks analysed above. Additionally, the difference was largely the reverse (with more zero scores in English) for reading comprehension (see next section).

52 | 2015 EGRA and EGMA in Ghana
Furthermore, reading only one word correctly was enough to avoid a zero score on this subtask. Greater Accra had the lowest percentage of zero scores (Figure 5), while Upper West had the highest percentage of zero scores in English.
Figure 5: Oral passage reading – Percentage of pupils scoring zero, by language and region
As mentioned above, the difference in zero score percentages for oral reading fluency between Ghanaian LOI and English can likely be attributed to children having more exposure, both inside and outside of school, to written English than they have to written Ghanaian LOIs, such that they are able to recognize a few basic whole words in English.
Indeed, the item analysis of words in the English oral reading passage (Figure 6 below) revealed that pupils were able to read a few simple, common words at higher rates than they were able to read others in the story. In the first ten words of the passage, 41% to 56% of pupils were able to correctly read the following words: is, in, the, and Ama, while only 14% to 29% of pupils were able to correctly read the words there, no, doctor, village, where, and lives.
These pupils had not learned to identify words that represented the most common orthographic patterns learned in beginning-reading texts, such as the vowel-consonant pattern in the English word ‘in’. Phonics instruction should develop this skill. The item analysis also
70.3%
81.0%75.5%
54.4%
63.6%
79.1%
92.5%88.7%
69.9%
77.0%
28.8%
44.0%
33.7% 35.0%
17.1%
56.0% 53.8%
74.4%
36.6%42.2%
0.0%
20.0%
40.0%
60.0%
80.0%
100.0%
% z
ero
scor
e
Ghanaian Language English

2015 EGRA and EGMA in Ghana | 53
suggested that many were not learning high-frequency words that are common in connected text (e.g., ‘the’ and ‘she’ in English). High-frequency words are often taught as whole units so that pupils can engage with connected text while they learn phonics. Furthermore, the item analysis suggested minimal skill with words that represented the lexicon expectations of a P2 pupil. Words that are in a pupil’s expressive and receptive vocabulary, such as the word ‘teacher’ in English, are used in levelled text.
Figure 6: English oral reading fluency, item analysis
Table 9 shows the percentage of pupils scoring zero on the oral passage reading subtask, by district type, urban/rural status, and sex.
For the Ghanaian languages, deprived districts had the highest zero scores on average among all three disaggregated groups (82.1% zero scores), but performed marginally better in English (56.1% zero scores). In concert with the finding above for Greater Accra (Figure 6), which accounted for most of the urban population in the sample, zero scores in English for oral passage reading were markedly lower for urban pupils.
There were no differences – statistically significant or otherwise – in the percentages of zero scores between male and female students, for Ghanaian LOI or English.
As stated above, the lower percentages of zero scores in English, compared to Ghanaian LOI, were out of step with the findings from the earlier subtasks, which did not suggest that pupils performed significantly better in English. Furthermore, as will be seen in the next section on reading comprehension, this gap in performance did not extend to comprehension. The oral reading fluency findings should not be considered in isolation. Thus, given the lack of decoding and
71%44%
77% 85%53% 54%
78% 86%58%
83%
29%56%
23% 15%46% 45%
22% 14%41%
16%
0%10%20%30%40%50%60%70%80%90%
100%
Incorrect Correct

54 | 2015 EGRA and EGMA in Ghana
comprehension skills in English, once again the likely explanation for the lower percentage of zero scores is exposure to a few very basic English words.
Table 9: Oral passage reading – Percentage of pupils scoring zero, by district type, urban/rural status, and male/female
Status Ghanaian LOI English
Non-deprived district 69.4%^ 32.9%^
Deprived district 82.1%*** 56.1%***
Urban 63.0%*** 24.2%***
Rural 77.2%^ 46.6%^
Male 73.2%^ 40.6%^
Female 73.1% 40.1%
^ = reference value; *** p < 0.001.
3.2.5 READING COMPREHENSION SUBTASK
The reading comprehension subtask measured pupils’ ability to understand the text that they had just read aloud. This skill is the ultimate goal of literacy instruction. For each short story used in the oral passage reading subtask, there were five comprehension questions. Once the oral passage reading subtask was completed, the assessor asked the pupil the comprehension questions, but only those that corresponded to the portion of the story passage the pupil was able to read within the one-minute time limit. Thus, if the pupil was able to read only the first sentence of the passage, the assessor asked the pupil only the first question. The preliminary questions assessed direct recall, while subsequent questions were inferential in nature.
Among those who attempted to answer at least one comprehension question, zero score percentages ranged broadly across the Ghanaian LOIs, from 29.3% scoring zero in Dangme schools to 89.6% in Kasem schools. Except in Akuapem Twi and Ga schools (many of which were in metropolitan settings), pupils performed worse in English reading comprehension than they did in Ghanaian LOI reading comprehension, in all languages.
More importantly, the difference in average reading accuracy of 11.1% (Ghanaian languages) and 20.3% (English) is not that

2015 EGRA and EGMA in Ghana | 55
meaningful. These pupils had minimal to no word recognition skills. Without the ability to read words, the pupils should not be expected to understand (what they cannot read). This finding may seem contrary to pupil performance on the oral passage reading subtask, where pupils seemed to perform better in English, but the in-depth item analysis of pupil performance on the English reading passage described above revealed that pupils were frequently able to correctly ‘read’ a few very basic English words in the text (such as ‘is’ and ‘the’). Again, correctly giving even one word was enough to prevent pupils from receiving a zero score.
For all 12 languages assessed, the percentages of pupils not scoring zero – i.e., they were able to answer at least one of the comprehension questions correctly – averaged about 9%, with the range being 21.7% (Dangme) to 0.8% (Kasem). The benchmark proposed for reading comprehension is 80% for both Ghanaian language and English.
Thus, while pupils generally performed worse in English reading comprehension than in a Ghanaian LOI, it remains true that pupils who were able to read with comprehension at the end of P2 were a distinct minority in Ghana. This suggests that reading instruction that focuses on the fundamental building blocks of literacy either is not taking place or is ineffective.
Figure 7 shows the percentage of zero scores in reading comprehension by language and region for pupils who attempted this subtask. The percentage of zero scores was above 50% in all regions and languages, with the exception of English in Greater Accra (47.2%), and Ghanaian LOI in Eastern (37.0%) and Western (45.6%). In most cases, pupils performed worse in English reading comprehension than in the Ghanaian LOI, although the reverse was true in Eastern, Greater Accra, and Upper East regions, with Greater Accra again having the largest difference in zero score percentages.
This means that while pupils appear to have been able to read more in English than in the Ghanaian LOIs, for the most part, they were not understanding what they read. Reading with comprehension is the goal of literacy instruction and most later learning depends upon it. Most pupils in Ghana are not able to read with comprehension by the end of P2 because they lack the foundational building blocks to literacy.

56 | 2015 EGRA and EGMA in Ghana
Figure 7: Reading comprehension – Percentage of pupils scoring zero, by language and region, of those who attempted the subtask
Table 10 presents the percentage of pupils who scored zero in reading comprehension by district type, urban/rural status, and sex on the reading comprehension subtask. Again, these are pupils who attempted at least one reading comprehension question and scored zero; pupils who scored zero on the previous oral passage reading subtask were removed from this analysis.
Generally, pupils had high zero scores both in the Ghanaian LOI and in English. The zero score percentage among pupils in deprived districts was higher in English compared to pupils in non-deprived districts (85.9% vs. 69.3%). Pupils in the urban areas showed parity between their (high) zero scores for Ghanaian language and English, while pupils in rural areas, similar to those in deprived districts, performed worse in English (80.4% zero scores) than in the Ghanaian LOI (61.6%).
Both males and females likewise had high zero scores in both English and Ghanaian LOI; the differences between the scores for boys and girls were not statistically significant.
These results show that on the whole, these groups of pupils struggled to answer questions about passages they read in either language.
68.0%65.3%
37.0%
76.4%73.0%
56.1%
89.6%
79.9%
58.7%
45.6%
75.6% 78.1%74.0%
68.8%
47.2%
86.5% 86.2% 87.3%
76.1%71.5%
0.0%
20.0%
40.0%
60.0%
80.0%
100.0%
Ashanti BrongAhafo
Central Eastern GreaterAccra
Northern UpperEast
UpperWest
Volta Western
% z
ero
scor
es
Ghanaian Language English

2015 EGRA and EGMA in Ghana | 57
Table 10: Reading comprehension – Percentage of pupils scoring zero, by district type, urban/rural status, and male/female
Status Ghanaian LOI English
Non-deprived district 61.2%^ 69.3%^
Deprived district 67.8% 85.9%***
Urban 63.7%^ 60.5%^
Rural 61.6% 80.4%***
Male 59.8%^ 74.4%^
Female 65.2% 71.6%
^ reference value; *** p < 0.001.
3.3 WHAT DO WE KNOW ABOUT PUPILS WHO CAN READ?
There are many factors that can impact pupil performance. Time on task in school, having reading materials available to read and time to practice reading, being read to, attending school, and arriving at school well nourished all have been shown over and over again to be associated with pupil performance. Analysis of pupils who were able to read showed that these relationships held true in the Ghanaian context as well. While the above discussion of EGRA findings showed that the majority of P2 pupils in Ghana were unable to read, the researchers were also interested in learning as much as possible about what characterized the minority of pupils who could read.
For this logistic regression analysis, ‘pupils who can read’ were defined as those whose oral reading fluency score was 20 words per minute or greater (in English). This score was selected because it corresponded with pupils’ ability to correctly answer at least some comprehension questions, meaning that these pupils were able to read with enough fluency and accuracy to understand what they read. The p-value for each factor listed is 0.01 or less. Using the logistic regression models, it became possible to identify the characteristics of pupils who could read with understanding. According to their own

58 | 2015 EGRA and EGMA in Ghana
responses during the pupil interview, these pupils were significantly more likely to:28
• Be of normal age for P2 (compared with being over age; refer to Section 5, pupil demographics)
• Have attended preschool and/or kindergarten
• Attend school regularly
• Have an exercise book
• Have books and reading materials at home (apart from school textbooks)
• Spend time at school reading on their own
• Practise reading out loud at home
• Have someone at home who reads to them
These characteristics were found to be significantly correlated with reading ability. Thus, in addition to improving approaches to literacy instruction – primarily with regard to the most foundational elements of reading – efforts to increase these behaviours or characteristics are likely to have a positive impact.
Unfortunately, relatively few pupils attended school regularly and few read or had access to books in the school LOI at home or in school. See Section 5 for more detail on pupil demographics.
28 For the most part, the pupil questionnaire asked one or two “Yes/No” questions for each characteristic listed below. For example, regarding attendance, the pupils were asked “Were you absent from school on any days last week?”

2015 EGRA and EGMA in Ghana | 59
4 EGMA OUTCOMES
4.1 OVERVIEW OF EGMA TRENDS
Like the 2013 EGMA, the 2015 EGMA (see Table 11, repeated from the Executive Summary for convenience) showed that by the end of P2, the majority of public school pupils were not doing mathematics beyond the most procedural level. The most evident trend (refer to Figure 8, also repeated) is that at the end of P2, pupils were doing reasonably well on the most procedural items – number identification, addition level 1 and subtraction level 1 – with pupils scoring on average between 46% and 72% correct on these subtasks.29 That said, the pupils did better on addition level 1 (with an average of only 9.6% zero scores) than on subtraction level 1, with 22.1% of the pupils unable to answer a single subtraction level 1 item correctly – the easiest of these items being: 4 – 1 = iiii. When it came to the
more conceptual items, the pupils still fared reasonably well on the quantity discrimination subtask, averaging 65.4% correct out of the items attempted. However, on the missing number, addition level 2 and subtraction level 2 subtasks, there was a sharp drop-off in performance, with 73.2% of the pupils unable to answer a single subtraction level 2 item correctly – the easiest of these being 19 – 6 = iiii. This stark difference in performance between the procedural and conceptual subtasks suggests a lot about how children in Ghana are likely to experience school mathematics.
It is clear from the EGMA data that Ghanaian pupils have difficulty with mathematics beyond the memorisable level. Pupils tend to memorize facts, rules and procedures rather than learning the basic concepts needed to make meaning. The EGMA results show that as a whole, Ghana’s pupils do not have the foundational skills required to grasp the basic concepts in mathematics, or to use these skills in situations that require them to understand these basic concepts.
29 As indicated in Section 1.2, footnote 6, the 2014 Ghana benchmarking exercise (see http://pdf.usaid.gov/pdf_docs/PA00KS7N.pdf) set mathematics benchmarks for addition and subtraction level 2, missing number, and problem solving (word problems).

60 | 2015 EGRA and EGMA in Ghana
Table 11: 2015 performance on EGMA subtasks
EGMA subtasks
% correct / attempted
% correct / total
% zero scores
Number identification‡ 71.5% (71.7%)
0.8%
(0.6%)
Addition (level 1) ‡ 62.5 (63.3%)
9.6%
(8.1%)
Subtraction (level 1) ‡ 45.8 (48.7%)
22.1%
(19.3%)
Quantity discrimination
65.4% (64.9%)
3.3% (3.5%)
Missing number
26.7% (26.2%)
6.5% (7.6%)
Addition (level 2)
19.6% (21.4%)
51.7% (50.6%)
Subtraction (level 2)
9.7% (11.8%)
73.2% (69.9%)
Word problems
40.1% (40.0%)
8.7% (9.1%)
Note: the values in parentheses represent the scores from the 2013 survey, for comparison. ‡ These tasks were timed, and the means reported for these subtasks are the mean number of correct responses in terms of the number of items attempted. For all other subtasks, the means reported represent the number of correct responses in terms of the number of items.
Figure 8: 2015 performance on EGMA subtasks
NumberIdent. Addition L1 Subtraction
L1QuantityDiscrim.
MissingNumber Addition L2 Subtraction
L2Word
ProblemsProcedural knowledge (recall)
(%correct/attempted) Conceptual knowledge (application) (%correct)
All 71.5 62.5 45.8 65.4 26.7 19.6 9.7 40.1
0
10
20
30
40
50
60
70
80
90
100
Mea
n P
erce
ntag
e C
orre
ct

2015 EGRA and EGMA in Ghana | 61
4.2 EGMA RESULTS BY SUBTASK
4.2.1 NUMBER IDENTIFICATION
Number identification is to mathematics what letter recognition is to reading. If pupils cannot identify numbers, they cannot engage effectively in all aspects of mathematics.
The number identification subtask assessed the most procedural of mathematical skills and was the least demanding of the Ghana EGMA subtasks.
With the exception of item 11 (the number 91), which was correctly identified by 72% of the pupils, the pupils scored between 79% and 93% percent correct on the one- and two-digit numbers. This is perfectly acceptable for Primary 2 when compared with the expectations of the curriculum. There was, however a sharp drop-off in performance as the items changed from one- and two-digit numbers to three-digit numbers, with between 21% and 26% of the pupils being
able to identify each of the numbers (245; 587; 731; and 989). Interestingly, only 14% of the pupils could identify the number 108 correctly.
The difference in performance on the one- and two-digit number items and the three-digit number items can in all likelihood be explained in terms of curricular expectations and the pupils’ experience with these numbers.
Table 12 shows the mean score and the percentage of pupils scoring zero on the number identification subtask, by district type, urban/rural status, and male/female.
Pupils in non-deprived districts, pupils in urban regions, and male pupils all performed respectively better than the pupils in deprived districts, pupils in rural regions, and female students. While the differences for mean scores are all statistically significant, they are not large (i.e., about 1 to 3 percentage points). Differences in the percent zero scores are even less, from 0 to 1.8 percentage points.
Number identification items
5 9 0 12 30
22 54 39 23 48
91 33 70 87 65
108 245 587 671 989

62 | 2015 EGRA and EGMA in Ghana
Table 12: Number identification – mean score and percentage of pupils scoring zero, by district type, urban/rural status, and male/female
Status Mean % Zero
Non-deprived district 19.4^ 0.2***
Deprived district 17.0*** 2.0%^
Urban 20.9*** 0.3^
Rural 17.8^ 1.0*
Male 19.0** 0.7*
Female 18.3^ 0.0^
^ = reference value; *p < 0.05; **p < 0.01; ***p < 0.001.
4.2.2 ADDITION AND SUBTRACTION LEVEL 1
The level 1 addition and subtraction subtasks consisted of items for which it was expected that pupils should have developed some level of automaticity/fluency. The items on these subtasks represented the foundational addition and subtraction ‘facts’ that are at the heart of addition and subtraction with larger numbers. Without pupils achieving some level of automaticity/fluency on the range of addition and subtraction ‘facts’ represented by these items, there is little expectation that they will be able to perform addition and subtraction (let alone multiplication and division) with larger numbers. That said, success in answering these questions, while necessary, is not
sufficient to ensure success on the level 2 items.
Figure 9 shows the performance on the addition level 1 subtask items. Pupils performed best on items involving addition of two single-digit numbers with sums less than 10 or 10. Pupils obtained between 56% and 84% correct on these items. They had difficulty in adding a single-digit number to a two-digit number (35% to 50% correct) and in adding two single-digit numbers with sums of more than 10 (33% to 40% correct).
Sample addition and subtraction level 1 items
1 + 3 = iiii 4 – 1 = iii
3 + 2 = iiii 5 – 2 = iii
6 + 2 = iii 9 – 3 = iii
4 + 5 = iii 9 – 5 = iii
4 + 4 = iii 6 – 3 = iii

2015 EGRA and EGMA in Ghana | 63
Figure 9: 2015 item-level performance on the addition level 1 subtask
Figure 10 shows the performance on the subtraction level 1 subtask items. In general, as the item difficulty level increased, pupil performance declined dramatically, from a high of 67% mean score on a single-digit item to a low of 9% on a two-digit item.
Pupils’ performance in terms of subtracting a single-digit number from another single-digit number fell within the interval of 33% correct and 67% correct, while pupils’ performance scores in subtracting single-digit numbers from 10 were between 45% and 60% correct.
As could be expected at the more difficult end of the spectrum of subtraction level 1 items, pupils appeared to have more difficulties with subtracting single-digit numbers from two-digit numbers, with or without bridging (between 13% and 26% correct).
1+3 3+2 6+2 4+5 4+4 8+1 7+3 2+7 5+5 3+7 11+3
1+14
13+4
16+3 8+5 7+8 9+7 8+8 10+
28+1
0
single-digit to single-digit, nobridging the ten completing the ten
adding a single-digitto a two-digit
number
single-digit addition,bridging the ten
adding toten
%correct /attempted 84.0 76.7 66.8 60.0 77.5 76.7 59.3 58.2 78.2 54.8 50.3 44.6 34.9 46.6 38.5 32.6 33.3 40.0 45.9 41.6
0
10
20
30
40
50
60
70
80
90
100
Perc
enta
ge c
orre
ct

64 | 2015 EGRA and EGMA in Ghana
Figure 10: 2015 item-level performance on the subtraction level 1 subtask
Table 13 shows the mean score and the percentage of pupils scoring zero on the addition level 1 subtask, by district type, urban/rural status, and male/female.
Pupils in non-deprived districts, pupils in urban regions, and male pupils all performed respectively better than the pupils in deprived districts, pupils in rural regions, and female students. While the differences are all statistically significant, they are only about 1 percentage point for the mean scores, although they are larger (between 3 and 6 percentage points) for the percent zero scores. The larger percentage of zero scores in all likelihood accounts for the difference in the mean score.
4-1 5-2 9-3 9-5 6-3 9-1 9-6 10-3 10-5 10-8 14-3 17-4 19-3 15-6 15-7 16-9 16-8 14-12 12-2 18-
10
single-digit from single-digitsingle-digitsubtracting
from ten
single-digitfrom double-
digit, nobridging
single-digit fromdouble digit,
bridgingsub. ten
%correct/attempted 67.3 62.4 36.5 41.1 57.3 57.9 33.3 44.6 60.4 46.0 26.4 19.7 19.7 20.0 18.6 13.4 16.2 13.4 14.1 9.0
0
10
20
30
40
50
60
70
80
90
100
Per
cent
age
corr
ect

2015 EGRA and EGMA in Ghana | 65
Table 13: Addition level 1 – mean score and percentage of pupils scoring zero, by district type, urban/rural status, and male/female
Status Mean % Zero
Non-deprived district 8.7^ 7.7%***
Deprived district 8.0** 13.6%^
Urban 9.6*** 5.6%^
Rural 8.1^ 11.1%***
Male 8.7** 8.1%***
Female 8.3^ 11.1%^
^ = reference value; *p < 0.05; **p < 0.01; ***p < 0.001.
Table 14 shows the mean score and the percentage of pupils scoring zero on the subtraction level 1 subtask, by district type, urban/rural status, and sex.
Pupils in non-deprived districts, pupils in urban regions, and male pupils all performed respectively better than the pupils in deprived districts, pupils in rural regions, and female students. While the differences are all statistically significant, they are only about 1 percentage point for the mean scores, although they ranged from 5.7 to 10.9 percentage points for the percent zero scores. The larger percentage of zero scores in all likelihood accounts for the difference in the mean score.
Table 14: Subtraction level 1 – mean score and percentage of pupils scoring zero, by district type, urban/rural status, and male/female
Status Mean % Zero
Non-deprived district 5.9^ 18.6%***
Deprived district 4.9*** 29.5%^
Urban 6.6*** 16.4%^
Rural 5.2^ 24.3%***
Male 5.9*** 19.3%***
Female 5.3^ 25.0%^
^ = reference value; *p < 0.05; **p < 0.01; ***p < 0.001.

66 | 2015 EGRA and EGMA in Ghana
4.2.3 QUANTITY DISCRIMINATION
The quantity discrimination subtask in the EGMA in Ghana measured pupils’ ability to make judgements about differences by comparing
quantities, represented by numbers. The subtask measured the pupils’ sense of magnitude – Did they have a sense of how big a number/quantity was, and could they compare two numbers/quantities? Being able to compare numbers/quantities is a foundational mathematical skill that is critical to effective and efficient problem-solving strategies. For example, being able to compare numbers/quantities is important when estimating the reasonableness of answers to problems. In the early school years, this means developing an awareness that addition results in a larger number, subtraction produces an answer
that is smaller than at least one of the original numbers, multiplication can result in answers that are larger than the addition of the same numbers, and so on.
A distinct pattern emerged in the pupils’ responses. Between 80% and 95% of the pupils could correctly discriminate between the quantities represented by the pairs in the first three items – pairs of quantities (numbers) less than 50. Between 75% and 80% of pupils could correctly discriminate between quantities represented by numbers in the range from 50 to 99, and between 43% and 65% of pupils could discriminate between quantities represented by three-digit numbers. In all likelihood, the difference in performance on items involving two-digit numbers and items involving three-digit numbers was a function of the different amount of time spent working on the various number ranges in class. That pupils performed better in the higher number ranges for quantity discrimination than they did for number identification is in all likelihood related to the fact that in the quantity discrimination subtask, they had to choose one of two numbers.
Table 15 shows the mean score and the percentage of pupils scoring zero on the quantity discrimination subtask, by district type, urban/rural status, and male/female.
Pupils in non-deprived districts, pupils in urban regions, and male pupils all performed respectively better than the pupils in deprived districts, pupils in rural regions, and female pupils. The differences in both the means and the percent zero scores are all statistically significant and are larger than the differences observed on the more procedural subtasks. For mean scores, the differences ranged from
Quantity discrimination items
7 5 94 78
11 24 146 153
47 34 287 534
58 49 623 632
65 67 967 965

2015 EGRA and EGMA in Ghana | 67
3.2 to 13.0 percentage points; for percent zero scores, from 0.6 to 4.8 percentage points.
Table 15: Quantity discrimination – mean score and percentage of pupils scoring zero, by district type, urban/rural status, and male/female
Status Mean % Zero
Non-deprived district 69.6^ 1.8%***
Deprived district 56.6*** 6.6%^
Urban 73.0*** 1.0%^
Rural 62.5^ 4.2%***
Male 67.0*** 3.0%
Female 63.8^ 3.6%^
^ = reference value; *p < 0.05; **p < 0.01; ***p < 0.001.
4.2.4 MISSING NUMBER
Mathematics is the study of patterns. Determining missing numbers is an important mathematical skill that involves pattern recognition and extension. Being able to recognize number patterns – including counting patterns (by ones, tens, hundreds, fives and twos, etc., both forwards and backwards) – lays the foundation for other mathematical concepts, including multiplication and division and, later, algebra. Being able to identify patterns more generally aids pupils in problem solving.
Figure 11 illustrates the performance of pupils on the missing number items. The following trends can be seen:
• Pupils performed best on the missing number items with a step size of 1 and in a lower number range (90.1% correct for the 5, 6, 7, __problem and 72.2% correct for the 14, 15, __, 17 problem). As the number range increased, pupils did not perform as well (9.5% correct for the 348, 349, __, 351 item). This correlates with results on the number identification subtask (see Section 4.2.1), on which the pupils struggled with numbers greater than 100.
• On the two items that involved multiples of 10 (30, __, 50, 60) and 100 (___, 300, 400, 500) with corresponding step sizes,
Sample missing number items
5 6 7
14 15 17
30 50 60
300 400 500
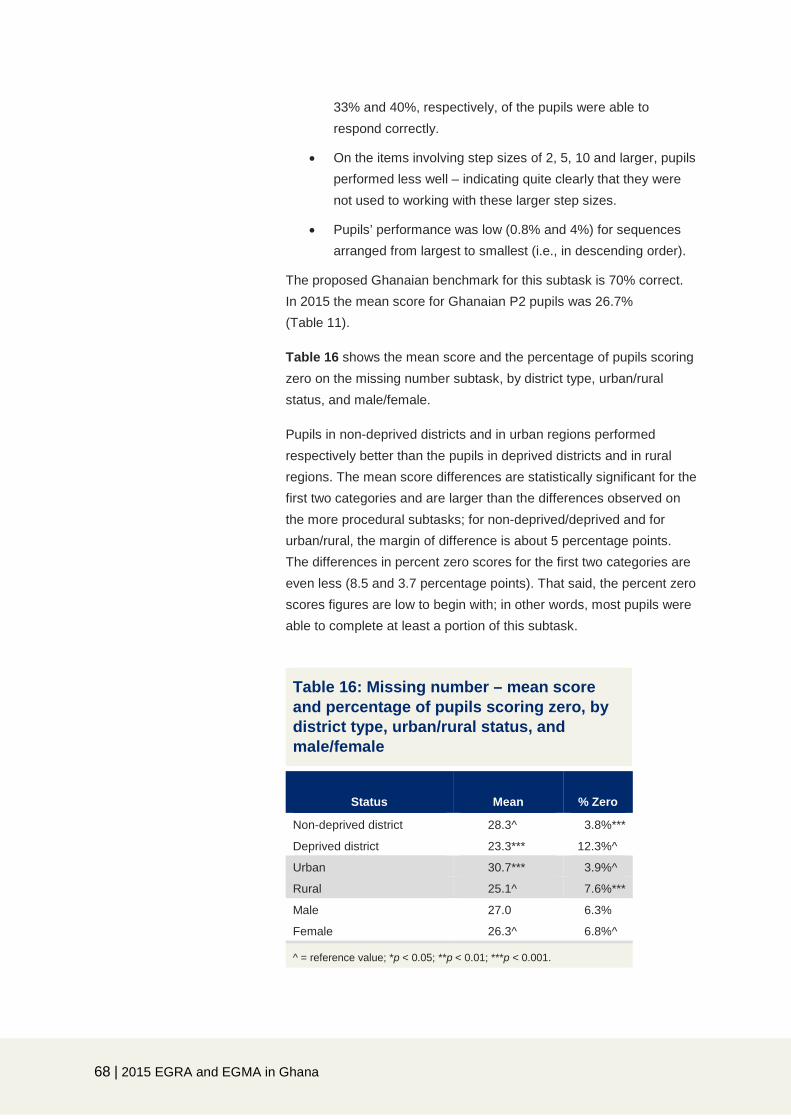
68 | 2015 EGRA and EGMA in Ghana
33% and 40%, respectively, of the pupils were able to respond correctly.
• On the items involving step sizes of 2, 5, 10 and larger, pupils performed less well – indicating quite clearly that they were not used to working with these larger step sizes.
• Pupils’ performance was low (0.8% and 4%) for sequences arranged from largest to smallest (i.e., in descending order).
The proposed Ghanaian benchmark for this subtask is 70% correct. In 2015 the mean score for Ghanaian P2 pupils was 26.7% (Table 11).
Table 16 shows the mean score and the percentage of pupils scoring zero on the missing number subtask, by district type, urban/rural status, and male/female.
Pupils in non-deprived districts and in urban regions performed respectively better than the pupils in deprived districts and in rural regions. The mean score differences are statistically significant for the first two categories and are larger than the differences observed on the more procedural subtasks; for non-deprived/deprived and for urban/rural, the margin of difference is about 5 percentage points. The differences in percent zero scores for the first two categories are even less (8.5 and 3.7 percentage points). That said, the percent zero scores figures are low to begin with; in other words, most pupils were able to complete at least a portion of this subtask.
Table 16: Missing number – mean score and percentage of pupils scoring zero, by district type, urban/rural status, and male/female
Status Mean % Zero
Non-deprived district 28.3^ 3.8%***
Deprived district 23.3*** 12.3%^
Urban 30.7*** 3.9%^
Rural 25.1^ 7.6%***
Male 27.0 6.3%
Female 26.3^ 6.8%^
^ = reference value; *p < 0.05; **p < 0.01; ***p < 0.001.

2015 EGRA and EGMA in Ghana | 69
Figure 11: 2015 item-level performance on the missing number subtask
4.2.5 ADDITION AND SUBTRACTION LEVEL 2
The level 2 EGMA subtasks gauged pupils’ understanding of addition and subtraction as well as their ability to apply the procedural knowledge assessed in the corresponding level 1 subtasks to more complex tasks. Pupils who did not solve a single problem correctly on the level 1 items (i.e., 9.6% of the pupils in the case of addition level 1 and 22.1% in the case of subtraction level 1; see Table 11) were not asked to solve the level 2 problems and were treated as pupils with a zero score for the task.
In 2015, 51.7% of the pupils who attempted addition level 2 subtask items and 73.2% of the pupils who attempted subtraction level 2 subtask items were unable to answer a single item correctly (Table 11). This is in stark contrast to pupil performance on the addition level 1 (9.6% zero score) and subtraction level 1 (22.1% zero score) subtask items.
Figure 12 shows clearly that pupils who had done well enough on the level 1 items to attempt addition and subtraction level 2 had difficulty with these items. The proportion of correct answers ranged from 4.4% to
42.2% for addition level 2 and subtraction level 2 combined. For both addition and subtraction, pupils struggled with addition and
5, 6, 7, _ 14, 15, _,17
30, _, 50,60
_, 300,400, 500 2, 4, 6, _ 348, 349,
_, 35128, _, 24,
2230,35, _,
45320, 310,
300, _3, 8, _,
18% correct 90.1 72.2 33.4 39.5 12.8 9.5 4 19.4 0.8 4.8
0
10
20
30
40
50
60
70
80
90
100
Perc
enta
ge C
orre
ct
Addition and subtraction level 2 items
13 + 6 = iiii 19 – 6 = iii
18 + 7 = iii 25 – 7 = iii
14 + 25 = iii 39 – 14 = iii
22 + 37 = iii 59 – 37 = iii
38 + 26 = iii 64 – 26 = iii

70 | 2015 EGRA and EGMA in Ghana
subtraction calculations, especially where bridging (see footnote 18) was required.
The proposed Ghanaian benchmark for this subtask is 80% correct. In 2015, the mean scores for all Ghanaian P2 pupils who attempted it were 19.6% for addition and 9.7% for subtraction (Table 11).
Figure 12: 2015 item-level performance on the addition level 2 and subtraction level 2 subtasks
Table 17 shows the mean scores and the percentages of pupils scoring zero on the addition and subtraction level 2 subtask, by district type, urban/rural status, and male/female.
Pupils in non-deprived districts, pupils in urban regions, and male pupils all performed respectively better than the pupils in deprived districts, pupils in rural regions, and female pupils. For the mean scores, only the differences for urban/rural and male/female are statistically significant, although the differences are not large (4.6 and 1.0 percentage points); but then the mean scores for all groups were not very high at all (from 13.4% to 18.0% correct).
13+6 18+7 14+25 22+37 38+26 19-6 25-7 39-14 59-37 64-26Addition Level 2 Subtraction Level 2
%correct 42.17 31.63 12.72 7.46 6.91 21.71 14.78 6.23 4.4 3.19
0
10
20
30
40
50
60
70
80
90
100
Per
cent
age
of p
upils
resp
ondi
ng c
orre
ctly

2015 EGRA and EGMA in Ghana | 71
Table 17: Addition and subtraction (level 2) – mean score and percentage of pupils scoring zero, by district type, urban/rural status, and male/female
Status Mean % Zero
Non-deprived district 14.8^ 49.9%*
Deprived district 14.4 51.1%^
Urban 18.0*** 37.3%^
Rural 13.4^ 51.6%***
Male 15.2* 46.6%
Female 14.2^ 48.7%^
^ = reference value; *p < 0.05; **p < 0.01; ***p < 0.001.
4.2.6 WORD PROBLEMS
The numerical values involved in the word problems were deliberately small (single-digit arithmetic) so as to allow for the targeted skills to be assessed without confounding problems with calculation skills that might otherwise impede performance. Pupils were allowed to use paper and pencil, and counters (objects) if they wished, in order to help them solve/model these problems – although they did not have to use these resources.
The word problems (see Figure 13) were deliberately designed to provoke the pupils into making different plans:
• Item 1 had a ‘change – result unknown’ structure and was designed to provoke a subtraction or counting-back type strategy.
• Item 2 had a ‘combine – total unknown’ structure and was designed to provoke an addition or counting-on type strategy.
• Item 3 had a ‘compare – part unknown’ structure and was designed to provoke either an addition/counting-on or subtraction/counting-back type strategy.
• Item 4 had a ‘change – start unknown’ structure and was designed to provoke an addition or counting-on type strategy. Problem 4 was conceptually more demanding than Problem 1 because the starting value was unknown and needed to be determined.

72 | 2015 EGRA and EGMA in Ghana
• Item 5 had a ‘sharing’ structure. Sharing is a familiar activity in the lives of children, and many children can model and solve this problem using counters long before they start school.
• Item 6 had a ‘multiplication (grid/array)’ structure. While it was a little harder than Item 5, many children are nonetheless able to model and solve this type of problem using counters before they start school.
Figure 13: 2015 item-level performance on the word problem subtask
Table 11 above showed that the Primary 2 pupils scored, on average, 40.1% on the word problems subtask items. This was markedly better than the performance on the other conceptual subtasks: missing number (26.7%), addition level 2 (19.6%) and subtraction level 2 (9.7%). At first look, this seems encouraging, as it may suggest that the Ghanaian pupils, while struggling to apply their basic/foundational mathematical knowledge/skills in a more conceptual context, were nonetheless able to solve problems correctly when these were posed in more familiar (everyday) contexts.
In general, pupils performed very well on the first two items (88.3% of the pupils correctly answered Item 1 and 66.2% of the pupils correctly answered Item 2). By contrast, the performance on the other items was much weaker, at 32% or less. The first two items were posed in a
0 10 20 30 40 50 60 70 80 90 100
There are 5 seats on a bus. There are 2 children on eachseat. How many children are on the bus altogether?
There are 12 toffees. 4 children share the toffees equally.How many toffees does each child get?
There is a bus with some children. 2 more children get onthe bus. Now there are 9 children on the bus. How many
children were on the bus to begin with?
There are 2 oranges in Kofi’s basket. There are 7 oranges in Ama’s basket. How many oranges must be taken from
Ama’s basket so that both baskets have the same number of oranges?
There are 3 boys on the bus.There are 4 girls on the samebus. How many children are there on the bus altogether?
There are 5 children on the bus, 2 children get off the bus.How many children are there on the bus now?
Percentage of pupils responding correctly

2015 EGRA and EGMA in Ghana | 73
way that was more typical of how teachers tend to ask word problems, whereas the other items were worded using language that was less typical of classroom-type word problems. The different response patterns between Items 1 and 2 and Items 3–6 suggests the possibility that pupils were not able to employ a strategy to solve the problem. The solution of word problems by students in Ghanaian mathematics classrooms has quite possibly been reduced to the execution of a step-wise method, formula or recipe that children perform without much understanding or reasoning. By contrast, it would be better if children made their own plans to solve these problems drawing on their innate ability to make sense of situations, make a plan and solve a problem applying what they know with understanding. This is another manifestation of the contrast between the teaching of methods versus teaching for understanding and allowing children to experience mathematics as a meaningful, sense-making, problem-solving activity.
Table 18 shows the mean score and the percentage of pupils scoring zero on the word problems subtask, by district type, urban/rural status, and male/female.
Pupils in non-deprived districts, pupils in urban regions, and male pupils all performed respectively better than the pupils in deprived districts, pupils in rural regions, and female pupils. For both the mean scores and percent zero scores, only the first two categories are statistically significant, with the differences being larger for non-deprived/deprived than for urban/rural.
Table 18: Word problems – mean score and percentage of pupils scoring zero, by district type, urban/rural status, and male/female
Status Mean % Zero
Non-deprived district 42.6^ 4.5%^
Deprived district 34.7*** 17.6%***
Urban 44.2*** 5.2%^
Rural 38.5^ 10.1%***
Male 40.3 8.9%
Female 39.8^ 8.6%^
^ = reference value; *p < 0.05; **p < 0.01; ***p < 0.001.

74 | 2015 EGRA and EGMA in Ghana
4.3 EGMA RESULTS BY SEX
Figure 14 shows the overall results by sex for the EGMA subtasks. Across the subtasks, boys performed slightly better than girls (compare the pairs of bars in Figure 14). However, the differences in performance – which overall ranged from 0.5 to 3.7 percentage points – were statistically significant only for the first four subtasks, as indicated in the note to the figure.
Figure 14: 2015 performance on EGMA subtasks, by boys/girls
Notes: Reference value = boys. Only number identification, addition level 1, subtraction level 1, and quantity discrimination showed statistically significant differences, at p < 0.001.
4.4 EGMA BY GEOGRAPHIC VARIATIONS
4.4.1 URBAN/RURAL
Figure 15 shows the results for the urban and rural pupils. Across the subtasks, the pupils in the urban schools performed better than the pupils in the rural schools. The differences in performance (ranging
NumberIdent. Addition L1 Subtraction
L1QuantityDiscrim.
MissingNumber Addition L2 Subtraction
L2Word
ProblemsProcedural knowledge (recall)
(%correct/attempted) Conceptual knowledge (application) (%correct)
Boys 72.5 64.1 47.6 67.0 27.0 20.0 10.3 40.3Girls 70.4 60.8 43.9 63.8 26.3 19.1 9.2 39.8
0
10
20
30
40
50
60
70
80
90
100
Mea
n pe
rcen
tage
cor
rect

2015 EGRA and EGMA in Ghana | 75
from 3.4 to 10.5 percentage points) were statistically significant across all the subtasks.
Figure 15: 2015 performance on EGMA subtasks, by urban/rural classification of schools
Notes: Reference value = rural. All differences are statistically significant at p < 0.001.
4.4.2 REGIONS
Figure 16 shows the performance by region on the addition and subtraction level 1 subtasks combined, and the addition and subtraction level 2 subtasks combined. The regions have been arranged from the Brong Ahafo region, whose pupils had the highest mean score on the addition and subtraction level 2 subtasks combined (21.4% correct); to the Upper West region, whose pupils performed had the lowest mean score on the addition and subtraction level 2 subtasks (10.4% correct). Although the pupils in the Brong Ahafo, Greater Accra and Upper East regions (21.4%, 19.5%, and 19.2%) performed a little better on addition and subtraction level 2 – the more conceptual version of the addition and subtraction subtasks – than did the pupils in the other regions, the matter of generally poorperformance should be of greater concern than looking for differences among the regions.
NumberIdent. Addition L1 Subtraction
L1QuantityDiscrim.
MissingNumber Addition L2 Subtraction
L2Word
ProblemsProcedural knowledge (recall)
(%correct/attempted) Conceptual knowledge (application) (%correct)
Urban 75.8 68.9 53.3 73.0 30.7 23.9 12.2 44.2Rural 69.8 60.0 42.9 62.5 25.1 17.9 8.8 38.5
0
10
20
30
40
50
60
70
80
90
100
Mea
n pe
rcen
tage
cor
rect

76 | 2015 EGRA and EGMA in Ghana
Figure 16: 2015 performance on EGMA addition and subtraction subtasks (levels 1 and 2 combined), by region
Notes: Reference value = Ashanti region. Differences in addition and subtraction level 1 are significant at p < 0.01 in Upper West and p < 0.001 in Greater Accra. Differences in level 2 are significant at p < 0.001 in Brong Ahafo, Greater Accra, and Upper East.
4.5 WHAT DO WE KNOW ABOUT PUPILS WHO CAN DO MATHEMATICS?
For this logistic regression analysis, ‘pupils who can do mathematics’ were defined as those whose score on the addition and subtraction level 2 subtask was greater than 60% correct. This score was selected because of its alignment with the Ghanaian benchmarks developed in 2014. The p-value for each factor listed below is 0.01 or less. Using the logistic regression models, it became possible to identify the characteristics of pupils who could read with understanding. According to their own responses during the pupil interview, these young pupils were significantly more likely to:
• Have attended preschool and/or kindergarten
• Attend school regularly
• Have an exercise book
• Spend time at school reading on their own
BrongAhafo
GreaterAccra
UpperEast Volta Western Northern Central Eastern Ashanti Upper
WestAdd & Sub L1 36.2 41.4 34.7 32.6 35.1 31.9 38.1 34.5 34.9 28.5Add & Sub L2 21.4 19.5 19.2 14.3 14.2 12.9 12.8 12.4 11.9 10.4
0
10
20
30
40
50
60
70
80
90
100
Mea
n pe
rcen
tage
cor
rect

2015 EGRA and EGMA in Ghana | 77
• Practise reading out loud at home
• Have someone at home who reads to them.
These characteristics were found to be significantly correlated with the ability to do mathematics. The role of the reading-related tasks in this list should not be surprising given that there is also a relationship between students being able to read and do mathematics.

78 | 2015 EGRA and EGMA in Ghana
5 PUPIL DEMOGRAPHICS
As indicated in Section 2.5, a questionnaire also was administered to the pupils who took the assessment. The pupils’ responses helped to gather contextual information and to gain further insight into the variations in the performance on the EGRA and EGMA. Table 19 shows basic demographic information for the P2 pupils assessed.
Table 19: Pupil demographics
Pupil basic demographic information
Proportion of the basic demographic information
Sex
Females 49%
Males 51%
Age category
Over-age (>8 years old) 72%
Normal (7–8 years old) 27%
Under age 1%
Repeaters Repeaters 11% a
Non-repeaters 89%
Preschool or kindergarten (KG)
Attended preschool or KG 84%
Did not attend preschool or KG 16%
Language Primarily speaks school LOI at home 77%
Does not primarily speak school LOI at home 23%
Home reading / homework
Has other reading materials 39%
Does not have other reading materials 61%
Never reads out loud 37%
Sometimes reads out loud 55%
Every day reads out loud 8%
Is never read to at home 29%
Sometimes is read to at home 61%
Every day is read to at home 10%
Help with homework 76%
No help with homework 24%
a The incidence of grade repetition (11%) compared with over-age (72%) would seem to indicate that pupils are entering school late.
High performance on both the EGRA and the EGMA is linked with certain pupil characteristics, including a supportive home environment

2015 EGRA and EGMA in Ghana | 79
(see Sections 3.3 and 4.5). However, for a substantial proportion of the pupils, the home environment did not support reading acquisition. For example, when pupils were asked whether they had reading materials at home, only 39% of the pupils responded positively. Similarly, 37% of the pupils declared that they never read aloud to anyone, and 29% reported that they were never read to at home. Only 8% read aloud to someone every day, although 10% stated that someone read to them every day at home. Despite a positive finding that more than three-quarters of pupils said they received help with homework, this meant that 24% remained without help. In terms of time in school, 53% of the pupils declared they were absent at least one day in the past week.
Because reading support at home is significantly correlated with reading ability, education stakeholders at all levels can put greater emphasis on this in their communication and support to families and communities.
The availability of materials varied across languages. Overall, English resources were more common than Ghanaian language resources, although in Ewe and Fante schools, they were similar. See Figure 17 and Figure 18 for percentages of pupils with readers and exercise books.
Figure 17: Percentages of pupils who had readers, by language
75.5
64.4
8.7
18.0
78.0
68.7 68.3
40.5
6.8
16.4
87.1
97.6
79.6
25.6
42.7
97.7
73.9 73.5 76.0
48.152.3
99.6
0.0
10.0
20.0
30.0
40.0
50.0
60.0
70.0
80.0
90.0
100.0
Ghanaian language reader English reader

80 | 2015 EGRA and EGMA in Ghana
Figure 18: Percentages of pupils who had exercise books, by language
Pupils who had an exercise book performed better on the EGRA (this was true of both English and Ghanaian language exercise books, as well as for mathematics exercise books; again, see Sections 3.3 and 4.5). The assessment associated the extent to which a teacher’s marks inside of pupils’ exercise books was an indicator of teacher engagement. Pupils who participated in the EGRA and EGMA brought their mathematics exercise books to the assessment, and these were examined for teacher marks. At least 70% of pupils in Akuapem Twi, Asante Twi, Fante, and Ga schools were found to have exercise books with most or all pages marked. In Dagaare, Dagbani, Gonja, and Kasem schools, from 48.4% to 69.0% of pupils had “A few pages” marked.30
30 Due to time constraints during school visits, only pupils’ mathematics exercise books were examined for markings.
77.770.7
20.9
32.8
59.9
78.474.7
42.0
18.513.3
73.7
95.7
84.3 83.6 80.9
91.595.1
88.0 87.7
74.3
83.8
98.0
0.0
10.0
20.0
30.0
40.0
50.0
60.0
70.0
80.0
90.0
100.0
Ghanaian language exercise book English exercise book

2015 EGRA and EGMA in Ghana | 81
6 FINDINGS ON LANGUAGE OF INSTRUCTION
6.1 TEACHER QUESTIONNAIRE
The 2013 EGRA/EGMA data raised questions about how both pupils and their teachers experienced the LOI policy, which stipulates that pupils should be taught in the Ghanaian language of the local area in the early grades and transition to English by P4. In an effort to learn more about how the LOI policy is implemented in schools, a teacher questionnaire was added in 2015 to collect more information about instructional practices related to language use.
6.1.1 QUESTIONNAIRE ADMINISTRATION
The 2015 questionnaire on the use of language by teachers was administered to 671 teachers31 (309 male, 362 female) and was self-reported; no classroom observations were made to directly examine the effective use of language by the teacher. Rather, at a suitable time during the day, one of the assessors on the team sat down with the P2 teacher from whose class the P2 pupils were sampled for assessment and conducted an interview following a protocol. On average, the interview lasted nine minutes.
6.1.2 TEACHERS’ LANGUAGE ABILITY
Teachers self-reported their ability to speak the school’s LOI by choosing one of the following four responses:
1. I do not speak the language
2. I have limited working ability (able to use it to give simple instructions/directions)
3. I have general professional ability (able to make correct sentences during discussions in both official and unofficial situations but not like a native speaker)
31 The teacher total does not match the school sample total due to P2 teachers who were absent on the day of the assessment.

82 | 2015 EGRA and EGMA in Ghana
4. I have native ability (I am a native speaker and able to make correct/meaningful sentences during both informal and formal situations. I am also able to discuss the structure of the language and detect wrong usage.)
Figure 19 shows the responses to this question across the 11 Ghanaian LOIs.
Figure 19: Teachers’ reported speaking ability in school LOI
The responses from teachers in Ga schools are particularly striking in terms of the relatively high percentage of teachers reporting that they did not speak Ga or had only ‘limited working ability’, compared to those with ‘native ability’. Also of note are the following observations:
• In only four languages (Dagaare, Ewe, Kasem, and Nzema) did a majority of teachers report having ‘native ability’ to speak the LOI at the school where they were teaching.
• In three languages, more than 30% of teachers reported having ‘limited working ability’ to speak the LOI (Akuapem Twi, Ga, and Gonja).
• In four languages, more than 14% of teachers reported that they did not speak the LOI at all (Dagbani, Dangme, Ga, and Nzema).
These findings may indicate that there are cases of teachers being posted to schools where they are not able to speak the LOI. Additionally, it appears that the supply of trained teachers in some
0.010.020.030.040.050.060.070.080.090.0
100.0
Perc
enta
ge o
f tea
cher
s
I do not speak the language I have limited working ability
I have general professional ability I have native ability

2015 EGRA and EGMA in Ghana | 83
languages is not sufficient to meet the demand, whereas in other languages, there may be more trained teachers than there are schools to receive them. This could also lead to mismatches in teacher posting and LOI. The teacher posting system should be aligned with the LOI policy.
Another way to look at the teacher data is from the pupils’ perspective, given that they are the beneficiaries of their teachers’ LOI abilities. Teachers were asked whether the language they studied during their pre-service teacher training was the same language as the LOI at the school where they were teaching. Figure 20 shows the percentage of pupils whose teacher did or did not study the school’s LOI prior to becoming a teacher.
Figure 20: Percentage of pupils whose teacher studied same or different language in college
As can be seen above, a majority of pupils in schools where the LOI was Dangme or Ga were being taught by teachers who did not study the LOI in college (58.5% and 83.4%, respectively). Additionally, in Dangme schools, 42.9% of pupils were being taught by teachers who reported that their primary home language was not Dangme; in Ga schools, this was the case for 86.2% of pupils (not shown). In fact, in all but two languages, 20% or more of the pupils were being taught by
0.0 20.0 40.0 60.0 80.0 100.0
Akuapem-Twi
Asante-Twi
Dagaare
Dagbani
Dangme
Ewe
Fante
Ga
Gonja
Kasem
Nzema
Percentage of pupils
Percentage of pupils whose teacher studied same or different language in college
Teacher studied a differentlanguage in college
Teacher studied the samelanguage in college

84 | 2015 EGRA and EGMA in Ghana
teachers whose home language was not the LOI of the school, and who did not study the LOI during their pre-service training. Again, this finding suggests that teachers are not always posted to schools where they can most effectively communicate. This is an example of related policies being misaligned, and thus, counterproductive.
Although the majority of teachers surveyed reported that they did teach in the LOI at the school, about 20% of teachers said they did not. These teachers were then asked to provide the reason, choosing from one of the four responses previously mentioned. Figure 21 depicts the percentage of teachers (of the total) who responded to each option.
Figure 21: Teachers’ reasons for not teaching in the school’s LOI
The reason teachers taught in English rather than a Ghanaian LOI varied: Some teachers reported a lack of LOI ability; others reported low pupil LOI ability; and others a lack of instructional materials. Few teachers (1.7% or less) reported being required to teach in English.
As shown above in Figure 17, lack of materials in Ghanaian LOIs is a reality for many pupils. Readers were not available for many pupils, with pupils in Gonja (6.8%), Dagaare (8.7%), Kasem (16.4%) and Dagbani (18.0%) schools being most underresourced. Most pupils in Ga schools (40.5%) were also without a reader in the LOI. In contrast, 71% of pupils overall had an English reader available. Without such basic resources as books to read in the Ghanaian LOI, pupils have little to no opportunity to learn to read in a language they know.
0.0
5.0
10.0
15.0
20.0
25.0
30.0
35.0
40.0
Perc
enta
ge o
f tea
cher
s
I do not know the language and there is no detached teacherI do not have materials in the languageIt is not the primary language my pupils speakI am required by the Head Teacher to teach in English

2015 EGRA and EGMA in Ghana | 85
Pupils were also asked what language their teacher used primarily when teaching mathematics. This question was included as an indicator of what language the teacher used most of the time in the classroom. As can be seen in Table 20, teachers more often than not taught mathematics in English rather than in a Ghanaian LOI. This is further evidence of a LOI policy that is not being fully implemented.
Table 20: Percentage of pupils who reported that teacher taught mathematics in English
LOI Percentage of pupils
Akuapem-Twi 38.7%
Asante-Twi 49.1%
Dagaare 29.1%
Dagbani 71.0%
Dangme 55.4%
Ewe 29.1%
Fante 38.5%
Ga 97.7%
Gonja 75.8%
Kasem 50.5%
Nzema 52.7%
A slight majority of pupils overall (54%) reported that the LOI at their school was the same language they primarily spoke at home. However, matching pupils’ primary home language and LOI by language group revealed considerable variability across language groups. The percentages of pupils whose primary language spoken at home was the same as the LOI are presented in Figure 22. Notably, for six of the 11 official LOIs (Akuapem Twi, Asante Twi, Dagbani, Ga, Gonja, and Kasem), a majority of pupils reported that they spoke a different language at home. Pupils were also asked whether the school LOI was the same as a secondary language that they spoke at home. In five of those six languages (that is, all except Akuapem Twi), the majority reported that the LOI was not the same as either the primary or the secondary language spoken at home (not shown).

86 | 2015 EGRA and EGMA in Ghana
Figure 22: Comparison of pupils’ LOI to their primary home language, by language of assessment (%)
The language findings described thus far portray an educational context in Ghana with many linguistic as well as policy factors at play. There are P2 classrooms where most pupils speak the school LOI. There are also many P2 classrooms where some or even most pupils do not speak the LOI outside of school. There are two sources for this discrepancy. First, in certain cases the LOI does not align with the predominant language in the area. In other areas the diversity of Ghanaian languages represented in the classroom makes it challenging to identify a local language that that is common to the majority of students. Table 21 presents an analysis of the LOI status by region, which shows the proportion of children who reported speaking the LOI at home. While the intent of the policy is to allow pupils to learn in a familiar language before (and to aid in) transitioning to an unfamiliar one (frequently described as “going from the known to the unknown”), in these cases, some pupils are faced with receiving instruction in essentially a third language – a LOI that is that is not their own and is also not English. In truly multilingual classrooms, adhering to the LOI policy may hinder, rather than benefit the learning process.
33.5
46.1
75.2
48.7
84.4
94.5
71.6
31.0
42.1 40.7
77.1
66.5
53.9
24.8
51.3
15.6
5.5
28.4
69.0
58.0 59.3
23.0
0.0
10.0
20.0
30.0
40.0
50.0
60.0
70.0
80.0
90.0
100.0
Same Not same

2015 EGRA and EGMA in Ghana | 87
Table 21: Analysis of LOI results by region
Region
# of P2 classrooms in
sample
Mean % of pupils in sampled
classrooms that speak LOI at
home LOI
Comment Main reason for
discrepancy
% of classrooms with 20% or fewer pupils
speaking LOI at home
% of classrooms with 81% or more pupils
speaking LOI at home
Ashanti 50 76.7% Most speak LOI
Mix of languages in class 8.0% 52%
Brong Ahafo
53 56.2% 1/2 speak LOI Mix of languages in class 18.9% 18.9%
Central 65 83.5% Most speak LOI
Mix of languages in class 4.6% 66.2%
Eastern 74 72.0% Many speak LOI
Mix of languages in class 6.8% 46.0%
Greater Accra
83 49.0% 1/2 speak LOI Mix of languages in class 28.1% 25.6%
Northern 83 48.9% 1/2 speak LOI Wrong LOI and mix of languages in classroom
39.0% 32.9%
Upper East 65 91.2% Nearly all speak LOI
N/A – Mostly speak LOI 5.9% 88.2%
Upper West 29 96.5% Nearly all speak LOI
N/A – Mostly speak LOI 0 93.1%
Volta 59 68.7% Many speak LOI
Mostly wrong LOI 28.8% 64.4%
Western 100 54.1% 1/2 speak LOI Mix of languages in class 25.0% 26.0%

88 | 2015 EGRA and EGMA in Ghana
In Upper East and Upper West regions especially, but also in Central region, classrooms exhibited greater average agreement between the school LOI and pupils’ reported home language. In Central region, 83.5% of pupils reported speaking the LOI at home. In Upper East 91.2% of pupils reported this and in Upper West, 96.5%. In these areas implementation of the local-language policy should be more straightforward. However, the posting of teachers by language ability remains a stumbling block. Teacher posting policy should include language ability as a criterion to ensure that teachers are assigned to schools where they are equipped to instruct in the designated LOI.
In Brong Ahafo, Northern, Greater Accra, and Western regions, only roughly half of pupils (ranging from 48.9% to 56.2%) spoke the LOI. In some classrooms, 20% or fewer of pupils spoke the LOI at home. This was the case in 39.0% of sampled classrooms in Northern region and 28.1% of classrooms in Greater Accra. The main reason for this disagreement between the LOI and pupils’ home language is the variety of languages represented by pupils in the classroom, making identification of a predominant language and implementation of the LOI policy particularly challenging.
In the analysis of EGRA results by LOI (see Annex A), Ewe schools and pupils stood out and can be seen as an example of a context in which the LOI policy may contribute to learning. Pupils in Ewe schools tended to have higher EGRA scores than pupils assessed in other Ghanaian LOIs. Several factors likely contributed to the higher reading ability among Ewe pupils, including:
• Of all LOIs assessed, Ewe schools had the highest proportion of pupils reporting that they spoke the LOI at home as their primary language, at 96%;
• 95% of P2 teachers in Ewe schools were native speakers of the language;
• 82% of Ewe teachers reported studying Ewe in pre-service teacher training;
• 69% of pupils in Ewe schools had an Ewe reader, and 78% had an Ewe exercise book;
• 69% of Ewe teachers also used Ewe to teach mathematics, indicating that using the LOI was likely pervasive across subjects taught.

2015 EGRA and EGMA in Ghana | 89
While Ewe schools still had very low levels of reading ability, with 69% scoring zero on the oral reading passage, there appear to have been fewer obstacles to learning for these pupils than for many others, in that they were being instructed in a familiar language by native-speaking teachers who largely had also formally studied Ewe. Most pupils also had access to Ewe materials. The combination of these factors illustrates the possibility and promise of the LOI policy in more homogenous contexts.
Thus, in addition to revisiting and improving the process and criteria for posting teachers to schools, so that teachers’ language abilities are factored in more significantly, education officials should also explore options for better serving pupils in places where the context is not conducive to all pupils learning in the LOI that they already know.

90 | 2015 EGRA and EGMA in Ghana
7 CONCLUSIONS
7.1 EGRA – MAJOR FINDINGS
Like in 2013, the results from the 2015 EGRA show that most pupils in Ghana were not yet able to read with fluency and accuracy, which prevented them from reading with comprehension. These pupils generally lacked the pre- and early-reading skills they will need to become strong, fluent readers who understand text. Although there were some variations among the languages, this trend of pupils struggling with letter sounds, decoding, and comprehending was apparent in all languages assessed.
The finding that only a very small minority of pupils in Ghana (2% on average) have achieved the goal of literacy instruction, which is to read fluently with comprehension, is the logical result of not learning the earlier skills required. Although most pupils did possess the prereading skill of understanding oral language in the Ghanaian LOIs, as measured in the listening comprehension subtask, performance plummeted in subsequent measurements.
Few pupils were able to correctly provide the sound of individual letters, with the best performing group (in Fante schools) averaging just 16% correct and ability decreasing from there.
Without knowing letter sounds (phonemes), pupils cannot decode and read words. The results of the nonword decoding subtask confirmed this, with the majority of pupils scoring zero. The highest scoring group, those in Ewe schools, only achieved 9% correct, on average.
Performance on the next subtask – oral passage reading – was low as well. Rather than having to decode unfamiliar words, pupils were asked to read a short story passage in the Ghanaian LOI and in English. The reading passages contained vocabulary taken from P2 teaching and learning materials that should have been familiar to pupils. However, zero score percentages for this task ranged from 51% to 93%.

2015 EGRA and EGMA in Ghana | 91
The results of the final EGRA subtask – reading comprehension –were in keeping with the evidence above. Pupils who cannot identify letter sounds and decode words cannot read, and thus cannot comprehend. Most pupils did not even attempt this subtask due to having scored zero on the reading passage. Of those who did attempt to answer at least one reading comprehension question, zero score percentages were still high, although lower in the Ghanaian LOIs than in English.
The differences seen in pupil performance between English listening comprehension and Ghanaian LOI listening comprehension highlight the promise of local-language instruction. Pupils arrive at school better equipped to understand in their home language. However, effective implementation of the LOI policy faces challenges in Ghana’s multilingual context. Careful review of the policy regarding schools’ selection of LOI, teacher assignment protocols, and how to apply local-language instruction in multilingual classrooms should be considered, in addition to ensuring basic resources such as Ghanaian LOI readers being available for all pupils. However, the LOI challenges are a confounding factor, but not the core problem in Ghana’s overall low reading performance in the early grades.
The picture resulting from the EGRA is clear: Most P2 pupils in Ghana’s public schools are not learning to read in any language. Literacy instruction, in its current state, is ineffective at providing pupils with the foundation needed to acquire this crucial skill, upon which so much subsequent learning depends. Classrooms must be equipped with the Ghanaian LOI resources needed to teach and learn. Teachers’ instruction in the classroom should focus more on ensuring that pupils in early primary grades are acquiring the foundational literacy skills that they need.
In addition to improving instructional practices, educators and other stakeholders should also focus on the practices and behaviours that were found to have a significant positive relationship with reading proficiency, to maximise pupils’ opportunities to learn and succeed. Pupils who were able to read with comprehension were significantly more likely to have time, resources, and support for practicing reading at school and at home; to have adequate access to teaching and learning materials in and out of school; and to have attended preschool or kindergarten and to rarely be absent from school.

92 | 2015 EGRA and EGMA in Ghana
7.2 EGMA – MAJOR FINDINGS
As in 2013, the results of the 2015 EGMA study in Ghana strongly suggest that the teaching of mathematics focuses on memorization of facts, rules and formulas. Based on the EGMA results, particularly on the conceptual knowledge items, this approach does not appear to be working. While it may contribute to the impression that children ‘know their mathematics’ in the very early grades (e.g., P1), the EGMA in Ghana has shown that pupils are unable to apply their memorized knowledge and hence they are not well prepared to learn more complex and important mathematics in the higher grades.
The EGMA results suggest that pupil performance in Ghana has a lot more to do with how pupils are learning to do mathematics rather than the mathematics that they are learning. Doing mathematics (especially in the early grades) involves being able to read, write, compare, and perform basic operations with numbers; however, doing mathematics involves a lot more than this. According to the authors of Adding it Up: Helping Children Learn Mathematics,32
Our analyses of the mathematics to be learned, our reading of the research in cognitive psychology and mathematics education, our experience as learners and teachers of mathematics, and our judgment as to the mathematical knowledge, understanding, and skill people need today have led us to adopt a composite, comprehensive view of successful mathematics learning. … Recognizing that no term captures completely all aspects of expertise, competence, knowledge, and facility in mathematics, we have chosen mathematical proficiency to capture what we believe is necessary for anyone to learn mathematics successfully.
The authors also described mathematical proficiency as having the following five components, or strands: (1) conceptual understanding (understanding): the comprehension of mathematical concepts, operations, and relations; (2) procedural fluency (computing): skill in carrying out procedures flexibly, accurately, efficiently, and appropriately; (3) strategic competence (application): the ability to formulate, represent, and solve mathematical problems; (4) adaptive reasoning (reasoning): the capacity for logical thought, reflection, explanation, and justification; and (5) productive disposition
32 National Research Council. (2001). Adding it up: Helping children learn mathematics. Washington, DC: The National Academies Press, Chapter 4, pp. 115–116. https://www.nap.edu/read/9822/chapter/6

2015 EGRA and EGMA in Ghana | 93
(engaging): the habitual inclination to see mathematics as sensible, useful, and worthwhile, coupled with a belief in diligence and one’s own efficacy. In short, the authors present the case that to be successful in learning mathematics, pupils need – in addition to being able to compute answers – to understand the mathematics that they are learning, be able to apply what they have learned in unfamiliar situations, and be able to reason about what they have done.
The results of the EGMA study suggest very strongly that the focus of mathematics teaching in Ghana is more about knowing facts – as revealed by the stronger performance on the more procedural tasks (addition and subtraction level 1) – than on the ability to apply that knowledge with reasoning and understanding – as reflected in the significantly poorer performance on the more conceptual tasks (addition and subtraction level 2 and missing number).
Improving performance in mathematics (especially on the more conceptual subtasks) will require not just teaching the same mathematics that is currently being taught more effectively, but reorienting what it means for children to do mathematics. It is recommended that future in-service teacher training in mathematics focus more on the multi-dimensional nature of mathematical proficiency than on more efficient teaching strategies that focus on mathematics as the memorization of facts, rules, and procedures.
It is encouraging to note that the pupils performed better on the word problems subtask than on the addition and subtraction level 2 and missing number subtasks. The results on the word problem subtask highlight that pupils are, in general, able to make a plan and solve a problem. Teaching approaches that use problems to both give meaning to the mathematics that pupils are learning and to expose pupils to the mathematics to be learned may achieve a great deal more than the current approach. It is recommended that the pedagogical approaches to the teaching of mathematics conveyed in both pre- and in-service increasingly focus on solving problems as a way of teaching and learning mathematics and not only the reason for learning mathematics.


2015 EGRA and EGMA in Ghana | A-1
ANNEX A: 2015 GHANA EGRA ANALYSES BY LANGUAGE
Page
Akuapem Twi ................................................. A-2
Asante Twi ..................................................... A-8
Dagaare ....................................................... A-14
Dagbani ........................................................ A-19
Dangme........................................................ A-25
Ewe .............................................................. A-31
Fante ............................................................ A-37
Ga ................................................................ A-43
Gonja ........................................................... A-49
Kasem .......................................................... A-55
Nzema .......................................................... A-60
English ......................................................... A-66

A-2 | 2015 EGRA and EGMA in Ghana
HOW WELL ARE CHILDREN READING IN AKUAPEM TWI?
OVERVIEW OF RESULTS The EGRA was administered to 698 pupils in schools where Akuapem Twi was the designated language of instruction. Based on the results of the oral passage reading and reading comprehension subtasks, the state of reading in Akuapem Twi can be summarized as shown in Figure A-1:
Figure A-1: Distribution of pupils by performance level,33 Akuapem Twi
• Most pupils (54.5%, n = 381) were unable to read a single word of the story.
• Some pupils (42.4%, n = 290) read 7 correct words per minute, indicating they were just beginning to understand the alphabetic principle (or the relationship between sounds and letters). These pupils could read some words, but were not yet at a point of being able to understand what they read.
• A small group of pupils (1.4%, n = 11) demonstrated that they were transitioning from word-by-word identification to increased fluency. On average, these pupils read 36 correct
33 The four categories are defined as follows:
• Cannot read: oral reading fluency (ORF) score is zero • Read some words, but not understand: ORF score is greater than zero and reading comprehension score is below
60% correct of those attempted • Read with some understanding: reading comprehension score is 60% of the questions attempted • Read fluently and understand: reading comprehension score is 80% correct of total number of reading passage
comprehension questions
54.5% 42.4%
1.4%
1.7%
0 20 40 60 80 100
Cannot read Read some words, but not understand
Read with some understanding Read fluently and understand

2015 EGRA and EGMA in Ghana | A-3
words per minute and correctly answered 74% of the comprehension questions they attempted.
• A slightly larger group (1.7%, n = 16) had sufficient fluency (automatic and accurate word identification) to focus on comprehension. On average, these pupils read 62 words per minute and answered 88% of the total number of passage comprehension questions correctly.
RESULTS BY SUBTASK
Table A-1: Average EGRA scores in Akuapem Twi
EGRA subtask Percentage
of pupils who scored
zero
Average % correct of
items attempted
Average fluency score
(all pupils)
Average % correct of items
attempted (excluding pupils with
zero scores)
Average fluency score
(excluding pupils with
zero scores)
Listening comprehension 26.9% 42.6% — 58.2% —
Letter sound knowledge 33.4% 39.5%
14.8 correct letter sounds per minute
59.2% 22.2 correct letter sounds per minute
Nonword decoding 77.6% 10.7%
2.8 correct nonwords per minute
47.9% 12.4 correct nonwords per minute
Oral passage reading 54.5% 15.5%
4.6 correct words per minute
34.0% 10.2 correct words per minute
Reading comprehension 90.9% 4.9% — 53.6% —
LISTENING COMPREHENSION
This subtask measures an important pre-reading skill – the pupils’ ability to listen to and understand oral language. Pupils listened to a short story that was read to them in Akuapem Twi and were then asked three questions about the story. Less than one third of the pupils (26.9%) scored zero (Table A-1) – they were unable to answer a single question correctly. On average, pupils were able to answer 42.6% of the listening comprehension questions correctly. Pupils who did not score zero on the subtask (i.e., 73.1% of the pupils) were able to answer 58.2% of the comprehension questions correctly, on average.
Not surprisingly, the analysis showed that pupils who reported speaking a language at home other than Akuapem Twi were more

A-4 | 2015 EGRA and EGMA in Ghana
than 2.3 times as likely to score zero on the listening comprehension subtask as pupils who reported speaking Akuapem Twi at home.
The performance of the pupils on this subtask in Akuapem Twi was very different from their performance in English. After listening to a story in English being read to them, 80.7% of the pupils were unable to answer a single question about the story correctly (not shown). This percentage is three times the number for Akuapem Twi. This finding points to the very limited development of English listening and speaking for the Akuapem Twi subpopulation.
LETTER SOUND KNOWLEDGE
The letter sound knowledge subtask assesses a pupil’s ability to produce the sounds of the letters of the alphabet naturally, without hesitation. If children struggle to produce letter sounds, they are unlikely to be able to decode words and read fluently. One third (33.4%) of the pupils were unable to identify the sound of a single letter correctly. On average, from the items they attempted, pupils named 39.5% of the letter sounds correctly and, on average, produced 14.8 correct letter sounds per minute (clspm). When pupils scoring zero were removed from the analysis, the average percentage for the correct letter sound score was 59.2% out of items attempted, at a fluency of 22.2 clspm. The pupils who could produce the sound of at least one letter correctly took, on average, 2.7 seconds to produce the sound of a letter. This finding suggests that letter sound production was not yet fluent for most of these pupils. Instead, even when pupils did understand the concept of sound-symbol relationships, they were having to spend time thinking about each letter. Letter sound production is fundamental for reading new words (i.e., decoding) and these decoding skills provide the foundations for all aspects of reading development.
NONWORD DECODING
For the nonword decoding subtask, pupils must know the sounds of individual letters and also be able to blend one sound with the next to correctly decode and say an unfamiliar word. Decoding nonwords is an important building block in reading development. More than two-thirds of pupils (77.6%) were unable to decode any nonwords in Akuapem Twi. This is not surprising, given the low performance on the letter sound knowledge subtask. On average, pupils were only able to decode 10.7% of the nonwords attempted and correctly read 2.8 nonwords per minute. When pupils scoring zero were removed from the analysis, the average percent correct score was 47.9% of

2015 EGRA and EGMA in Ghana | A-5
items attempted, and these pupils correctly decoded, on average, 12.4 correct nonwords per minute. These pupils were just beginning to understand sound-symbol relationships (i.e., relationships between sounds and letters) and apply this knowledge to the task of reading.
Pupils’ performance on the nonword decoding subtask was positively correlated with performance on the letter sound knowledge subtask, as well as with the oral passage reading subtask (discussed in the next section).34
ORAL PASSAGE READING
As shown in Table A-1 above, the majority of pupils (54.5%) scored zero on the oral passage reading subtask. On average, pupils read 15.5% of attempted words in the passage correctly, with an average reading fluency of 4.6 correct words per minute (cwpm). Similar to the nonword reading results, this score indicates that these pupils were just beginning to learn to decode words. When the pupils scoring zero on this subtask were removed from the analysis, the average score was 34.0% correct out of items attempted, at a fluency of 10.2 cwpm. Thus, pupils who could read at least one word correctly took, on average, 5.9 seconds to read each word.
As seen in Figure A-1, a small group of pupils (1.4% of the pupils) reached the ‘read with some understanding’ level by answering correctly at least 60% of the passage comprehension questions they attempted. These pupils demonstrated some emerging fluency with an average oral reading fluency (ORF) score of 36 cwpm.
Pupils classified in Figure A-1 as ‘reading with comprehension’ (1.7% of the pupils), who correctly answered at least 80% of the comprehension questions (4 out of 5 questions), had an average ORF score of 62 cwpm.
As is mentioned above, there was a strong relationship between pupil performance on this subtask and the nonword decoding subtask, meaning that pupils who performed well or underperformed on one tended to perform similarly on the other.
Thus, the established pattern that increased reading fluency leads to improved reading comprehension is clearly demonstrated in the pupils’ performance in early grade reading of Akuapem Twi.
34 Pearson correlation = 0.660 and 0.769, respectively.

A-6 | 2015 EGRA and EGMA in Ghana
READING COMPREHENSION
As can be seen in Table A-1, a large majority of pupils (90.9%) were unable to answer a single reading comprehension question correctly in Akuapem Twi. The average number of questions attempted was 1.2 (out of a total of 5), and the average score was 4.9% correct of questions attempted. When the pupils scoring zero on this subtask were removed from the analysis, the average score was 53.6% correct out of items attempted. This reflects the lack of fluency with which these pupils were reading. For this subtask, pupils were asked only the questions that corresponded to the amount of the text that they had read. In other words, few pupils were able to read far enough into the passage before the time limit was reached to be asked more than the first comprehension question.
CORRECT ITEMS PER MINUTE, BY PERCENTILE
Finally, Figure A-2 presents the percentile distribution for the three timed subtasks of the Akuapem Twi EGRA. It shows the corresponding number of correct items per minute for each percentile, and illustrates the relationships among the skills measured by these three subtasks. For example, at about the 80th percentile, on average, pupils were achieving 29 correct letter sounds per minute, 5 correct words per minute on the passage reading subtask, and 1 correct nonword per minute. Figure A-2 further illustrates that letter sound knowledge precedes the ability to decode, and fluency rates of all three skills are related and increase together.
Figure A-2: Percentile distribution on all timed subtasks, Akuapem Twi
0
20
40
60
80
1 3 5 7 9 11 13 15 17 19 21 23 25 27 29 31 33 35 37 39 41 43 45 47 49 51 53 55 57 59 61 63 65 67 69 71 73 75 77 79 81 83 85 87 89 91 93 95 97 99
Cor
rect
item
s pe
r min
ute
Letter Sounds Non-Words Passage Reading

2015 EGRA and EGMA in Ghana | A-7
TRENDS FROM 2013 TO 2015
In Akuapem Twi, the proportion of pupils who could not read one word (nonreaders) decreased by approximately 10 percentage points, from 64.6% in 2013 to 54.5% in 2015. Among the pupils who attempted to read the passage associated with the reading fluency and reading comprehension subtasks, these children struggled to understand the meaning of the passage, correctly answering, on average, less than 60% of the questions attempted. In 2015, 42.4% of the children were able to read some words of the reading passage, but answered less than 60% of the comprehension questions, as compared to 32.6% of the children in 2013. Although this change represents an increase of almost 10 percentage points in the proportion of pupils who were reading some words in an Akuapem Twi reading passage, very little improvement was observed in the percentage of pupils who were able to read and comprehend at the two highest performance levels, correctly answering at least 60% of the questions attempted. In 2013, 2.8% of the pupils were able to read some of a passage and answer at least 60% of the questions correctly compared to 3.1% in 2015.

A-8 | 2015 EGRA and EGMA in Ghana
HOW WELL ARE CHILDREN READING IN ASANTE TWI?
OVERVIEW OF RESULTS The EGRA was administered to 1,868 pupils in schools where Asante Twi was the designated language of instruction. Based on the results of the oral passage reading and reading comprehension subtasks, the state of reading in Asante Twi can be summarized as shown in Figure A-3.
Figure A-3: Distribution of pupils by performance level,35 Asante Twi
• Most pupils (76.8%, n = 1,467) were unable to read a single word of the story.
• Some pupils (19.4%, n = 326) read 8 correct words per minute, indicating they were just beginning to understand the alphabetic principle (or the relationship between sounds and letters). These pupils answered only 4.7% of the passage questions correctly. They read some words, but were not yet at a point of being able to understand what they read.
• A small group of pupils (3.0%, n = 64) demonstrated that they were transitioning from word-by-word identification to
35 The four categories are defined as follows: The four categories are defined as follows:
• Cannot read: oral reading fluency (ORF) score is zero • Read some words, but not understand: ORF score is greater than zero and reading comprehension score is below
60% correct of those attempted • Read with some understanding: reading comprehension score is 60% of the questions attempted • Read fluently and understand: reading comprehension score is 80% correct of total number of reading passage
comprehension questions
76.8% 19.4%
3.0%
0.9%
0 20 40 60 80 100
Cannot read Read some words, but not understand
Read with some understanding Read fluently and understand

2015 EGRA and EGMA in Ghana | A-9
increased fluency. On average, these pupils read 30 correct words per minute and correctly answered an average of 82% of the comprehension questions they attempted.
• A smaller group (0.9%, n = 11) had sufficient fluency (automatic and accurate word identification) to focus on comprehension. On average, these pupils read 55 words per minute and answered 80.8% of the total number of passage comprehension questions correctly.
RESULTS BY SUBTASK
Table A-2: Average EGRA scores in Asante Twi
EGRA subtask Percentage
of pupils who scored
zero
Average % correct of
items attempted
Average fluency score
(all pupils)
Average % correct of items
attempted (excluding
pupils with zero scores)
Average fluency score
(excluding pupils with zero
scores)
Listening comprehension 22.9% 43.0% — 55.7% —
Letter sound knowledge 51.7% 21.6%
7.4 correct letter sounds per minute
44.8% 15.3 correct letter sounds per minute
Nonword decoding 87.7% 5.5%
1.5 correct nonwords per minute
44.5% 12.1 correct nonwords per minute
Oral passage reading 76.8% 9.3%
2.9 correct words per minute
39.9% 12.7 correct words per minute
Reading comprehension 91.9% 5.2% — 63.8% —
LISTENING COMPREHENSION
This subtask measures an important pre-reading skill – the pupils’ ability to listen to and understand oral language. Pupils listened to a short story that was read to them in Asante Twi and were then asked three questions about the story. About one-fifth of the pupils (22.9%) scored zero (Table A-2) – they were unable to answer a single question correctly. On average, pupils answered 43.0% of the listening comprehension questions correctly. The average score for the pupils who did not score zero on the subtask (i.e., 77.1% of the pupils) was 55.7%.

A-10 | 2015 EGRA and EGMA in Ghana
The large majority of pupils in this language group (83.8%) were unable to answer a single question about the story read to them in English (not shown). This finding points to the very limited development of English listening and speaking for the Asante Twi subpopulation.
LETTER SOUND KNOWLEDGE
The letter sound knowledge subtask assesses a pupil’s ability to produce the sounds of the letters of the alphabet naturally, without hesitation. If children struggle to produce letter sounds, they are unlikely to be able to decode unfamiliar words. More than half (51.7%) of the pupils were unable to identify the sound of a single letter correctly. On average, pupils were able to correctly produce the letter sound in 21.6% of the items attempted, and produced, on average, 7.4 correct letter sounds per minute (clspm). When pupils scoring zero were removed from the analysis, the average correct letter sound score was 44.8% out of items attempted at a fluency of 15.3 clspm. The pupils who could produce the sound of at least one letter correctly took, on average, 3.9 seconds per letter to produce the sound. This finding suggests that letter sound production was not yet fluent for most of these pupils. Instead, they were having to spend time thinking about each letter. Since letter sound production is important for identifying words (i.e., decoding), and automatic decoding facilitates reading comprehension, their low scores on nonwords, passage reading, and comprehension are understandable (Figure A-3).
NONWORD DECODING
For the nonword decoding subtask, pupils must know the sounds of individual letters and also be able to blend one sound with the next to correctly decode and say an unfamiliar word. Decoding nonwords is an important building block in reading development. More than two-thirds of pupils (87.7%) were unable to decode nonwords in Asante Twi. On average, pupils were only able to decode 5.5% of the nonwords attempted, at an average fluency rate of 1.5 nonwords per minute. When pupils scoring zero were removed from the analysis, the average score on the nonword decoding subtask was 44.5% correct out of items attempted, at a fluency of 12.1 correct nonwords per minute. These pupils were just beginning to understand sound-symbol relationships (i.e., relationships between sounds and letters) and apply this knowledge to the task of reading.

2015 EGRA and EGMA in Ghana | A-11
Performance on the nonword decoding subtask was positively correlated with performance on the letter sound knowledge subtask, as well as with the oral passage reading subtask (discussed in the next section).
ORAL PASSAGE READING
As is depicted in Table A-2 above, the majority of pupils (76.8%) scored zero on the oral passage reading subtask. On average, pupils read 9.3% of attempted words in the passage correctly, with a fluency of 2.9 correct words per minute (cwpm). Like the nonword reading results, this indicates that these pupils were just beginning to learn to decode and read words in a passage. When the pupils scoring zero on this subtask were removed from the analysis, the average score was 39.9% correct out of items attempted, at a fluency of 12.7 cwpm. This means that pupils who could read at least one word correctly took, on average, 4.7 seconds to read each word.
As seen in Figure A-3, a small group of pupils (3.0%) reached the “read with some understanding” level by correctly answering at least 60% of the passage comprehension questions they attempted. The pupils demonstrated some emerging fluency with an average oral reading fluency (ORF) score of 30 cwpm.
Pupils classified in Figure A-3 as ‘reading with comprehension’ (0.9% of the pupils), who correctly answered at least 80% of the total number of comprehension questions (4 out of 5 questions), had an average ORF score of 55 cwpm.
Thus the established pattern that increased reading fluency leads to improved reading comprehension is demonstrated in the pupils’ performance in early grade reading of Asante Twi.
READING COMPREHENSION
As can be seen in Table A-2, a large majority of pupils (91.9%) were unable to answer a single reading comprehension question correctly in Asante Twi. The average number of questions attempted was less than 1 (0.6 out of a total of 5), and the average score was 5.2% correct of questions attempted. When the pupils scoring zero on this subtask were removed from the analysis, the average score was 63.8% correct out of items attempted. This reflects the lack of fluency with which these pupils were reading. For this subtask, pupils were asked only the questions that corresponded to the amount of the text that they had read. In other words, few pupils were able to read far

A-12 | 2015 EGRA and EGMA in Ghana
enough into the passage before the time limit was reached to be asked more than the first comprehension question.
CORRECT ITEMS PER MINUTE, BY PERCENTILE
Finally, Figure A-4 presents the percentile distribution for the three timed subtasks of the Asante Twi EGRA. It shows the corresponding number of correct items per minute for each percentile, and illustrates the relationships among the skills measured by these three subtasks. For example, at about the 90th percentile, on average, pupils were achieving 24 correct letter sounds per minute, 7 correct words per minute on the passage reading subtask, and 3 correct nonwords per minute. Figure A-4 further illustrates that letter sound knowledge precedes the ability to decode, and fluency rates of all three skills are related and increase together.
Figure A-4: Percentile distribution on all timed subtasks, Asante Twi
TRENDS FROM 2013 TO 2015
In Asante Twi, the proportion of pupils who could not read one word (nonreaders) decreased by approximately 6 percentage points, from 82.7% in 2013 to 76.8% in 2015. In both years, large majorities of pupils were not able to read a single word by the end of Primary 2. Among the pupils who attempted to read the passage associated with the reading fluency and reading comprehension subtasks, these children struggled to understand the meaning of the passage, correctly answering, on average, less than 60% of the questions attempted. In 2015, 19.4% of the children were able to read some words of the reading passage, but answered less than 60% of the
0
20
40
60
80
1 3 5 7 9 11 13 15 17 19 21 23 25 27 29 31 33 35 37 39 41 43 45 47 49 51 53 55 57 59 61 63 65 67 69 71 73 75 77 79 81 83 85 87 89 91 93 95 97 99
Cor
rect
item
s pe
r min
ute
Letter Sounds Non-Words Passage Reading

2015 EGRA and EGMA in Ghana | A-13
comprehension questions, as compared to 14.3% of the children in 2013. Although this change represents an increase of about 5 percentage points in the share of pupils who were reading some words in an Asante Twi reading passage, very little improvement was observed in the percentage of pupils who were able to read and comprehend at the two highest performance levels, answering at least 60% of the questions attempted. In 2013, 3.1% of the pupils were able to read some of a passage and answer at least 60% of the questions correctly, compared to 3.9% in 2015.

A-14 | 2015 EGRA and EGMA in Ghana
HOW WELL ARE CHILDREN READING IN DAGAARE?
OVERVIEW OF RESULTS The EGRA was administered to 548 pupils in schools where Dagaare was the designated language of instruction. Based on the results of the oral passage reading and reading comprehension subtasks, the state of reading in Dagaare can be summarized as shown in Figure A-5:
Figure A-5: Distribution of pupils by performance level,36 Dagaare
• Most pupils (88.2%, n = 487) were unable to read a single word of the story.
• Some pupils (10.4%, n = 56) read 7 correct words per minute, indicating they were just beginning to understand the alphabetic principle (or the relationship between sounds and letters). Not surprisingly, these pupils answered only 1.9% of the passage questions correctly. These pupils could read some words, but were not yet at a point of being able to understand what they read.
• A small group of pupils (0.8%, n = 3) demonstrated that they were transitioning from word-by-word identification to increased fluency. On average, these pupils read 15 correct
36 The four categories are defined as follows:
• Cannot read: oral reading fluency (ORF) score is zero • Read some words, but not understand: ORF score is greater than zero and reading comprehension score is below
60% correct of those attempted • Read with some understanding: reading comprehension score is 60% of the questions attempted • Read fluently and understand: reading comprehension score is 80% correct of total number of reading passage
comprehension questions
88.2% 10.4%
0.8%
0.6%
0 20 40 60 80 100
Cannot read Read some words, but not understand
Read with some understanding Read fluently and understand

2015 EGRA and EGMA in Ghana | A-15
words per minute and correctly answered an average of 87% of the comprehension questions they attempted.
• A smaller group (0.6%, n = 2) had sufficient fluency (automatic and accurate word identification) to focus on comprehension. On average, these pupils read 40 words per minute and answered 80.0% of the total number of passage comprehension questions correctly (4 out of 5 questions).
RESULTS BY SUBTASK
Table A-3: Average EGRA scores in Dagaare
EGRA subtask Percentage
of pupils who scored
zero
Average % correct of
items attempted
Average fluency score
(all pupils)
Average % correct of items
attempted (excluding
pupils with zero scores)
Average fluency score
(excluding pupils with zero
scores)
Listening comprehension 27.4% 50.0% — 68.8% —
Letter sound knowledge 63.2% 8.9%
2.9 correct letter sounds per minute
24.3% 7.9 correct letter sounds per minute
Nonword decoding 91.8% 3.1%
0.7 correct nonwords per minute
37.3% 8.5 correct nonwords per minute
Oral passage reading 88.2% 3.9%
1.1 correct words per minute
33.0% 9.2 correct words per minute
Reading comprehension 97.7% 1.6% — 69.2% —
LISTENING COMPREHENSION
This subtask measures an important pre-reading skill – the pupils’ ability to listen to and understand oral language. Pupils listened to a short story that was read to them in Dagaare and were then asked three questions about the story. Less than a third of the pupils (27.4%) scored zero (Table A-3) – they were unable to answer a single question correctly. On average, after listening to the story read to them in Dagaare, the pupils correctly answered 50% of the listening comprehension questions. The overall average score for the pupils who did not score zero on the subtask (i.e., 72.6% of the pupils) was 68.8%.
The performance of the pupils on this subtask in Dagaare was very different from their performance in English. After listening to a story in

A-16 | 2015 EGRA and EGMA in Ghana
English being read to them, 91.9% of the pupils were unable to answer a single question about the story correctly (not shown). This finding points to the very limited development of English listening and speaking for the Dagaare subpopulation.
LETTER SOUND KNOWLEDGE
The letter sound knowledge subtask assesses a pupil’s ability to produce the sounds of the letters of the alphabet naturally, without hesitation. If children struggle to produce letter sounds, they are unlikely to be able to decode words and read fluently. More than half (63.2%) of the pupils were unable to identify the sound of a single letter correctly (Table A-3). On average, pupils were able to correctly produce the letter sound in 8.9% of the items attempted and produced, on average, 2.9 correct letter sounds per minute (clspm). When pupils scoring zero were removed from the analysis, the average percentage for the correct letter sound score was 24.3% out of items attempted, at a fluency rate of 7.9 clspm. The pupils who could produce the sound of at least one letter correctly took, on average, 7.6 seconds per letter to produce the sound. This finding suggests that letter sound production was not yet fluent for most of these pupils. Instead, they were having to spend time thinking about each letter. Since letter sound production is important for identifying words (i.e., decoding), and automatic decoding facilitates reading comprehension, their low scores on nonwords, passage reading, and comprehension are understandable (Figure A-5).
NONWORD DECODING
For the nonword decoding subtask, pupils not only must know the sounds of individual letters, but also must be able to blend one sound with the next to correctly decode and say an unfamiliar word. Decoding nonwords is an important building block in reading development. Most pupils (91.8%) were unable to decode any of the nonwords in Dagaare. This is not surprising given the performance on the letter sound knowledge subtask. On average, pupils were only able to correctly decode 3.1% of the nonwords attempted, at an average fluency rate of 0.7 correct nonwords per minute. When pupils scoring zero were removed from the analysis, the average score on the nonword decoding subtask was 37.3% correct out of items attempted, at a fluency of 8.5 correct nonwords per minute. These pupils were just beginning to understand sound-symbol relationships (i.e., relationships between sounds and letters) and apply this knowledge to the task of reading.

2015 EGRA and EGMA in Ghana | A-17
Performance on the nonword decoding subtask was positively correlated with performance on the letter sound knowledge subtask, as well as with the oral passage reading subtask (discussed in the next section).
ORAL PASSAGE READING
As is depicted in Table A-3 above, the majority of pupils (88.2%) scored zero on the oral passage reading subtask. On average, pupils correctly read only 3.9% of attempted words in the passage correctly, with an average fluency of 1.1 correct words per minute (cwpm). Like the nonword reading results, this indicates that these pupils were just beginning to learn to decode and read words in a passage. When the pupils scoring zero on this subtask were removed from the analysis, the average score was 33.0% correct out of items attempted, at a fluency of 9.2 cwpm. This means that pupils who could read at least one word correctly took, on average, 6.5 seconds to read each word.
As seen in Figure A-5, a small group of pupils (0.8%) reached the ‘read with some understanding’ level by correctly answering at least 60% of the comprehension questions that they attempted. The average oral reading fluency (ORF) score for these pupils was 15 cwpm.
Pupils classified in Figure A-5 as ‘reading with comprehension’ (0.6% of the pupils), who correctly answered at least 80% of the passage comprehension questions (i.e., 4 out of 5), had an average ORF score of 40 cwpm.
Thus, the established pattern that increased reading fluency leads to improved reading comprehension is clearly demonstrated in the pupils’ performance in early grade reading of Dagaare.
READING COMPREHENSION
As can be seen in Table A-3, a large majority of pupils (97.7%) were unable to answer a single reading comprehension question correctly in Dagaare. The average number of questions attempted was less than 1 (0.3 out of a total of 5), and the average score was 1.6% correct of questions attempted. When the pupils scoring zero on this subtask were removed from the analysis, the average score was 69.2% correct out of items attempted. This reflects the lack of fluency with which these pupils were reading. For this subtask, pupils were asked only the questions that corresponded to the amount of the text that they had read. In other words, few pupils were able to read far

A-18 | 2015 EGRA and EGMA in Ghana
enough into the passage before the time limit was reached to be asked more than the first comprehension question.
CORRECT ITEMS PER MINUTE, BY PERCENTILE
Finally, Figure A-6 presents the percentile distribution for the three timed subtasks of the Dagaare EGRA. It shows the corresponding number of correct items per minute for each percentile, and illustrates the relationships among the skills measured by these three subtasks. For example, at about the 90th percentile, on average, pupils were achieving 7 correct letter sounds per minute, 1 correct word per minute on the passage reading subtask, and 0 correct nonwords per minute. Figure A-6 further illustrates that letter sound knowledge precedes the ability to decode, and fluency rates of all three skills are related and increase together.
Figure A-6: Percentile distribution on all timed subtasks, Dagaare
TRENDS FROM 2013 TO 2015
Very little change was observed from 2013 to 2015 in the Ghanaian language reading performance among the Dagaare subpopulation. The proportion of pupils who could not read one word (nonreaders) was 85.9% in 2013 and 88.2% in 2015, representing a slight increase (2.3 percentage points) in the share of nonreaders. In 2013, 4.2% of the pupils were able to read some part of a passage and answer at least 60% of the questions correctly, compared to 1.4% in 2015.
0
20
40
60
80
1 3 5 7 9 11 13 15 17 19 21 23 25 27 29 31 33 35 37 39 41 43 45 47 49 51 53 55 57 59 61 63 65 67 69 71 73 75 77 79 81 83 85 87 89 91 93 95 97 99
Cor
rect
item
s pe
r min
ute
Letter Sounds Non-Words Passage Reading

2015 EGRA and EGMA in Ghana | A-19
HOW WELL ARE CHILDREN READING IN DAGBANI?
OVERVIEW OF RESULTS
The EGRA was administered to 438 pupils in schools where Dagbani was the designated language of instruction. Based on the results of the oral passage reading and reading comprehension subtasks, the state of reading in Dagbani can be summarized as shown in Figure A-7:
Figure A-7: Distribution of pupils by performance level,37 Dagbani
• Most pupils (77.6%, n = 351) were unable to read a single word of the story.
• Some pupils (18.5%, n = 72) read 15 correct words per minute, indicating they were just beginning to understand the alphabetic principle (or the relationship between sounds and letters). Not surprisingly, these pupils answered only 8.8% of the passage questions correctly. These pupils could read some words, but were not yet at a point of being able to understand what they read.
• A small group of pupils (3.5%, n = 13) demonstrated that they were transitioning from word-by-word identification to increased fluency. On average, these pupils read 36 correct
37 The four categories are defined as follows:
• Cannot read: oral reading fluency (ORF) score is zero • Read some words, but not understand: ORF score is greater than zero and reading comprehension score is below
60% correct of those attempted • Read with some understanding: reading comprehension score is 60% of the questions attempted • Read fluently and understand: reading comprehension score is 80% correct of total number of reading passage
comprehension questions
77.6% 18.5%
3.5%
0.4%
0 20 40 60 80 100
Cannot read Read some words, but not understand
Read with some understanding Read fluently and understand

A-20 | 2015 EGRA and EGMA in Ghana
words per minute and correctly answered 78% of the comprehension questions they attempted.
• An even smaller group (0.4%, n = 2) had sufficient fluency (automatic and accurate word identification) to focus on comprehension. On average, these pupils read 48 words per minute and answered 80% of the total number of passage comprehension questions correctly (4 out of 5 questions).
RESULTS BY SUBTASK
Table A-4: Average EGRA scores in Dagbani
EGRA subtask Percentage
of pupils who scored
zero
Average % correct of
items attempted
Average fluency score
(all pupils)
Average % correct of items
attempted (excluding
pupils with zero scores)
Average fluency score
(excluding pupils with zero
scores)
Listening comprehension 52.9% 24.1% — 51.0% —
Letter sound knowledge 49.6% 28.7%
10.8 correct letter sounds per minute
57.0% 21.4 correct letter sounds per minute
Nonword decoding 84.1% 8.7%
2.4 correct nonwords per minute
54.9% 15.2 correct nonwords per minute
Oral passage reading 77.6% 12.5%
4.3 correct words per minute
55.7% 19.1 correct words per minute
Reading comprehension 90.0% 5.6% — 56.1% —
LISTENING COMPREHENSION
This subtask measures an important pre-reading skill – the pupils’ ability to listen to and understand oral language. Pupils listened to a short story that was read to them in Dagbani, and were then asked three questions about the story. More than half the pupils (52.9%) scored zero (Table A-4) – they were unable to answer a single question correctly. On average, pupils answered 24.1% of the listening comprehension questions correctly. The average score for the pupils who did not score zero on the subtask (i.e., 47.1% of the pupils) was 51.0%.
Not surprisingly, the analysis showed that pupils who reported speaking a language at home other than Dagbani were more than 9.2

2015 EGRA and EGMA in Ghana | A-21
times as likely to score zero on the listening comprehension subtask as pupils who reported speaking Dagbani at home.
The large majority of pupils in the Dagbani language group (87.7%) were unable to answer a single question about the story read to them in English (not shown). This finding points to the very limited development of English listening and speaking for the Dagbani subpopulation.
LETTER SOUND KNOWLEDGE
The letter sound knowledge subtask assesses a pupil’s ability to produce the sounds of the letters of the alphabet naturally, without hesitation. If children struggle to produce letter sounds, they are unlikely to be able to decode unfamiliar words. Almost half (49.6%) of the pupils were unable to identify the sound of a single letter correctly (Table A-4). On average, pupils were able to correctly produce the letter sound in 28.7% of the items attempted, and produced, on average, 10.8 correct letter sounds per minute (clspm). When pupils scoring zero were removed from the analysis, the average correct letter sound score was 57.0% out of items attempted, at a fluency of 21.4 clspm. The pupils who could produce the sound of at least one letter correctly took, on average, 2.8 seconds per letter to produce the sound. This finding suggests that letter sound production was not yet fluent for most of these pupils. Instead, they were having to spend time thinking about each letter. Since letter sound production is important for identifying words (i.e., decoding), and automatic decoding facilitates reading comprehension, their low scores on nonwords, passage reading, and comprehension are understandable (Figure A-7).
NONWORD DECODING
For the nonword decoding subtask, pupils not only must know the sounds of individual letters, but also must be able to blend one sound with the next to correctly decode and say an unfamiliar word. Decoding nonwords is an important building block in reading development. More than three-quarters of pupils (84.1%) were unable to decode nonwords in Dagbani. This is not surprising given the performance on the letter sound knowledge subtask. On average, pupils were only able to decode 8.7% of the nonwords attempted, at an average fluency rate of 2.4 nonwords per minute. When pupils scoring zero were removed from the analysis, the average score on the nonword decoding subtask was 54.9% correct out of items attempted, at a fluency of 15.2 correct nonwords per minute. These

A-22 | 2015 EGRA and EGMA in Ghana
pupils were just beginning to understand sound–symbol relationships (i.e., the relationships between sounds and letters) and apply this knowledge to the task of reading.
Performance on the nonword decoding subtask was positively correlated with performance on the letter sound knowledge subtask, as well as with the oral passage reading subtask (discussed in the next section).
ORAL PASSAGE READING
As is depicted in Figure A-7 above, the majority of pupils (77.6%) scored zero on the oral passage reading subtask. On average, pupils read 12.5% of attempted words in the passage correctly, with an average fluency of 4.3 correct words per minute (cwpm). Like the nonword reading results, this indicates that these pupils were just beginning to learn to decode and read words in a passage. When the pupils scoring zero on this subtask were removed from the analysis, the average score was 55.7% correct out of items attempted at a fluency of 19.1 cwpm. This means that pupils who could read at least one word correctly took, on average, 3.1 seconds to read each word.
As seen in Figure A-7, a small group of pupils (3.5%) reached the ‘read with some understanding’ level by answering correctly at least 60% of the comprehension questions they attempted. These pupils demonstrated some emerging fluency with an average oral reading fluency (ORF) score of 36 cwpm.
Only two pupils (0.4%) were classified in Figure A-7 as ‘reading with comprehension’ and were able to correctly answer at least 80% of the comprehension questions (i.e., 4 out of 5 questions). These two pupils had an average ORF score of 48 cwpm.
Thus, the established pattern that increased reading fluency leads to improved reading comprehension is demonstrated in the pupils’ performance in early grade reading of Dagbani
READING COMPREHENSION
As can be seen in Table A-4, a large majority of pupils (90.0%) were unable to answer a single reading comprehension question correctly in Dagbani. The average number of questions attempted was less than 1 (0.6 out of a total of 5), and the average score was 5.6% correct of questions attempted. When the pupils scoring zero on this subtask were removed from the analysis, the average score was 56.1% correct out of items attempted. This reflects the lack of fluency

2015 EGRA and EGMA in Ghana | A-23
with which these pupils were reading. For this subtask, pupils were asked only the questions that corresponded to the amount of the text that they had read. In other words, few pupils were able to read far enough into the passage before the time limit was reached to be asked even the first comprehension question.
CORRECT ITEMS PER MINUTE, BY PERCENTILE
Finally, Figure A-8 presents the percentile distribution for the three timed subtasks of the Dagbani EGRA. It shows the corresponding number of correct items per minute for each percentile, and illustrates the relationships among the skills measured by these three subtasks. For example, at about the 90th percentile, on average, pupils were achieving 34 correct letter sounds per minute, 10 correct words per minute on the passage reading subtask, and 7 correct nonwords per minute. Figure A-8 further illustrates that letter sound knowledge precedes the ability to decode, and fluency rates of all three skills are related and increase together.
Figure A-8: Percentile distribution on all timed subtasks, Dagbani
CORRECT ITEMS PER MINUTE, BY PERCENTILE
In Dagbani, the proportion of pupils who could not read one word (nonreaders) decreased by about 10 percentage points, from 87.4% in 2013 to 77.6% in 2015. Among pupils who attempted to read the passage on the reading fluency and reading comprehension subtasks, these children struggled to understand the meaning of the passage, correctly answering, on average, less than 60% of the questions attempted. In 2015, 18.5% of the children were able to read
0
20
40
60
80
1 3 5 7 9 11 13 15 17 19 21 23 25 27 29 31 33 35 37 39 41 43 45 47 49 51 53 55 57 59 61 63 65 67 69 71 73 75 77 79 81 83 85 87 89 91 93 95 97 99
Cor
rect
item
s pe
r min
ute
Letter Sounds Non-Words Passage Reading

A-24 | 2015 EGRA and EGMA in Ghana
some words of the reading passage, but correctly answered less than 60% of the comprehension questions attempted, as compared to 9.7% of the children in 2013. Despite this 8.8 percentage point increase in the proportion of pupils who were reading some words in a Dagbani reading passage, only a slight improvement was observed in the percentage of pupils who were able to read and comprehend at the two highest performance levels, answering at least 60% of the questions attempted. In 2013, 2.9% of the pupils were able to read some parts of a passage and answer at least 60% of the questions correctly, compared to 3.9% in 2015.

2015 EGRA and EGMA in Ghana | A-25
HOW WELL ARE CHILDREN READING IN DANGME?
OVERVIEW OF RESULTS The EGRA was administered to 449 pupils in schools where Dangme was the designated language of instruction. Based on the results of the oral passage reading and reading comprehension subtasks, the state of reading in Dangme can be summarized as shown in Figure A-9:
Figure A-9: Distribution of pupils by performance level,38 Dangme
• Most pupils (68.6%, n = 306) were unable to read a single word of the story.
• Some pupils (17.1%, n = 79) read 11 correct words per minute, indicating they were just beginning to understand the alphabetic principle (or the relationship between sounds and letters). Not surprisingly, these pupils answered only 8.6% of the passage questions correctly. These pupils could read some words, but were not yet at a point of being able to understand what they read.
• A small group of pupils (12.8%, n = 58) was transitioning from word-by-word identification to increased fluency. On average, these pupils read 16 correct words per minute and correctly
38 The four categories are defined as follows:
• Cannot read: oral reading fluency (ORF) score is zero • Read some words, but not understand: ORF score is greater than zero and reading comprehension score is below
60% correct of those attempted • Read with some understanding: reading comprehension score is 60% of the questions attempted • Read fluently and understand: reading comprehension score is 80% correct of total number of reading passage
comprehension questions
68.6% 17.1% 12.8%
1.6%
0 20 40 60 80 100
Cannot read Read some words, but not understandRead with some understanding Read fluently and understand

A-26 | 2015 EGRA and EGMA in Ghana
answered an average of 96% of the comprehension questions they attempted.
• A smaller group (1.6%, n = 6) had sufficient fluency (automatic and accurate word identification) to focus on comprehension. On average, these pupils read 64 words per minute and answered 91.5% of the total number of passage comprehension questions correctly (almost 5 out of 5 questions).
RESULTS BY SUBTASK
Table A-5: Average EGRA scores in Dangme
EGRA subtask Percentage
of pupils who scored
zero
Average % correct of
items attempted
Average fluency score (all
pupils)
Average % correct of
items attempted (excluding pupils with
zero scores)
Average fluency score
(excluding pupils with
zero scores)
Listening comprehension 16.8% 41.7% — 50.2% —
Letter sound knowledge 14.8% 35.9%
10.6 correct letter sounds per minute
42.1% 12.5 correct letter sounds per minute
Nonword decoding 75.7% 12.0%
2.9 correct nonwords per minute
49.2% 12.1 correct nonwords per minute
Oral passage reading 68.6% 14.3%
4.9 correct words per minute
45.4% 15.5 correct words per minute
Reading comprehension 78.3% 17.0% — 78.4% —
LISTENING COMPREHENSION
This subtask measures an important pre-reading skill – the pupils’ ability to listen to and understand oral language. Pupils listened to a short story that was read to them in Dangme and were then asked three questions about the story. Slightly more than one-sixth of the pupils (16.8%) scored zero (Table A-5) – they were unable to answer a single question correctly. On average, pupils answered 41.7% of the listening comprehension questions correctly. The average score for the pupils who did not score zero on the subtask (i.e., 83.2% of the pupils) was 50.2%.

2015 EGRA and EGMA in Ghana | A-27
Not surprisingly, the analysis showed that pupils who reported speaking a language at home other than Dangme were more than 6.6 times as likely to score zero on the listening comprehension subtask as pupils who reported speaking Dangme at home.
The majority of pupils in this language group (68.9%) were unable to answer a single question about the story read to them in English (not shown). This finding points to the limited development of English listening and speaking skills for the Dangme subpopulation.
LETTER SOUND KNOWLEDGE
The letter sound knowledge subtask assesses a pupil’s ability to produce the sounds of the letters of the alphabet naturally, without hesitation. If children struggle to produce letter sounds, they are unlikely to be able to decode unfamiliar words and read fluently. Only a few (14.8%) of the pupils were unable to identify the sound of a single letter correctly (Table A-5). On average, pupils were able to correctly produce the letter sound in 35.9% of the items attempted, and produced, on average, 10.6 correct letter sounds per minute (clspm). When pupils scoring zero were removed from the analysis, the average correct letter sound score was 42.1% out of items attempted, at a fluency rate of 12.5 clspm. The pupils who could produce the sound of at least one letter correctly took, on average, 4.8 seconds per letter to produce the sound. This finding suggests that letter sound production was not yet fluent for most of these pupils. Instead, they were having to spend time thinking about each letter. Since letter sound production is important for identifying words (i.e., decoding), and automatic decoding facilitates reading comprehension, their low scores on nonwords, passage reading, and comprehension are understandable (Figure A-9).
NONWORD DECODING
For the nonword decoding subtask, pupils not only must know the sounds of individual letters, but also must be able to blend one sound with the next to correctly decode and say an unfamiliar word. Decoding nonwords is an important building block in reading development. About three quarters of pupils (75.7%) were unable to decode nonwords in Dangme. This is not surprising given the performance on the letter sound knowledge subtask. On average, pupils were only able to decode 12% of the nonwords attempted at an average fluency rate of 2.9 correct nonwords per minute. When pupils scoring zero were removed from the analysis, the average score on the nonword decoding subtask was 49.2% correct out of items

A-28 | 2015 EGRA and EGMA in Ghana
attempted, at a fluency rate of 12.1 correct nonwords per minute. These pupils were just beginning to understand sound-symbol relationships (i.e., relationships between sounds and letters) and apply this knowledge to the task of reading.
Performance on the nonword decoding subtask was positively correlated with performance on the letter sound knowledge subtask, as well as with the oral passage reading subtask (discussed in the next section).
ORAL PASSAGE READING
As is depicted in Table A-5 above, the majority of pupils (68.6%) scored zero on the oral passage reading subtask. On average, pupils read 14.3% of attempted words in the passage correctly, with an average fluency rate of 4.9 correct words per minute (cwpm). Like the nonword reading results, this indicates that these pupils were just beginning to learn to decode read words in a passage. When the pupils scoring zero on this subtask were removed from the analysis, the average score was 45.4% correct out of items attempted, at a fluency rate of 15.5 cwpm. This means that pupils who could read at least one word correctly took, on average, 3.9 seconds to read each word.
As seen in Figure A-9, a small group of pupils (12.8%) reached the ‘read with some understanding’ level by answering correctly at least 60% of the reading comprehension questions they attempted. These pupils demonstrated some emerging fluency with an average oral reading fluency (ORF) score of 16 cwpm.
Pupils classified in Figure A-9 as ‘reading with comprehension’ (1.6% of the pupils), who correctly answered at least 80% of the total number of comprehension questions (i.e., 4 out of 5 questions), had an average ORF score of 64 cwpm.
Thus, the established pattern that increased reading fluency leads to improved reading comprehension is demonstrated in the pupils’ performance in early grade reading of Dangme.
READING COMPREHENSION
As can be seen in Table A-5, a large majority of pupils (78.3%) were unable to answer a single reading comprehension question correctly in Dangme. The average number of questions attempted was less than 1 (0.6 out of a total of 5), and the average score was 17.0% correct of questions attempted. When the pupils scoring zero on this

2015 EGRA and EGMA in Ghana | A-29
subtask were removed from the analysis, the average score was 78.4% correct out of items attempted. This reflects the lack of fluency with which these pupils were reading. For this subtask, pupils were asked only the questions that corresponded to the amount of the text that they had read. In other words, few pupils were able to read far enough into the passage before the time limit was reached to be asked even the first comprehension question.
CORRECT ITEMS PER MINUTE, BY PERCENTILE
Finally, Figure A-10 presents the percentile distribution for the three timed subtasks of the Dangme EGRA. It shows the corresponding number of correct items per minute for each percentile, and illustrates the relationships among the skills measured by these three subtasks. For example, at about the 80th percentile, on average, pupils were achieving 18 correct letter sounds per minute, 6 correct words per minute on the passage reading subtask, and 2 correct nonwords per minute. Figure A-10 further illustrates that letter sound knowledge precedes the ability to decode, and fluency rates of all three skills are related and increase together.
Figure A-10: Percentile distribution on all timed subtasks, Dangme
TRENDS FROM 2013 TO 2015
In Dangme, the proportion of pupils who could not read one word (nonreaders) increased by approximately 10 percentage points, from 58.1% in 2013 to 68.6% in 2015. Furthermore, even among children who attempted to read the passage, they struggled to understand its meaning, correctly answering less than 60% of the questions
0
20
40
60
80
1 3 5 7 9 11 13 15 17 19 21 23 25 27 29 31 33 35 37 39 41 43 45 47 49 51 53 55 57 59 61 63 65 67 69 71 73 75 77 79 81 83 85 87 89 91 93 95 97 99
Cor
rect
item
s pe
r min
ute
Letter Sounds Non-Words Passage Reading

A-30 | 2015 EGRA and EGMA in Ghana
attempted. In 2013, 21.8% of the children were able to read some words of the reading passage, but answered less than 60% of the comprehension questions, as compared to 17.1% of the children in 2015 – a decrease of 4.7 percentage points. There was also a 5.7 percentage point decrease in the share of pupils who were able to read and comprehend at the two highest performance levels, answering at least 60% of the questions attempted. In 2013, 20.1% of the pupils were able to read some of a passage and answer at least 60% of the questions correctly, compared to 14.4% in 2015.

2015 EGRA and EGMA in Ghana | A-31
HOW WELL ARE CHILDREN READING IN EWE?
OVERVIEW OF RESULTS The EGRA was administered to 535 pupils in schools where Ewe was the designated language of instruction. Based on the results of the oral passage reading and reading comprehension subtasks, the state of reading in Ewe can be summarized as shown in Figure A-11:
Figure A-11: Distribution of pupils by performance level,39 Ewe
• Most pupils (69.0%, n = 380) were unable to read a single word of the story.
• Some pupils (22.4%, n = 116) read 14 correct words per minute, indicating they were just beginning to understand the alphabetic principle (or the relationship between sounds and letters). Not surprisingly, these pupils answered only 6.7% of the passage questions correctly. These pupils could read some words, but were not yet at a point of being able to understand what they read.
• A small group of pupils (3.5%, n = 16) demonstrated that they were transitioning from word-by-word identification to increased fluency. On average, these pupils read 45 correct
39 The four categories are defined as follows:
• Cannot read: oral reading fluency (ORF) score is zero • Read some words, but not understand: ORF score is greater than zero and reading comprehension score is below
60% correct of those attempted • Read with some understanding: reading comprehension score is 60% of the questions attempted • Read fluently and understand: reading comprehension score is 80% correct of total number of reading passage
comprehension questions
69.0% 22.4%
3.5%
5.1%
0 20 40 60 80 100
Cannot read Read some words, but not understandRead with some understanding Read fluently and understand

A-32 | 2015 EGRA and EGMA in Ghana
words per minute and correctly answered 73% of the comprehension questions they attempted.
• A small group of pupils (5.1%, n = 23) had sufficient fluency (automatic and accurate word identification) to focus on comprehension. On average, these pupils read 58 words per minute and answered 87.4% of the total number of passage comprehension questions correctly.
RESULTS BY SUBTASK
Table A-6: Average EGRA scores in Ewe
EGRA subtask Percentage
of pupils who scored
zero
Average % correct of
items attempted
Average fluency
score (all pupils)
Average % correct of
items attempted (excluding pupils with
zero scores)
Average fluency score
(excluding pupils with
zero scores)
Listening comprehension 19.1% 46.5% — 57.5% —
Letter sound knowledge 28.9% 32.9%
10.3 correct letter sounds per minute
46.3% 14.5 correct letter sounds per minute
Nonword decoding 72.1% 16.2%
4.5 correct nonwords per minute
58.3% 16.1 correct nonwords per minute
Oral passage reading 69.0% 18.6%
7.6 correct words per minute
60.0% 24.5 correct words per minute
Reading comprehension 85.0% 9.8% — 65.4% —
LISTENING COMPREHENSION
This subtask measures an important pre-reading skill – the pupils’ ability to listen to and understand oral language. Pupils listened to a short story that was read to them in Ewe and were then asked three questions about the story. Less than one-fifth of the pupils (19.1%) scored zero (Table A-6) – they were unable to answer a single question correctly. On average, pupils answered 46.5% of the listening comprehension questions correctly. The average score for the pupils who did not score zero on the subtask (i.e., 80.9% of the pupils) was 57.5%.
Not surprisingly, the analysis showed that pupils who reported speaking a language at home other than Ewe were more than 2.3

2015 EGRA and EGMA in Ghana | A-33
times as likely to score zero on the listening comprehension subtask as pupils who reported speaking Ewe at home.
The large majority of pupils in this language group (79.5%) were unable to answer a single question about the story read to them in English (not shown). This finding points to the limited development of English listening and speaking for the Ewe subpopulation.
LETTER SOUND KNOWLEDGE
The letter sound knowledge subtask assesses a pupil’s ability to produce the sounds of the letters of the alphabet naturally, without hesitation. If children struggle to produce letter sounds, they are unlikely to be able to decode words and read fluently. Slightly less than a third (28.9%) of the pupils were unable to identify the sound of a single letter correctly. On average, pupils were able to correctly produce the letter sound in 32.9% of the items attempted, and produced, on average, 10.3 correct letter sounds per minute (clspm). When pupils scoring zero were removed from the analysis, the average correct letter sound score was 46.3% out of items attempted, at a fluency of 14.5 clspm. The pupils who could produce the sound of at least one letter correctly took, on average, 4.1 seconds per letter to produce the sound. This finding suggests that letter sound production was not yet fluent for most of these pupils. Instead, they were having to spend time thinking about each letter. Since letter sound production is important for identifying words (i.e., decoding), and automatic decoding facilitates reading comprehension, their low scores on nonwords, passage reading, and comprehension are understandable (Figure A-11).
NONWORD DECODING
For the nonword decoding subtask, pupils not only must know the sounds of individual letters, but also must be able to blend one sound with the next to correctly decode and say an unfamiliar word. Decoding nonwords is an important building block in reading development. Slightly less than two-thirds of pupils (72.1%) were unable to decode nonwords in Ewe. This is not surprising given the performance on the letter sound knowledge subtask. On average, pupils were only able to decode 16.2% of the nonwords attempted at an average fluency rate of 4.5 correct nonwords per minute. When pupils scoring zero were removed from the analysis, the average score on the nonword decoding subtask was 58.3% correct out of items attempted, at a fluency rate of 16.1 correct nonwords per minute. These pupils were just beginning to understand sound–

A-34 | 2015 EGRA and EGMA in Ghana
symbol relationships (i.e., the relationships between sounds and letters) and apply this knowledge to the task of reading.
Performance on the nonword decoding subtask was positively correlated with performance on the letter sound knowledge subtask, as well as with the oral passage reading subtask (discussed in the next section).
ORAL PASSAGE READING
As is depicted in Table A-6 above, the majority of pupils (69.0%) scored zero on the oral passage reading subtask. On average, pupils read 18.6% of attempted words in the passage correctly, with an average fluency rate of 7.6 correct words per minute (cwpm). Like the nonword reading results, this indicates that these pupils were just beginning to learn to decode and read words in a passage. When the pupils scoring zero on this subtask were removed from the analysis, the average score was 60.0% correct out of items attempted, at a fluency of 24.5 cwpm. This means that pupils who could read at least one word correctly took, on average, 2.4 seconds to read each word.
As seen in Figure A-11, a small group of pupils (3.5%) reached the ‘read with some understanding’ level by answering correctly at least 60% of the reading comprehension questions they attempted. These pupils demonstrated emerging reading fluency with an average oral reading fluency (ORF) score for these pupils at 45 cwpm.
Pupils classified in Figure A-11 as ‘reading with comprehension’ (5.1% of the pupils), who correctly answered at least 80% of the comprehension questions (i.e., 4 out of 5 questions), had an average ORF score of 58 cwpm. It is worth noting that the percentage of pupils in this category, while still low overall, was more than double that of the other languages assessed, which were all 2.1% or lower. Several factors likely contributed to higher reading ability among Ewe pupils, including:
• Of all LOIs assessed, Ewe schools had the highest proportion of pupils reporting that they spoke the LOI at home as their primary language, at 96%;
• 95% of P2 teachers in Ewe schools were native speakers of the language;
• 82% of Ewe teachers reported studying Ewe in pre-service teacher training;

2015 EGRA and EGMA in Ghana | A-35
• 69% of pupils in Ewe schools had an Ewe reader, and 78% had an Ewe exercise book;
• 69% of Ewe teachers also used Ewe to teach mathematics, indicating that using the LOI was likely pervasive across subjects taught.
Thus, the established pattern that increased reading fluency leads to improved reading comprehension was demonstrated in the pupils’ performance in early grade reading of Ewe. While Ewe schools still had very low levels of reading ability, with 69% scoring zero, there appear to have been fewer obstacles to learning for these pupils, in that they were being instructed in a familiar language by native-speaking teachers who largely had also formally studied Ewe. Most pupils also had access to Ewe materials. The combination of these factors illustrates the possibility and promise of the LOI policy in more homogenous contexts.
READING COMPREHENSION
As can be seen in Table A-6, a large majority of pupils (85.0%) were unable to answer a single reading comprehension question correctly in Ewe. The average number of questions attempted was 1 (out of a total of 5), and the average score was 9.8% correct of questions attempted. When the pupils scoring zero on this subtask were removed from the analysis, the average score was 65.4% correct out of items attempted. This reflects the lack of fluency with which these pupils were reading. For this subtask, pupils were asked only the questions that corresponded to the amount of the text that they had read. In other words, few pupils were able to read far enough into the passage before the time limit was reached to be asked more than the first comprehension question.
CORRECT ITEMS PER MINUTE, BY PERCENTILE
Finally, Figure A-12 presents the percentile distribution for the three timed subtasks of the Ewe EGRA. It shows the corresponding number of correct items per minute for each percentile, and illustrates the relationships among the skills measured by these three subtasks. For example, at about the 80th percentile, on average, pupils were achieving 18 correct letter sounds per minute, 5 correct words per minute on the passage reading subtask, and 5 correct nonwords per minute. Figure A-12 further illustrates that letter sound knowledge precedes the ability to decode, and fluency rates of all three skills are

A-36 | 2015 EGRA and EGMA in Ghana
related and increase together.
Figure A-12: Percentile distribution on all timed subtasks, Ewe
TRENDS FROM 2013 TO 2015
No noticeable changes were observed from 2013 to 2015 in the percentage of pupils who were unable to read any words (nonreaders). Among the pupils who attempted to read the passage on the reading fluency and reading comprehension subtasks, even when these children attempted to read the passage, they struggled to understand the meaning of the passage, correctly answering less than 60% of the questions attempted. In 2015, 22.4% of the children were able to read some words of the reading passage, but correctly answered less than 60% of the comprehension questions, as compared to 15.7% of the children in 2013 – which represents a 6.8 percentage point increase. There was also a decrease of 8.3 percentage points in the proportion of pupils who were able to read and comprehend at the two highest performance levels, answering at least 60% of the questions. In 2013, 16.9% of the pupils were able to read some of a passage and answer 60% or more of the questions correctly, compared to 8.6% in 2015.
0
20
40
60
80
1 3 5 7 9 11 13 15 17 19 21 23 25 27 29 31 33 35 37 39 41 43 45 47 49 51 53 55 57 59 61 63 65 67 69 71 73 75 77 79 81 83 85 87 89 91 93 95 97 99
Cor
rect
item
s pe
r min
ute
Letter Sounds Non-Words Passage Reading

2015 EGRA and EGMA in Ghana | A-37
HOW WELL ARE CHILDREN READING IN FANTE?
OVERVIEW OF RESULTS The EGRA was administered to 698 pupils in schools where Fante was the designated language of instruction. Based on the results of the oral passage reading and reading comprehension subtasks, the state of reading in Fante can be summarized as shown in Figure A-13:
Figure A-13: Distribution of pupils by performance level,40 Fante
• Most pupils (69.4%, n = 472) were unable to read a single word of the story.
• Some pupils (24.2%, n = 175) read 13 correct words per minute, indicating they were just beginning to understand the alphabetic principle (or the relationship between sounds and letters). Not surprisingly, these pupils answered only 12% of the passage questions correctly. These pupils could read some words, but were not yet at a point of being able to understand what they read.
• A small group of pupils (6.0%, n = 48) was transitioning from word-by-word identification to increased fluency. On average, these pupils read 24 correct words per minute and correctly
40 The four categories are defined as follows:
• Cannot read: oral reading fluency (ORF) score is zero • Read some words, but not understand: ORF score is greater than zero and reading comprehension score is below
60% correct of those attempted • Read with some understanding: reading comprehension score is 60% of the questions attempted • Read fluently and understand: reading comprehension score is 80% correct of total number of reading passage
comprehension questions
69.4% 24.2% 6.0% 0.5%
0 20 40 60 80 100
Cannot read Read some words, but not understandRead with some understanding Read fluently and understand

A-38 | 2015 EGRA and EGMA in Ghana
answered 91% of the comprehension questions they attempted.
• A smaller group (0.5%, n = 3) had sufficient fluency (automatic and accurate word identification) to focus on comprehension. On average, these pupils read 52 words per minute and answered 80% of the total number of passage comprehension questions correctly.
RESULTS BY SUBTASK
Table A-7: Average EGRA scores in Fante
EGRA subtask
Percentage of pupils
who scored
zero
Average % correct of
items attempted
Average fluency
score (all pupils)
Average % correct of
items attempted (excluding pupils with
zero scores)
Average fluency score
(excluding pupils with
zero scores)
Listening comprehension 6.0% 68.7% — 73.0% —
Letter sound knowledge 27.5% 40.8%
16.1 correct letter sounds per minute
56.3% 22.2 correct letter sounds per minute
Nonword decoding 71.8% 15.4%
4.3 correct nonwords per minute
54.6% 15.3 correct nonwords per minute
Oral passage reading 69.4% 14.6%
4.9 correct words per minute
47.7% 15.8 correct words per minute
Reading comprehension 80.3% 11.9% — 60.5% —
LISTENING COMPREHENSION
This subtask measures an important pre-reading skill – the pupils’ ability to listen to and understand oral language. Pupils listened to a short story that was read to them in Fante and were then asked three questions about the story. A small group of pupils (6.0%) scored zero (Table A-7) – they were unable to answer a single question correctly. On average, pupils answered 68.7% of the listening comprehension questions correctly. The overall average score for the pupils who did not score zero on the subtask (i.e., 94.0% of the pupils) was 73.0%. The data suggest that about two thirds of the pupils were able to understand a story told to them in a familiar language.
2015 EGRA and EGMA in Ghana | A-39
Not surprisingly, the analysis showed that pupils who reported speaking a language at home other than Fante were more than 2.6 times as likely to score zero on the listening comprehension subtask as pupils who reported speaking Fante at home.
The large majority of pupils in this language group (74.2%) were unable to answer a single question about the story read to them in English (not shown). This finding points to the limited development of English listening and speaking for the Ewe subpopulation.
LETTER SOUND KNOWLEDGE
The letter sound knowledge subtask assesses a pupil’s ability to produce the sounds of the letters of the alphabet naturally, without hesitation. If children struggle to produce letter sounds, they are unlikely to be able to decode words and read fluently. Slightly less than one third (27.5%) of the pupils were unable to identify the sound of a single letter correctly. On average, pupils were able to correctly produce the letter sound in 40.8% of the items attempted, and produced, on average 16.1 correct letter sounds per minute (clspm). When pupils scoring zero were removed from the analysis, the average correct letter sound score was 56.3% out of items attempted, at a fluency of 22.2 clspm. The pupils who could produce the sound of at least one letter correctly took, on average, 2.7 seconds per letter to produce the sound. This finding suggests that letter sound production was not yet fluent for most of these pupils. Instead, they were having to spend time thinking about each letter. Since letter sound production is important for identifying words (i.e., decoding), and automatic decoding facilitates reading comprehension, their low scores on nonwords, passage reading, and comprehension are understandable (Figure A-13).
NONWORD DECODING
For the nonword decoding subtask, pupils not only must know the sounds of individual letters, but also must be able to blend one sound with the next to correctly decode and say an unfamiliar word. Decoding nonwords is an important building block in reading development. More than two-thirds of pupils (71.8%) were unable to decode nonwords in Fante. This is not surprising given the performance on the letter sound knowledge subtask. On average, pupils were only able to decode 15.4% of the nonwords attempted at an average fluency rate of 4.3 correct nonwords per minute. When pupils scoring zero were removed from the analysis, the average score on the nonword decoding subtask was 54.6% correct out of

A-40 | 2015 EGRA and EGMA in Ghana
items attempted, at a fluency of 15.3 correct nonwords per minute. These pupils were just beginning to understand sound-symbol relationships (i.e., relationships between sounds and letters) and apply this knowledge to the task of reading.
Performance on the nonword decoding subtask was positively correlated with performance on the letter sound knowledge subtask, as well as with the oral passage reading subtask (discussed in the next section).
ORAL PASSAGE READING
As is depicted in Table A-7 above, the majority of pupils (69.4%) scored zero on the oral passage reading subtask. On average, pupils read 14.6% of attempted words in the passage correctly, with an average fluency rate of 4.9 correct words per minute (cwpm). Like the nonword reading results, this indicates that these pupils were just beginning to learn to decode and read words in a passage. When the pupils scoring zero on this subtask were removed from the analysis, the average score was 47.7% correct out of the items attempted, at a fluency of 15.8 cwpm. This means that pupils who could read at least one word correctly took, on average, 3.8 seconds to read each word.
As seen in Figure 1, a small group of pupils (6.0%) reached the “read with some understanding” level by answering correctly at least 60% of the reading comprehension questions they attempted. These pupils demonstrated emerging fluency in reading with an average oral reading fluency (ORF) score for these pupils at 24 cwpm.
Pupils classified in Figure A-13 as ‘reading with comprehension’ (0.5% of the pupils), who correctly answered at least 80% of the comprehension questions (i.e., 4 out of 5 questions), had an average ORF score of 52 cwpm.
Thus, the established pattern that increased reading fluency leads to improved reading comprehension is demonstrated in the pupils’ performance in early grade reading of Fante.
READING COMPREHENSION
As can be seen in Table A-7, a large majority of pupils (80.3%) were unable to answer a single reading comprehension question correctly in Fante. The average number of questions attempted was less than 1 (0.7 out of a total of 5), and the average score was 11.9% correct of questions attempted. When the pupils scoring zero on this subtask were removed from the analysis, the average score was 60.5%

2015 EGRA and EGMA in Ghana | A-41
correct out of items attempted. This reflects the lack of fluency with which these pupils were reading. For this subtask, pupils were asked only the questions that corresponded to the amount of the text that they had read. In other words, few pupils were able to read far enough into the passage before the time limit was reached to be asked even the first comprehension question.
CORRECT ITEMS PER MINUTE, BY PERCENTILE
Finally, Figure A-14 presents the percentile distribution for the three timed subtasks of the Fante EGRA. It shows the corresponding number of correct items per minute for each percentile, and illustrates the relationships among the skills measured by these three subtasks. For example, at about the 80th percentile, on average, pupils were achieving 29 correct letter sounds per minute, 7 correct words per minute on the passage reading subtask, and 7 correct nonwords per minute. Figure A-14 further illustrates that letter sound knowledge precedes the ability to decode, and fluency rates of all three skills are related and increase together.
Figure A-14: Percentile distribution on all timed subtasks, Fante
TRENDS FROM 2013 TO 2015
In Fante, the proportion of pupils who could not read one word (nonreaders) decreased by almost 12 percentage points, from 81.1% in 2013 to 69.4% in 2015. Among the pupils who attempted to read the passage on the reading fluency and reading comprehension subtasks, during both assessment periods, this second group of children struggled to understand the meaning of the passage. In 2015, 24.2% of these children were able to read some words of the reading passage, but answered less than 60% of the comprehension
0
20
40
60
80
1 3 5 7 9 11 13 15 17 19 21 23 25 27 29 31 33 35 37 39 41 43 45 47 49 51 53 55 57 59 61 63 65 67 69 71 73 75 77 79 81 83 85 87 89 91 93 95 97 99
Cor
rect
item
s pe
r min
ute
Letter Sounds Non-Words Passage Reading

A-42 | 2015 EGRA and EGMA in Ghana
questions, as compared to 14.4% of the children in 2013. Although this change represents an increase of almost 10 percentage points in the proportion of pupils who were reading some words in a Fante reading passage, only a slight improvement was observed in the percentage of pupils who were able to read at the two highest performance levels, answering at least 60% of the questions attempted. In 2013, 4.5% of the pupils were able to read some of a passage and answer at least 60% of the questions correctly, compared to 6.5% in 2015.

2015 EGRA and EGMA in Ghana | A-43
HOW WELL ARE CHILDREN READING IN GA?
OVERVIEW OF RESULTS The EGRA was administered to 500 pupils in schools where Ga was the designated language of instruction. Based on the results of the oral passage reading and reading comprehension subtasks, the state of reading in Ga can be summarized as shown in Figure A-15:
Figure A-15: Distribution of pupils by performance level,41 Ga
• Most pupils (65.8%, n = 337) were unable to read a single word of the story.
• Some pupils (32.8%, n = 155) read 13 correct words per minute, indicating they were just beginning to understand the alphabetic principle (or the relationship between sounds and letters). Not surprisingly, these pupils answered only 1.7% of the passage questions correctly. They could read some words, but were not yet at a point of being able to understand what they read.
• A small group of pupils (1.0%, n = 6) was transitioning from word-by-word identification to increased fluency. On average, these pupils read 34 correct words per minute and correctly
41 The four categories are defined as follows:
• Cannot read: oral reading fluency (ORF) score is zero • Read some words, but not understand: ORF score is greater than zero, and reading comprehension score is below
60% correct of those attempted • Read with some understanding: reading comprehension score is 60% of the questions attempted • Read fluently and understand: reading comprehension score is 80% correct of total number of reading passage
comprehension questions
65.8% 32.8%
1.0%
0.5%
0 20 40 60 80 100
Cannot read Read some words, but not understandRead with some understanding Read fluently and understand

A-44 | 2015 EGRA and EGMA in Ghana
answered 80% of the comprehension questions they attempted.
• A smaller group (0.5%, n = 2) had sufficient fluency (automatic and accurate word identification) to focus on comprehension. On average, these pupils read 62 words per minute and answered 80% of the total number of passage comprehension questions correctly (i.e., 4 out of 5 questions).
RESULTS BY SUBTASK
Table A-8: Average EGRA scores in Ga
EGRA subtask Percentage
of pupils who scored
zero
Average % correct of
items attempted
Average fluency score
(all pupils)
Average % correct of
items attempted (excluding pupils with
zero scores)
Average fluency score
(excluding pupils with
zero scores)
Listening comprehension 45.3% 28.8% — 52.6% —
Letter sound knowledge 43.7% 33.6%
14.3 correct letter sounds per minute
59.7% 25.5 correct letter sounds per minute
Nonword decoding 74.4% 14.3%
4.0 correct nonwords per minute
55.9% 15.5 correct nonwords per minute
Oral passage reading 65.8% 13.5%
5.0 correct words per minute
39.5% 14.6 correct words per minute
Reading comprehension 96.1% 2.2% — 56.1% —
LISTENING COMPREHENSION
This subtask measures an important pre-reading skill – the pupils’ ability to listen to and understand oral language. Pupils listened to a short story that was read to them in Ga, and were then asked three questions about the story. Less than half the pupils (45.3%) scored zero (Table A-8) – they were unable to answer a single question correctly. On average, pupils answered 28.8% of the listening comprehension questions correctly. The average score for the pupils who did not score zero on the subtask (i.e., 54.7% of the pupils) was 52.6%.
Not surprisingly, the analysis showed that pupils who reported speaking a language at home other than Ga were more than 10.3

2015 EGRA and EGMA in Ghana | A-45
times as likely to score zero on the listening comprehension subtask as pupils who reported speaking Ga at home.
Unlike any of the other 2015 EGRA languages, a smaller percentage of pupils attending schools where Ga was the language of instruction obtained a zero score on the listening comprehension subtask when the story was read to them in English as compared to Ga (e.g., 33.6% and 45.3%, respectively).
LETTER SOUND KNOWLEDGE
The letter sound knowledge subtask assesses a pupil’s ability to produce the sounds of the letters of the alphabet naturally, without hesitation. If children struggle to produce letter sounds, they are unlikely to be able to decode familiar words. Less than half (43.7%) of the pupils were unable to identify the sound of a single letter correctly. On average, pupils were able to correctly produce the letter sound in 33.6% of the items attempted, and they produced, on average, 14.3 correct letter sounds per minute (clspm). When pupils scoring zero were removed from the analysis, the average correct letter sound score was 59.7% out of items attempted, at a fluency of 25.5 clspm. The pupils who could produce the sound of at least one letter correctly took, on average, 2.4 seconds per letter to produce the sound. This finding suggests that letter sound production was not yet fluent for most of these pupils. Instead, they were having to spend time thinking about each letter. Since letter sound production is important for identifying words (i.e., decoding), and automatic decoding facilitates reading comprehension, their low scores on nonwords, passage reading, and comprehension are understandable (Figure A-15).
NONWORD DECODING
For the nonword decoding subtask, pupils not only must know the sounds of individual letters, but also must be able to blend one sound with the next to correctly decode and say an unfamiliar word. Decoding nonwords is an important building block in reading development. Almost three quarters of pupils (74.4%) were unable to decode nonwords in Ga. This is not surprising given the performance on the letter sound knowledge subtask. On average, pupils were able to decode only 14.3% of the nonwords attempted, at an average fluency rate of 4.0 correct nonwords per minute. When pupils scoring zero were removed from the analysis, the average score on the nonword decoding subtask was 55.9% correct out of items attempted, at a fluency of 15.5 correct nonwords per minute. These pupils were

A-46 | 2015 EGRA and EGMA in Ghana
just beginning to understand sound–symbol relationships (i.e., the relationships between sounds and letters) and apply this knowledge to the task of reading.
Performance on the nonword decoding subtask was positively correlated with performance on the letter sound knowledge subtask, as well as with the oral passage reading subtask (discussed in the next section).
ORAL PASSAGE READING
As is depicted in Table A-8 above, the majority of pupils (65.8%) scored zero on the oral passage reading subtask. On average, pupils read 13.5% of attempted words in the passage correctly, with an average fluency rate of 5.0 correct words per minute (cwpm). Like the nonword reading results, this indicates that these pupils were just beginning to learn to decode and read words in a passage. When the pupils scoring zero on this subtask were removed from the analysis, the average score was 39.5% correct out of items attempted, at a fluency of 14.6 cwpm. This means that pupils who could read at least one word correctly took, on average, 4.1 seconds to read each word.
As seen in Figure A-15, a small group of pupils (1.0%) reached the ‘read with some understanding’ level by answering correctly at least 60% of the reading comprehension questions they attempted. These pupils demonstrated reading emerging fluency; the average oral reading fluency (ORF) score for these pupils was 34 cwpm.
Pupils classified in Figure A-15 as ‘reading with comprehension’ (0.5% of the pupils), who correctly answered at least 80% of the comprehension questions (i.e., 4 out of the 5 questions), had an average ORF score of 62 cwpm.
Thus, the established pattern that increased reading fluency leads to improved reading comprehension is demonstrated in the pupils’ performance in early grade reading in Ga.
READING COMPREHENSION
As can be seen in Table A-8, a large majority of pupils (96.1%) were unable to answer a single reading comprehension question correctly in Ga. The average number of questions attempted was less than 1 (0.8 out of a total of 5), and the average score was 2.2% correct of questions attempted. When the pupils scoring zero on this subtask were removed from the analysis, the average score was 56.1% correct out of items attempted. This reflects the lack of fluency with

2015 EGRA and EGMA in Ghana | A-47
which these pupils were reading. For this subtask, pupils were asked only the questions that corresponded to the amount of the text that they had read. In other words, few pupils were able to read far enough into the passage before the time limit was reached to be asked even the first comprehension question.
CORRECT ITEMS PER MINUTE, BY PERCENTILE
Finally, Figure A-16 presents the percentile distribution for the three timed subtasks of the Ga EGRA. It shows the corresponding number of correct items per minute for each percentile, and illustrates the relationships among the skills measured by these three subtasks. For example, at about the 80th percentile, on average, pupils were achieving 31 correct letter sounds per minute, 5 correct words per minute on the passage reading subtask, and 7 correct non-words per minute. Figure A-16 further illustrates that letter sound knowledge precedes the ability to decode, and fluency rates of all three skills are related and increase together.
Figure A-16: Percentile distribution on all timed subtasks, Ga
TRENDS FROM 2013 TO 2015
No noticeable changes were observed in the percentage of pupils who were unable to read any words (nonreaders). Among pupils who attempted to read the passage associated with the reading fluency and reading comprehension subtasks, they struggled to understand its meaning, correctly answering less than 60% of the questions attempted. In 2015, 32.8% of the children were able to read some words of the reading passage, but answered less than 60% of the comprehension questions, compared to 28.9% of the children in
0
20
40
60
80
1 3 5 7 9 11 13 15 17 19 21 23 25 27 29 31 33 35 37 39 41 43 45 47 49 51 53 55 57 59 61 63 65 67 69 71 73 75 77 79 81 83 85 87 89 91 93 95 97 99Cor
rect
item
s pe
r min
ute
Letter Sounds Non-Words Passage Reading

A-48 | 2015 EGRA and EGMA in Ghana
2015 – representing an increase of about 4 percentage points. Furthermore, there was a slight drop in the percentage of pupils who were able to read and comprehend at the two highest performance levels, answering at least 60% of the questions. In 2013, 3.9% of the pupils were able to read some of a passage in Ga and answer 60% or more of the questions correctly, compared to 1.5% in 2015.

2015 EGRA and EGMA in Ghana | A-49
HOW WELL ARE CHILDREN READING IN GONJA?
OVERVIEW OF RESULTS The EGRA was administered to 333 pupils in schools where Gonja was the designated language of instruction. Based on the results of the oral passage reading and reading comprehension subtasks, the state of reading in Gonja can be summarized as shown in Figure A-17:
Figure A-17: Distribution of pupils by performance level,42 Gonja
• Most pupils (85.3%, n = 274) were unable to read a single word of the story.
• Some pupils (12.7%, n = 51) read 21 correct words per minute, indicating they were just beginning to understand the alphabetic principle (or the relationship between sounds and letters). Not surprisingly, these pupils answered only 5.9% of the passage questions correctly. They could read some words, but were not yet at a point of being able to understand what they read.
• A small group of pupils (1.8%, n = 7) was transitioning from word-by-word identification to increased fluency. On average, these pupils read 21 correct words per minute and correctly
42 The four categories are defined as follows:
• Cannot read: oral reading fluency (ORF) score is zero • Read some words, but not understand: ORF score is greater than zero and reading comprehension score is below
60% correct of those attempted • Read with some understanding: reading comprehension score is 60% of the questions attempted • Read fluently and understand: reading comprehension score is 80% correct of total number of reading passage
comprehension questions
85.3% 12.7%
1.8%
0.2%
0 20 40 60 80 100
Cannot read Read some words, but not understandRead with some understanding Read fluently and understand

A-50 | 2015 EGRA and EGMA in Ghana
answered 83% of the comprehension questions they attempted.
• An even smaller group (0.2%, n = 2) had sufficient fluency (automatic and accurate word identification) to focus on comprehension. On average, these pupils read 64 words per minute and correctly answered 100% of the total number of passage comprehension questions.
RESULTS BY SUBTASK
Table A-9: Average EGRA scores in Gonja
EGRA subtask Percentage
of pupils who scored
zero
Average % correct of
items attempted
Average fluency
score (all pupils)
Average % correct of
items attempted (excluding pupils with
zero scores)
Average fluency score
(excluding pupils with
zero scores)
Listening comprehension 48.9% 33.1% — 64.8% —
Letter sound knowledge 60.8% 20.3%
6.8 correct letter sounds per minute
51.8% 17.4 correct letter sounds per minute
Nonword decoding 84.3% 8.7%
2.4 correct nonwords per minute
55.2% 15.2 correct nonwords per minute
Oral passage reading 85.3% 9.8%
3.2 correct words per minute
66.7% 21.9 correct words per minute
Reading comprehension 95.2% 2.8% — 59.3% —
LISTENING COMPREHENSION
This subtask measures an important pre-reading skill – the pupils’ ability to listen to and understand oral language. Pupils listened to a short story that was read to them in Gonja, and were then asked three questions about the story. Less than half the pupils (48.9%) scored zero (Table A-9) – they were unable to answer a single question correctly. On average, pupils answered 33.1% of the attempted listening comprehension questions correctly. The average score for the pupils who did not score zero on the subtask (i.e., 51.1% of the pupils) was 64.8%. The data suggest that less than half the pupils were able to understand a story told to them in a familiar language.

2015 EGRA and EGMA in Ghana | A-51
Not surprisingly, the analysis showed that pupils who reported speaking a language at home other than Gonja were more than 17 times as likely to score zero on the listening comprehension subtask as pupils who reported speaking Gonja at home.
The large majority of pupils in this language group (76.7%) were unable to answer a single question about the story read to them in English (not shown). This finding points to the very limited development of English listening and speaking for the Gonja subpopulation.
LETTER SOUND KNOWLEDGE
The letter sound knowledge subtask assesses a pupil’s ability to produce the sounds of the letters of the alphabet naturally, without hesitation. If children struggle to produce letter sounds, they are unlikely to be able to decode unfamiliar words. More than half (60.8%) of the pupils were unable to identify the sound of a single letter correctly. On average, pupils were able to correctly produce the letter sound in 20.3% of the items attempted, and produced, on an average, 6.8 correct letter sounds per minute (clspm). When pupils scoring zero were removed from the analysis, the average correct letter sound score was 51.8% out of items attempted, at a fluency of 17.4 clspm. The pupils who could produce the sound of at least one letter correctly took, on average, 3.4 seconds per letter to produce the sound. This finding suggests that letter sound production was not yet fluent for most of these pupils. Instead, they were having to spend time thinking about each letter. Since letter sound production is important for identifying words (i.e., decoding), and automatic decoding facilitates reading comprehension, their low scores on nonwords, passage reading, and comprehension are understandable (Figure A-17).
NONWORD DECODING
For the nonword decoding subtask, pupils not only must know the sounds of individual letters, but also must be able to blend one sound with the next to correctly decode and say an unfamiliar word. Decoding nonwords is an important building block in reading development. More than three quarters of pupils (84.3%) were unable to decode nonwords in Gonja. This is not surprising given the performance on the letter sound knowledge subtask. On average, pupils were able to decode only 8.7% of the nonwords attempted, at an average fluency rate of 2.4 correct nonwords per minute. When pupils scoring zero were removed from the analysis, the average

A-52 | 2015 EGRA and EGMA in Ghana
score on the nonword decoding subtask was 55.2% correct out of items attempted, at a fluency of 15.2 correct nonwords per minute. These pupils were just beginning to understand sound–symbol relationships (i.e., the relationships between sounds and letters) and apply this knowledge to the task of reading.
Performance on the nonword decoding subtask was positively correlated with performance on the letter sound knowledge subtask, as well as with the oral passage reading subtask (discussed in the next section).
ORAL PASSAGE READING
As is depicted in Table A-9 above, the majority of pupils (85.3%) scored zero on the oral passage reading subtask. On average, pupils read 9.8% of attempted words in the passage correctly, with an average fluency rate of 3.2 correct words per minute (cwpm). Like the nonword reading results, this indicates that these pupils were just learning to decode and read words in a passage. When the pupils scoring zero on this subtask were removed from the analysis, the average score was 66.7% correct out of items attempted, at a fluency of 21.9 cwpm. This means that pupils who could read at least one word correctly took, on average, 2.7 seconds to read each word.
As seen in Figure A-17, a small group of pupils (1.8%) reached the ‘read with some understanding’ level by correctly answering at least 60% of the passage comprehension questions they attempted. These pupils demonstrated some emerging fluency with an average oral reading fluency (ORF) score for these pupils was 21 cwpm.
The two pupils classified in Figure A-17 as ‘reading with comprehension’ (0.2% of the pupils), who correctly answered at least 80% of the total number of comprehension questions (i.e., 4 out of 5 questions), had an average ORF score of 64 cwpm.
Thus, the established pattern that increased reading fluency leads to improved reading comprehension is demonstrated in the pupils’ performance in early grade reading in Gonja.
READING COMPREHENSION
As can be seen in Table A-9, a large majority of pupils (95.2%) were unable to answer a single reading comprehension question correctly in Gonja. The average number of questions attempted was less than 1 (0.3 out of a total of 5), and the average score was 2.8% correct of questions attempted. When the pupils scoring zero on this subtask

2015 EGRA and EGMA in Ghana | A-53
were removed from the analysis, the average score was 59.3% correct out of items attempted. This reflects the lack of fluency with which these pupils were reading. For this subtask, pupils were asked only the questions that corresponded to the amount of the text that they had read. In other words, few pupils were able to read far enough into the passage before the time limit was reached to be asked even one comprehension question.
CORRECT ITEMS PER MINUTE, BY PERCENTILE
Finally, Figure A-18 presents the percentile distribution for the three timed subtasks of the Gonja EGRA. It shows the corresponding number of correct items per minute for each percentile, and illustrates the relationships among the skills measured by these three subtasks. For example, at about the 90th percentile, on average, pupils were achieving 25 correct letter sounds per minute, 6 correct words per minute on the passage reading subtask, and 6 correct nonwords per minute. Figure A-18 further illustrates that letter sound knowledge precedes the ability to decode, and fluency rates of all three skills are related and increase together.
Figure A-18: Percentile distribution on all timed subtasks, Gonja
TRENDS FROM 2013 TO 2015
In Gonja, the proportion of pupils who could not read one word (nonreaders) increased by 8.7 percentage points, from 76.6% in 2013 to 85.3% in 2015. Among children who attempted to read the passage associated with the reading fluency and reading comprehension subtasks, they struggled to understand its meaning,
0
20
40
60
80
1 3 5 7 9 11 13 15 17 19 21 23 25 27 29 31 33 35 37 39 41 43 45 47 49 51 53 55 57 59 61 63 65 67 69 71 73 75 77 79 81 83 85 87 89 91 93 95 97 99
Cor
rect
item
s pe
r min
ute
Letter Sounds Non-Words Passage Reading

A-54 | 2015 EGRA and EGMA in Ghana
correctly answering less than 60% of the questions attempted. In 2013, 17.6% of the children were able to read some words of the reading passage, but answered less than 60% of the comprehension questions attempted, as compared to 12.7% of the children in 2015 – representing a decrease of almost 5 percentage points. There was also a 3.9 percentage point decrease in the proportion of pupils who were able to read and comprehend at the two highest performance levels, answering at least 60% of the questions attempted. In 2013, 5.9% of the pupils were able to read some of a passage and answer at least 60% of the questions correctly compared to 2.0% in 2015.

2015 EGRA and EGMA in Ghana | A-55
HOW WELL ARE CHILDREN READING IN KASEM?
OVERVIEW OF RESULTS The EGRA was administered to 307 pupils in schools where Kasem was the designated language of instruction. Based on the results of the oral passage reading and reading comprehension subtasks, the state of reading in Kasem can be summarized as shown in Figure A-19:
Figure A-19: Distribution of pupils by performance level,43 Kasem
• Most pupils (92.5%, n = 285) were unable to read a single word of the story.
• Some pupils (7.1%, n = 21) read 9 correct words per minute, indicating they were just beginning to understand the alphabetic principle (or the relationship between sounds and letters). Not surprisingly, these pupils answered only 1.5% of the passage questions correctly. They could read some words, but were not yet at a point of being able to understand what they read.
• One pupil (0.3%, n = 1) was transitioning from word-by-word identification to increased fluency. This pupil read 24 correct words per minute and correctly answered 100% of the comprehension questions they attempted.
43 The four categories are defined as follows:
• Cannot read: oral reading fluency (ORF) score is zero • Read some words, but not understand: ORF score is greater than zero, and reading comprehension score is below
60% correct of those attempted • Read with some understanding: reading comprehension score is 60% of the questions attempted • Read fluently and understand: reading comprehension score is 80% correct of total number of reading passage
comprehension questions
92.5% 7.1%
0.3%
0 20 40 60 80 100
Cannot read Read some words, but not understandRead with some understanding Read fluently and understand

A-56 | 2015 EGRA and EGMA in Ghana
• No pupil had sufficient fluency to meet the threshold of at least 80% correct on the total number of passage comprehension questions on the Kasem assessment.
RESULTS BY SUBTASK
Table A-10: Average EGRA scores in Kasem
EGRA subtask Percentage
of pupils who scored
zero
Average % correct of
items attempted
Average fluency score (all
pupils)
Average % correct of
items attempted (excluding pupils with
zero scores)
Average fluency score
(excluding pupils with
zero scores)
Listening comprehension 47.3% 42.1% — 79.9% —
Letter sound knowledge 71.5% 7.9%
1.8 correct letter sounds per minute
27.5% 6.4 correct letter sounds per minute
Nonword decoding 97.2% 1.3%
0.3 correct nonwords per minute
44.6% 10.3 correct nonwords per minute
Oral passage reading 92.5% 2.9%
0.7 correct words per minute 38.9%
9.2 correct words per minute
Reading comprehension 99.2% 0.6% — 69.3% —
LISTENING COMPREHENSION
This subtask measures an important pre-reading skill – the pupils’ ability to listen to and understand oral language. Pupils listened to a short story that was read to them in Kasem, and were then asked three questions about the story. Less than half the pupils (47.3%) scored zero (Table A-10) – they were unable to answer a single question correctly. On average, pupils answered correctly 42.1% of the listening comprehension questions that they attempted. The average score for the pupils who did not score zero on the subtask (i.e., 52.7% of the pupils) was 79.9%.
Not surprisingly, the analysis showed that pupils who reported speaking a language at home other than Kasem were nearly 70 times as likely to score zero on the listening comprehension subtask as pupils who reported speaking Kasem at home.
The large majority of pupils in this language group (85.4%) were unable to answer a single question about the story read to them in

2015 EGRA and EGMA in Ghana | A-57
English (not shown). This finding points to the very limited development of English listening and speaking for the Kasem subpopulation.
LETTER SOUND KNOWLEDGE
The letter sound knowledge subtask assesses a pupil’s ability to produce the sounds of the letters of the alphabet naturally, without hesitation. If children struggle to produce letter sounds, they are unlikely to be able to decode unfamiliar words. Almost three quarters (71.5%) of the pupils were unable to identify the sound of a single letter correctly. On average, pupils were able to correctly produce the letter sound in 7.9% of the items attempted, and they produced, on average, 1.8 correct letter sounds per minute (clspm). When pupils scoring zero were removed from the analysis, the average correct letter sound score was 27.5% out of items attempted, at a fluency of 6.4 clspm. The pupils who could produce the sound of at least one letter correctly took, on average, 9.4 seconds per letter to produce the sound. This finding suggests that letter sound production was not yet fluent for most of these pupils. Instead, they were having to spend time thinking about each letter. Since letter sound production is important for identifying words (i.e., decoding), and automatic decoding facilitates reading comprehension, their low scores on nonwords, passage reading, and comprehension are understandable (Figure A-19).
NONWORD DECODING
For the nonword decoding subtask, pupils not only must know the sounds of individual letters, but also must be able to blend one sound with the next to correctly decode and say an unfamiliar word. Decoding nonwords is an important building block in reading development. Nearly all of these pupils (97.2%) were unable to decode nonwords in Kasem. This is not surprising given the performance on the letter sound knowledge subtask. On average, pupils were able to decode only 1.3% of the nonwords attempted and demonstrated a fluency rate of less than one nonword in a minute. When pupils scoring zero were removed from the analysis, the average score on the nonword decoding subtask was 44.6% correct out of items attempted, at a fluency of 10.3 correct nonwords per minute. These pupils were just beginning to understand sound–symbol relationships (i.e., the relationships between sounds and letters) and apply this knowledge to the task of reading.

A-58 | 2015 EGRA and EGMA in Ghana
Performance on the nonword decoding subtask was positively correlated with performance on the letter sound knowledge subtask, as well as with the oral passage reading subtask (discussed in the next section).
ORAL PASSAGE READING
As is depicted in Figure A-19 above, the majority of pupils (92.5%) scored zero on the oral passage reading subtask. On average, pupils read 2.9% of attempted words in the passage correctly, with an average fluency of 0.7 correct words per minute (cwpm). Like the nonword reading results, this indicates that these pupils were just learning to decode and read words in a passage. When the pupils scoring zero on this subtask were removed from the analysis, the average score was 38.9% correct out of items attempted, at a fluency of 9.2 cwpm. This means that pupils who could read at least one word correctly took, on average, 6.5 seconds to read each word.
As seen in Figure A-19, only one pupil (0.3%) reached the ‘read with some understanding’ level by answering correctly at least 60% of the comprehension questions attempted. The oral reading fluency (ORF) score for this pupil was 24 cwpm.
As noted, none of the pupils in the sample could read with sufficient fluency to fully comprehend the Kasem passage by meeting the criterion of correctly answering at least 80% of the total number of comprehension questions (i.e., 4 out of the total of 5 questions asked about the passage).
READING COMPREHENSION
As can be seen in Table A-10, a large majority of pupils (99.2%) were unable to answer a single reading comprehension question correctly in Kasem. The average number of questions attempted was less than 1 (0.2 out of a total of 5), and the average score was 0.6% correct of questions attempted. When the pupils scoring zero on this subtask were removed from the analysis, the average score was 69.3% correct out of items attempted. This reflects the lack of fluency with which these pupils were reading. For this subtask, pupils were asked only the questions that corresponded to the amount of the text that they had read. In other words, few pupils were able to read far enough into the passage before the time limit was reached to be asked even one comprehension question.

2015 EGRA and EGMA in Ghana | A-59
CORRECT ITEMS PER MINUTE, BY PERCENTILE
Finally, Figure A-20 presents the percentile distribution for the three timed subtasks of the Kasem EGRA. It shows the corresponding number of correct items per minute for each percentile, and illustrates the relationships among the skills measured by these three subtasks. For example, at about the 90th percentile, on average, pupils were achieving 7 correct letter sounds per minute, 0 correct words per minute on the passage reading subtask, and 0 correct nonwords per minute. Figure A-20 further illustrates that letter sound knowledge precedes the ability to decode, and fluency rates of all three skills are related and increase together.
Figure A-20: Percentile distribution on all timed subtasks, Kasem
TRENDS FROM 2013 TO 2015
No changes were observed in the reading performance of pupils in Kasem from 2013 to 2015. With the exception of a few pupils (approximately 7% for both 2013 and 2015) who were beginning to read some words in Kasem, the great majority of pupils could not read one word. In 2013, 91.5% of the pupils obtained a zero score on the reading passage subtask, and in 2015, 92.5% of the pupils obtained a zero score.
0
20
40
60
80
1 3 5 7 9 11 13 15 17 19 21 23 25 27 29 31 33 35 37 39 41 43 45 47 49 51 53 55 57 59 61 63 65 67 69 71 73 75 77 79 81 83 85 87 89 91 93 95 97 99
Cor
rect
item
s pe
r min
ute
Letter Sounds Non-Words Passage Reading

A-60 | 2015 EGRA and EGMA in Ghana
HOW WELL ARE CHILDREN READING IN NZEMA?
OVERVIEW OF RESULTS The EGRA was administered to 349 pupils in schools where Nzema was the designated language of instruction. Based on the results of the oral passage reading and reading comprehension subtasks, the state of reading in Nzema can be summarized as shown in Figure A-21:
Figure A-21: Distribution of pupils by performance level,44 Nzema
• Most pupils (87.7%, n = 310) were unable to read a single word of the story.
• Some pupils (7.7%, n = 27) read 12 correct words per minute, indicating they were just beginning to understand the alphabetic principle (or the relationship between sounds and letters). Not surprisingly, these pupils answered only 2.9% of the passage questions correctly. These pupils could read some words, but were not yet at a point of being able to understand what they read.
• A small group of pupils (2.5%, n = 6) was transitioning from word-by-word identification to increased fluency. On average, these pupils read 24 correct words per minute and correctly
44 The four categories are defined as follows:
• Cannot read: oral reading fluency (ORF) score is zero • Read some words, but not understand: ORF score is greater than zero, and reading comprehension score is below
60% correct of those attempted • Read with some understanding: reading comprehension score is 60% of the questions attempted • Read fluently and understand: reading comprehension score is 80% correct of total number of reading passage
comprehension questions
87.7% 7.7%
2.5%
2.1%
0 20 40 60 80 100
Cannot read Read some words, but not understandRead with some understanding Read fluently and understand

2015 EGRA and EGMA in Ghana | A-61
answered 80% of the comprehension questions they attempted.
• A smaller group (2.1%, n = 6) had sufficient fluency (automatic and accurate word identification) to focus on comprehension. On average, these pupils read 68 words per minute and answered 97.1% of the total number of passage comprehension questions correctly (almost 5 out of 5 questions).
RESULTS BY SUBTASK
Table A-11: Average EGRA scores in Nzema
EGRA subtask Percentage
of pupils who scored
zero
Average % correct of
items attempted
Average fluency score
(all pupils)
Average % correct of
items attempted (excluding pupils with
zero scores)
Average fluency score
(excluding pupils with
zero scores)
Listening comprehension 7.3% 80.8% — 87.2% —
Letter sound knowledge 31.0% 34.4%
12.2 correct letter sounds per minute
49.9% 17.7 correct letter sounds per minute
Nonword decoding 79.5% 7.8%
1.9 correct nonwords per minute
37.9% 9.5 correct nonwords per minute
Oral passage reading 87.7% 7.1%
3.0 correct words per minute
58.0% 24.0 correct words per minute
Reading comprehension 94.0% 4.8% — 80.4% —
LISTENING COMPREHENSION
This subtask measures an important pre-reading skill – the pupils’ ability to listen to and understand oral language. Pupils listened to a short story that was read to them in Nzema, and were then asked three questions about the story. Very few (7.3%) pupils scored zero (Table A-11) – meaning that they were unable to answer a single question correctly. On average, pupils answered 80.8% of the listening comprehension questions correctly. The average score for the pupils who did not score zero on the subtask (i.e., 92.7% of the pupils) was 87.2%. The data suggest that most pupils were able to understand a story told to them in a familiar language.

A-62 | 2015 EGRA and EGMA in Ghana
Not surprisingly, the analysis showed that pupils who reported speaking a language at home other than Nzema were more than 5.5 times as likely to score zero on the listening comprehension subtask as pupils who reported speaking Nzema at home.
The majority of pupils in this language group (71.5%) were unable to answer a single question about the story read to them in English (not shown). This finding points to the very limited development of English listening and speaking for the Dagbani sub-population.
LETTER SOUND KNOWLEDGE
The letter sound knowledge subtask assesses a pupil’s ability to produce the sounds of the letters of the alphabet naturally, without hesitation. If children struggle to produce letter sounds, they are unlikely to be able to decode unfamiliar words. One third (31.0%) of the pupils were unable to identify the sound of a single letter correctly. On average, pupils were able to correctly produce the letter sound in 34.4% of the items attempted, and they produced, on average, 12.2 correct letter sounds per minute (clspm). When pupils scoring zero were removed from the analysis, the average correct letter sound score was 49.9% out of items attempted, at a fluency of 17.7 clspm. The pupils who could produce the sound of at least one letter correctly took, on average, 3.4 seconds per letter to produce the sound. This finding suggests that letter sound production was not yet fluent for most of these pupils. Instead, they were having to spend time thinking about each letter. Since letter sound production is important for identifying words (i.e., decoding), and automatic decoding facilitates reading comprehension, their low scores on nonwords, passage reading, and comprehension are understandable (Figure A-21).
NONWORD DECODING
For the nonword decoding subtask, pupils must know the sounds of individual letters and also be able to blend one sound with the next to correctly decode and say an unfamiliar word. Decoding nonwords is an important building block in reading development. More than three-quarters of pupils (79.5%) were unable to decode nonwords in Nzema. This is not surprising given the performance on the letter sound knowledge subtask. On average pupils were able to decode only 7.8% of the nonwords attempted, at an average fluency rate of 1.9 nonwords per minute. When pupils scoring zero were removed from the analysis, the average score on the nonword decoding subtask was 37.9% correct out of items attempted, at a fluency of 9.5

2015 EGRA and EGMA in Ghana | A-63
correct nonwords per minute. These pupils were just beginning to understand sound–symbol relationships (i.e., the relationships between sounds and letters) and apply this knowledge to the task of reading.
Performance on the nonword decoding subtask was positively correlated with performance on the letter sound knowledge subtask, as well as with the oral passage reading subtask (discussed in the next section).
ORAL PASSAGE READING
As is depicted in Table A-11 above, the majority of pupils (87.7%) scored zero on the oral passage reading subtask. On average, pupils read 7.1% of attempted words in the passage correctly, at an average of 3.0 correct words per minute (cwpm). Like the nonword reading results, this indicates that these pupils were just learning to decode and read words in a passage. When the pupils scoring zero on this subtask were removed from the analysis, the average score was 58.0% correct out of items attempted, at a fluency of 24.0 cwpm. This means that pupils who could read at least one word correctly took, on average, 2.5 seconds to read each word.
As seen in Figure A-21, a small group of pupils (2.5%) reached the “read with some understanding” level by answering correctly at least 60% of the comprehension questions they attempted. These pupils demonstrated some emerging fluency, with an average oral reading fluency (ORF) score of 24 cwpm.
Pupils classified in Figure A-21 as ‘reading with comprehension’ (2.1% of the pupils) were able to correctly answer at least 80% of the comprehension questions (i.e., 4 out of the total 5 questions asked about the passage) and had an average ORF score of 68 cwpm.
Thus, the established pattern that increased reading fluency leads to improved reading comprehension is demonstrated in the pupils’ performance in early grade reading in Nzema.
READING COMPREHENSION
As can be seen in Table A-11, a large majority of pupils (94.0%) were unable to answer a single reading comprehension question correctly in Nzema. The average number of questions attempted was less than 1 (0.3 out of a total of 5), and the average score was 4.8% correct of questions attempted. When the pupils scoring zero on this subtask were removed from the analysis, the average score was 80.4%

A-64 | 2015 EGRA and EGMA in Ghana
correct out of items attempted. This reflects the lack of fluency with which these pupils were reading. For this subtask, pupils were asked only the questions that corresponded to the amount of the text that they had read. In other words, few pupils were able to read far enough into the passage before the time limit was reached to be asked even the first comprehension question.
CORRECT ITEMS PER MINUTE, BY PERCENTILE
Finally, Figure A-22 presents the percentile distribution for the three timed subtasks of the Nzema EGRA. It shows the corresponding number of correct items per minute for each percentile, and illustrates the relationships among the skills measured by these three subtasks. For example, at about the 90th percentile, on average, pupils were achieving 32 correct letter sounds per minute, 7 correct words per minute on the passage reading subtask, and 7 correct nonwords per minute. Figure A-22 further illustrates that letter sound knowledge precedes the ability to decode, and fluency rates of all three skills are related and increase together.
Figure A-22: Percentile distribution on all timed subtasks, Nzema
TRENDS FROM 2013 TO 2015
Very little change was observed from 2013 to 2015 in the Ghanaian language reading performance among the Nzema subpopulation. The proportion of pupils who could not read one word (nonreaders) was 82.7% in 2013 and 87.7% in 2015, representing a slight increase (5 percentage points) in the share of nonreaders. A smaller percentage of the pupils in 2015 attempted to read passages and
0
20
40
60
80
100
1 3 5 7 9 11 13 15 17 19 21 23 25 27 29 31 33 35 37 39 41 43 45 47 49 51 53 55 57 59 61 63 65 67 69 71 73 75 77 79 81 83 85 87 89 91 93 95 97 99
Cor
rect
item
s pe
r min
ute
Letter Sounds Non-Words Passage Reading

2015 EGRA and EGMA in Ghana | A-65
answer the comprehension questions in the passage reading activities than in 2013 (i.e., 13.2% in 2013 and 7.7% in 2015, representing a decrease of 5.5 percentage points). The percentage of pupils who were able to read and comprehend at the two highest performance levels was essentially the same for 2013 (4.1%) and 2015 (4.6%).

A-66 | 2015 EGRA and EGMA in Ghana
HOW WELL ARE CHILDREN READING IN ENGLISH?
OVERVIEW OF RESULTS The EGRA was administered nationally in English to 6,973 pupils in schools across Ghana. Based on the results of the oral passage reading and reading comprehension subtasks, the state of reading in English can be summarized as shown in Figure A-23:
Figure A-23: Distribution of pupils by performance level,45 English
• Less than half the pupils (43.3%, n = 3,121) were unable to read a single word of the story.
• Just under half the pupils (49.4%, n = 3,298) read an average of 16 correct words per minute, indicating they were just beginning to understand the alphabetic principle (or the relationship between sounds and letters). Not surprisingly, these pupils answered an average of only 6% of the passage questions they attempted correctly. They could read some words, but were not yet at a point of being able to understand what they read.
• A small group of pupils (5.6%, n = 408) demonstrated that they were transitioning from word-by-word identification to increased fluency. On average, these pupils read 43 correct words per minute and correctly answered an average of 83% of the comprehension questions they attempted.
• An even smaller group (1.7%, n = 146) had sufficient fluency (automatic and accurate word identification) to focus on comprehension. On average, these pupils read 80 words per
45 The four categories are defined as follows:
• Cannot read: oral reading fluency (ORF) score is zero • Read some words, but not understand: ORF score is greater than zero, and reading comprehension score is below
60% correct of those attempted • Read with some understanding: reading comprehension score is 60% of the questions attempted • Read fluently and understand: reading comprehension score is 80% correct of total number of comprehension
questions
43.3% 49.4% 5.6%
0 20 40 60 80 100
Cannot read Read some words, but not understandRead with some understanding Read fluently and understand
1.7

2015 EGRA and EGMA in Ghana | A-67
minute and answered 85% of the total number of reading passage comprehension questions correctly.
RESULTS BY SUBTASK
Table A-12: Average EGRA scores in English
EGRA subtask Percentage
of pupils who scored
zero
Average % correct of
items attempted
Average fluency
score (all pupils)
Average % correct of
items attempted (excluding pupils with
zero scores)
Average fluency score
(excluding pupils with
zero scores)
Listening comprehension 79.5% 10.5% — 51.3% —
Letter sound knowledge 48.7% 25.9%
9.6 correct letter sounds per minute
50.5% 18.8 correct letter sounds per minute
Nonword decoding 75.7% 10.6%
2.9 correct nonwords per minute
43.7% 11.7 correct nonwords per minute
Oral passage reading 40.4% 29.0%
11.3 correct words per minute
48.6% 19.0 correct words per minute
Reading comprehension 85.4% 8.9% — 60.9% —
LISTENING COMPREHENSION
This subtask measures an important pre-reading skill – the pupils’ ability to listen to and understand oral language. Pupils listened to a short story that was read to them in English, and were then asked three questions about the story. More than three-quarters (79.5%) of pupils scored zero (Table A-12) – they were unable to answer a single question correctly. On average, pupils answered 10.5% of the listening comprehension questions correctly. The average score for the pupils who did not score zero on the subtask (i.e., 20% of the students) was 51.3%. The data suggest that English was not a familiar language for most pupils, as few were able to understand a story told to them in English. If these pupils were not regularly communicating in English, it is not surprising that they demonstrated weak oral language comprehension in English.
LETTER SOUND KNOWLEDGE
The letter sound knowledge subtask assesses a pupil’s ability to produce the sounds of the letters of the alphabet naturally, without

A-68 | 2015 EGRA and EGMA in Ghana
hesitation. If children struggle to produce letter sounds, they are unlikely to be able to decode unfamiliar words. Almost half (48.7%) of the pupils were unable to identify the sound of a single English letter correctly. On average, pupils were able to correctly produce the letter sound in 25.9% of the items attempted, and produced only 9.6 correct letter sounds per minute (clspm). When pupils scoring zero were removed from the analysis, the average correct letter sound score was 50.5% out of items attempted, at a fluency of 18.8 clspm. The pupils who could produce the sound of at least one letter correctly took, on average, 3.2 seconds per letter to produce the sound. This finding suggests that letter sound production was not yet fluent for most of these pupils. Instead, they were having to spend time thinking about each letter. Since letter sound production is important for identifying words (i.e., decoding), and automatic decoding facilitates reading comprehension, their low scores on nonwords, passage reading, and comprehension are understandable (Figure A-23).
NONWORD DECODING
For the nonword decoding subtask, pupils not only must know the sounds of individual letters, but also must be able to blend one sound with the next to correctly decode and say an unfamiliar word. Decoding nonwords is an important building block in reading development. The majority of pupils (75.7%) were unable to decode nonwords in English (Table A-12). This is not surprising given the performance on the letter sound knowledge subtask. On average, pupils were able to decode only 10.6% of the nonwords that they attempted, at an average fluency rate of 2.9 correct nonword per minute. When pupils scoring zero were removed from the analysis, the average score on the nonword decoding subtask was 43.7% correct out of items attempted, at a fluency of 11.7 correct nonwords per minute. These pupils were just beginning to understand sound–symbol relationships (i.e., the relationships between sounds and letters) and apply this knowledge to the task of reading.
Performance on the nonword decoding subtask was positively correlated with performance on the letter sound knowledge subtask, as well as with the oral passage reading subtask (discussed in the next section).
ORAL PASSAGE READING
As is depicted in Table A-12 above, less than half of the pupils (40.4%) scored zero on the oral passage reading subtask. On average, pupils read 29% of attempted words in the passage

2015 EGRA and EGMA in Ghana | A-69
correctly, with an average fluency rate of 11.3 correct words per minute (cwpm). Like the nonword reading results, this indicates that these pupils were just learning to decode words. When the pupils scoring zero on this subtask were removed from the analysis, the average score was 48.6% correct out of items attempted, at a fluency of 19 cwpm. This means that pupils who could read at least one word correctly took, on average, 3.2 seconds to read each word and suggests that these pupils were just learning to decode and read words in a passage.
A small group of pupils (5.6%) reached the ‘read with some understanding’ level by correctly answering at least 60% of the passage comprehension questions they attempted. These pupils demonstrated some emerging fluency with an average oral reading fluency (ORF) score of 43 cwpm.
Pupils classified in Figure A-23 as ‘reading with comprehension’ (1.7% of the pupils), who correctly answered at least 80% of the total number of comprehension questions (i.e., 4 out of 5 questions), had an average ORF score of 80 cwpm.
Thus the established pattern that increased reading fluency leads to improved reading comprehension is demonstrated in the students’ performance in early grade reading of English
READING COMPREHENSION
As can be seen in Table A-12, a large majority of pupils (85.4%) were unable to answer a single reading comprehension question correctly in English. The average number of questions attempted was 1.2 (out of a total of 5), and the average score was 8.9% correct of questions attempted. When the pupils scoring zero on this subtask were removed from the analysis, the average score was 60.9% correct out of items attempted. This reflects the lack of fluency with which these pupils were reading. For this subtask, pupils were asked only the questions that corresponded to the amount of the text that they had read. In other words, few pupils were able to read far enough into the passage before the time limit was reached to be asked more than the first comprehension question.
CORRECT ITEMS PER MINUTE, BY PERCENTILE
Finally, Figure A-24 presents the percentile distribution for the three timed subtasks of the English EGRA. It shows the corresponding number of correct items per minute for each percentile, and illustrates

A-70 | 2015 EGRA and EGMA in Ghana
the relationships among the skills measured by these three subtasks. For example, at about the 80th percentile, on average, pupils were achieving 19 correct letter sounds per minute, 27 correct words per minute on the passage reading subtask, and 4 correct nonwords per minute. Figure A-24 further illustrates that letter sound knowledge precedes the ability to decode, and fluency rates of all three skills are related and increase together.
Figure A-24: Percentile distribution on all timed subtasks, English
TRENDS FROM 2013 TO 2015
In English, the proportion of pupils who could not read one word (nonreaders) decreased by approximately 7 percentage points, from 50.7% in 2013 to 43.3% in 2015. While a smaller percentage of pupils were classified as nonreaders in 2015 as compared to 2013, a slightly larger percentage of pupils were classified as performing at the ‘read some words but not understand’ level, with 49.4% of pupils in 2015 reading some words but correctly answering less than 60% of reading comprehension questions attempted as compared to 43.8% in 2013.
A slightly higher percentage of pupils were also classified as performing at the ‘reading with some understanding’ level in 2015 as compared to 2013, with 5.6% of pupils able to read some words correctly and answer correctly at least 60% of the reading comprehension questions attempted in 2015 and 3.7% of pupils able to do the same in 2013. There was no real change in the percentage of pupils able to read fluently and understand what they read, with a
0
20
40
60
80
100
120
1 3 5 7 9 11 13 15 17 19 21 23 25 27 29 31 33 35 37 39 41 43 45 47 49 51 53 55 57 59 61 63 65 67 69 71 73 75 77 79 81 83 85 87 89 91 93 95 97 99
Cor
rect
item
s pe
r min
ute
Letter Sounds Non-Words Passage Reading

2015 EGRA and EGMA in Ghana | A-71
reading comprehension score of above 80% correct out of the total. 1.8% of pupils were able to achieve this level in 2013, and 1.7% of pupils in 2015.
Compared to 2013, there was a small improvement in pupils’ performance on English EGRA subtasks. A higher percentage of pupils were able to identify words in 2015 than were able to in 2013, and a slightly higher percentage of pupils were able to read with a small amount of understanding in 2015 than were able to in 2013. Although this change is small, it suggests pupils are becoming more familiar with English words and are beginning to be able to read some words with some understanding.


2015 EGRA and EGMA in Ghana | B-1
ANNEX B: SAMPLE SIZE DATA
Table B1: Sample size breakdown for the Greater Accra region
LOI
PROPOSED sample No. of schools % schools
No. of enrolled P2 pupils
% enrolled P2 pupils
Akuapem Twi 5 35 4.4 1,762 4.7 Asante Twi 5 31 3.9 1,685 4.5 Dangme 20 169 21.1 6,676 17.9 Ewe 5 17 2.1 581 1.6
Ga 55 542 67.6 26,275 70.5
Other 0 8 1.0 303 0.8
Total 90 802 100.0 37,282 100.0
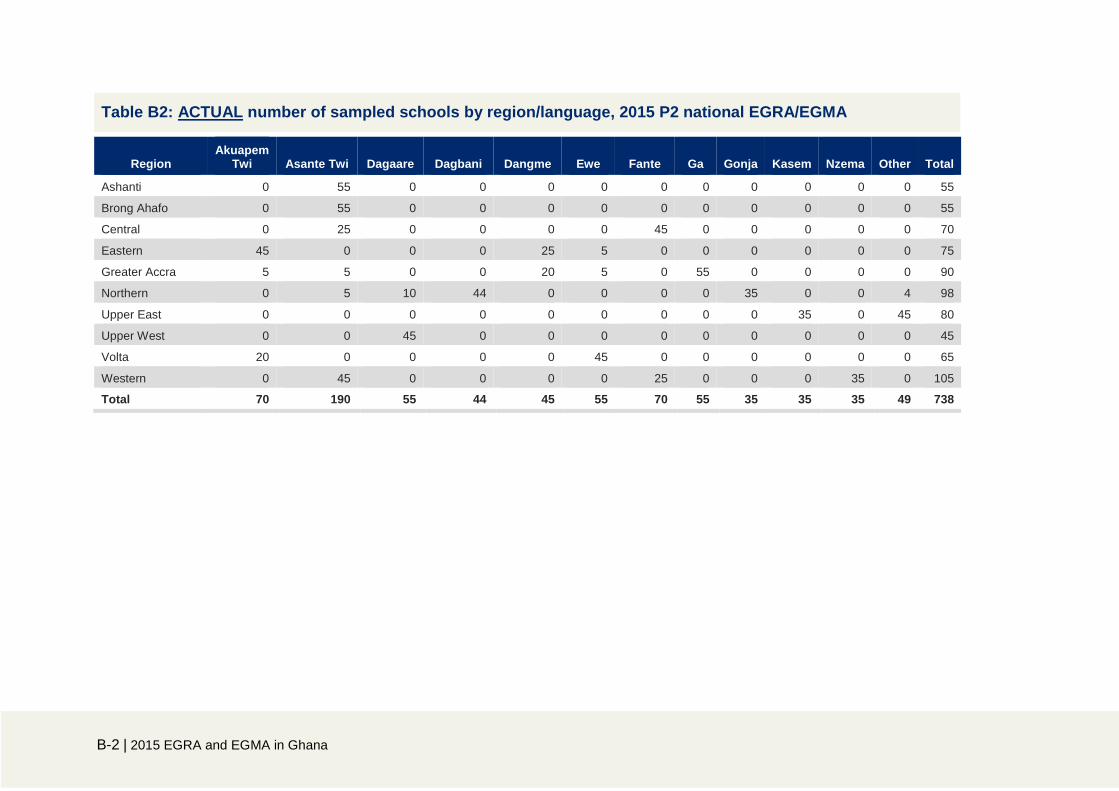
B-2 | 2015 EGRA and EGMA in Ghana
Table B2: ACTUAL number of sampled schools by region/language, 2015 P2 national EGRA/EGMA
Region
Akuapem Twi Asante Twi Dagaare Dagbani Dangme Ewe Fante Ga Gonja Kasem Nzema Other Total
Ashanti 0 55 0 0 0 0 0 0 0 0 0 0 55
Brong Ahafo 0 55 0 0 0 0 0 0 0 0 0 0 55
Central 0 25 0 0 0 0 45 0 0 0 0 0 70
Eastern 45 0 0 0 25 5 0 0 0 0 0 0 75
Greater Accra 5 5 0 0 20 5 0 55 0 0 0 0 90
Northern 0 5 10 44 0 0 0 0 35 0 0 4 98
Upper East 0 0 0 0 0 0 0 0 0 35 0 45 80
Upper West 0 0 45 0 0 0 0 0 0 0 0 0 45
Volta 20 0 0 0 0 45 0 0 0 0 0 0 65
Western 0 45 0 0 0 0 25 0 0 0 35 0 105
Total 70 190 55 44 45 55 70 55 35 35 35 49 738

2015 EGRA and EGMA in Ghana | B-3
Table B3: ACTUAL number of sampled students by region/language, 2015 P2 national EGRA/EGMA
Region
Akuapem Twi Asante Twi Dagaare Dagbani Dangme Ewe Fante Ga Gonja Kasem Nzema Other Total
Ashanti 0 548 0 0 0 0 0 0 0 0 0 0 548
Brong Ahafo 0 545 0 0 0 0 0 0 0 0 0 0 545
Central 0 248 0 0 0 0 450 0 0 0 0 0 698
Eastern 448 0 0 0 249 50 0 0 0 0 0 0 747
Greater Accra 50 50 0 0 200 50 0 552 0 0 0 0 902
Northern 0 50 98 438 0 0 0 0 333 0 0 40 959
Upper East 0 0 0 0 0 0 0 0 0 347 0 451 798
Upper West 0 0 450 0 0 0 0 0 0 0 0 0 450
Volta 200 0 0 0 0 439 0 0 0 0 0 0 639
Western 0 427 0 0 0 0 248 0 0 0 350 0 1,025
Total 698 1,868 548 438 449 539 698 552 333 347 350 491 7,311

B-4 | 2015 EGRA and EGMA in Ghana
Table B4: Sample size breakdown for each region/language
Region LOI
Proposed sample
No. of schools % schools
No. of P2 pupils
% P2 pupils
Ashanti Asante Twi 55 2,236 99.96 82,836 99.98
Dangme 0 1 0.04 18 0.02
Brong Ahafo Asante Twi 55 1,613 99.2 56,036 98.99
Ewe 0 5 0.31 145 0.26
Fante 0 1 0.06 38 0.07
Gonja 0 6 0.37 369 0.65
Nzema 0 1 0.06 19 0.03
Central Akuapem Twi 0 2 0.15 47 0.10
Asante Twi 25 436 32.49 13,921 29.70
Ewe 0 2 0.15 78 0.17
Fante 45 900 67.06 32,762 69.90
Other 0 2 0.15 60 0.13
Eastern Akuapem Twi 45 1,380 80.51 42,581 83.87
Asante Twi 0 3 0.18 131 0.26
Dagbani 0 1 0.06 43 0.08
Dangme 25 232 13.54 5,602 11.03
Ewe 5 90 5.25 2,252 4.44
Fante 0 7 0.41 118 0.23
Ga 0 1 0.06 42 0.08
Greater Accra Akuapem Twi 5 35 4.36 1,762 4.73
Asante Twi 5 31 3.87 1,685 4.52
Dangme 20 169 21.07 6,676 17.91
Ewe 5 17 2.12 581 1.56
Ga 55 542 67.58 26,275 70.48
Other 0 8 1 303 0.81
Northern Akuapem Twi 0 2 0.09 109 0.14
Asante Twi 5 51 2.73 2,759 3.52
Dagaare 10 102 4.58 3,456 4.41
Dagbani 45 1,560 76.97 60,995 77.9
Dangme 0 2 0.09 29 0.04
Ewe 0 16 0.79 379 0.48
Fante 0 1 0.04 45 0.06
Ga 0 1 0.04 80 0.1
Gonja 35 253 12.2 8,755 11.18
Kasem 0 1 0.04 34 0.04
Other 5 35 2.42 1,661 2.12
Upper East Dagaare 0 1 0.15 59 0.17
Gonja 0 3 0.45 162 0.47
Kasem 35 112 16.74 5,223 15.01

2015 EGRA and EGMA in Ghana | B-5
Table B4: Sample size breakdown for each region/language
Region LOI
Proposed sample
No. of schools % schools
No. of P2 pupils
% P2 pupils
Nzema 0 1 0.15 146 0.42
Other 45 552 82.51 29,214 83.94
Upper West Dagaare 45 533 96.91 24,391 97.73
Dagbani 0 1 0.18 12 0.05
Kasem 0 5 0.91 138 0.55
Other 0 11 2 417 1.67
Volta Akuapem Twi 20 253 17.05 10,106 20.5
Asante Twi 0 5 0.34 168 0.34
Dagbani 0 2 0.13 39 0.08
Ewe 45 1,222 82.35 38,904 78.93
Other 0 2 0.13 70 0.14
Western Akuapem Twi 0 5 0.33 174 0.3
Asante Twi 45 900 58.56 30,445 52.35
Dangme 0 1 0.07 29 0.05
Ewe 0 6 0.39 169 0.29
Fante 25 455 29.6 21,094 36.27
Ga 0 1 0.07 65 0.11
Nzema 35 164 10.67 6,012 10.34
Other 0 5 0.33 170 0.29