Gfw presentation for wb master class 27march15
56
GLOBAL FOREST WATCH: BRINGING BIG DATA ON FORESTS TO CLIMATE POLICY Dr. Nancy Harris, Research Manager, Forests Program
-
Upload
nancy-harris -
Category
Environment
-
view
63 -
download
2
Transcript of Gfw presentation for wb master class 27march15
GLOBAL FOREST WATCH:
BRINGING BIG DATA ON FORESTS
TO CLIMATE POLICY
Dr. Nancy Harris, Research Manager, Forests Program
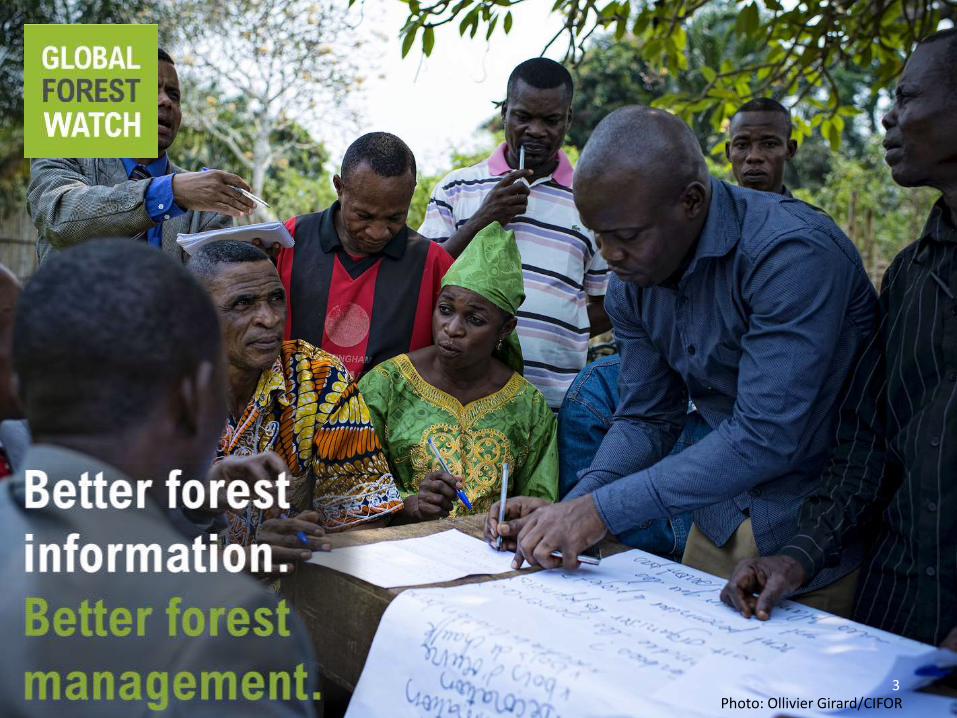
Photo: Ollivier Girard/CIFOR3
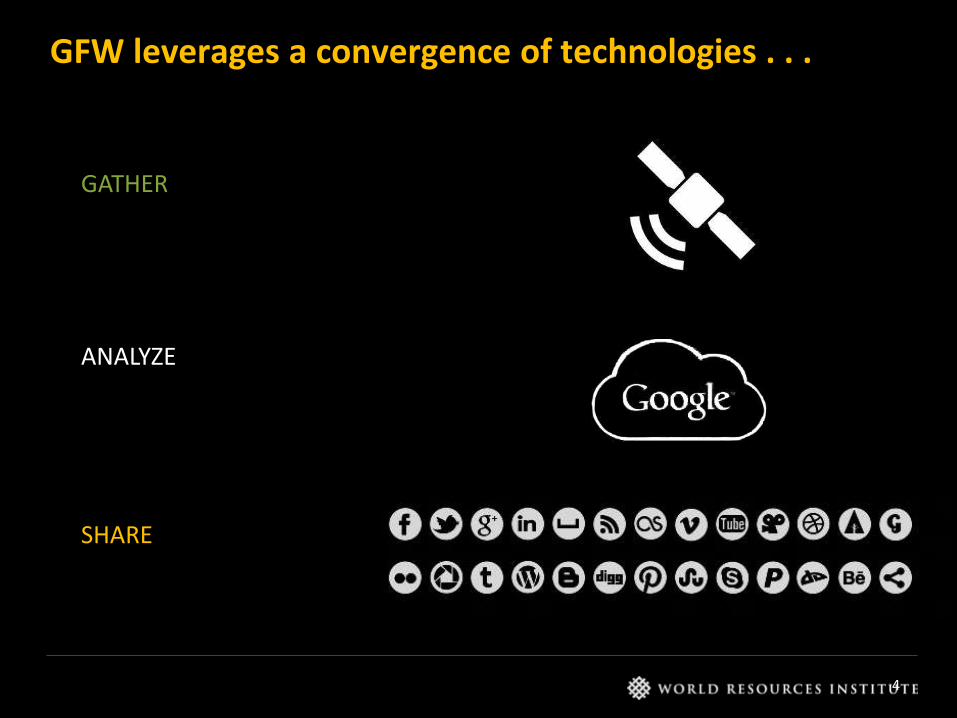
GATHER
ANALYZE
SHARE
GFW leverages a convergence of technologies . . .
4
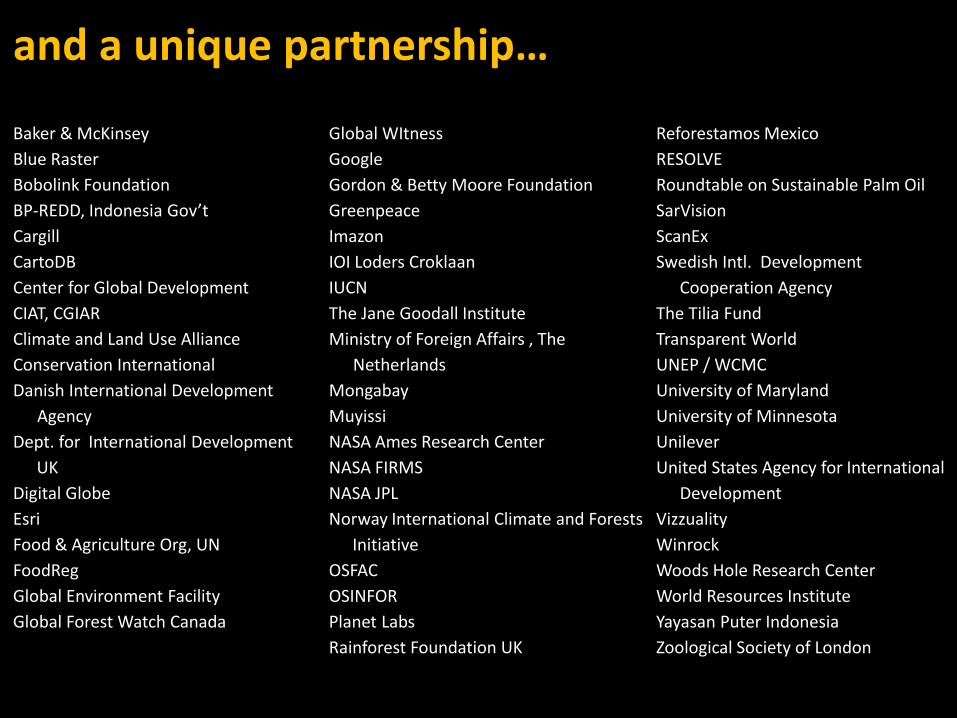
and a unique partnership…
Baker & McKinsey
Blue Raster
Bobolink Foundation
BP-REDD, Indonesia Gov’t
Cargill
CartoDB
Center for Global Development
CIAT, CGIAR
Climate and Land Use Alliance
Conservation International
Danish International Development
Agency
Dept. for International Development
UK
Digital Globe
Esri
Food & Agriculture Org, UN
FoodReg
Global Environment Facility
Global Forest Watch Canada
Global WItness
Gordon & Betty Moore Foundation
Greenpeace
Imazon
IOI Loders Croklaan
IUCN
The Jane Goodall Institute
Ministry of Foreign Affairs , The
Netherlands
Mongabay
Muyissi
NASA Ames Research Center
NASA FIRMS
NASA JPL
Norway International Climate and Forests
Initiative
OSFAC
OSINFOR
Planet Labs
Rainforest Foundation UK
Reforestamos Mexico
RESOLVE
Roundtable on Sustainable Palm Oil
SarVision
ScanEx
Swedish Intl. Development
Cooperation Agency
The Tilia Fund
Transparent World
UNEP / WCMC
University of Maryland
University of Minnesota
Unilever
United States Agency for International
Development
Vizzuality
Winrock
Woods Hole Research Center
World Resources Institute
Yayasan Puter Indonesia
Zoological Society of London

DATA USERS
Space agenciesNationalRegionalLocalCrowd
GovernmentsBusinessCivil society CommunitiesEducators
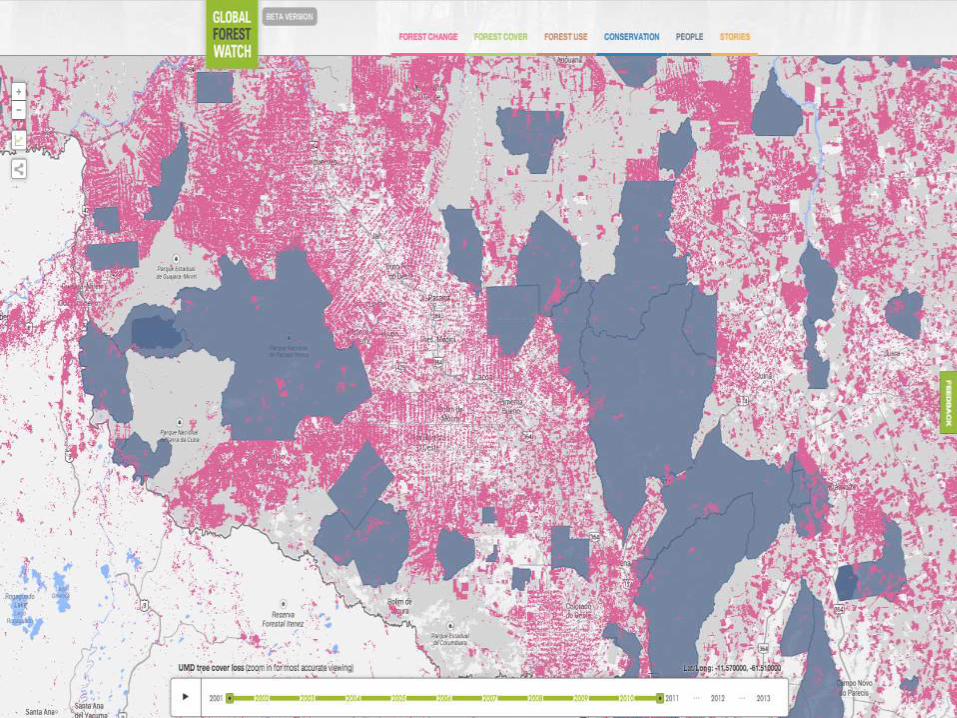
Make complex data easy to understand,decision-relevant,
and in near-real time
. . . to empower a variety of users
6
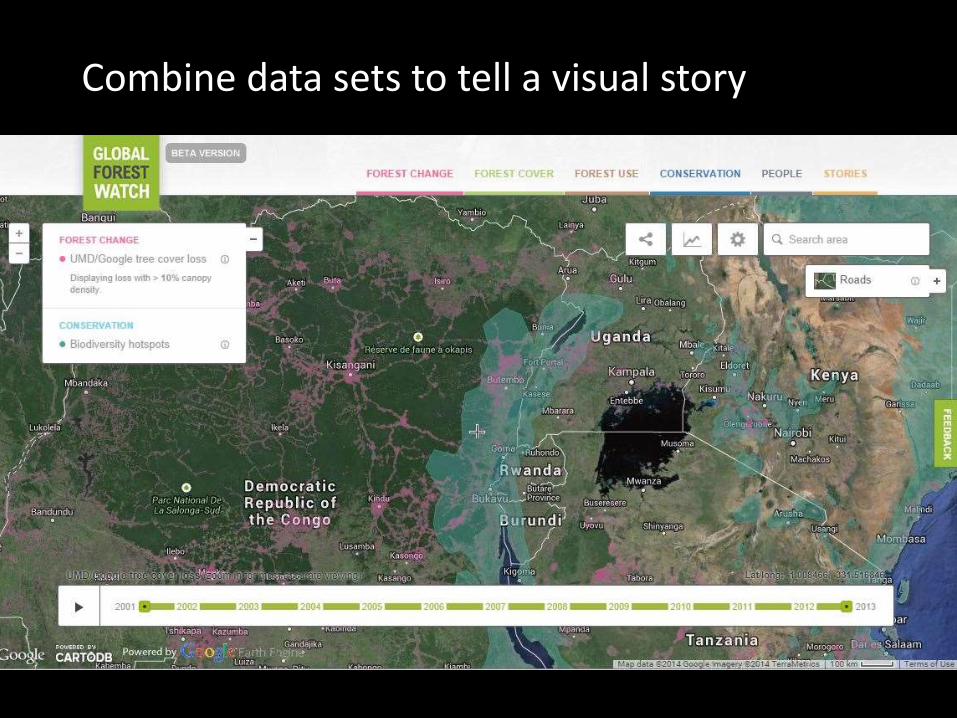
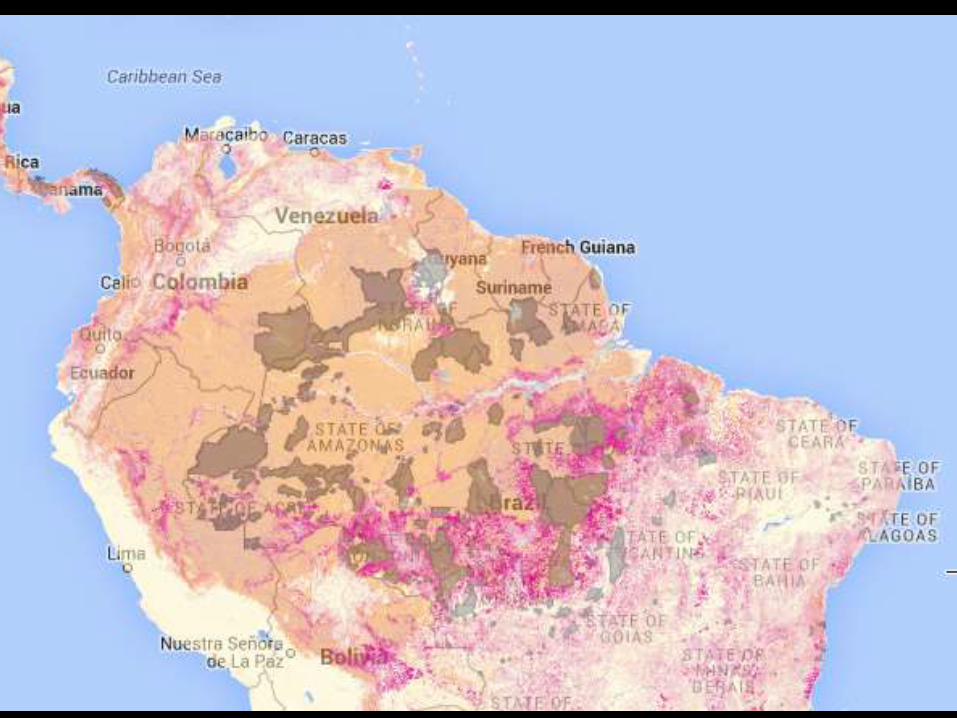
Combine data sets to tell a visual story
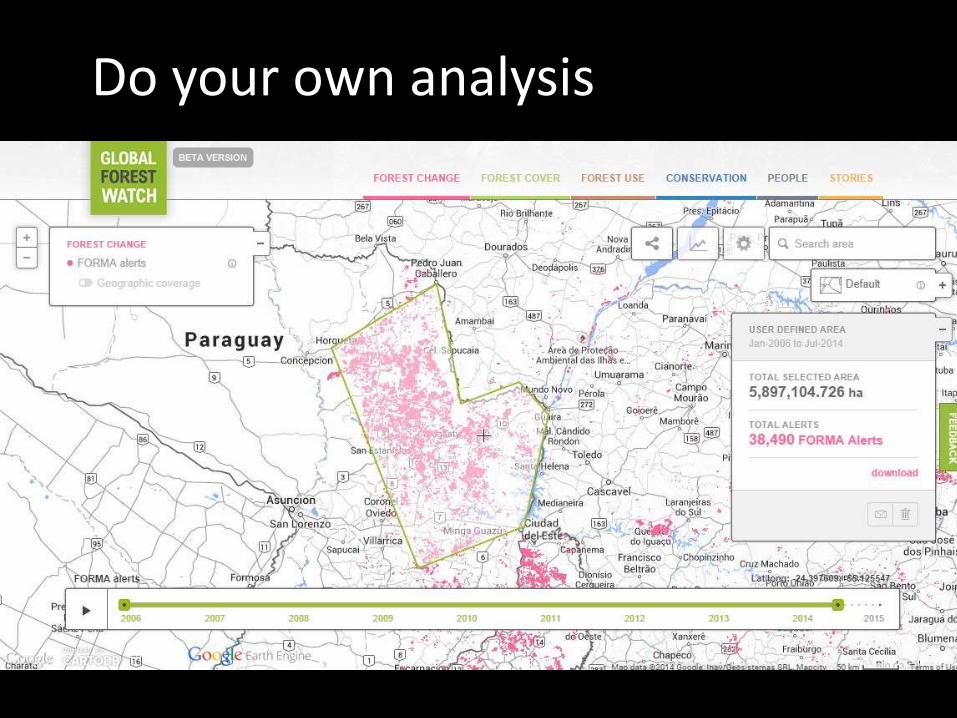
Do your own analysis
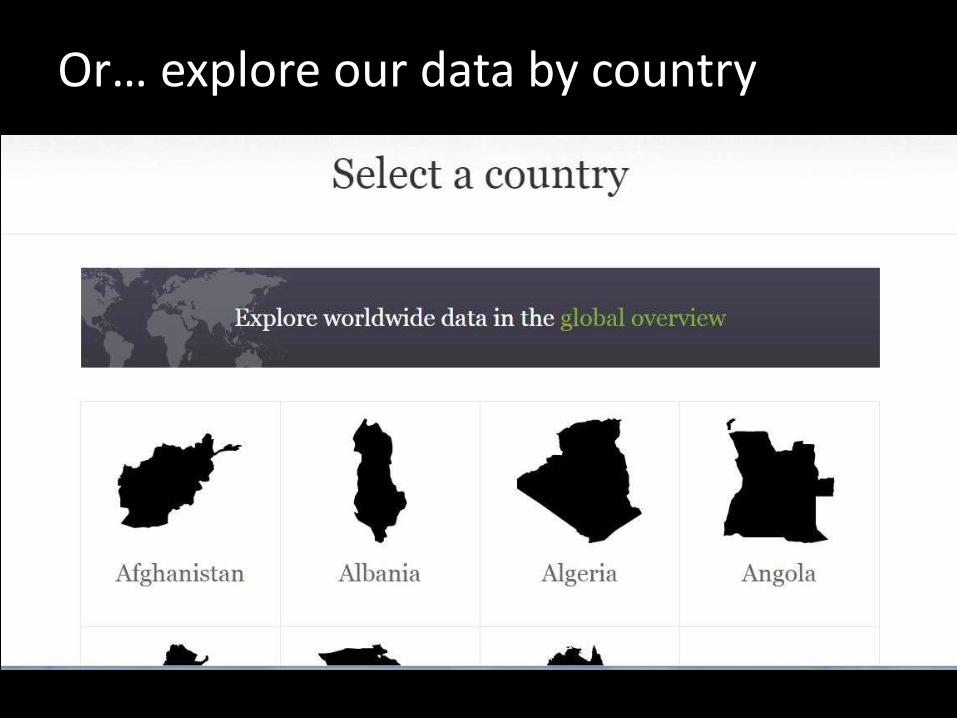
Or… explore our data by country

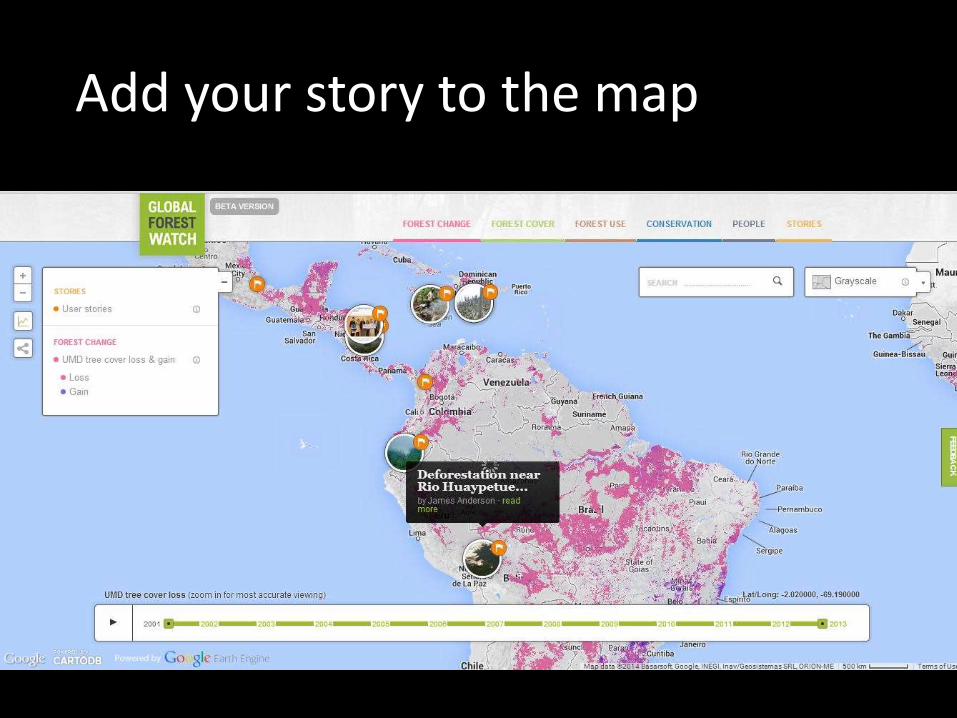
Add your story to the map
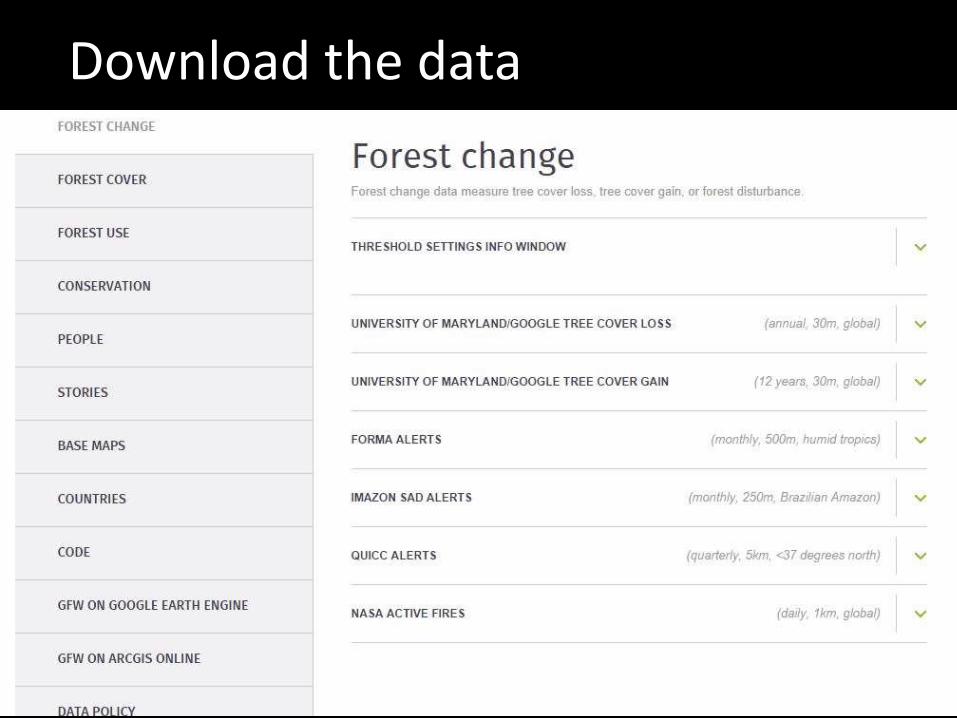
Download the data

What’s next?

CLIMATE CHANGE IS UPON US
Image: Wikimedia

Global Carbon Budget
(Billion metric tons per year)
Humans can
reduce
emissions
with clean
energy and
energy
efficiency
Humans can
manage lands
to reduce
sources and
enhance sinks
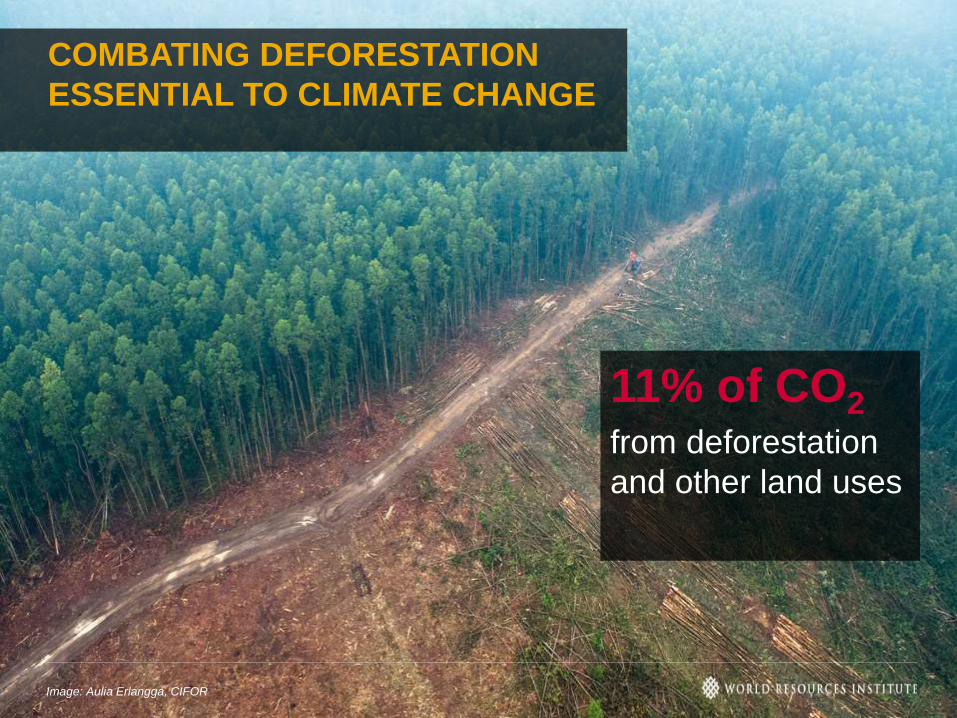
COMBATING DEFORESTATION
ESSENTIAL TO CLIMATE CHANGE
11% of CO2
from deforestation
and other land uses
Image: Aulia Erlangga, CIFOR
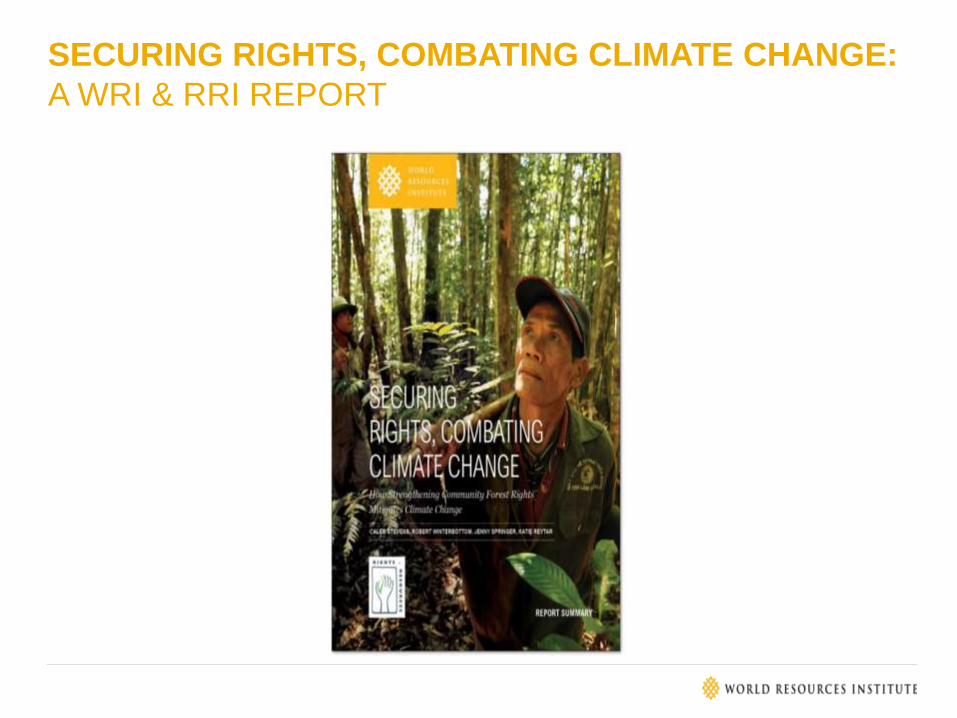
SECURING RIGHTS, COMBATING CLIMATE CHANGE:
A WRI & RRI REPORT

COMMUNITIES HOLD THE KEY TO
PROTECTING THE FORESTS

OUR FINDINGS
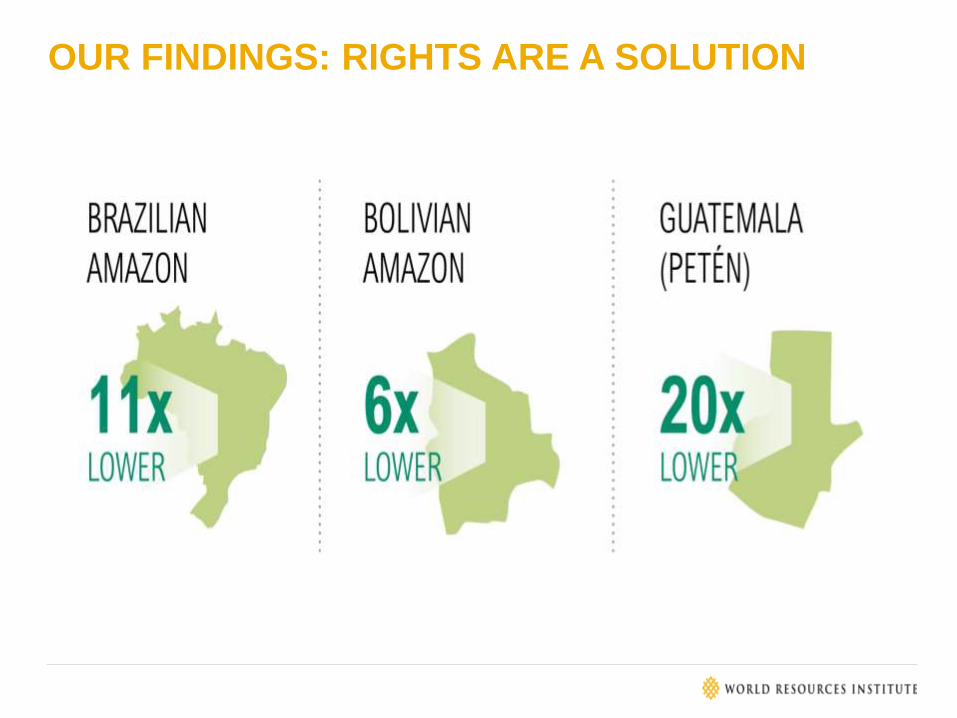
OUR FINDINGS: RIGHTS ARE A SOLUTION

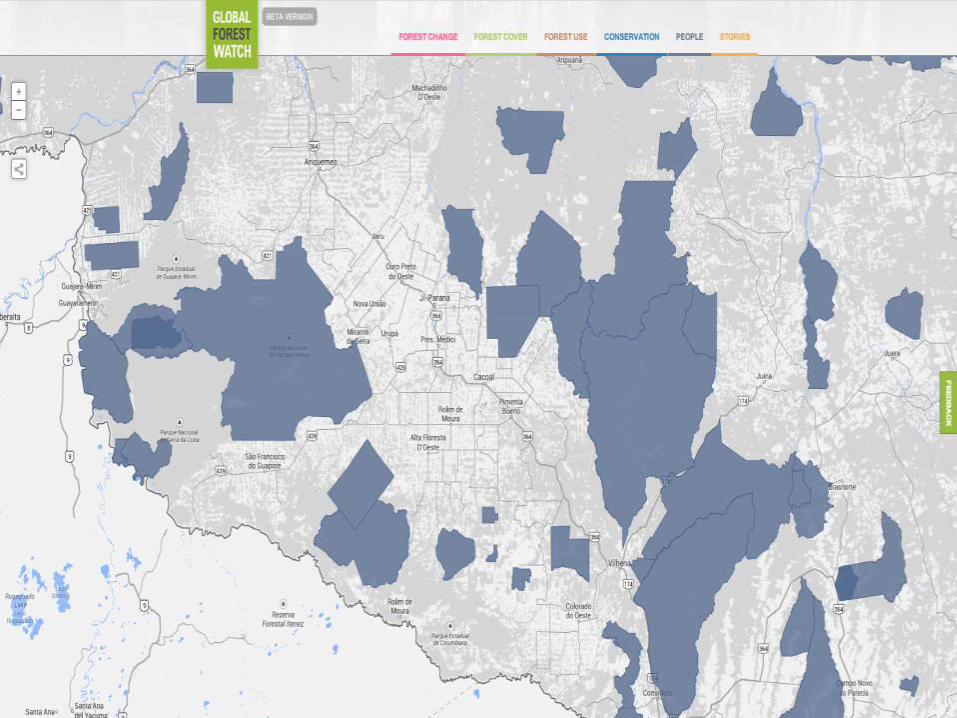
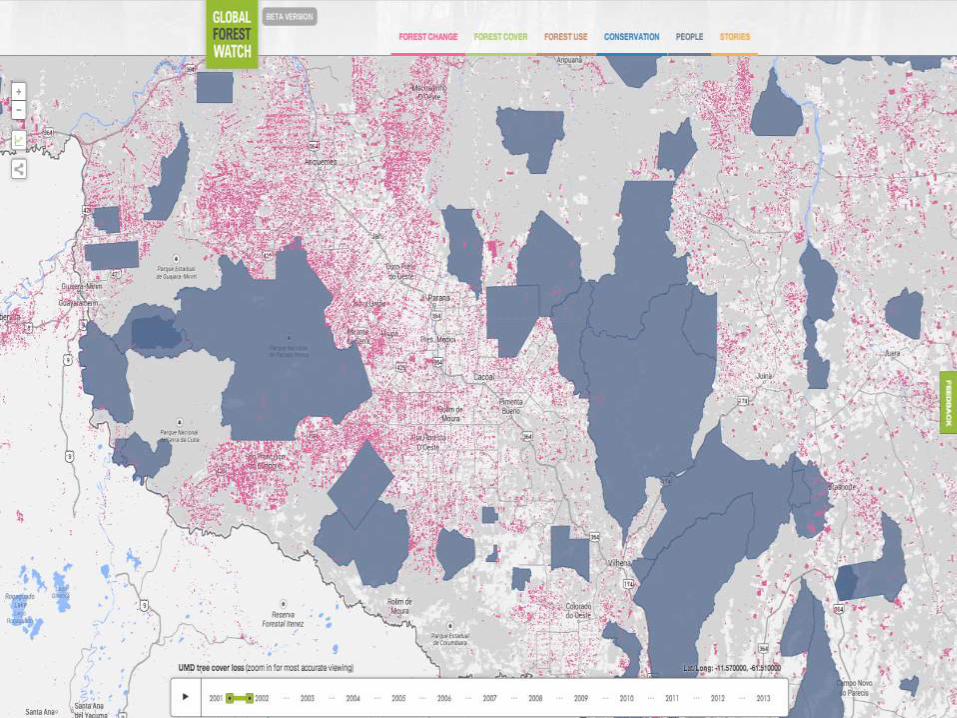
MAPPING COMMUNITY FORESTS WITH
GLOBAL FOREST WATCH
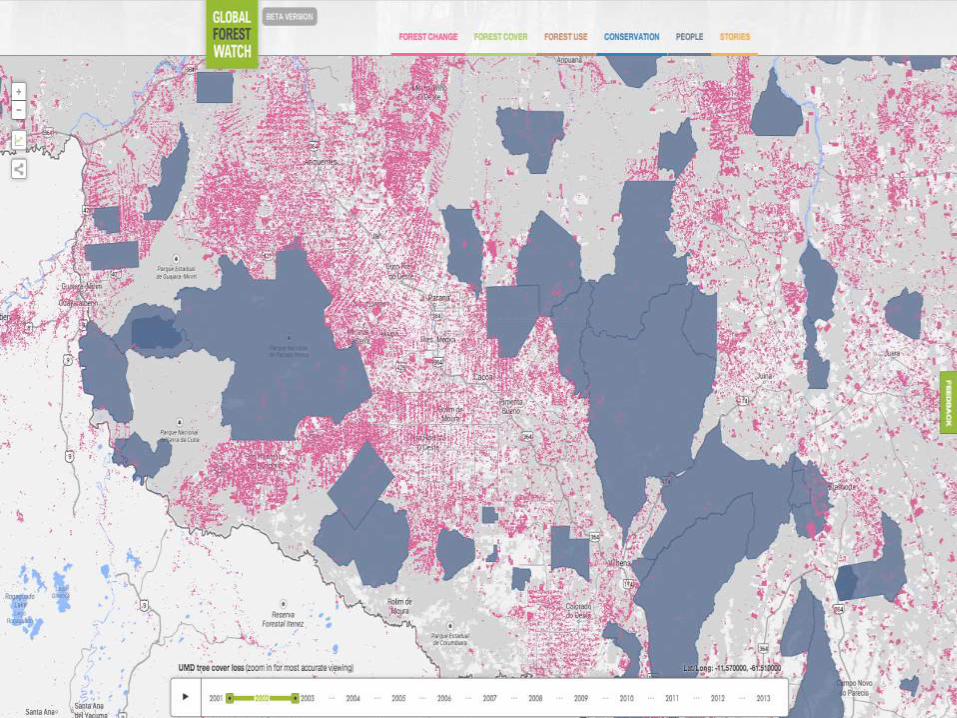

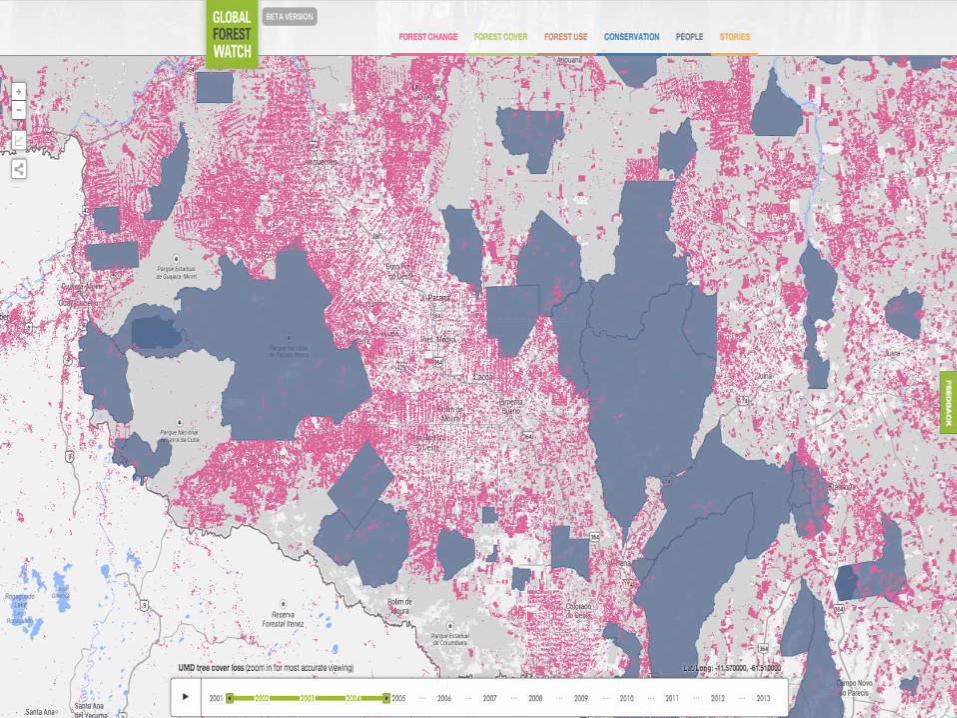
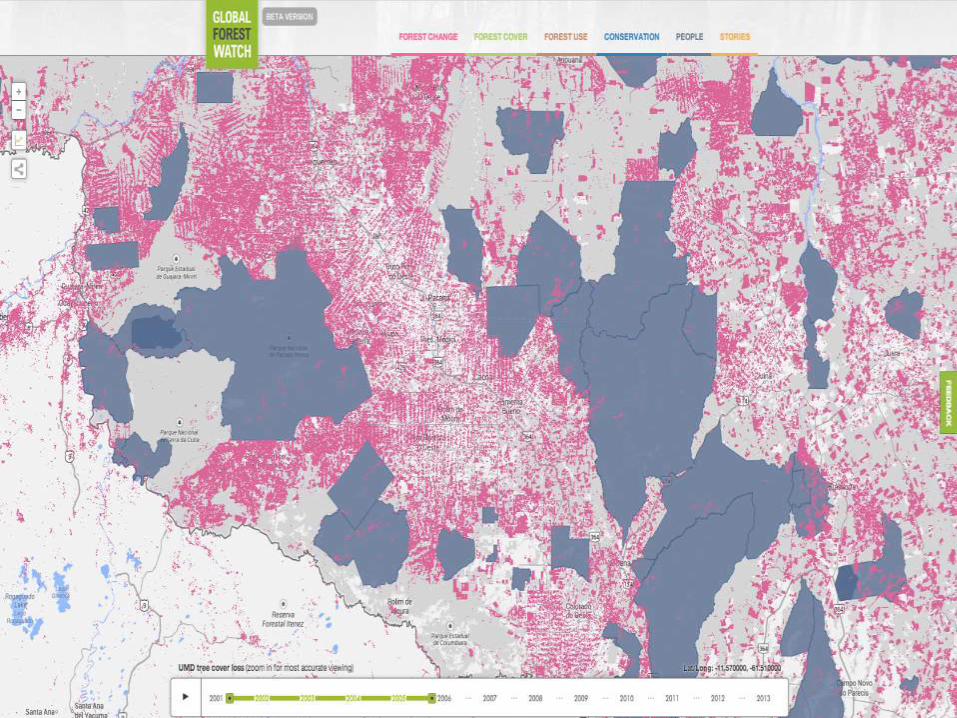


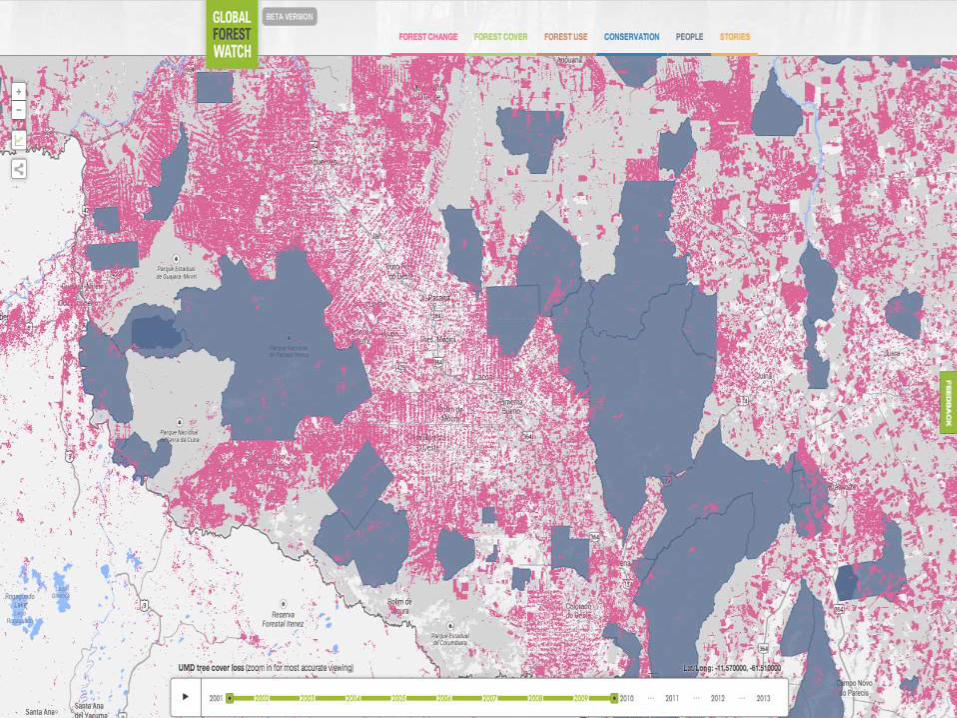


GLOBALFORESTWATCHC L I M A T E
Track carbon emissions from forest change
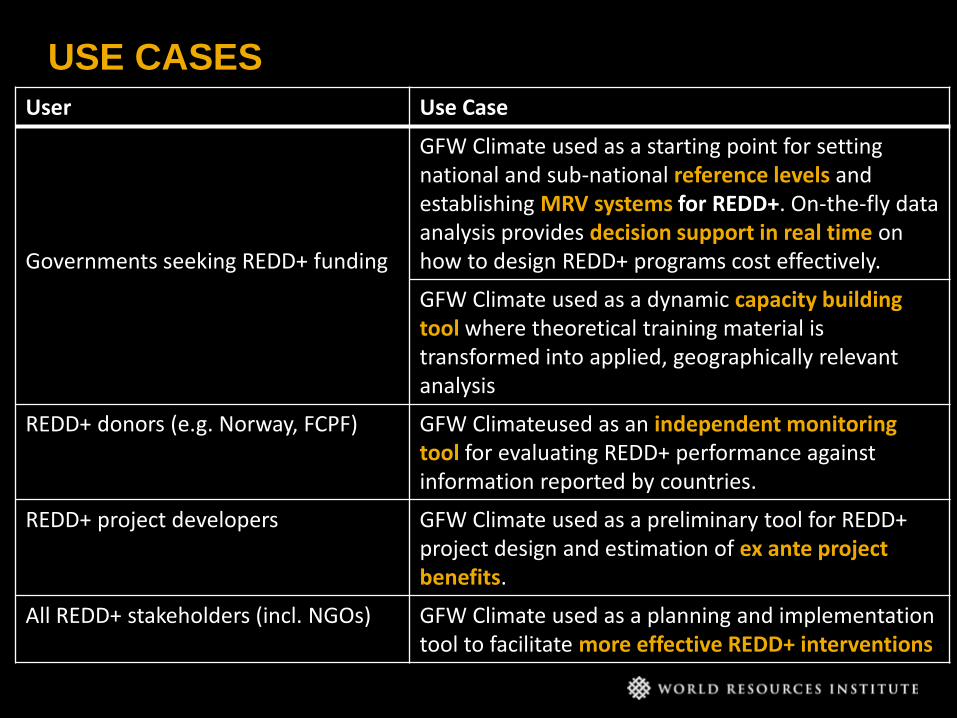
USE CASES
User Use Case
Governments seeking REDD+ funding
GFW Climate used as a starting point for setting national and sub-national reference levels and establishing MRV systems for REDD+. On-the-fly data analysis provides decision support in real time on how to design REDD+ programs cost effectively.
GFW Climate used as a dynamic capacity building tool where theoretical training material is transformed into applied, geographically relevant analysis
REDD+ donors (e.g. Norway, FCPF) GFW Climateused as an independent monitoring tool for evaluating REDD+ performance against information reported by countries.
REDD+ project developers GFW Climate used as a preliminary tool for REDD+ project design and estimation of ex ante project benefits.
All REDD+ stakeholders (incl. NGOs) GFW Climate used as a planning and implementation tool to facilitate more effective REDD+ interventions
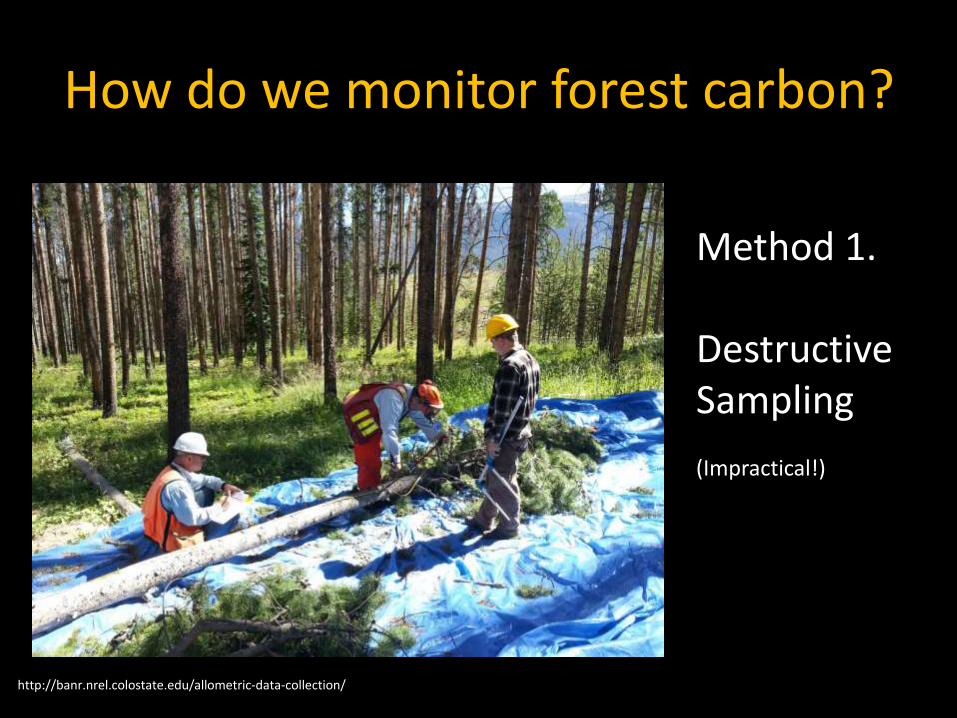
How do we monitor forest carbon?
http://banr.nrel.colostate.edu/allometric-data-collection/
Method 1.
Destructive Sampling
(Impractical!)

How do we monitor forest carbon?
Measure diameter (and height) of trees in a plot
Convert diameter and height to biomass with
allometricequations
Repeat measurements for many plots
Estimate average carbon stocks per
stratum
Method 2. Measure sample plots extrapolate
NATIONAL FOREST INVENTORIES
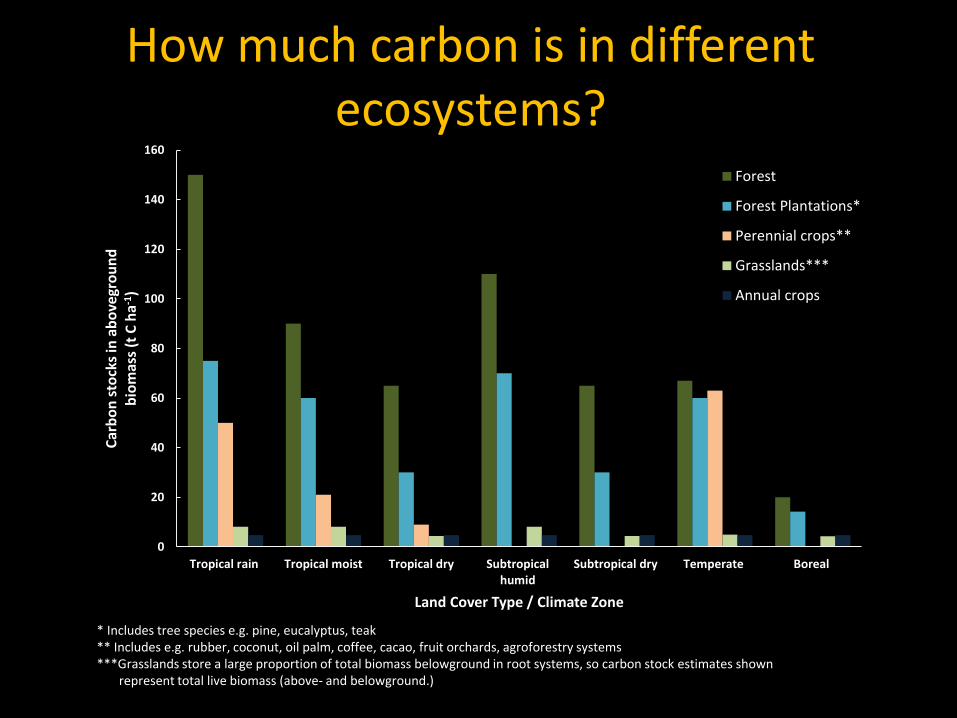
How much carbon is in different ecosystems?
0
20
40
60
80
100
120
140
160
Tropical rain Tropical moist Tropical dry Subtropicalhumid
Subtropical dry Temperate Boreal
Car
bo
n s
tock
s in
ab
ove
gro
un
d
bio
mas
s (t
C h
a-1)
Land Cover Type / Climate Zone
Forest
Forest Plantations*
Perennial crops**
Grasslands***
Annual crops
* Includes tree species e.g. pine, eucalyptus, teak** Includes e.g. rubber, coconut, oil palm, coffee, cacao, fruit orchards, agroforestry systems***Grasslands store a large proportion of total biomass belowground in root systems, so carbon stock estimates shown
represent total live biomass (above- and belowground.)

How do we monitor forest carbon?
Measure Lorey’sheight in a lidar
footprint
Convert Lorey’sheight to biomass
with allometricequations
Repeat measurements for many plots
Estimate average stocks
per pixel
Method 3. Measure sample plots extrapolate
REMOTE SENSING APPROACHES

Yu & Saatchi et al. In Review

NASA’s Global Ecosystem
Dynamics Investigation
(GEDI) Lidar
BIOMASS
ESA’s Earth Exploration Mission Radar
How do we monitor forest carbon?
Method 4. Systematic satellite observations (2020+)

Stocks vs. Fluxes
Forest carbon stocks Carbon emissions from deforestation


What do users need?
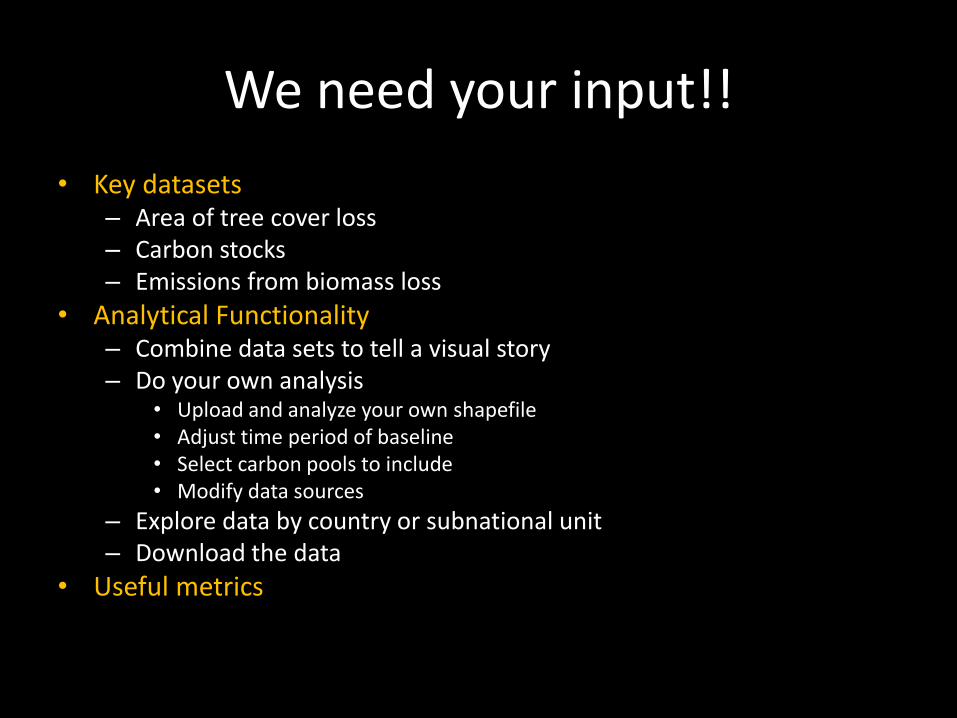
We need your input!!
• Key datasets– Area of tree cover loss– Carbon stocks – Emissions from biomass loss
• Analytical Functionality– Combine data sets to tell a visual story– Do your own analysis
• Upload and analyze your own shapefile• Adjust time period of baseline• Select carbon pools to include• Modify data sources
– Explore data by country or subnational unit– Download the data
• Useful metrics
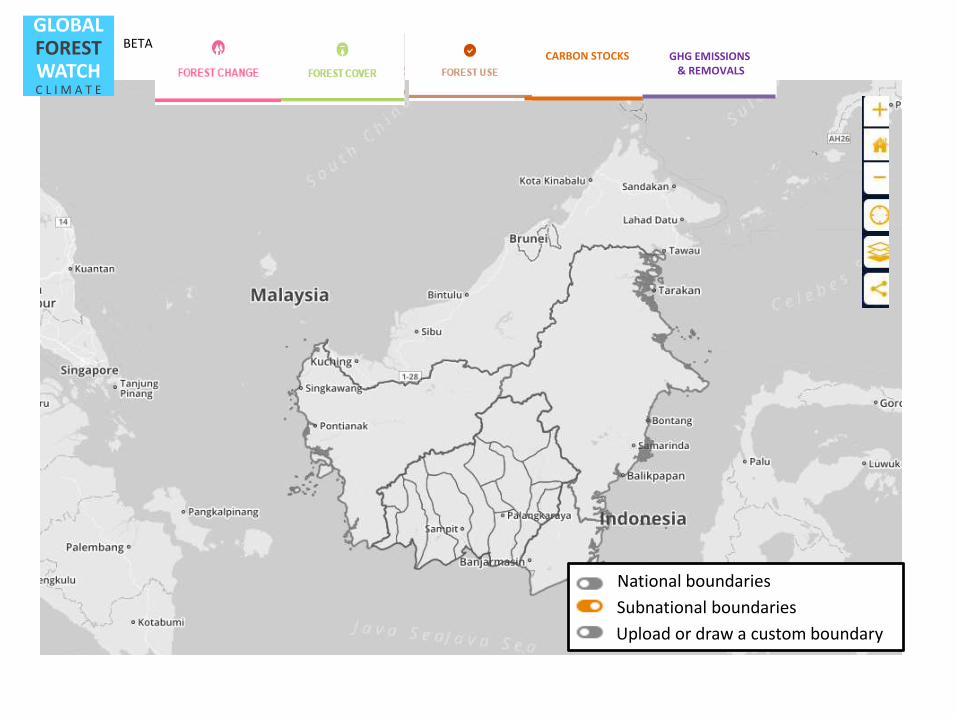
GLOBALFORESTWATCHC L I M A T E
BETA VERSION HOMECARBON STOCKS GHG EMISSIONS
& REMOVALS
National boundaries
Subnational boundaries
Upload or draw a custom boundary

GLOBALFORESTWATCHC L I M A T E
BETA VERSION HOME MAP BLOG PUBLICATIONS DATA METHODS ABOUT GFW
National boundaries
Subnational boundaries
Upload or draw a custom boundary
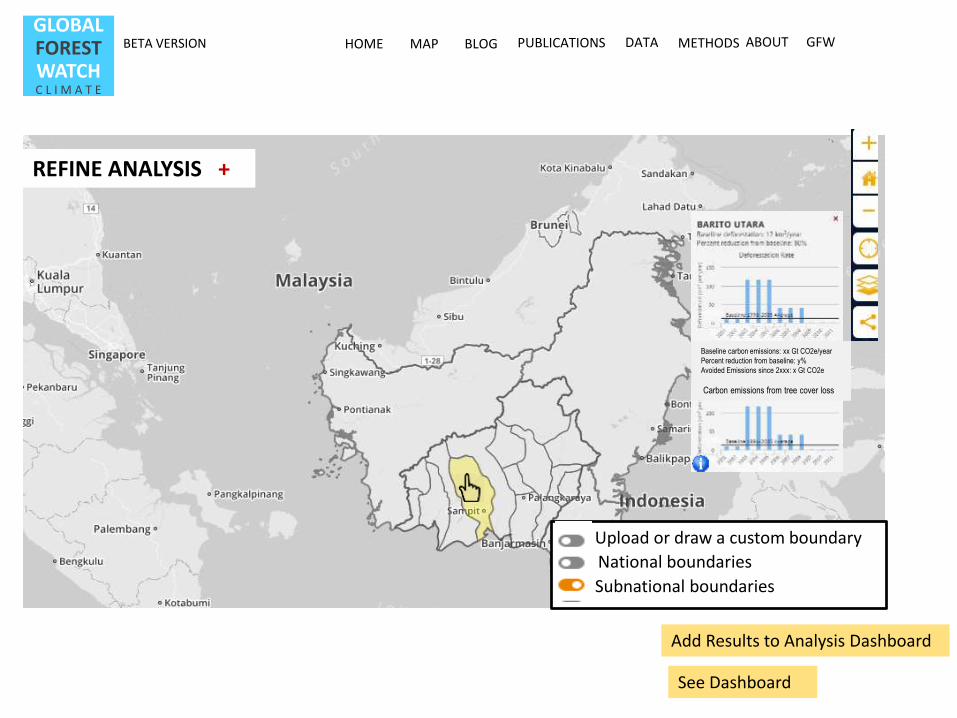
GLOBALFORESTWATCHC L I M A T E
BETA VERSION HOME MAP BLOG PUBLICATIONS DATA METHODS ABOUT GFW
Baseline carbon emissions: xx Gt CO2e/year
Percent reduction from baseline: y%
Avoided Emissions since 2xxx: x Gt CO2e
Carbon emissions from tree cover loss
REFINE ANALYSIS +
National boundaries
Subnational boundaries
Upload or draw a custom boundary
Add Results to Analysis Dashboard
See Dashboard

GLOBALFORESTWATCHC L I M A T E
BETA VERSION HOME MAP BLOG PUBLICATIONS DATA METHODS ABOUT GFW
Baseline carbon emissions: xx Gt CO2e/year
Percent reduction from baseline: y%
Carbon emissions
REFINE ANALYSIS X
National boundaries
Subnational boundaries
Upload or draw a custom boundary
Carbon Pools Included
Forest area dataUMD/GLAD
Areas to exclude from analysis
FreehandPolygonUpload shapefile
Aboveground biomassNASA JPL (Saatchi et al.)Woods Hole (Baccini et al.)Carnegie (Asner et al.)Country reportedFAO
Belowground biomassDead woodLitterSoil organic carbon
SubmitAdd Results to Analysis Dashboard
See Dashboard
Time Period for Baseline
Forest Definition
FAO
Reported to UNFCCC
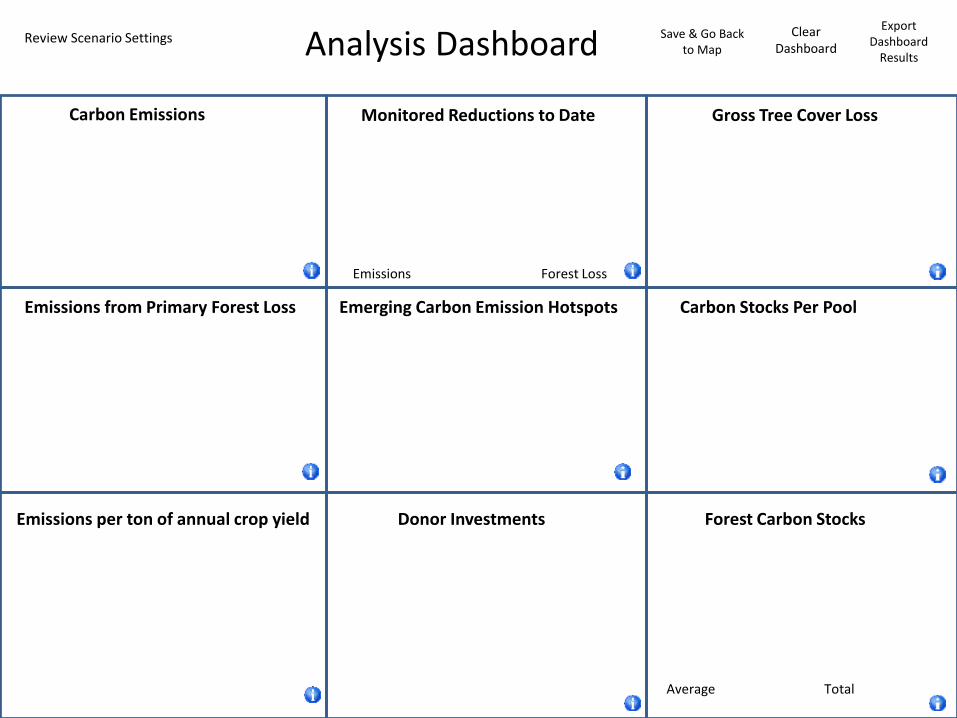
Analysis Dashboard Save & Go Back to Map
Clear Dashboard
Export Dashboard
Results
Review Scenario Settings
Monitored Reductions to DateCarbon Emissions
Forest Carbon Stocks
Gross Tree Cover Loss
Emerging Carbon Emission Hotspots
Donor InvestmentsEmissions per ton of annual crop yield
Emissions Forest Loss
Emissions from Primary Forest Loss Carbon Stocks Per Pool
Average Total
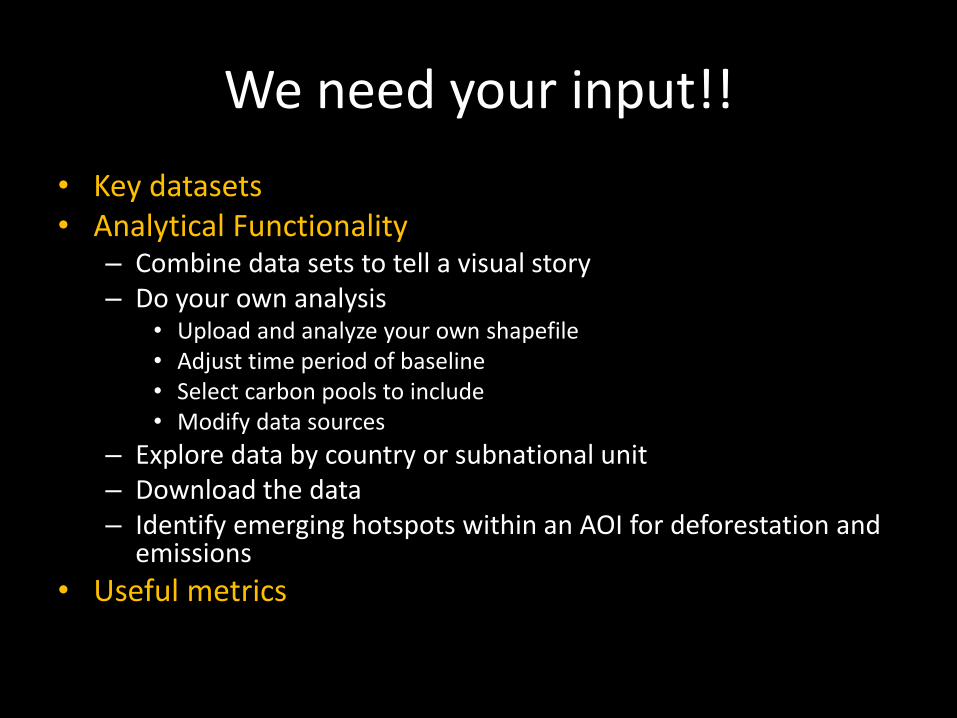
We need your input!!
• Key datasets• Analytical Functionality
– Combine data sets to tell a visual story– Do your own analysis
• Upload and analyze your own shapefile• Adjust time period of baseline• Select carbon pools to include• Modify data sources
– Explore data by country or subnational unit– Download the data– Identify emerging hotspots within an AOI for deforestation and
emissions
• Useful metrics
www.globalforestwatch.org
@globalforests
GLOBALFORESTWATCHC L I M A T E
Thank you!