Getting To Outcomes CSAP
127
-
Upload
prevention-works-consulting -
Category
Documents
-
view
1.456 -
download
2
description
Transcript of Getting To Outcomes CSAP
“Getting To Outcomes” – Conference Edition – June 2000 Forward
FOREWORD
The Center for Substance Abuse Prevention (CSAP) through its National Center for the Advancement of Prevention presents the following comprehensive copy of the 1999 Pilot Training Manual, Getting to Outcomes: Methods and Tools for Planning, Self-Evaluation and Accountability. Originally commissioned through the CSAP’s National Center for the Advancement of Prevention (NCAP), development of this manual began with the work of Drs. Abe Wandersman, Matt Chinman and Pam Imm at the University of South Carolina. During its pilot phase, the CSAP joined the Office of National Drug Control Policy (ONDCP) in presenting Getting to Outcomes to Drug Free Communities grantees through training opportunities at conferences hosted in each of five cities by CSAP’s regional Centers for the Application of Prevention Technology (CAPTs). The cities included: Atlanta, Dallas, Chicago, Providence and Reno. Approximately five hundred participants were involved in these training opportunities in 1999. Feedback from the participating grantees resulted in changes that are incorporated in this version of the 1999 pilot training manual. This document, building on the work of the original authors, is now organized to include the following components:
• The second revision of Getting to Outcomes, • Visuals used in the 1999 pilot training, • Tools and references, • Worksheets, • Glossary, • Bibliography, • CSAP Core Measures and Guidelines for their use.
Building on the core concepts of Getting to Outcomes, and applying the lessons learned through the pilot experience and feedback received since, CSAP’s NCAP is developing a Getting to Outcomes Training Series for individuals and organizations doing the work of prevention throughout America The series includes: !"NCAPTion Training Guides: Five introductory training guides, each one conforming to a
content area on CSAP’s new online Decision Support System (DSS) including: 1. Assess Needs 2 Develop Capacities 3. Select Programs 4. Implement Programs 5. Evaluate Programs
!"Job Aid Training Manuals Five in-depth manuals “drilling down” into each of the five content areas of the DSS to provide training at multiple levels.
!"Training Curriculum A comprehensive training curriculum including all five content areas of the DSS.
!"Online Access The entire Getting to Outcomes Training Series is accessible online in CSAP’s Decision Support System at http://www.preventiondss.org.
“Getting To Outcomes” – Conference Edition – June 2000 TOC
Getting to Outcomes Table of Contents
Pilot Training Manual
Introduction -----------------------------------------------------------------------------------------------1
Format & Features of Manual -------------------------------------------------------------------------2
Needs & Resources ---------------------------------------------------------------------------------------3
Goals & Objectives ---------------------------------------------------------------------------------------4
Best practices ----------------------------------------------------------------------------------------------5
Fit ------------------------------------------------------------------------------------------------------------6
Capacities --------------------------------------------------------------------------------------------------7
Plan----------------------------------------------------------------------------------------------------------8
Process Evaluation----------------------------------------------------------------------------------------9
Outcomes ------------------------------------------------------------------------------------------------- 10
Continuous quality Improvement ------------------------------------------------------------------- 11
Sustainability -------------------------------------------------------------------------------------------- 12
Training Tools & References
Appendices ----------------------------------------------------------------------------------------------- 13
Appendix A – Sample Logic Model
Appendix B – National Databases
Appendix C –Needs Assessment Checklist
Appendix D – Science-Based Resources
Appendix E – ONDCP’s Principles
Appendix F – Agency Principles
Appendix G – Web Sites
Appendix H – Meeting Questionnaire
Appendix I – Meeting Effectiveness Inventory
Appendix J – Implementation Form
Appendix K – Sample Satisfaction Measure
Appendix L – Participant Assessment Form
Appendix M – Project Insight Form
“Getting To Outcomes” – Conference Edition – June 2000 TOC
Getting to Outcomes Table of Contents‚ (Continued)
Training Tools & References
Appendix N – Examples of Outcomes and Indicators
Appendix O – Commonly Used Evaluation Designs
Appendix P – Strengths and Weaknesses of Commonly-used Evaluation Designs
Appendix Q – Data Collection Methods at a Glance
Appendix R – Linking Design-Collection-Analysis at a Glance
Appendix S – Sample Data Analysis Procedures
Visuals ---------------------------------------------------------------------------------------------------- 14
Glossary -------------------------------------------------------------------------------------------------- 15
Bibliography --------------------------------------------------------------------------------------------- 16
Acknowledgements ------------------------------------------------------------------------------------- 17
CSAP Core Measures ---------------------------------------------------------------------------------- 18
References------------------------------------------------------------------------------------------------ 19
“Getting To Outcomes” – Conference Edition – June 2000 1
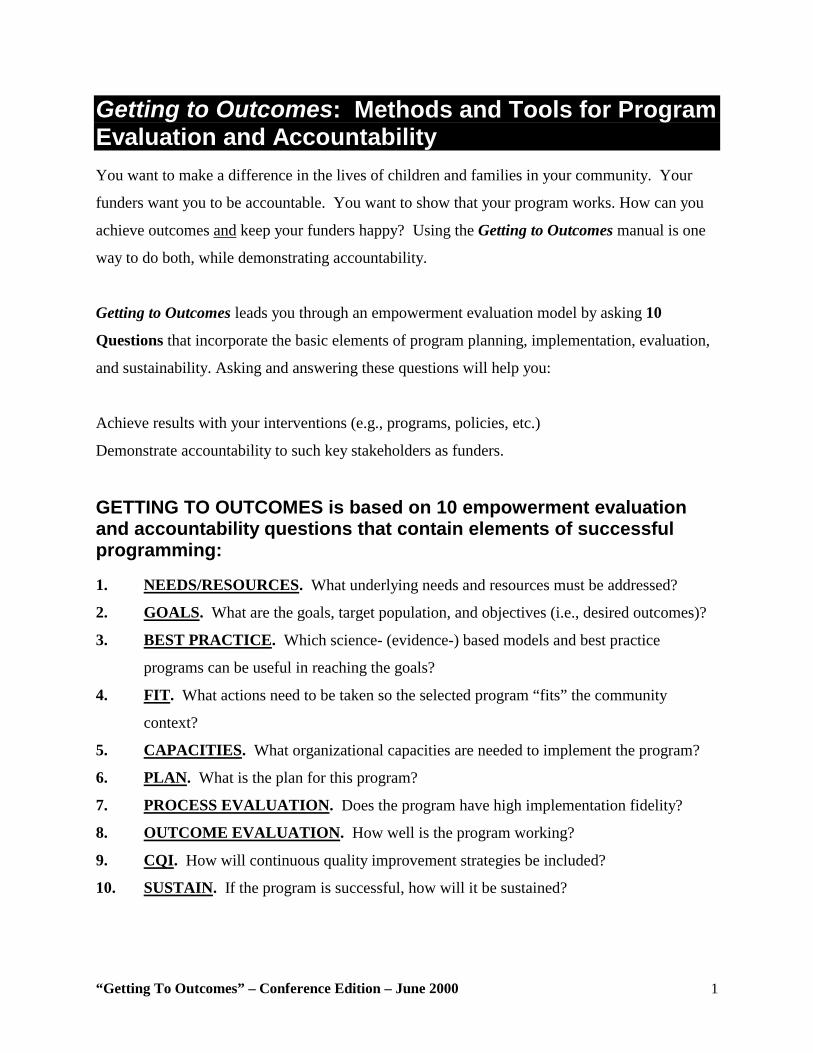
Getting to Outcomes: Methods and Tools for Program Evaluation and Accountability You want to make a difference in the lives of children and families in your community. Your
funders want you to be accountable. You want to show that your program works. How can you
achieve outcomes and keep your funders happy? Using the Getting to Outcomes manual is one
way to do both, while demonstrating accountability.
Getting to Outcomes leads you through an empowerment evaluation model by asking 10
Questions that incorporate the basic elements of program planning, implementation, evaluation,
and sustainability. Asking and answering these questions will help you:
Achieve results with your interventions (e.g., programs, policies, etc.)
Demonstrate accountability to such key stakeholders as funders.
GETTING TO OUTCOMES is based on 10 empowerment evaluation and accountability questions that contain elements of successful programming: 1. NEEDS/RESOURCES. What underlying needs and resources must be addressed?
2. GOALS. What are the goals, target population, and objectives (i.e., desired outcomes)?
3. BEST PRACTICE. Which science- (evidence-) based models and best practice
programs can be useful in reaching the goals?
4. FIT. What actions need to be taken so the selected program “fits” the community
context?
5. CAPACITIES. What organizational capacities are needed to implement the program?
6. PLAN. What is the plan for this program?
7. PROCESS EVALUATION. Does the program have high implementation fidelity?
8. OUTCOME EVALUATION. How well is the program working?
9. CQI. How will continuous quality improvement strategies be included?
10. SUSTAIN. If the program is successful, how will it be sustained?
“Getting To Outcomes” – Conference Edition – June 2000 2
The Format for the Getting to Outcomes Manual
Each chapter in “getting to outcomes” follows this format for each question:
• Defines the program element
• Discusses its importance
• Addresses the action steps needed
• Creates a Checklist for each question
Features of the Getting to Outcomes Content
1. In Getting to Outcomes, we define accountability as a comprehensive process that systematically incorporates the critical elements of effective programming.
In Getting to Outcomes, program development and program evaluation are integral to
promoting program accountability. Program accountability begins with putting a
comprehensive system in place to help your program achieve results. Asking and
answering the 10 questions is essential to successful outcomes. Many excellent resources
discuss the importance of each program element. By linking these program elements
systematically, programs can achieve their desired outcomes and demonstrate to their
funders the kind of accountability that will ensure continued funding.
2. You can use Getting to Outcomes at any stage of your work. We know that many practitioners are in the middle of programming and cannot begin
with the first accountability question. No matter where you are in your process, the
components of Getting to Outcomes are useful. For example, if a science-based program
has been chosen and is being implemented, accountability question six on effective
planning, or accountability question eight about evaluating outcomes‚ still can be
valuable.
“Getting To Outcomes” – Conference Edition – June 2000 3
3. Getting to Outcomes promotes cultural competence in programming. Program staffs often recognize the importance of being culturally competent in their
prevention and treatment work. However, there has been no formalized way to ensure
cultural competence in program planning, implementation, and evaluation.
Your approach to cultural competence should be systematic. According to Resnicow,
Soler, Ahluwalia, Butler, and Braithwaite (1999), staff should incorporate the
“ethnic/cultural characteristics, experiences, norms, and values” of the target
population(s) when implementing and evaluating programs. This should be done at each
program development stage:
• Planning stage. Staff should take into account cultural factors, when choosing or
designing a program, to ensure that it truly addresses the target group’s needs in a
meaningful way.
• Implementation stage. Staff should consider the cultural relevance of a variety of
program activities such as curriculum materials, types of food, language, music,
media channels, and settings.
• Evaluation stage. Staff should ensure that the tracking and evaluation instruments
are adapted to the particular target population.
Getting to Outcomes promotes cultural competence by providing worksheets and
checklists to ensure understanding. There is much more to cultural competence. We hope
that this process will encourage ongoing dialogue with community stakeholders about
these important issues. Remember to consider issues of cultural competence during each
accountability assessment. Chapter 5 contains a DRAFT checklist that should be
modified to meet your particular needs.
4. Getting to Outcomes uses a logic model format to ensure a conceptual link between identified problems and planned activities and desired outcomes.
A logic model can be defined as a series of connections that link problems or needs you
are addressing with the actions you will take to obtain your outcomes. In a logic model,
the program activities target those factors identified as contributing to the problem.
“Getting To Outcomes” – Conference Edition – June 2000 4
Logic models are frequently phrased in terms of “if-then” statements that address the
logical result of an action; e.g. If alcohol, tobacco, and drugs are difficult for youth to
obtain, then youth are less likely to use them, and ATOD use rates will decrease.
Logic models are formulated to convey clear messages about the reasons (theory) why a
proposed program is expected to work. Sharing logic models with program staff and
community members early in the process is often a worthwhile activity. We have found
that it helps to have a logic model diagram (picture) of how and why a program should
work. (Appendix A provides a sample logic model.)
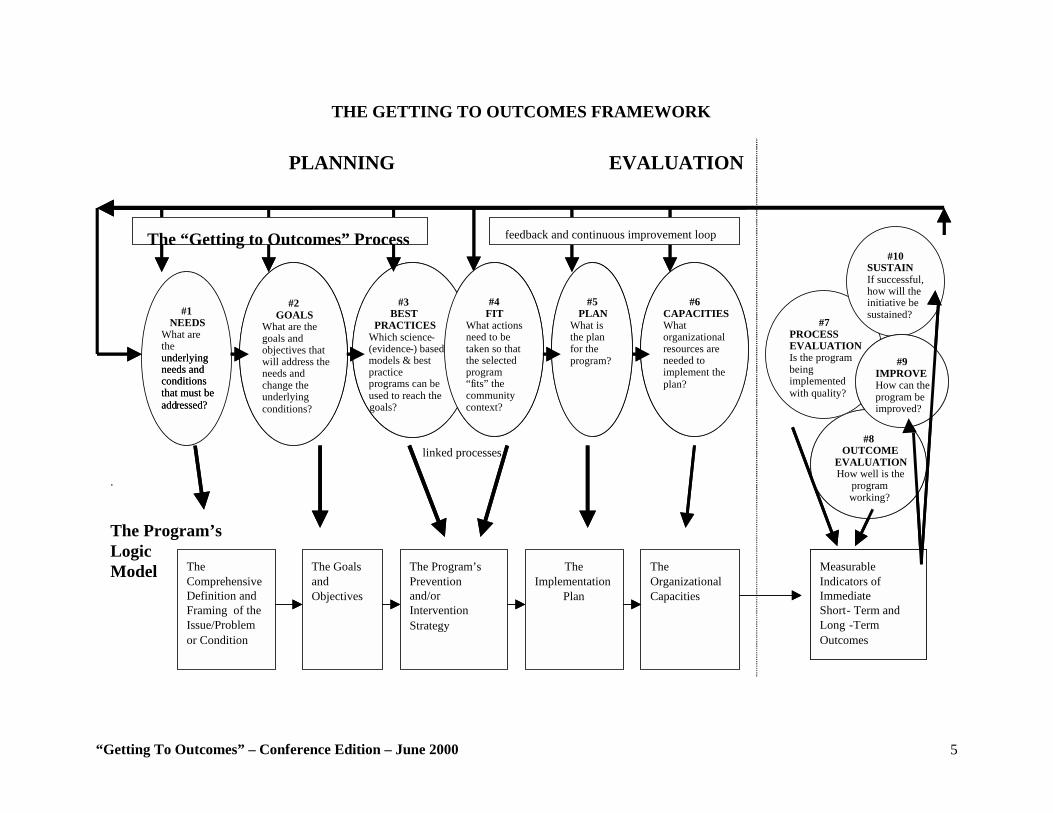
5. Linking the Accountability Questions to a Program’s Logic Model. Figure 1 provides a diagram showing the Getting to Outcomes process (questions at the
top). The process consists of six planning questions (questions 1-6) and four evaluation
steps, which include process and outcome assessment, as well as the use of evaluative
results to improve and sustain the programs.
“Getting To Outcomes” – Conference Edition – June 2000 5
THE GETTING TO OUTCOMES FRAMEWORK
PLANNING
linked processes
.
The Program’s Logic Model
#7 PROCESS EVALUATION Is the program being implemented with quality?
#10 SUSTAIN If successful, how will the initiative be sustained?
The Comprehensive Definition and Framing of the Issue/Problem or Condition
The Goals and Objectives
The Program’s Prevention and/or Intervention Strategy
The Implementation
Plan
The Organizational Capacities
#1 NEEDS
What are the underlying needs and conditions that must be add ressed ?
#2 GOALS
What are the goals and objectives that will address the needs and change the underlying conditions?
#3 BEST
PRACTICES Which science - (evidence - ) based models & best practice programs can be used to reach the goals?
#5 PLAN
What is the plan for the program?
#6 CAPACITIES What organizational resources are needed to implement the plan?
#8 OUTCOME
EVALUATION How well is the
program working?
#9 IMPROVE How can the program be improved?
#4 FIT
What actions need to be taken so that the selected program “f its” the community context?
Measurable Indicators of Immediate Short - Term and Long - T erm Outcomes
underlying needs and conditions that must be add ressed ?
#2 GOALS
What are the goals and objectives that will address the needs and change the underlying conditions?
#3 BEST
PRACTICES Which science - (evidence - ) based models & best practice programs can be used to reach the goals?
#5 PLAN
What is the plan for the program?
#6 CAPACITIES What organizational resources are needed to implement the plan?
#8 OUTCOME
EVALUATION How well is the
program working?
#9 IMPROVE How can the program be improved?
#4 FIT
What actions need to be taken so that the selected program “f its” the community context?
Measurable Indicators of Immediate Short - Term and Long - T erm Outcomes
The “Getting to Outcomes” Process feedback and continuous improvement loop
EVALUATION
“Getting To Outcomes” – Conference Edition – June 2000 6
6. This process is not linear. Although the Getting to Outcomes process is presented sequentially, remember that the
process is not linear. You may need to go backward occasionally to revisit some
questions. Other times‚ you may need to skip forward. For example, just because the
question on organizational capacities is not listed until Question 5, that does not mean
that you cannot consider capacities earlier in the process. The 10 questions are presented
in a logical, sequential format. However, your situation may require you to address them
in a different order. You undoubtedly will find yourself considering the 10 questions
repeatedly and at different times.
7. Getting to Outcomes uses the risk and protective factor model. The risk and protective factor model is helpful in understanding the underlying risk
conditions that contribute to the problem and the protective factors that reduce these
negative effects (Hawkins, Catalano, and Miller, 1992). The risk and protective factor
model explores critical risk and protective factors across the domains of individual/peer,
family, school, and community that are related to ATD use among youth. These factors
are useful in setting up a logic model that can be used in program planning,
implementation, and evaluation.
“Getting To Outcomes” – Conference Edition – June 2000 7
Needs and Resources: What are the underlying needs and resources that must be addressed?
This first question is critical in defining and framing the problem area. Answering this question
will help you gain a clearer understanding of the problem areas or issues in your location/setting‚
and enable you to identify which group of people (the potential target population) for whom the
problem is most severe. Additionally, it is important to examine the assets and resources that
exist in a community to respond to problem issues, to help lessen or protect individuals from risk
conditions, and to prevent the emergence of problem issues. For example, good family
management and supervision helps prevent youths from becoming involved with alcohol and
drugs. Thus, families may need training and counseling support to improve their parenting and
supervision skills. Often, needs may be defined in terms of “assets to be strengthened,” rather
than focusing on the community or target population’s “problems” or “deficits”. Definition of the Needs and Resources Assessment
A systematic process of gathering information about the current conditions of a targeted
population and/or area that underlie the need for an intervention, and that simultaneously
offer resources for the implementation of an intervention.
Why is Conducting a Needs and Resources Assessment Important? • To identify where (for example, school, neighborhood, or street) alcohol and drug abuse
problems are the most prevalent
• To identify which groups of people are most involved in alcohol and other drug abuse
• To identify the risk and protective factors most prevalent in the group/population under
consideration
• To determine if existing community resources are addressing the problem
• To assess the level of community readiness to respond to the issue/problem
• To provide baseline data that can be monitored for changes over time
“Getting To Outcomes” – Conference Edition – June 2000 8
Issues in Planning and Conducting a Needs and Resources Assessment Needs and resource assessments vary depending upon the breadth and scope of what you are
trying to examine. For example, a local service provider may want to assess the needs of a
particular youth population within a specific school or neighborhood. The focus of a larger
community coalition or interagency partnership might be an assessment of an entire
neighborhood, community, or county’s needs. State agencies are likely to have an even wider
scope. They may concentrate on larger areas around the State (such as regions) and assess the
needs among many groups of people. (Resources for national databases are included in Appendix
B.)
When conducting a needs and resources assessment, it is critical that information and archival
databases relevant to the targeted issue/problem and the identified target population be used. For
example, State or Federal survey data will not provide the necessary information if you are
examining underage drinking in a local school district. Rather, results of a school survey would
be more relevant. Ideally, information gathered during a needs assessment can be used as
baseline data. For example, a State-level survey can provide data on drug use rates across
different regions within the State (such as underage smoking and marijuana use rates in the
State). This information is useful for those at the State level who are attempting to develop
interventions and policies. After these strategies have been implemented over time, subsequent
State-level surveys can be examined to determine whether drug use rates have changed; this
information will be helpful in determining the effectiveness of these interventions.
Data Sources for Needs and Resources Assessments Addressing the needs assessment questions requires multiple sources of data, ranging from
subjective community perceptions to scientifically valid quantitative data. Combining data
sources is necessary in order to get a complete picture of the problem/issue. One single data
source is difficult to interpret in isolation. However, multiple sources of both subjective and
objective data add greater clarity, increase accuracy in defining the problem, and instill
confidence and common understanding among program stakeholders.
“Getting To Outcomes” – Conference Edition – June 2000 9
Data sources commonly used in needs and resource assessments for substance abuse
prevention/intervention programs are as follows:
• Key informant surveys—Key informant surveys are conducted with individuals who
are leaders or representatives in their communities. They “know” the community and
are likely to be aware of the extent of its needs and resources (NIDA, 1997).
• Community meetings/forums—This method uses a series of community meetings to
gain information. Although key community leaders are often present, the meetings
are held primarily to obtain information from the general public.
• Case studies—Case studies provide information about particular services people use
and those they may need.
• Health indicators/archival data—Various social and public health departments
maintain information on a number of health conditions, including teenage pregnancy,
HIV/AIDS diagnoses, substance abuse admissions, families receiving welfare
benefits, unemployment levels, and percentage of households below the poverty line.
• Census records—Census records provide data on the population and demographic
distribution of the targeted community.
• Police arrest and court data—Police arrest figures provide information on the
community’s high crime areas, types of crimes being committed, and offenders’ ages.
• Service providers surveys—Service providers know the nature of a community’s
problems, available programs and resources, and who is being served.
• Client or participant surveys—Clients and program participants are excellent sources
of information on what needs are being met and what additional needs should be
addressed.
• Targeted population problem behavior surveys—Self–report surveys and
comprehensive assessments of those to be targeted by the initiative (for example,
youth 12-to-17 years of age) can provide useful information on the extent and nature
of their problem behaviors and other issues. A number of national survey tools exist
that can be employed at the State and/or local level.
• Resource asset mapping—Mapping community resources (including programs and
services that address the targeted problem‚ and/or related programs) shows what
problems already are being addressed and which need to be addressed.
“Getting To Outcomes” – Conference Edition – June 2000 10
When collecting needs and resource data, it is important to consider ethical issues such as
confidentiality and consent. Although we present an overview of these issues in Chapter 8,
evaluation data collection methods should be considered here as well.
STEPS TO ADDRESS NEEDS AND RESOURCES Generic steps for a needs and resource assessment on substance abuse problems are as follows:
• Select a target area to be assessed. Be specific in defining the target area so you can
remain focused on the types of data to collect (for example, information from school
districts, neighborhoods, communities).
• Gather data to develop a clear “picture” of the nature and extent of alcohol and drug
abuse problems in that geographic area. Examine all data sources that provide
information on the prevalence and incidence rates of particular problems related to a
target area (see list on data sources above).
• Gather data that help describe the nature and causes of the problem. Examine all data
sources that provide information on the problem including contributing‚ such as
participation in a gang or involvement in criminal activities.
• Assess the risk and protective factors of participants in the target area. Once you
have identified a target group, conduct a systematic assessment of those risk
conditions that contribute to the problem/issues and those protective factors that
improve risk conditions (see Risk and Protective Factor Model).
• Conduct a resource mapping and asset assessment. Examine the community
resources and other assets that exist (or do not exist) to respond to the targeted
problem/issue in the community. Strengthening strategies typically seek to build on a
community’s existing assets.
“Getting To Outcomes” – Conference Edition – June 2000 11
What Can Happen if I Do Not Conduct a Needs and Resource Assessment? Staff members are eager to develop and implement programs for a variety of reasons. New
funding may be available or the community may “push” for a program to address a problem.
One community agency had a successful program for parents who were in the process of divorce.
In this particular county, the divorce program was mandated by family court judges. Given the
fairly high divorce rate in this populated county, several classes were conducted simultaneously.
During one staff meeting, staff agreed that a program for the children of these parents might be
worthwhile. After all, the mandated classes were consistently full, suggesting that many children
were affected by divorce.
The evaluator suggested that the staff objectively and subjectively examine the need for a
program for children of divorcing parents. The staff determined that, indeed, many children
were affected, and that the majority of those children were 9 to 13 years old. The staff also
asked the parents (both individually and as a group) whether they would enroll their children in a
program if it were offered at the same time as the adult classes. Much to the staff’s surprise, the
majority of parents indicated that they would not enroll their children in such a program. Further
information revealed that these parents were aware of the potential negative effects of divorce on
their children. However, many of the children were seeing individual therapists or were being
monitored by school guidance counselors. Several parents revealed that their children were
already enrolled in a similar course at the local family service center. Additionally, some parents
were concerned that too much programming might tend to overemphasize the negative emotions
of the divorce. By assessing the needs and resources of the target population within the target
area, agency officials determined that a new program was not needed. As a result, they did not
invest in developing a new program; instead, they referred those parents interested in additional
help for their children to the family service center. This example shows how a needs
assessments help focus the activities of a program and eliminate wasteful efforts.
Background for WINNERS To demonstrate the use of the accountability questions, we have included an example,
WINNERS, based upon a real program. The WINNERS staff utilized the empowerment
evaluation and accountability questions to plan, implement, and evaluate an intervention to
“Getting To Outcomes” – Conference Edition – June 2000 12
address community needs. We have tried to keep the WINNERS example as “true to life” as
possible, but have modified some details to demonstrate certain points. The example is not
perfect, but it offers a true picture of community-based leaders and volunteers actually using the
concepts, structure, and tools contained in Getting to Outcomes.
Brief History of WINNERS School leaders were growing concerned because of increased referrals to the principal’s office,
incidents of trouble with the law, rising alcohol and tobacco use rates, and poor academic
performance. The crisis came when a sixth-grade student attending the middle school was
caught showing marijuana to his friends. This specific incident generated widespread attention,
alarm, and scrutiny by community members some of whom reacted by calling for action to
address the growing substance abuse problem among middle school students. Community
leaders met at an impromptu PTA/town meeting, organized by a core group of school
administrators, parents, and teachers in response to the influx of calls and communications to the
school and to relevant city agencies.
Needs and Resources: What are the underlying needs and conditions that must be addressed? The group decided to conduct both needs and resource assessments to examine what specific,
objective needs existed in the community. They were very concerned about the marijuana
incident in the middle school, but also believed they needed to understand the larger context of
this problem. After some debate, the team decided to use three methods to obtain needs
assessment data. The first method was to analyze existing data about students in the middle
school and the community’s two feeder elementary schools. Second, they identified concerns
raised at a formal evening community town meeting at the middle school‚ to which all interested
parents, administrators, teachers, and community members had been invited. Because it was
recognized that many parents could not attend the town meeting, the third method used to assess
community needs was a survey mailed to the parents of every student in the elementary and
middle schools.
“Getting To Outcomes” – Conference Edition – June 2000 13
The group knew that some drug use prevention/abatement programs/initiatives existed in the
town. Because money was tight, the group asked for volunteers to get additional information on
available resources. Three volunteers (including the principal) began making telephone calls and
visits to determine what resources existed. The principal also was interested in finding funding
for an initiative, so he contacted the local substance abuse commission. They helped by
providing information regarding youth alcohol and drug abuse as well as offering suggestions for
obtaining future funding.
General Needs Assessment Results 1) An analysis of Existing Data Found:
• Increased rates of truancy, disciplinary referrals, and suspensions at both of the
town’s elementary schools and its middle school.
• Increased expulsions from the middle school.
• A decline in overall grade point averages and mastery achievement test scores.
• Thirty percent (30%) of the students came from single parent homes.
• Forty percent (40%) had four or more siblings.
• The community was economically depressed, with fifty percent (50%) of school-age
children living at or below the Federal poverty level.
• About seventy percent (70%) of the students were receiving subsidized lunches.
2) At the Community Town Meeting It Was Learned That:
• Parents cared deeply about their children's future‚ but were feeling overwhelmed by
the challenges and problems facing their children.
• Teachers and parents agreed that the number of necessary parent-teacher conferences
had increased during the previous year.
• The welfare-to-work initiative had placed many parents in the work force, leaving
their children unsupervised after school and/or at night.
• Parents agreed that the amount of time they had to supervise their children had
declined.
• Parents saw the school as a potential resource for caring for their children and wanted
the school to do more.
“Getting To Outcomes” – Conference Edition – June 2000 14
• Parents noted that their kids had little contact with adult, especially male, role models,
and that due to parents' work schedules, very few children received after-school
supervision by adults/role models.
3) A Parents’ Survey Revealed That:
• Parents cared about their children‚ but were feeling overwhelmed.
• Parents expressed financial problems that often interfered with their abilities to
provide supervision and extra attention to their children and their children's problems.
• Parents worried about supporting their children, needing to work long hours, and the
consequent inability to spend a lot of time with their children.
• Parents indicated that their children were lying more often and beginning to steal.
• Parents also were concerned because their children were exhibiting increasing levels
of disrespect and little remorse for misbehavior.
• Parents noted that their children were skipping school more often and did not seem to
care about learning or about obeying rules and authority.
General Resource Assessment Results Schools:
• Middle and elementary schools provided a natural and ready resource for the
implementation of programs.
• Schools offered physical facilities.
• Schools had useful materials (desks, chalk boards, etc.).
• A number of teachers were willing to volunteer time to programs.
The Community:
• Few relevant, established, organized after-school activities were available.
• The YMCA and a town recreation center could host meeting as other program
activities.
• City buses were the only public transportation available, and they did not transport to
the community’s rural areas.
“Getting To Outcomes” – Conference Edition – June 2000 15
• An informal assessment of businesses, parents, teachers, and additional interested
parties determined the availability of potential mentors or volunteers to assist in
program implementation, and found that many community members were eager to
assist and volunteer time or donate products or money to the programs.
• A local business supply company offered to donate reams of paper and pencils to the
program.
• Two YMCA staff members offered to drive children to and from rural areas in a
YMCA van.
• Additional community resources were pledged by other businesses.
Private/Public Partnerships:
• A committee was formed of willing local business people and agency representatives to
investigate the availability of grant funding.
• Representatives from the local United Way and a local alcohol and drug abuse
treatment agency offered to assist in planning, researching, and implementing program
activities.
“Getting To Outcomes” – Conference Edition – June 2000 16
!
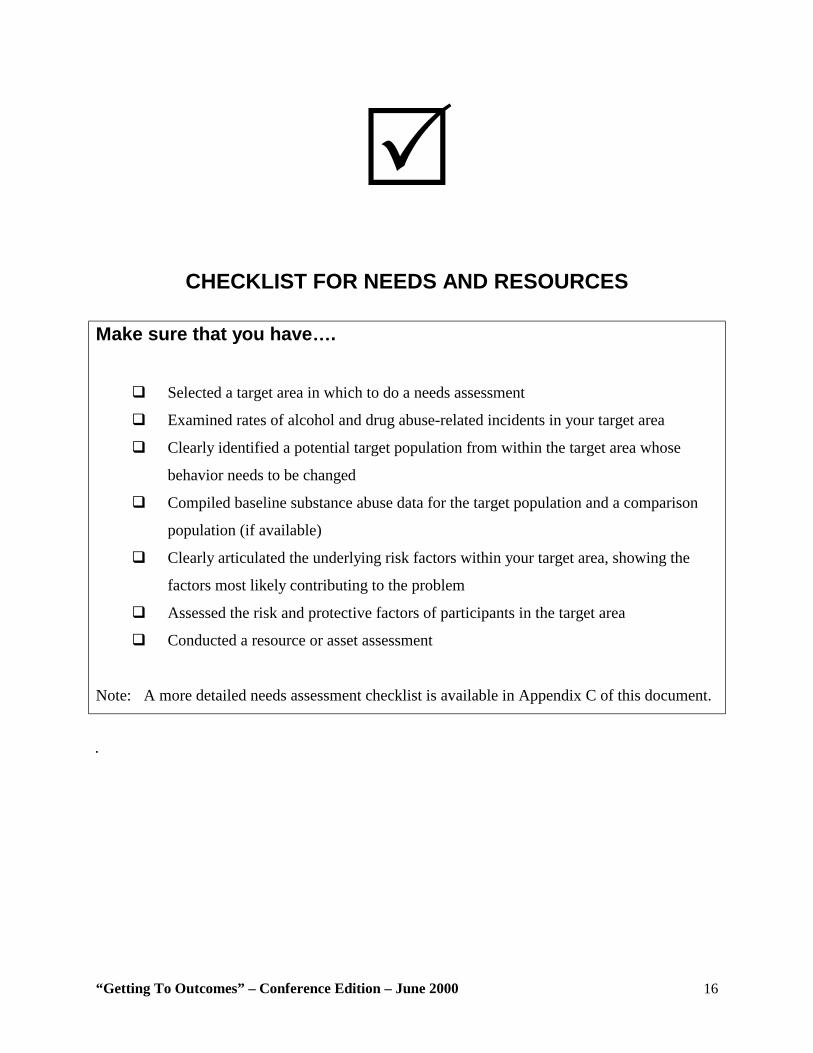
CHECKLIST FOR NEEDS AND RESOURCES
Make sure that you have………….
#" Selected a target area in which to do a needs assessment
#" Examined rates of alcohol and drug abuse-related incidents in your target area
#" Clearly identified a potential target population from within the target area whose
behavior needs to be changed
#" Compiled baseline substance abuse data for the target population and a comparison
population (if available)
#" Clearly articulated the underlying risk factors within your target area, showing the
factors most likely contributing to the problem
#" Assessed the risk and protective factors of participants in the target area
#" Conducted a resource or asset assessment
Note: A more detailed needs assessment checklist is available in Appendix C of this document.
.
“Getting To Outcomes” – Conference Edition – June 2000 17
GOALS & OBJECTIVES: What are the goals and objectives that will address the identified needs?
Definition of Goal
Goals are defined as broad statements that describe the desired measurable outcomes you
want to accomplish in your target population.
Definition of Objective
Objectives are specific statements that are measurable and have a time frame.
Now that the needs and resources have been identified in the targeted area, it is time to specify
goals and objectives. Goals reflect what you hope to achieve in your target population, and
should focus on behavioral changes. For example, the goal might be “To reduce alcohol use rates
among youth.” An objective statement might be: “To raise the initiation age of alcohol use in
junior high school students from 12 to 14 years old within two years.” Before formulating the
goals, one must have a clearly identified target population. Once the goals are clearly defined,
you will be able to identify how the target population should change (desired outcomes).
Information obtained from your needs and resources assessment may suggest a fairly broad
population for which to design programming, (such as “older student”). However‚ it is important
to be as specific as possible. For example, you might identify “all fifth- and sixth-grade students
who attend the three elementary schools in District #17.” There are situations when you may
have both a primary and a secondary target population. For example, to change family risk
factors shown to be related to youth alcohol use (such as parental attitudes favorable toward use,
or family conflict), you may need to work with the parents (primary target population) who then
will make changes in how they interact with their children (secondary target population).
“Getting To Outcomes” – Conference Edition – June 2000 18
Definition of Desired Outcome
Desired outcomes must be clearly defined, should support accomplishment of the goal, and
must be measurable.
Why is Specifying Goals & Objectives Important? • Specifying the changes you expect in the population helps to determine the types of
programming you potentially should implement.
• Clearly identifying the particular population helps to pinpoint what types of programming
may “fit” with programs already offered for that group.
• Clearly identifying goals and objectives can suggest outcome statements‚ which
subsequently can be used for evaluation.
STEPS TO ADDRESS GOALS & OBJECTIVES:
• Identify your population.
• Specify your goal(s) and objectives.
• Consider what final results you want to accomplish in your target population.
• Ensure that your goals and objectives are developed as a result of the needs and
resources.
• Consider the information you collected in Needs and Resources.
• Make sure that your goals and objectives are realistic and measurable.
• Describe what specific outcomes (changes) you expect as a result of your program;
the objective should be specific and measurable‚ within a specific time frame.
− For whom is your program designed? (e.g.‚ seventh grade students)
− What will change? (e.g., certain risk factors)
− By how much? (e.g., decreased approval of peer smoking by 20%)
− When will change occur? (e.g., by the end of your program, at a 6-month
follow-up)
− How will it be measured? (e.g., pre- and post-test surveys)
“Getting To Outcomes” – Conference Edition – June 2000 19
What Might Happen if Goals & Objectives Are Not Considered? Specifying both target populations and desired outcomes is necessary to determine if your goals
are being accomplished. One community coalition organized a party in a popular park located
across from the local junior high school. The coalition had two loosely formulated goals: to
increase community awareness about ATOD issues and to improve parents’ ability to talk to
their children about the dangers of ATOD use. The coalition publicized the “event” through a
variety of channels and involved targeted youth by having them disseminate flyers and other
information at several schools. Results suggested that many of the 100 attendees were children
who did not come with their parents. Approximately 20 percent of attendees were parents, many
of whom had preschool-aged children who enjoyed visiting the playground. The parents were
content to sit under the pavilion, rest, talk with each other, and eat the food provided. No
activities were designed specifically to promote parent-child interactions. In this instance,
although both populations (children and parents) were being targeted for change, parents were
not specifically targeted to attend, and if they did attend, structured parent-child interactions to
discuss the dangers of ATOD use were not offered as part of the event. Observation and survey
data revealed that the goal of increasing parents’ ability to talk with their children about the
dangers of ATOD use was not achieved, because the community coalition had not formulated a
clear statement of goals and desired outcomes. In the absence of clearly articulated goals and a
desired outcome statement, the chances of failure increase.
“Getting To Outcomes” – Conference Edition – June 2000 20
!
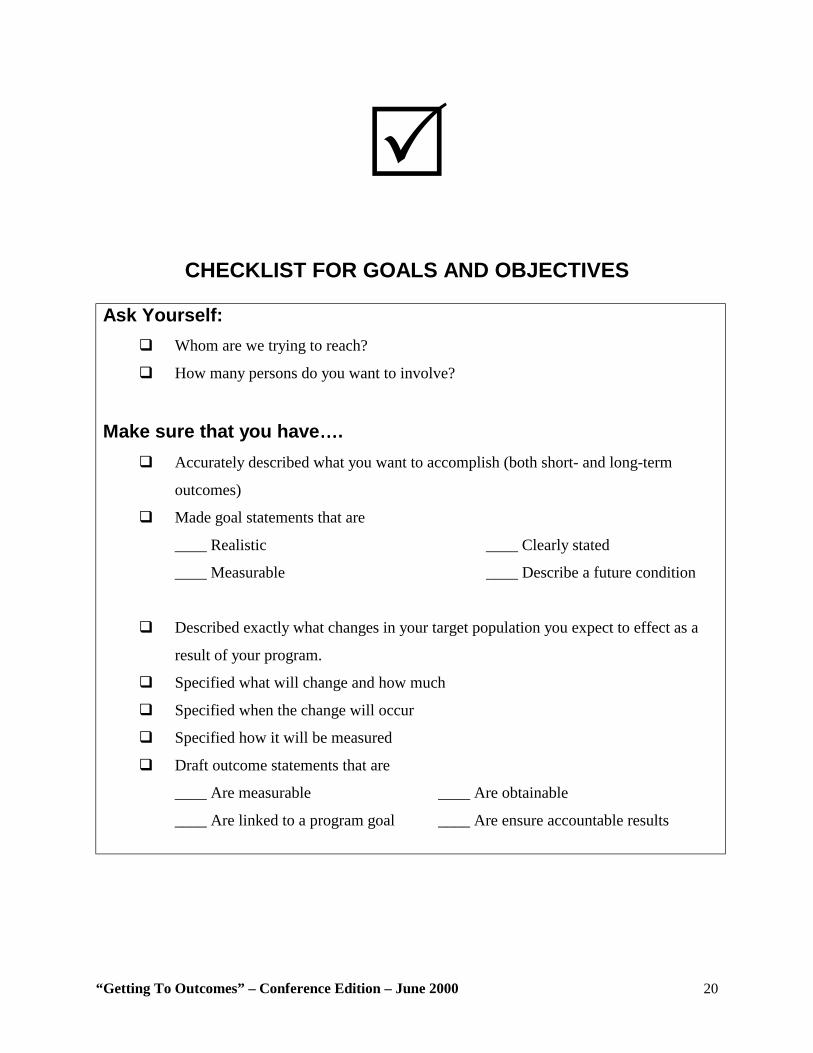
CHECKLIST FOR GOALS AND OBJECTIVES
Ask Yourself: #" Whom are we trying to reach?
#" How many persons do you want to involve?
Make sure that you have…………. #" Accurately described what you want to accomplish (both short- and long-term
outcomes)
#" Made goal statements that are
____ Realistic ____ Clearly stated
____ Measurable ____ Describe a future condition
#" Described exactly what changes in your target population you expect to effect as a
result of your program.
#" Specified what will change and how much
#" Specified when the change will occur
#" Specified how it will be measured
#" Draft outcome statements that are
____ Are measurable ____ Are obtainable
____ Are linked to a program goal ____ Are ensure accountable results
“Getting To Outcomes” – Conference Edition – June 2000 21
WINNERS Example Accountability Goals and Objectives: What are the goals, target population, and objectives (i.e., desired outcomes)? A. Specifying Goals
After identifying specific risk and protective factors in the community, the group of leaders
defined the specific goals they wanted to accomplish.
B. Identifying the Target Population The team debated who should receive the direct services of the proposed program. Some
emphasized that middle school students were exhibiting the most problems, and therefore
should be served directly. It finally was decided that since most of the problems developed
before entry into middle school, fifth-grade students should be targeted. The group wanted
to begin the program on a smaller scale first and then possibly expand if results were
positive. They decided to begin the program in a single elementary school, using one fifth
grade class as the program group and the other as a control group.
C. Identify the Objectives (i.e., Desired Outcomes) The leaders then specified the desired outcomes (behavioral changes) they hoped to
achieve in their target population. They identified specific and measurable outcomes that
were realistic. They utilized the risk and protective factor model to identify potential
intermediate outcomes of their program.
“Getting To Outcomes” – Conference Edition – June 2000 22
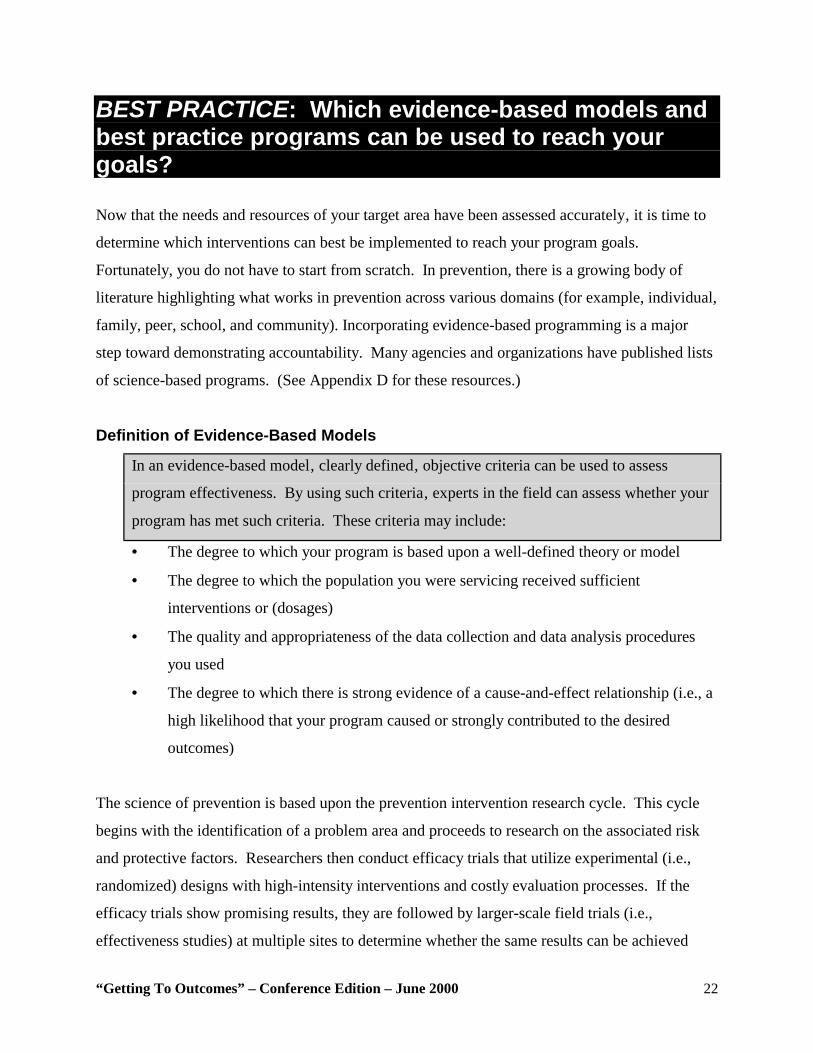
BEST PRACTICE: Which evidence-based models and best practice programs can be used to reach your goals?
Now that the needs and resources of your target area have been assessed accurately‚ it is time to
determine which interventions can best be implemented to reach your program goals.
Fortunately, you do not have to start from scratch. In prevention, there is a growing body of
literature highlighting what works in prevention across various domains (for example, individual,
family, peer, school, and community). Incorporating evidence-based programming is a major
step toward demonstrating accountability. Many agencies and organizations have published lists
of science-based programs. (See Appendix D for these resources.)
Definition of Evidence-Based Models
In an evidence-based model‚ clearly defined‚ objective criteria can be used to assess
program effectiveness. By using such criteria‚ experts in the field can assess whether your
program has met such criteria. These criteria may include:
• The degree to which your program is based upon a well-defined theory or model
• The degree to which the population you were servicing received sufficient
interventions or (dosages)
• The quality and appropriateness of the data collection and data analysis procedures
you used
• The degree to which there is strong evidence of a cause-and-effect relationship (i.e., a
high likelihood that your program caused or strongly contributed to the desired
outcomes)
The science of prevention is based upon the prevention intervention research cycle. This cycle
begins with the identification of a problem area and proceeds to research on the associated risk
and protective factors. Researchers then conduct efficacy trials that utilize experimental (i.e.,
randomized) designs with high-intensity interventions and costly evaluation processes. If the
efficacy trials show promising results, they are followed by larger-scale field trials (i.e.,
effectiveness studies) at multiple sites to determine whether the same results can be achieved
“Getting To Outcomes” – Conference Edition – June 2000 23
with a variety of populations in a number of locations over time. If the effectiveness trials are
successful, then more systematic attempts are made to transfer the information to the field.
For a variety of reasons‚ project staff today often face increasing demands to incorporate
evidence-based programs into their work. The move toward accountability in particular has
increased the importance of using proven programs. Interestingly‚ however, it frequently takes
as much time to plan and implement a program already shown to be effective as it does to plan
and implement a new‚ untested program.
Realities of Using Evidence-Based Programs There are a number of situations in which staff may be unable to implement an evidence-based
program. For example, a program may not exist for the selected target population and its
identified needs. Or, the cost of implementing a particular program may be too high. If
resources are not sufficient to purchase a pre-packaged, evidence-based program, adaptations can
and should be made.
Why is implementing evidence-based programs important? • To ensure that your intervention is based upon a successful model
• To ensure that you are spending resources on interventions that incorporate known
principles of effective programming
• To create funding opportunities (Increasingly, funders want to invest their limited dollars in
programs that are sure to make a difference.)
“Getting To Outcomes” – Conference Edition – June 2000 24
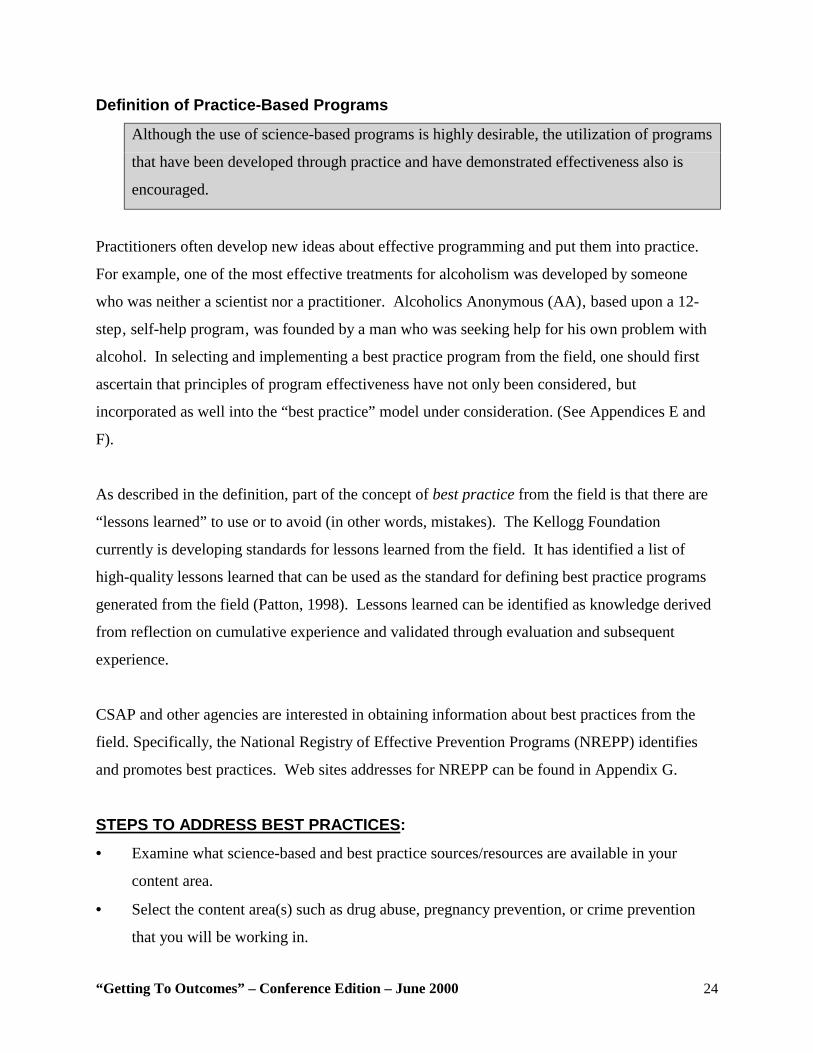
Definition of Practice-Based Programs
Although the use of science-based programs is highly desirable, the utilization of programs
that have been developed through practice and have demonstrated effectiveness also is
encouraged.
Practitioners often develop new ideas about effective programming and put them into practice.
For example, one of the most effective treatments for alcoholism was developed by someone
who was neither a scientist nor a practitioner. Alcoholics Anonymous (AA)‚ based upon a 12-
step‚ self-help program‚ was founded by a man who was seeking help for his own problem with
alcohol. In selecting and implementing a best practice program from the field, one should first
ascertain that principles of program effectiveness have not only been considered‚ but
incorporated as well into the “best practice” model under consideration. (See Appendices E and
F).
As described in the definition, part of the concept of best practice from the field is that there are
“lessons learned” to use or to avoid (in other words, mistakes). The Kellogg Foundation
currently is developing standards for lessons learned from the field. It has identified a list of
high-quality lessons learned that can be used as the standard for defining best practice programs
generated from the field (Patton, 1998). Lessons learned can be identified as knowledge derived
from reflection on cumulative experience and validated through evaluation and subsequent
experience.
CSAP and other agencies are interested in obtaining information about best practices from the
field. Specifically, the National Registry of Effective Prevention Programs (NREPP) identifies
and promotes best practices. Web sites addresses for NREPP can be found in Appendix G.
STEPS TO ADDRESS BEST PRACTICES: • Examine what science-based and best practice sources/resources are available in your
content area.
• Select the content area(s) such as drug abuse, pregnancy prevention, or crime prevention
that you will be working in.
“Getting To Outcomes” – Conference Edition – June 2000 25
• Collect information on evidence-based models or best practice programs in that area.
• Access resources such as libraries, particular literature, and Web sites (See Appendix G for
useful Web sites)‚ and/or talk to others who have implemented successful programs in your
content area(s).
• Determine how the characteristics of the evidence-based/best practice program fit with the
goals and objectives already identified in Accountability Question 2.
• Ensure that each program being considered for selection was evaluated according to
evidence-based or best practice standards.
• Ensure that each such program was shown to be effective for similar problem areas you
will address.
• Ensure that each such program was shown to be effective for similar target populations.
• Assess the cost of the program you are proposing and determine whether you have
sufficient resources to implement it.
• Ensure that it is culturally relevant to your target population.
• Select the program/intervention based upon the risk and protective factors of your target
population and your available resources. Whether you are developing or adapting a
science-based model or a best practice program from the field‚ always remember to apply
the principles of effectiveness.
“Getting To Outcomes” – Conference Edition – June 2000 26
WINNERS Example Accountability Best Practices: What evidence-based models and best practice programs can be useful in reaching the goals? Since members of the team had assessed their community's needs and resources, determined
their goals and desired outcomes, and selected a target population, they now needed to select a
program that would help them achieve those goals. They recognized that implementing along
with demonstrating a successful model program could help them succeed as well‚ accountability
to secure future fund. They selected a program committee to research successful existing
programs by searching the Internet, researching publications at the local university, and
contacting government agencies and requesting educational guides and manuals.
The program committee worked closely with the local substance abuse commission and obtained
some information on prevention and intervention, but few of the programs they reviewed
addressed the specific needs of their particular population of fifth-graders. Additional research
was directed toward finding a program designed to promote character development and improve
behavior. The committee found several programs that were tailored toward their population. Of
particular interest was a research-based classroom curriculum called, "Helping Build Character."
The committee chose this program because the curriculum was organized according to themes
that emphasized character values. The curriculum was enhanced to include values identified as
most important to community stakeholders (e.g., responsibility, trust, and integrity). The
committee concluded that a mentoring component should be part of the program since behavioral
practice and modeling are central to promoting changes in moral conduct. They determined that
a mentoring component would add the central and necessary element of providing role models to
children. The committee examined existing scientifically proven mentoring programs and
identified common components that could be modified and implemented in their schools. It then
formed its own mentoring program based on a combination of these best practice components
and called the program "WINNERS." The committee and the team that had formed it believed
that if the mentoring elements they sought were implemented according to best practice
principles, the program could help achieve their prevention goals.
“Getting To Outcomes” – Conference Edition – June 2000 27
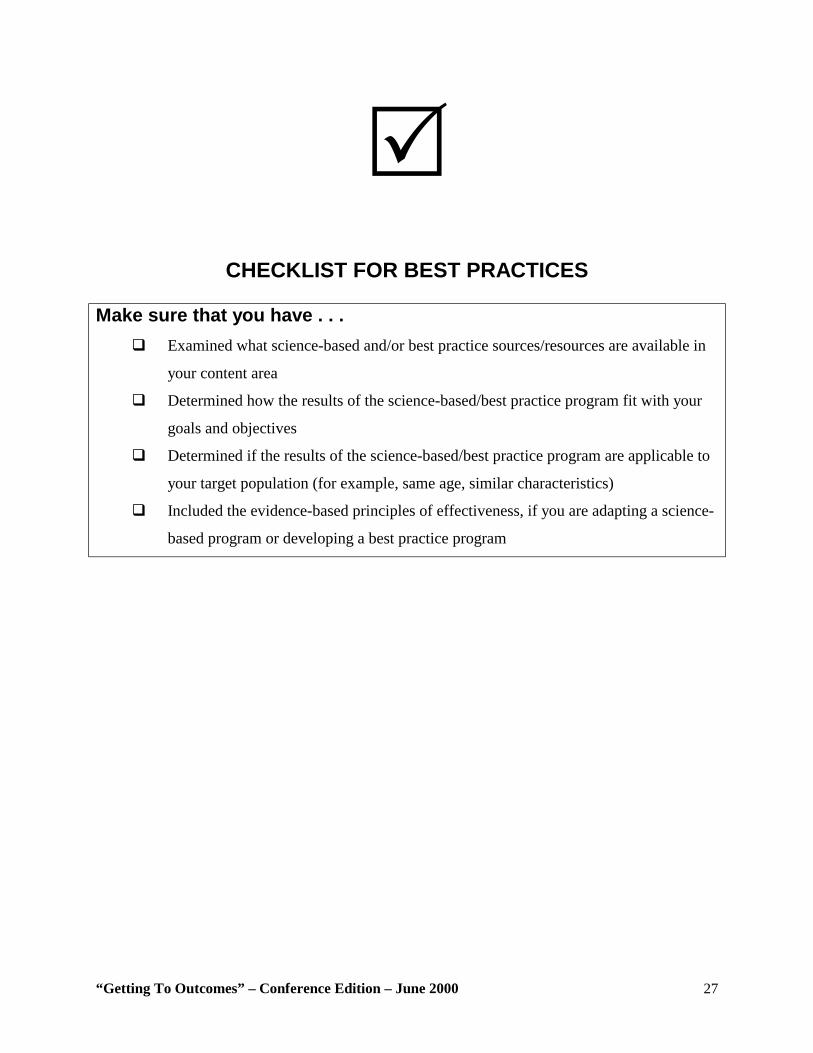
!
CHECKLIST FOR BEST PRACTICES Make sure that you have . . .
#" Examined what science-based and/or best practice sources/resources are available in
your content area
#" Determined how the results of the science-based/best practice program fit with your
goals and objectives
#" Determined if the results of the science-based/best practice program are applicable to
your target population (for example, same age, similar characteristics)
#" Included the evidence-based principles of effectiveness, if you are adapting a science-
based program or developing a best practice program
“Getting To Outcomes” – Conference Edition – June 2000 28
FIT: What actions need to be taken so that the selected program “fits” the community context?
Definition of Program Fit:
Program “fit” may be defined as the degree to which a selected science-based/best practice
program fits within the program and community context, and if it doesn’t fit well in critical
areas, what actions are needed to create a more suitable “fit.” Taking action to establish a
fit may include adaptations to the program model or selecting another program that is more
appropriate.
In this accountability approach, it is important to determine how the proposed program will fit
with:
• The community’s values and existing practices
• The characteristics of the agency’s or organization’s mission
• The culture and characteristics of the target population
• The community level of readiness for prevention/intervention
• The priorities of key stakeholders, including funders, policymakers, service providers,
community leaders, and program participants
• Other programs and services that already exist to serve the targeted population.
• The resources (human and fiscal) that are available to support implementation of the
program model
Examples of Inadequate “Fits”
• A communication-based program addressing alcohol and drug use developed for
urban African-American youth may not be a good fit for Hispanic youth from migrant
farm families or middle-income high school students.
• A family strengthening program effective for improving communication between
parents and their adolescents may not fit in a context that is seeking to strengthen
parenting skills among teenage mothers.
“Getting To Outcomes” – Conference Edition – June 2000 29
• An Alcoholics Anonymous-based alcohol abstinence program effective with Native-
American youth may not fit in a context that is seeking to reduce alcohol
consumption among urban African-American youth.
• A well-baby and home visit family support program staffed by social workers may
not fit in a context in which young mothers who have asked for home visits‚ yet are
suspicious of social workers‚ will not allow the social workers into their house for
fear that their babies will be removed.
• An alcohol abuse support group for seniors should not be offered in the evening
because it may be unlikely they will travel at night.
When a new program is to be implemented at a school or community center, the primary
consideration is to make sure it has the potential of enhancing existing programs‚ rather than
detracting from or interfering with it. For example, distributing condoms would obviously
interfere with an abstinence-based curriculum. In this accountability question, it is not necessary
to obtain information from every community source available; however, there is a need to assess
what is happening within your particular location among the population you wish to serve.
In summary, by viewing of the characteristics of existing programs and targeted populations‚ you
should be able to ensure that the program you have proposed does not result in duplicating
services and allows for collaboration with other area programs and service providers.
Why is Assessing Fit Important? • To ensure that the program is consistent with the agency’s or organization’s mission
• To ensure complementary goals among several programs
• To ensure that excessive duplication of effort does not occur
• To ensure that the community will support the program and can benefit from it
• To ensure that adequate resources exist to implement the program properly
• To ensure sufficient participant involvement in the program
• To improve the likelihood of the program’s success
“Getting To Outcomes” – Conference Edition – June 2000 30
STEPS TO ADDRESS FIT: • Consider how your proposed program “fits” with local programs already offered to
the population you intend to serve.
Look at existing programming: • Review current programming being offered to the population you wish to serve.
• If similar programs exist for this population, determine how your program will differ.
Will it meet certain needs of the target population that are not met by the existing
program? Or, will it serve people not served by the existing program due to caseload,
space, or budget constraints? Together with other program providers, make sure that
the new program strengthens or enhances what already exists in your area for your
target population.
• Does the new program enhance, detract, or provide an opportunity for a new
collaboration?
Look at agency culture:
• Consider the philosophy and values of your service agency and whether the proposed
program is compatible with them (e.g., a controlled drinking program may not fit well
with an agency that endorses total abstinence).
• Examine the values and underlying philosophies of your agency and its key
stakeholders‚ such as board members, funders, and volunteers.
• Examine the key prevention/intervention practices of the selected program and
determine whether they are consistent with the agency’s core values.
• Determine what modifications/adaptations are needed for the proposed program to
“fit” with the core values of the agency.
Look at community characteristics: • Consider the cultural context and “readiness” of the community and the targeted
population for the proposed prevention/intervention program.
• Consider the community’s values and traditions—especially those that affect how its
citizens and the targeted group regard health promotion issues.
• Determine what the community considers appropriate ways to communicate and
provide helping services.
“Getting To Outcomes” – Conference Edition – June 2000 31
• Consider the extent to which the community is ready for prevention/intervention.
How aware are community members of the issue/problem? Are they willing to
accept help or interventions that will require substantive changes in behavior‚
attitudes‚ and knowledge?
• Determine whether the proposed program is appropriate‚ given these cultural context
and community readiness issues.
• Determine what modifications/adaptations are needed to help the selected program
more appropriately fit into the cultural and community readiness context.
Look at cost: • Consider the cost and feasibility of these proposed adaptations/modifications.
• Consider the resources available, including staff, facilities, marketing resources.
Look at partners:
“Getting To Outcomes” – Conference Edition – June 2000 32
WINNERS Example Accountability FIT: How does this program fit with other programs already offered?
After selecting the program, it became necessary for the team to determine whether there were
already existing programs in the school or community that addressed the same or similar issues
in the identified target population. A review of school curricula revealed that there were no other
school-based programs that directly addressed character development and behavioral
improvement.
Contact with the local Boys and Girls Clubs‚ along with the Brownies and Cub Scouts
organizations‚ suggested that, although they included some children of the target population’s
age, these groups did not provide programming that overlapped with the proposed character
development and mentoring plan. However‚ it was determined that the program's goals were
compatible with the philosophy and principles of the school and the community's educational
system.
“Getting To Outcomes” – Conference Edition – June 2000 33
!
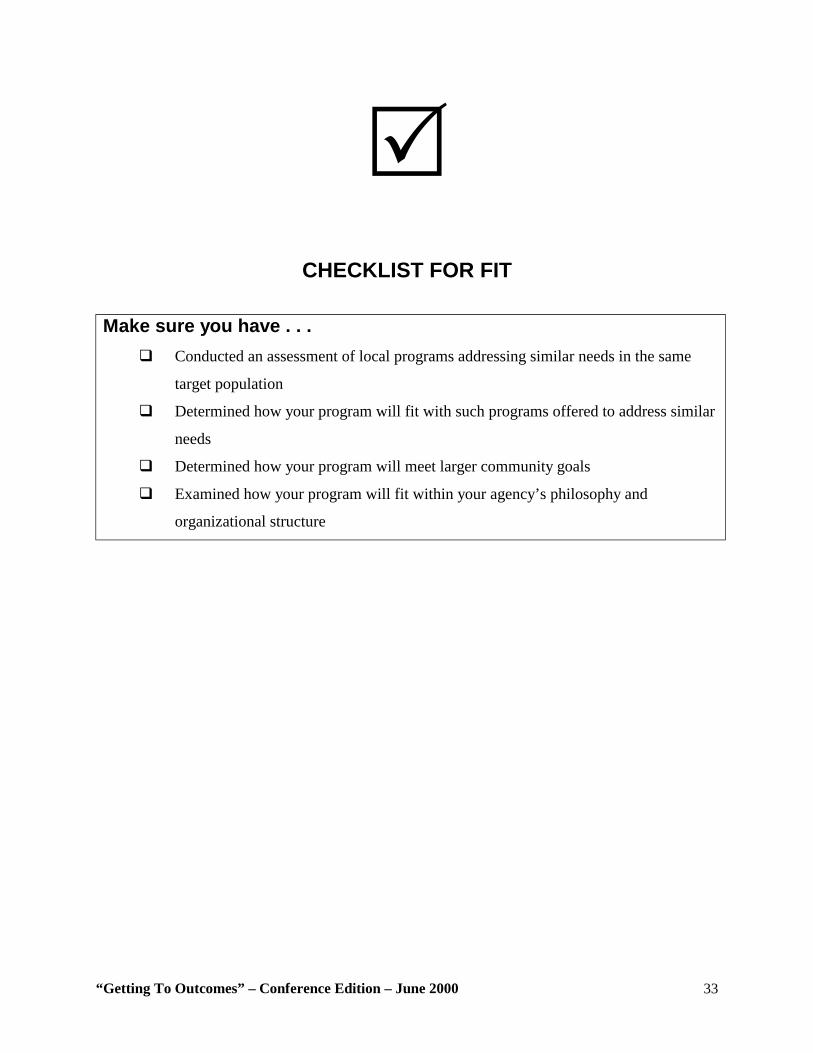
CHECKLIST FOR FIT Make sure you have . . .
#" Conducted an assessment of local programs addressing similar needs in the same
target population
#" Determined how your program will fit with such programs offered to address similar
needs
#" Determined how your program will meet larger community goals
#" Examined how your program will fit within your agency’s philosophy and
organizational structure
“Getting To Outcomes” – Conference Edition – June 2000 34
CAPACITIES: WHAT ORGANIZATIONAL CAPACITIES ARE NEEDED TO IMPLEMENT THE PREVENTION PROGRAM? Definition of organizational capacity:
Organizational capacity consists of the resources the organization possesses to direct and
sustain the prevention program.
At this point in the Getting to Outcomes process, you have identified needs and resources,
clarified goals, selected a program. Most likely‚ you already have considered some issues
regarding organizational capacities. However‚ now it is the time to consider systematically
whether everything is in place to implement your program.
Human Skills and Capabilities Naturally‚ the skills and capabilities of your staff will be critical to your program’s failure or
success. Are sufficient numbers of staff available with the talents and skills necessary to
implement your program? Commitment and leadership at the highest levels of your organization
also will be necessary. In assessing organizational capacity‚ consider:
• Staff credentials and experience. Your program may require personnel who can
facilitate interagency collaborations, provide leadership in a school, or mobilize
groups (such as parents or media) for specific tasks. Examine what job skills the
selected program requires and ensure that you have staff on board who have the
needed skills.
• Staff training. Staff may need to be trained to implement the program. In addition,
others may need training for new roles to ensure that the program runs smoothly. For
example, one school trained school administrators to act as substitute teachers so
classes would be covered when program staff members were away at a training
session.
• Commitment to the program on the part of staff leadership is critical. Many times,
organizations that receive funding are not truly ready to implement a science-based
program. This can be a challenge. Without such a commitment, it is impossible to
“Getting To Outcomes” – Conference Edition – June 2000 35
guarantee that all pieces will be in place to implement the program and promote
effective communication, decision-making, and conflict resolution. Indications that
an organization is committed to the program include high-level promises of support
(e.g., space, funding), along with a clear understanding of the program and a concern
about evaluation results on the part of organizational leadership.
Technical Capacities Several kinds of technical resources are required to implement a program well. In general, a
variety of supplies, telephones, faxes, and computers are necessary. Access to databases and the
Internet is also highly desirable.
Funding Capacities Adequate funding is needed to ensure successful implementation of a prevention program. Many
practitioners have become quite creative in developing ways to obtain new monetary resources
for their programs. Still‚ funders are becoming increasingly aware that effective prevention
programs require sustained effort over long periods of time. In some instances‚ they may be
forced to cut or drastically reduce funding. This may require you to reorganize your program,
share resources, or obtain funds from other sources. If your program is being planned and
implemented according to the Getting to Outcomes model, you should have clear evidence that
critical effective programming elements are in place and a high probability of program success
exists. This should be helpful in negotiating with your funder when you are informed your
program monies may be cut.
“Getting To Outcomes” – Conference Edition – June 2000 36
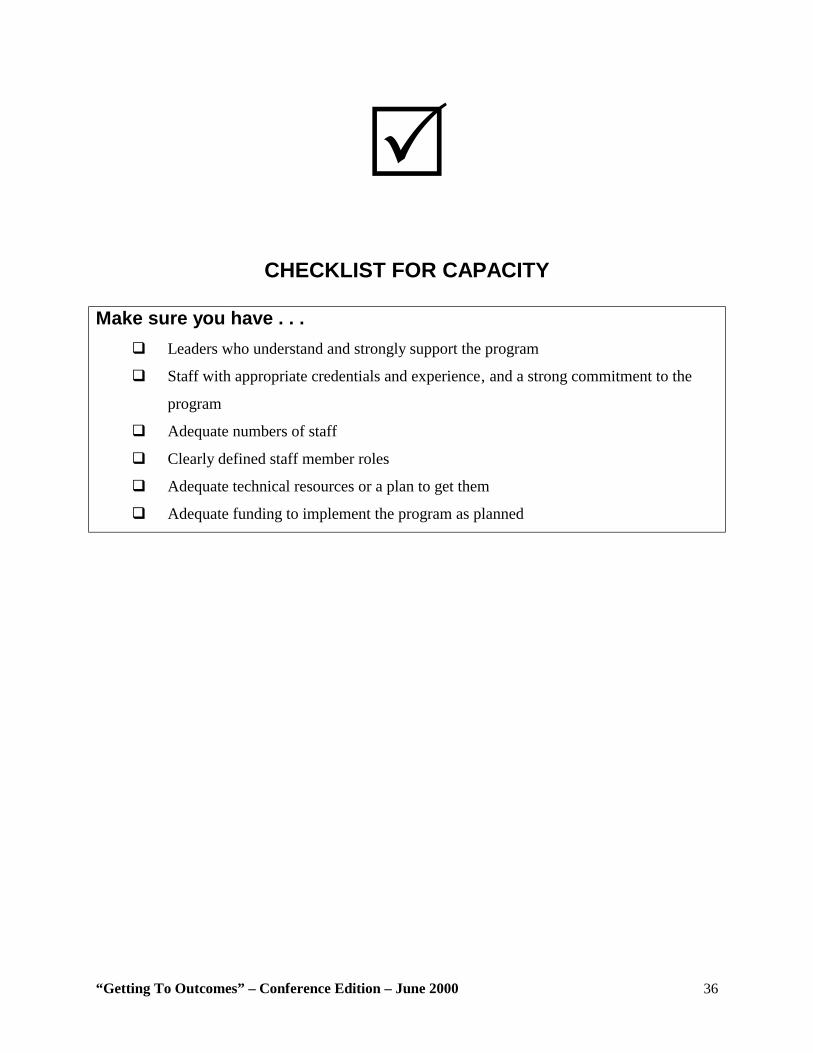
!
CHECKLIST FOR CAPACITY Make sure you have . . .
#" Leaders who understand and strongly support the program
#" Staff with appropriate credentials and experience‚ and a strong commitment to the
program
#" Adequate numbers of staff
#" Clearly defined staff member roles
#" Adequate technical resources or a plan to get them
#" Adequate funding to implement the program as planned
“Getting To Outcomes” – Conference Edition – June 2000 37
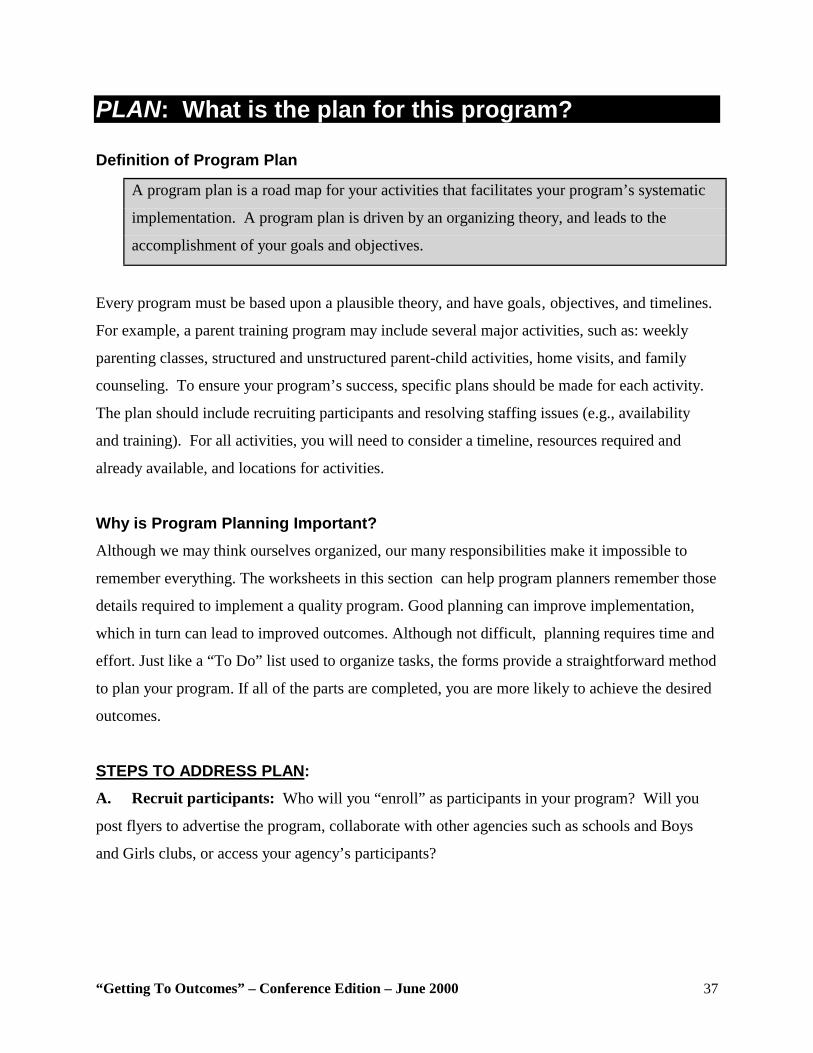
PLAN: What is the plan for this program?
Definition of Program Plan
A program plan is a road map for your activities that facilitates your program’s systematic
implementation. A program plan is driven by an organizing theory, and leads to the
accomplishment of your goals and objectives.
Every program must be based upon a plausible theory, and have goals‚ objectives, and timelines.
For example, a parent training program may include several major activities, such as: weekly
parenting classes, structured and unstructured parent-child activities, home visits, and family
counseling. To ensure your program’s success, specific plans should be made for each activity.
The plan should include recruiting participants and resolving staffing issues (e.g., availability
and training). For all activities, you will need to consider a timeline, resources required and
already available, and locations for activities.
Why is Program Planning Important? Although we may think ourselves organized, our many responsibilities make it impossible to
remember everything. The worksheets in this section can help program planners remember those
details required to implement a quality program. Good planning can improve implementation,
which in turn can lead to improved outcomes. Although not difficult, planning requires time and
effort. Just like a “To Do” list used to organize tasks, the forms provide a straightforward method
to plan your program. If all of the parts are completed, you are more likely to achieve the desired
outcomes.
STEPS TO ADDRESS PLAN: A. Recruit participants: Who will you “enroll” as participants in your program? Will you
post flyers to advertise the program, collaborate with other agencies such as schools and Boys
and Girls clubs, or access your agency’s participants?
“Getting To Outcomes” – Conference Edition – June 2000 38
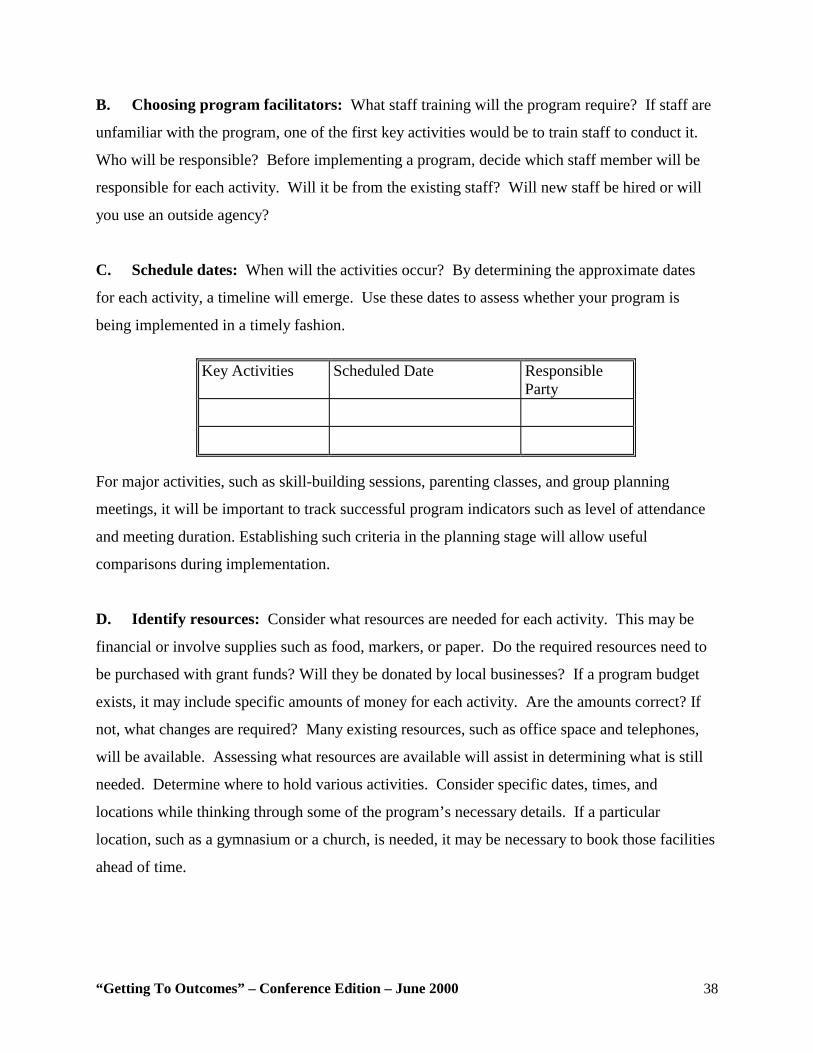
B. Choosing program facilitators: What staff training will the program require? If staff are
unfamiliar with the program, one of the first key activities would be to train staff to conduct it.
Who will be responsible? Before implementing a program, decide which staff member will be
responsible for each activity. Will it be from the existing staff? Will new staff be hired or will
you use an outside agency?
C. Schedule dates: When will the activities occur? By determining the approximate dates
for each activity, a timeline will emerge. Use these dates to assess whether your program is
being implemented in a timely fashion.
Key Activities Scheduled Date Responsible Party
For major activities, such as skill-building sessions, parenting classes, and group planning
meetings, it will be important to track successful program indicators such as level of attendance
and meeting duration. Establishing such criteria in the planning stage will allow useful
comparisons during implementation.
D. Identify resources: Consider what resources are needed for each activity. This may be
financial or involve supplies such as food, markers, or paper. Do the required resources need to
be purchased with grant funds? Will they be donated by local businesses? If a program budget
exists, it may include specific amounts of money for each activity. Are the amounts correct? If
not, what changes are required? Many existing resources, such as office space and telephones,
will be available. Assessing what resources are available will assist in determining what is still
needed. Determine where to hold various activities. Consider specific dates, times, and
locations while thinking through some of the program’s necessary details. If a particular
location, such as a gymnasium or a church, is needed, it may be necessary to book those facilities
ahead of time.
“Getting To Outcomes” – Conference Edition – June 2000 39
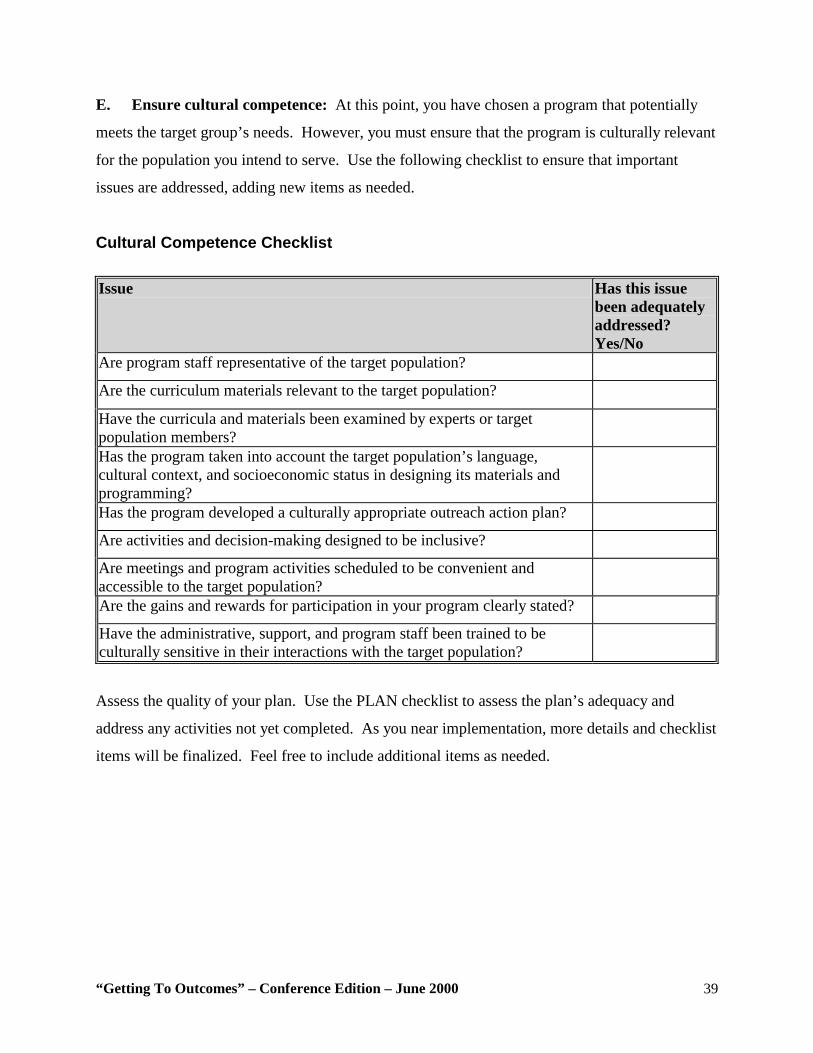
E. Ensure cultural competence: At this point, you have chosen a program that potentially
meets the target group’s needs. However, you must ensure that the program is culturally relevant
for the population you intend to serve. Use the following checklist to ensure that important
issues are addressed, adding new items as needed.
Cultural Competence Checklist Issue Has this issue
been adequately addressed? Yes/No
Are program staff representative of the target population?
Are the curriculum materials relevant to the target population?
Have the curricula and materials been examined by experts or target population members?
Has the program taken into account the target population’s language, cultural context, and socioeconomic status in designing its materials and programming?
Has the program developed a culturally appropriate outreach action plan?
Are activities and decision-making designed to be inclusive?
Are meetings and program activities scheduled to be convenient and accessible to the target population?
Are the gains and rewards for participation in your program clearly stated?
Have the administrative, support, and program staff been trained to be culturally sensitive in their interactions with the target population?
Assess the quality of your plan. Use the PLAN checklist to assess the plan’s adequacy and
address any activities not yet completed. As you near implementation, more details and checklist
items will be finalized. Feel free to include additional items as needed.
“Getting To Outcomes” – Conference Edition – June 2000 40
!
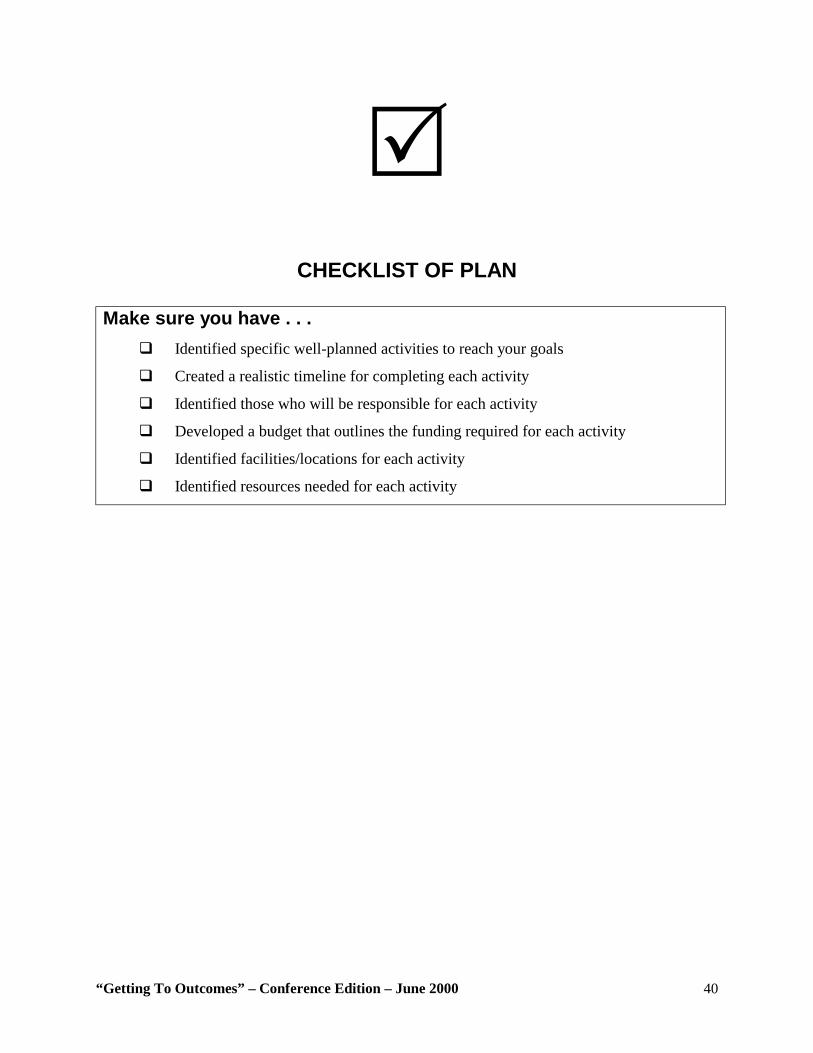
CHECKLIST OF PLAN Make sure you have . . .
#" Identified specific well-planned activities to reach your goals
#" Created a realistic timeline for completing each activity
#" Identified those who will be responsible for each activity
#" Developed a budget that outlines the funding required for each activity
#" Identified facilities/locations for each activity
#" Identified resources needed for each activity
“Getting To Outcomes” – Conference Edition – June 2000 41
PROCESS EVALUATION: Is the program being implemented with fidelity to the plan? Definition of Process Evaluation:
Process evaluation measures program fidelity by assessing which activities were
implemented, and the quality‚ strengths‚ and weaknesses of the implementation.
Program fidelity refers to how closely your program’s implementation follows its creators’
intentions. Program fidelity is critical to obtaining desired outcomes.
If the program does not produce positive outcomes even when the process evaluation indicates
implementation fidelity, the rationale or theory may not have been sound. A well-planned
process evaluation is developed prior to beginning a program and continues throughout the
program’s duration.
Why is a Process Evaluation Important? A process evaluation can:
• Produce useful feedback for program refinement
• Provide feedback to a funder on how resources were expended
• Determine program activities’ success rates
• Document successful processes so they can be repeated in the future
• Demonstrate program activity to the media or community even before outcomes have
been attained
STEPS FOR ADDRESSING PROCESS EVALUATION: Getting to Outcomes divides process evaluation into three main steps: The planning process,
program implementation, and post-program implementation. Sample worksheets are provided
for each.
“Getting To Outcomes” – Conference Edition – June 2000 42
Planning Process Evaluation One of the best ways to evaluate the planning process is to assess what occurs in the planning
meetings. Specifically, the number of meetings, the quality of the meetings, attendance rates,
discussion topics, materials used, and decisions made at meetings should be monitored.
Meeting Questionnaire (Appendix H) Track attendance by recording the names of both committee members who regularly attend
meetings and those who do not. If committee meetings are poorly attended or some individuals
only attend sporadically, this might prevent an effective planning process. Consistent attendance
from a core group of people is necessary to ensure continuity from one meeting to the next. On
the other hand‚ if the meetings require only a small number of staff members, formally tracking
their attendance may be less important.
Meeting Effectiveness Inventory (Appendix I) Another method for assessing the planning process is to complete the Meeting Effectiveness
Inventory (Appendix I) after every meeting. This form assesses (using a 1 [low]to 5 [high]scale)
the clarity of goals discussed, attendees’ participation level, quality of leadership and
decisionmaking, group cohesiveness, problem solving effectiveness, and general productivity
level at each meeting. This form can be modified to include other variables that you and your
organization are interested in measuring.
Designate someone to complete the Meeting Effectiveness Inventory after every planning
meeting. The results can be tracked over time (see “Calculating Averages” in Chapter 8), and the
resulting information shared with committee members to help improve the planning process. For
example, if after several meetings the clarity of goal assessment is found to be consistently low,
the committee may want to discuss how to clarify meeting goals.
Implementation Form (Appendix J) Part 1 of the form addresses pre-implementation issues such as activities, dates, duration, and
staffing. Part 2 of the form specifies the activity implemented, the date, number of people in
“Getting To Outcomes” – Conference Edition – June 2000 43
attendance, activity length, and materials actually used or provided. Part 2 also contains two
columns for calculating meeting attendance and duration percentages.
To calculate the percentage of attendance goal: Actual attendance/planned attendance
To calculate the percentage of duration goal: Actual duration/planned duration
Part 3 of the form has columns for recording funding and resource levels, and for timeliness of
actions. Specifically, complete the items, “Were available funds adequate to complete the
activity?” (Less than adequate/Adequate/More than adequate) and “Were the activities
implemented on schedule?” (Behind schedule/On schedule/Ahead of schedule).
Part 4 provides the following open-ended questions:
• What was not implemented that was planned? Why?
• What was implemented that was not planned? Why?
• Who was missing? What led to their absence?
• Who attended who had not been expected?
Program Implementation Evaluation During Program Implementation If you are not achieving the results you desire, completing the implementation form could
demonstrate why. It is critical to use this information to make any necessary “mid-course
corrections.” Instead of waiting until the end of the program to make changes, you should make
improvements while the program is still active.
Example: If only two of 15 registrants for a 10-session smoking cessation program attend the first two
sessions, the program outcomes obvously cannot be achieved. However‚ by contacting those
registrants who missed the initial sessions, you may find that the meeting time was inconvenient
or that they were ambivalent about attending. By adjusting the meeting time or by reinforcing
the enrolees’ decision to stop smoking‚ you can potentially boost participation in the program.
“Getting To Outcomes” – Conference Edition – June 2000 44
POST-PROGRAM IMPLEMENTATION
The Implementation Form provides a great deal of information on ways to better implement the
program. Review this information to answer such questions as: What would I repeat? What
would I do differently? Did I get adequate attendance? Was the location adequate? How was
the timeline?
Program Satisfaction Measures (Appendices K and L) Participant satisfaction surveys and staff “lessons learned” assessments also can be useful. A
satisfaction survey is a quick way to gather participant feedback on a recently concluded
program. Make sure participants have sufficient time to complete the survey at the program’s
conclusion. It is best incorporate the satisfaction survey into the program, perhaps as an agenda
item.
Project Insight Form (Appendix M) This form can be used to track lessons learned. It allows program staff to evaluate which factors
were barriers to program implementation (e.g.‚ poor attendance‚ inadequate facilities) and which
factors facilitated program implementation (e.g.‚ well-trained staff, adequate transportation).
Staff and committee chairpersons should complete this form after each meeting. Over time, this
information can prove invaluable in determining whether or not the identified barriers were
addressed adequately.
“Getting To Outcomes” – Conference Edition – June 2000 45
OUTCOMES: How well is the program working?
Definition of Outcomes:
Outcome measures determine the extent to which your program has accomplished its goals.
Outcome evaluation helps answer important questions, such as:
• Did the program work? Why? Why not?
• Should we continue the program?
• What can be modified to make the program more effective?
• What evidence proves that funders should continue to spend their money on this
program?
What should be measured? Outcomes are changes that occur as a result of your program. In alcohol, tobacco, and other drug
prevention programs, the desired outcomes often include changes in:
• Knowledge: What people learn about a subject (e.g., the short- and long-term health
risks of smoking)
• Attitudes: How people feel toward a subject (e.g., smoking is dangerous to their health)
• Skills: How peoples’ skills and abilities affect a problem by themselves (e.g., a variety
of ways to say “no” to smoking and awareness of smoking cessation classes)
• Behaviors: How people actually change their way of doing things (e.g., a measurable
decrease in participants who smoke).
Sample outcomes pertaining to a community-wide intervention might include changes in:
• The level of community awareness and mobilization
• Local policies and laws to control drinking and drug use (for example, DUI laws)
• The level of cooperation and collaboration among community agencies
“Getting To Outcomes” – Conference Edition – June 2000 46
Strong programs affect changes in behavior Knowledge of the harmful effects of ATOD a “non-use” attitude, and good refusal skills,
although often correlated with non-use behavior, do not always lead to desired non-use
outcomes. Nevertheless‚ such “intermediate” outcomes are important in bringing about
behavioral changes. The best and most desired outcomes in ATOD programs of course are those
behavioral reductions (or even changes) that lead to a cessation of use.
Often, those who conduct prevention programs assess outputs (such as number of youth in
attendance or number of classes taught) rather than outcomes. They may conduct satisfaction
surveys that measure how pleased participants were with how the program was implemented.
Unfortunately‚ obtaining such responses does not necessarily mean that your program was
successful in changing behavior. Resources such as Measurement in Prevention (Kumpfer,
Shur, Ross, Bunnell, Librett, and Millward, 1993) and Prevention Plus III (Linney and
Wandersman, 1991) offer good places to start for finding surveys that can be useful in measuring
the substantive outcomes you are striving to achieve.
The following steps are suggested for evaluation: • Decide what you want to assess.
• Select an evaluation design to fit your program.
• Choose methods of measurement.
• Decide whom you will assess.
• Determine when you will conduct the assessment.
• Gather the data.
• Analyze the data.
• Interpret the data. This chapter is not meant to be a comprehensive listing of evaluation methodologies, but rather
an overview of commonly used designs and methods.
“Getting To Outcomes” – Conference Edition – June 2000 47
STEPS TO ADDRESS OUTCOMES: Decide What You Want To Assess Create realistic outcomes
Keep your focus on what the program realistically can accomplish. You should not assess youth
tobacco use in the whole state if you are implementing a new anti-smoking campaign in just one
school district.
Be specific
Translate your program’s goals (such as perceiving smoking risk) into something specific and
measurable (e.g., scores on questions designed to measure risk perception in the Monitoring the
Future Survey). Such indicators will be related to the specific characteristics of your desired
outcome (see Appendix N).
Be measurable
It is usually better to have more than one desired outcome, since not all outcomes can be
adequately expressed in just one way. For example, a self-report survey is one important way to
test marijuana use. But self-report data can be biased, so measuring the level of THC use in the
target population provides a more complete picture. Each type of measurement or data source
can result in a somewhat different conclusion. When different data sources (e.g., statistics
collected by the public health department, program surveys, literature reviews) all agree, you
obviously can have more confidence in the individual conclusions. Once you choose how you
will measure your desired outcomes, deciding on a program design and creating data collection
methods will become much easier. Look at the evidence-based literature to see how others have
assessed programs similar to yours.
Select an evaluation design to fit your program When conducting a program, any desired behavioral changes in the population should be
assessed to discover the extent to which your program actually caused them. (Many other factors
unrelated to your program may impact your issue.) Naturally‚ the strength of your evaluation
design will boost your confidence that the program caused the change. Appendix O provides a
detailed description of the commonly used evaluation designs. Since selecting an evaluation
“Getting To Outcomes” – Conference Edition – June 2000 48
design is critical—yet can be difficult—you may wish to consult a local expert on evaluation
designs.
When deciding which evaluation method you will use, you have to balance costs, level of
expertise to which you have access, ethical considerations, and funder requirements against how
much confidence the evaluation design will give you. Using a post-only evaluation model is the
least effective way to measure program outcomes, but it is preferable to not doing any outcome
assessment at all. By contrast‚ administering pre-post questionnaire to a target group can
provide a quick assessment of attitudinal or behavioral changes in your target group. As pre-post
design in a target and in a comparison group provides the most confidence that your program
was responsible for the outcome changes, but it also is the most difficult to implement. A pre-
post evaluation with a control group also costs the most and it raises ethical issues about giving
some people a program while withholding it from others at random. In sum‚ we believe you
should strive to do the pre-post design. If you can get a comparison group, all the better! Choosing methods for measurement (such as surveys and focus groups) Once you choose your evaluation design, you will need to decide how to collect the data.
Appendix Q, “Data Collection Methods at a Glance,” highlights the strengths and weaknesses of
various data collection methods. These include both quantitative and qualitative methods.
Quantitative methods answer who, what, where, and how much They target larger numbers of people and are more structured and standardized (meaning that the
same procedure is used with each person) than qualitative methods.
Qualitative methods answer why and how and usually involve talking to or observing people In qualitative methods, the challenge is to organize the thoughts and beliefs of participants into
themes. Qualitative evaluations usually involve fewer people than quantitative methods.
Survey Tips: • Give clear instructions.
• Provide examples for each requested item of information.
“Getting To Outcomes” – Conference Edition – June 2000 49
• Pre-test your survey with several people who are similar to your population. Check to
see if those taking the sample survey answered the questions as you had expected.
Ask them to provide feedback on the level of difficulty in understanding the survey
instructions and questions. Check to see how long it took them to complete it.
• Prepare a script for an interviewer to use when conducting a telephone survey or face-
to-face interview.
Surveys (paper and pencil, telephone, and structured interviews) • It is possible to use existing evaluation methods for your program if you are using or
adapting a science-based program or relying upon best practice literature.
• Use such tools whenever possible, because many of their problems already will have
been worked out by other practitioners.
• Use your best practice research to lead you to evaluation methods that have been
used by similar programs‚ if none are provided by the program you have selected.
Survey Questions Should Be As short as possible (under 25 words) Also‚ stay neutral. And be careful to avoid such loaded questions as, “The goal of the program
was to reduce substance abuse in high school seniors. How well did the program accomplish
this? “Stay focused on one subject. Questions with two or more major topics should be avoided;
e.g.‚ “As a mentee, how satisfied were you with your mentor and the group meetings?”
Determine exactly whom you plan to assess Naturally, selecting your evaluation design and methodology requires you to decide whom you
will assess. For example‚ if you are conducting a prevention program with 50 eighth graders and
have a comparison group of 50 similar eighth graders who do not participate, then it is clear you
will assess a total of 100 students—everyone in each group. If on the other hand‚ your program
is a community-wide media campaign, you cannot assess everyone in the community. You will
need to measure a sample of the overall population.
“Getting To Outcomes” – Conference Edition – June 2000 50
The larger and more representative of the overall population your sample is, the more confidence
you can have in stating that the survey results apply to the overall population. For example, a
representative sample of fourth graders exposed to a community-wide anti-drug media campaign
might include:
• Some fourth graders from each elementary school.
• An equal numbers of boys and girls.
• An accurate reflection of the community’s ethnic/racial makeup. If the community is
50 percent White, 35 percent African-American, and 15 percent Hispanic, for
example‚ you should strive to sample a group that also is 50 percent White, 35
percent African-American, and 15 percent Hispanic.
Determine when you will conduct the assessment The timing of your measurements is important and will result from your evaluation design. If
your design is a pre-post, you will need to conduct your measurement before your group begins
the program, as well as after they complete it. Your measurement of change at the program’s
conclusion represents an “intermediate outcome‚” which will show if the program performed as
claimed. If you happen to have enough resources and are able to contact participants, perhaps
six months after the program has been completed, you can survey them a third time to assess
whether the program’s benefits (if any) continue.
Intermediate outcomes typically address changes in the risk and protective factors associated
with behaviors‚ such as attitudes about drug use. The behaviors themselves (e.g., a reduction in
drug use) are the longer-term changes you ultimately seek. It may be unrealistic to believe that
participation in a single program will affect a participant’s long-term ATD use. However, many
programs that target related risk and protective factors will have a better chance at reducing
ATOD use. Typically, archival data (such as large community or State-wide surveys) are used to
track these behaviors over longer periods (usually every six months or annually).
“Getting To Outcomes” – Conference Edition – June 2000 51
Gather the Data First, you need to decide who will collect the data, regardless of the method used. The person
you choose may affect the results. Will participants feel comfortable with this person? Will they
provide honest information or will they try to look good? Can the person gathering the data be
as objective as the task requires? Some of the important issues that can arise in data collection
are described below.
• Consent. Potential evaluation respondents must have the opportunity to either
consent to or decline participation. This can be accomplished through a written
consent. The participant or a legal guardian signs a consent form, giving “active
consent,” and agreeing to take part in the evaluation. However, the evaluation models
described in this manual frequently utilize “passive consent,” which gives the
potential participant the opportunity to verbally decline participation. In either case,
potential participants must be informed about the evaluation’s purpose, told that their
answers will be kept confidential (and possibly anonymous), and given the
opportunity to decline participation at any time, with no negative consequences.
• Confidentiality. You must guarantee that the participants’ responses will not be
shared with anyone except the evaluation team, unless the information shows that a
participant has an imminent intent to harm him or herself or others (a legal statute that
varies from state to state). Confidentiality is honored to ensure more accurate
information and to protect the privacy of the participants. Common safeguards
include locking the data in a secure place and limiting access to a select group, using
code numbers rather than names in computer files, and never connecting data
collected from one any person to her or his name in written report (you should only
report grouped data, such as frequencies or averages).
• Anonymity. Whenever possible, data should be collected in a manner that allows
participants to remain anonymous. Again, this will ensure more accurate information
while protecting the privacy of the participants. However, if you are measuring
participants’ change over time (by using pre-post, pre-post with comparison, or pre-
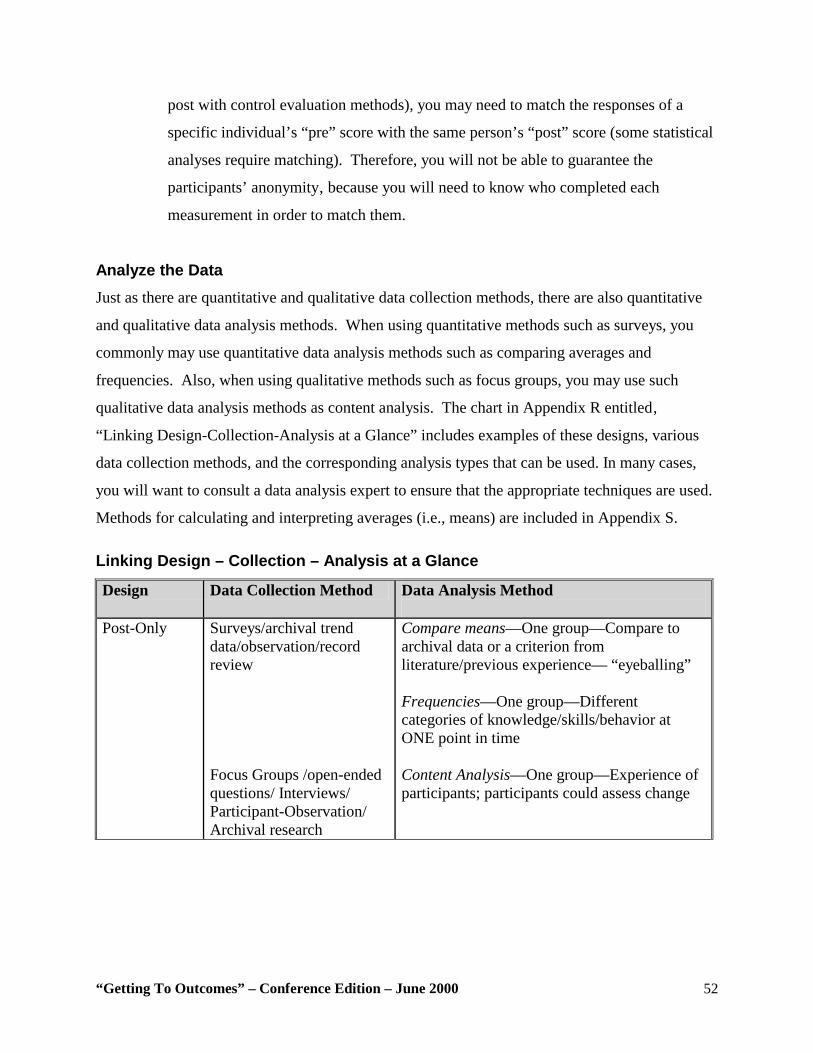
“Getting To Outcomes” – Conference Edition – June 2000 52
post with control evaluation methods), you may need to match the responses of a
specific individual’s “pre” score with the same person’s “post” score (some statistical
analyses require matching). Therefore, you will not be able to guarantee the
participants’ anonymity‚ because you will need to know who completed each
measurement in order to match them.
Analyze the Data Just as there are quantitative and qualitative data collection methods, there are also quantitative
and qualitative data analysis methods. When using quantitative methods such as surveys, you
commonly may use quantitative data analysis methods such as comparing averages and
frequencies. Also, when using qualitative methods such as focus groups, you may use such
qualitative data analysis methods as content analysis. The chart in Appendix R entitled‚
“Linking Design-Collection-Analysis at a Glance” includes examples of these designs, various
data collection methods, and the corresponding analysis types that can be used. In many cases,
you will want to consult a data analysis expert to ensure that the appropriate techniques are used.
Methods for calculating and interpreting averages (i.e., means) are included in Appendix S. Linking Design – Collection – Analysis at a Glance
Design Data Collection Method Data Analysis Method
Post-Only
Surveys/archival trend data/observation/record review Focus Groups /open-ended questions/ Interviews/ Participant-Observation/ Archival research
Compare means—One group—Compare to archival data or a criterion from literature/previous experience— “eyeballing” Frequencies—One group—Different categories of knowledge/skills/behavior at ONE point in time Content Analysis—One group—Experience of participants; participants could assess change
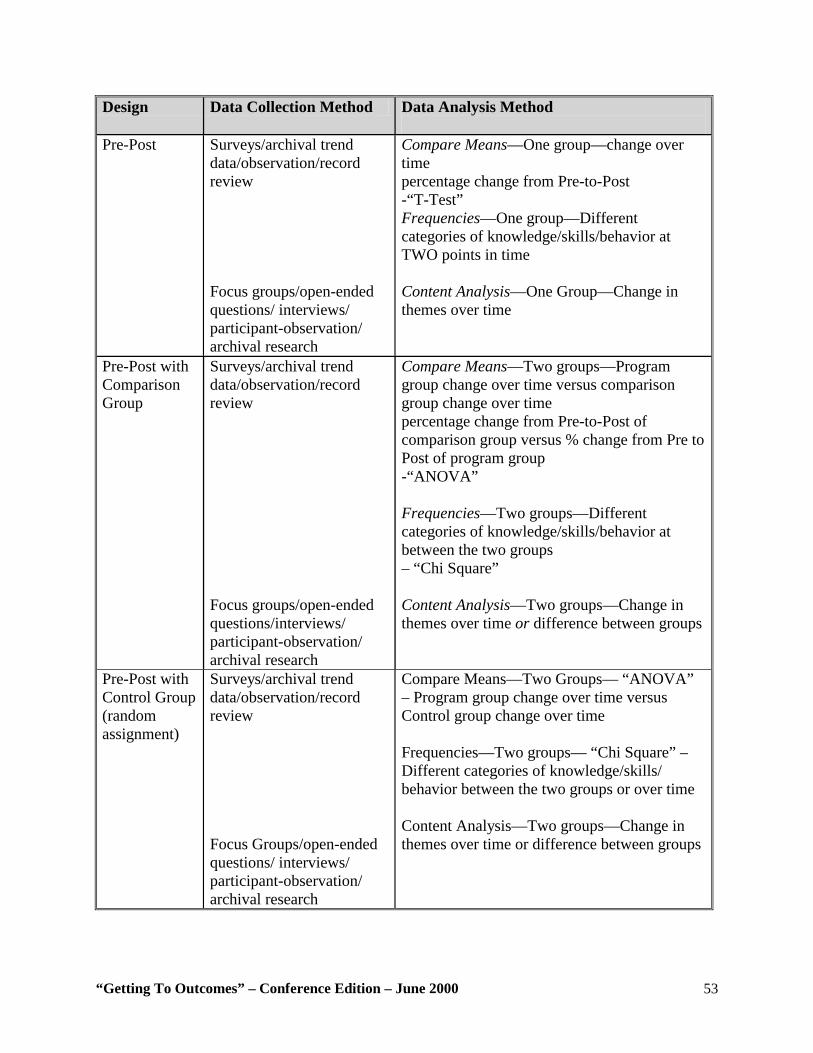
“Getting To Outcomes” – Conference Edition – June 2000 53
Design Data Collection Method Data Analysis Method
Pre-Post
Surveys/archival trend data/observation/record review Focus groups/open-ended questions/ interviews/ participant-observation/ archival research
Compare Means—One group—change over time percentage change from Pre-to-Post -“T-Test” Frequencies—One group—Different categories of knowledge/skills/behavior at TWO points in time Content Analysis—One Group—Change in themes over time
Pre-Post with Comparison Group
Surveys/archival trend data/observation/record review Focus groups/open-ended questions/interviews/ participant-observation/ archival research
Compare Means—Two groups—Program group change over time versus comparison group change over time percentage change from Pre-to-Post of comparison group versus % change from Pre to Post of program group -“ANOVA” Frequencies—Two groups—Different categories of knowledge/skills/behavior at between the two groups – “Chi Square” Content Analysis—Two groups—Change in themes over time or difference between groups
Pre-Post with Control Group (random assignment)
Surveys/archival trend data/observation/record review Focus Groups/open-ended questions/ interviews/ participant-observation/ archival research
Compare Means—Two Groups— “ANOVA” – Program group change over time versus Control group change over time Frequencies—Two groups— “Chi Square” – Different categories of knowledge/skills/ behavior between the two groups or over time Content Analysis—Two groups—Change in themes over time or difference between groups
“Getting To Outcomes” – Conference Edition – June 2000 54
Interpreting the Data Whatever results you obtain for you evaluation, you will need information from both the process
evaluation and the outcome evaluation to guide your efforts in improving your program. If your
program was well implemented but did not produce positive results, you obviously can conclude
that its design or theory was flawed and needs to be improved. You can conclude this only with
information from both process and outcome evaluations.
Benchmarks Obviously‚ you can deem your program a success only if it achieved the desired outcomes.
Although establishing desired outcome thresholds (for example, 70 percent of eighth graders
have not used alcohol in the past 30 days) may seem arbitrary‚ such measures are essential for
evaluating your program’s effectiveness. Several methods can be used to set meaningful
benchmarks. First, if you are using an evidence-based program, you can set objectives based
upon what the program has achieved previously in other communities. Second, you can use your
own experience with an ATOD group to set realistic desired outcomes. Third, you can use
national or state-wide archival data to give you a target at which to aim (e.g. you want to reduce
your community’s drunk-driving rate below the national average).
Weigh Results Against the Program’s Cost When possible, relate behavioral change rates to the amount spent on the program. Costs include
not only all the “direct” funds it requires to plan, implement, and evaluate the program, but also
rent and other “indirect” costs associated with overhead. You should include the costs saved by
the program’s positive results (for example, health core treatment savings due to a 16-year-old
participant choosing not to use drugs or alcohol), even though they can be difficult to estimate.
If the results are positive, this information can be used to generate positive public relations and
media attention, justify continued funding, and/or secure new funding. In addition, this
information can be used to help choose or design the most cost-effective program.
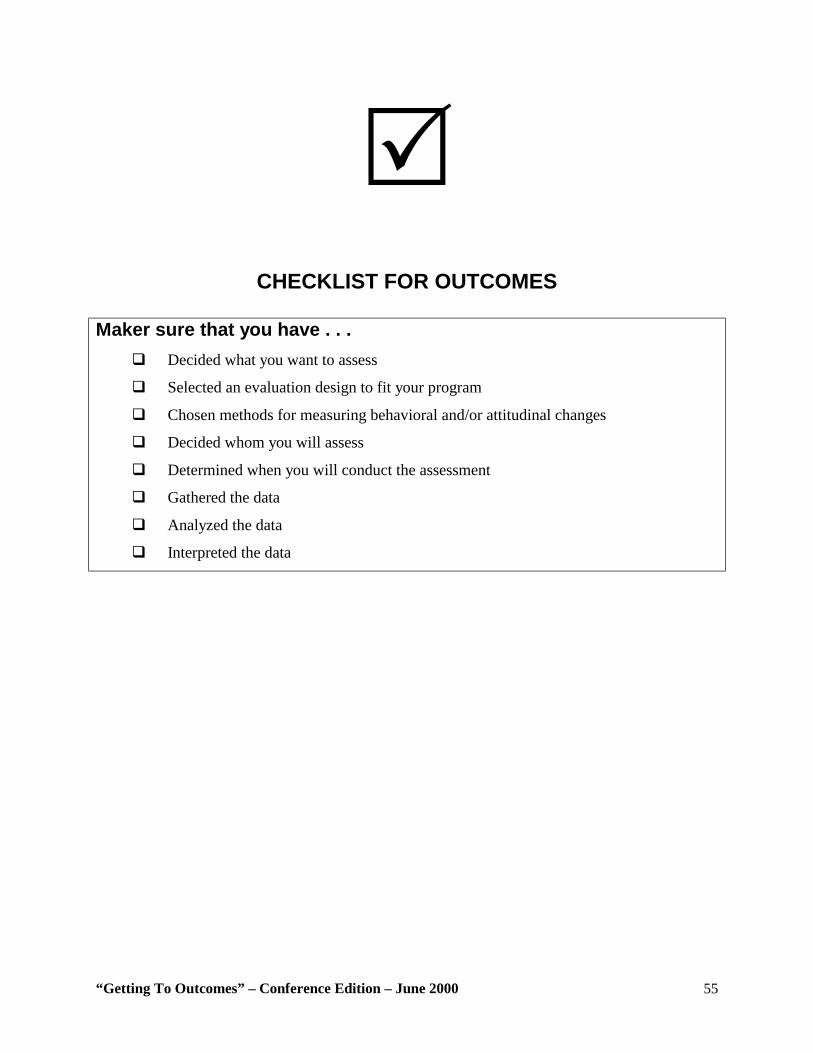
“Getting To Outcomes” – Conference Edition – June 2000 55
!
CHECKLIST FOR OUTCOMES Maker sure that you have . . .
#" Decided what you want to assess
#" Selected an evaluation design to fit your program
#" Chosen methods for measuring behavioral and/or attitudinal changes
#" Decided whom you will assess
#" Determined when you will conduct the assessment
#" Gathered the data
#" Analyzed the data
#" Interpreted the data
“Getting To Outcomes” – Conference Edition – June 2000 56
Continuous Quality Improvement: How will continuous quality improvement strategies be incorporated? Definition of Continuous Quality Improvement
Continuous Quality Improvement (CQI) involves the systematic assessment and feedback
of evaluation information about planning, implementation, and outcomes‚ to improve the
quality of ongoing or future programs.
Continuous quality improvement has gained great popularity in industry (see e.g., the works of
W. Edwards Deming, developer of the Deming Management Method) and is gaining wide
acceptance in health and human service programs as well. Continuous Quality Improvement
should not be viewed merely as documentation, but also as a feedback mechanism that can guide
future planning and implementation.
Why is Using Continuous Quality Improvement Strategies Important? • Documenting and providing feedback on program components that work well helps
ensure that future implementation also will be successful.
• Documenting and providing feedback on program components that did not work well
identifies areas that needs improvement.
• Program personnel who are open to learning from their evaluation—by obtaining and
using feedback—will continuously implement more effective programs.
• The practical use of evaluation findings for program improvement increases the
salience of investing in evaluation.
STEPS TO ADDRESS CONTINUOUS QUALITY IMPROVEMENT If you have completed a program this year and plan to repeat it, how can you do it better the next
time around? By asking and answering questions 1-8 again, you can potentially improve your
responses to each accountability question the next time you implement your program.
“Getting To Outcomes” – Conference Edition – June 2000 57
Examine any changes in the program context We suggest that you ask and answer questions 1-8 again because relevant changes may have
occurred. For example, have the community’s needs/resources or the goals (desired outcomes of
your program changed)? Are new best practices available? Has new information been
disseminated through the science-based literature? Does this program continue to fit with the
mission of your agency? If no changes have occurred‚ you obviously may answer the
accountability questions as you did previously. If there are changes, however‚ you will need to
address them.
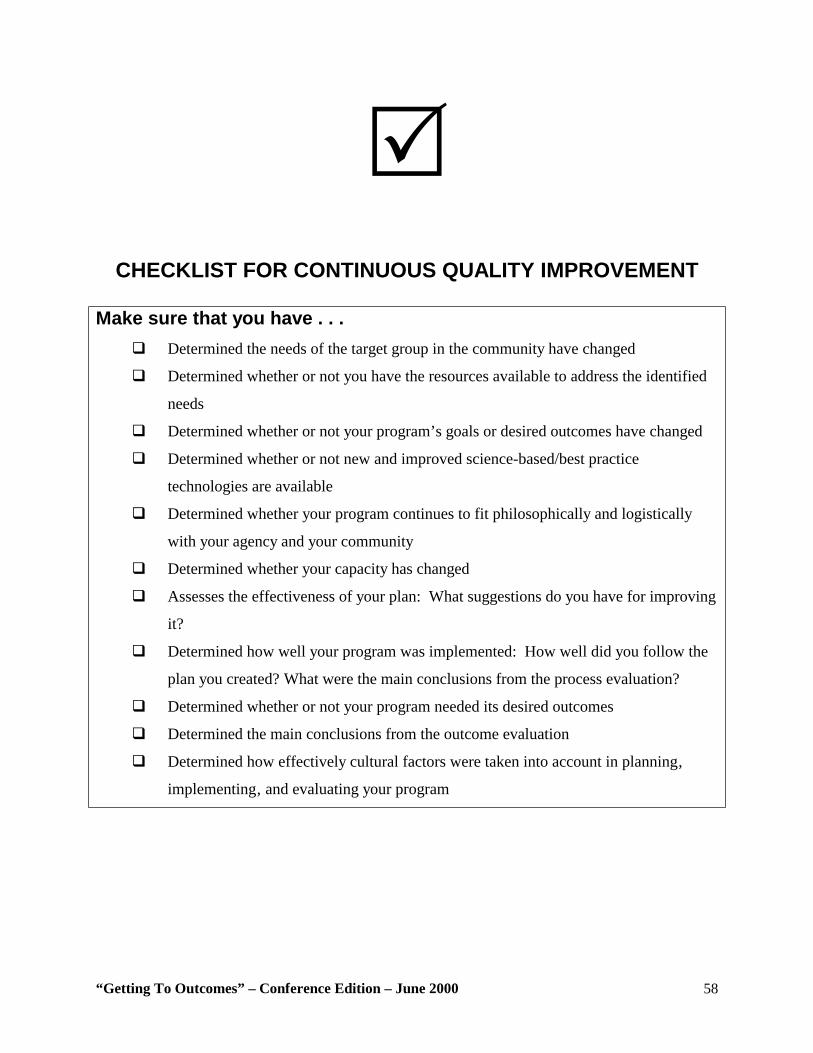
“Getting To Outcomes” – Conference Edition – June 2000 58
!
CHECKLIST FOR CONTINUOUS QUALITY IMPROVEMENT Make sure that you have . . .
#" Determined the needs of the target group in the community have changed
#" Determined whether or not you have the resources available to address the identified
needs
#" Determined whether or not your program’s goals or desired outcomes have changed
#" Determined whether or not new and improved science-based/best practice
technologies are available
#" Determined whether your program continues to fit philosophically and logistically
with your agency and your community
#" Determined whether your capacity has changed
#" Assesses the effectiveness of your plan: What suggestions do you have for improving
it?
#" Determined how well your program was implemented: How well did you follow the
plan you created? What were the main conclusions from the process evaluation?
#" Determined whether or not your program needed its desired outcomes
#" Determined the main conclusions from the outcome evaluation
#" Determined how effectively cultural factors were taken into account in planning‚
implementing‚ and evaluating your program
“Getting To Outcomes” – Conference Edition – June 2000 59
SUSTAINABILITY: If your program proves successful, what can you do to sustain it? Definition of Sustainability
Sustainability refers to the continuation of the program after the initial funding has ended. Many terms are used in relation to program continuation, including maintenance,
institutionalization, incorporation, routinization, and durability. We will use the term
sustainability because it implies that a program should be flexible, changeable, and likely to
continue over a period of time. Programs are more likely to survive if they adapt themselves to
fit the needs of the environment over time. Much of the literature on sustainability has been
based upon what happens after the initial external (or internal) funding of a program ends. If a
program was begun with external funding, what happens when the funding runs out? Must the
program end as well? General approaches to sustainability include:
• Obtaining new external funding to continue the program (e.g., new grant funding or
United Way funding)
• Having the host organization or community put its own resources into continuing the
program (e.g., after a mentoring program started in a school with foundation funding
proves successful‚ the school or school district uses its own money to continue the
program).
Not all programs should be sustained. Situations, personnel, and community needs all may
change. Perhaps a more effective or suitable program has been created‚ since you initiated
yours. Following the Getting to Outcomes process should help you determine whether your
particular program is worth sustaining.
Why is sustainability important? • Ending a program that has obtained positive results is counterproductive if the
problem for which it was created still exists or reoccurs.
“Getting To Outcomes” – Conference Edition – June 2000 60
• Creating a program entails significant start-up costs in terms of human, fiscal, and
technical resources. However‚ sometimes‚ funding ends or is withdrawn before full
program implementation and before successful outcomes can be demonstrated‚ thus
wasting resources.
• If ATOD reduction/prevention program proves successful yet is not sustainable,
similar programs may face much resistance from potential funders. (Shediac-
Rizkallah and Bone, 1998).
STEPS TO INCREASE SUSTAINABILITY Little research exists on how to sustain programs. However‚ a recent literature review on
sustainability indicates that certain project characteristics are associated with sustainability of
programs initially funded with external funds (Shediac-Rizkallah and Bone, 1998). We have
adapted this work to suggest strategies that might be useful in sustaining your program. Whether
you are thinking of obtaining additional resources from external sources (such as foundations or
governments) or from internal sources (such as host organizations), developing strategies for
sustaining the program would be invaluable to you:
Program negotiation process. Many programs are driven by categorical funding (where the
funder dictates the priorities and sometimes the program to be used). Often, when a community
or host organization is asked to sustain such a program, one finds that they really have not
bought into the program. You may find that initiating a project negotiation process, which can
help to develop community project collaboration, will significantly increase community buy-in.
• Program effectiveness. While not all effective programs are necessarily sustained,
only effective programs should be. By creating and maintaining high program
visibility (through publicizing the activities and positive early evaluation results of
your program)‚ you can establish a reputation for effectiveness and increase your
program’s likelihood of being sustained.
• Program Financing. Programs that rely completely on external funds are more
vulnerable. Taking the following actions can improve your changes of sustaining
your program: (1) Plan initially for eventual funding cutbacks; (2) Cultivate
“Getting To Outcomes” – Conference Edition – June 2000 61
additional resources while the program is ongoing (e.g.‚ in-kind costs or low fees for
services); and (3) Adopt an entrepreneurial spirit in seeking additional support.
• Training. Programs that incorporate and train people with ongoing jobs in your
organization are more likely to have lasting effects—these employees can continue to
provide programming, train others, and form a constituency to support the program.
Keep in mind that‚ if the only people who operated the program were those fully
funded by the program, no one would be left to carry on any of its useful components
once the initial funding was exhausted.
• Institutional strength. The strength of the institution implementing the program is
related to sustainability. Institutional strengths include goal consistency between the
institution and the program, strong leadership and high skill levels, and mature and
stable organizations. Obviously‚ when ever possible, programs should have strong
institutions involved in their implementation.
• Integration with existing programs/services. Programs that are “stand-alone” or
self-contained are less likely to be sustained than programs that are well integrated
with the host organization(s). In other words, if the program does not interact and
integrate with other programs and services, it will be easier to cut when the initial
funding ends. Therefore, program personnel should work to integrate their programs
rather than to isolate and guard them.
• Program champions. Program sustainability is politically oriented and can depend
on generating goodwill for the program’s continuation. Goodwill often depends upon
obtaining an influential program advocate or “champion.” The champion can be
internal to the organization (e.g., a high-ranking member of the organization) or
external (e.g.‚ the local superintendent of schools or a city council member).
“Getting To Outcomes” – Conference Edition – June 2000 62
!
CHECKLIST FOR SUSTAINABILITY* Make sure that you have . . .
#" Started discussions early with community members about sustaining the program
#" Ensured that the needs of the community are driving this program
#" Developed a consensus-building process to reach a compromise for addressing
different stakeholder (community, funder, technical experts) needs
#" Ensured that the program is achieving the desired outcomes
#" Begun an assessment of the community’s local resources to identify potential
“homes” for the program
#" Considered options such as a scaled-down version of the program to discuss with
those who may sustain the program
#" Prepared clear strategies for gradual financial self-sufficiency
#" Created a strong organizational base for the program
#" Ensured that the program can be integrated with other existing ATOD use
prevention/reduction programs
#" Developed program goals that can be adapted to the needs of the local population
#" Ensured that the program is compatible with the mission and activities of the host
organization
#" Identified a respected program “champion”
#" Developed a program that is endorsed from the top of the sponsoring organization *Checklist is based on Shediac-Rizkallah and Bone, 1998
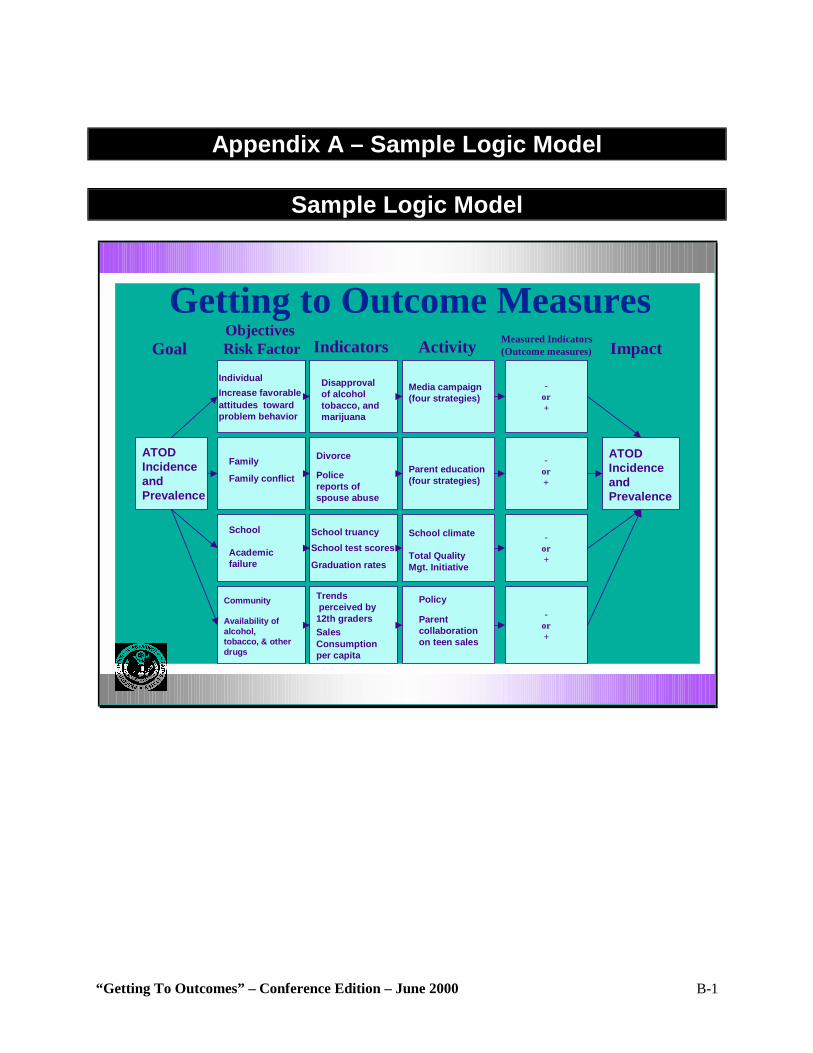
“Getting To Outcomes” – Conference Edition – June 2000 B-1
Appendix A – Sample Logic Model
Sample Logic Model
School truancySchool test scores
Graduation rates
Divorce
Policereports ofspouse abuse
-or+
Trendsperceived by 12th gradersSalesConsumption per capita
-or +
Disapprovalof alcoholtobacco, andmarijuana
-or+
Policy
Parentcollaborationon teen sales
School climate
Total QualityMgt. Initiative
ATODIncidenceandPrevalence
Community
Availability of alcohol,tobacco, & other drugs
School
Academicfailure
Family
Family conflict
Getting to Outcome Measures
-or+
ATODIncidenceandPrevalence
Media campaign(four strategies)
Parent education(four strategies)
IndividualIncrease favorableattitudes towardproblem behavior
Indicators Activity Measured Indicators(Outcome measures)
ObjectivesRisk FactorGoal Impact
“Getting To Outcomes” – Conference Edition – June 2000 B-1
Appendix B – National Databases
Monitoring the Future Study (MTF):
Reports on the prevalence of drug use and related attitudes among secondary school students (8th,
10th, and 12th grades). Information on lifetime, past-year, and past-30-day use is collected on the
following drugs: any illicit drug, marijuana, stimulants, cocaine, crack cocaine, hallucinogens,
lysergic acid diethylamide (LSD), hallucinogens other than LSD, inhalants, barbiturates, other
opiates, tranquilizers, methylenedioxymethamphetamine (MDMA, or “ecstasy”), crystal
methamphetamine (“ice”), steroids, and heroin.
Web site: http://www.isr.umich.edu/src/mtf
National Household Survey on Drug Abuse (NHSDA):
Provides information on prevalence and trends in the use of illicit drugs, alcohol, and tobacco
among members of the household population age 12 and older in the United States. NHSDA
survey reports can be obtained by contacting:
SAMHSA, Office of Applied Studies
Rockwall II Building
5600 Fishers Lane
Rockville, Maryland 20857
Web site: http://www.samhsa.gov/
“Getting To Outcomes” – Conference Edition – June 2000 B-2
Parents’ Resource Institute for Drug Education (PRIDE, Inc.):
Offers programs that develop youth leadership, Club PRIDE for middle-school-aged-youth,
PRIDE Pals elementary program, and resources for parents. Information can be obtained by
contacting:
PRIDE, Inc.
3610 DeKalb Technology Parkway, Suite 105
Atlanta, GA 30340
(770) 458-9900
Fax: (770) 458-5030
Web site: http://www.prideusa.org/
Search Institute
The Search Institute is a nonprofit, nonsectarian organization dedicated to promoting the positive
development of children and youth through scientific research, evaluation, consulting, and the
development of practical resources. The Institute is strongly oriented toward recognizing and
building upon assets of youth, families, and communities. Offers a variety of publications as
well as training and technical assistance services. Information can be obtained by contacting:
The Search Institute
700 S. Third Street, Suite 210
Minneapolis, MN 55415
(800) 888-7828 or (612) 376-8955
Fax: (612) 376-8956
Web site: http://www.search-institute.org
“Getting To Outcomes” – Conference Edition – June 2000 B-3
Youth Behavior Risk Survey (YBRS):
Developed by the Centers for Disease Control and Prevention‚ the survey monitors risk
behaviors among public school youth in grades 9 through 12. Use of alcohol, tobacco, and other
drugs, as well as dietary behaviors, physical inactivity, and risky sexual behaviors are the priority
risk behaviors surveyed.
Web site: http://www.cdc.gov/nccdphp/dash/yrbs/index.htm
Information on children and youth: The Annie E Casey Foundation (410) 547-6600; the
Children’s Defense Fund (202) 628-8787; the National Center for Children in Poverty (212) 927-
8793; county and local agencies
Education data: State and local education agencies
Economic data: Bureau of the Census (301) 457-4608; Bureau of Labor Statistics (202) 606-
7828; U.S. Department of Housing and Urban Development (202) 708-1422; annual reports
prepared by cities‚ counties‚ and states.
Child welfare and juvenile justice: U.S. Department of Justice (202) 307-6600; local police and
human services departments; state juvenile and criminal justice agencies
Health data and vital statistics: State and local departments of health and human services.
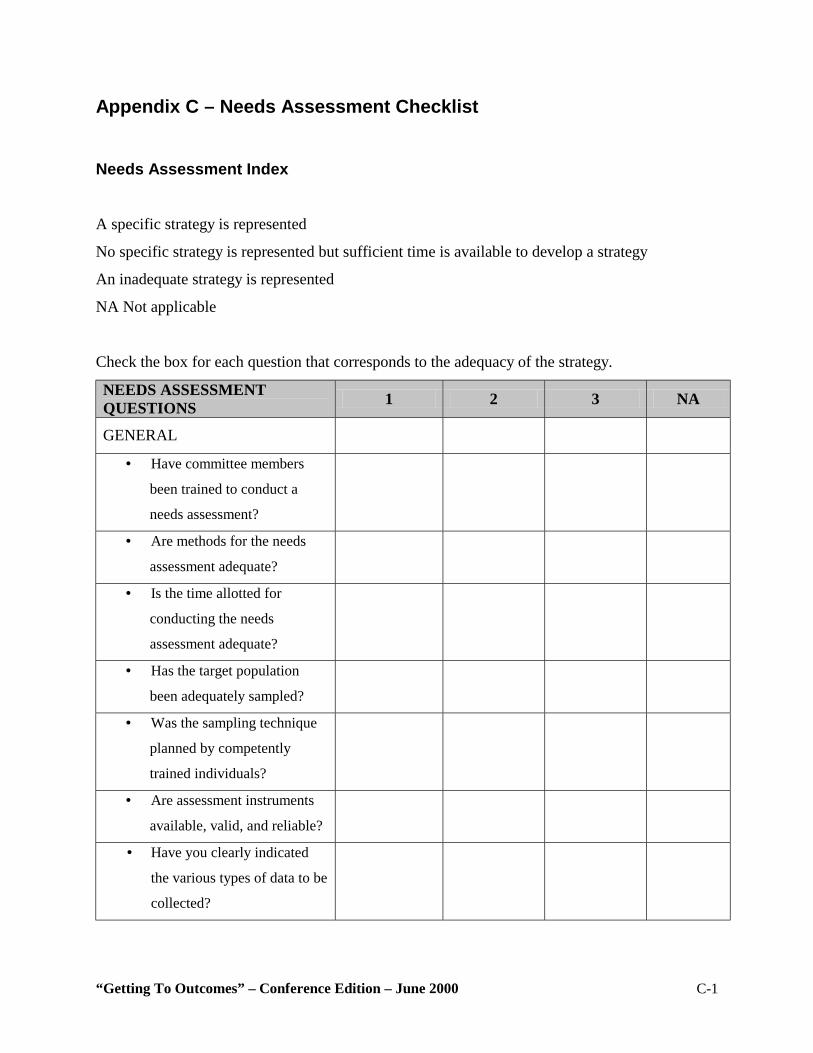
“Getting To Outcomes” – Conference Edition – June 2000 C-1
Appendix C – Needs Assessment Checklist Needs Assessment Index
A specific strategy is represented
No specific strategy is represented but sufficient time is available to develop a strategy
An inadequate strategy is represented
NA Not applicable
Check the box for each question that corresponds to the adequacy of the strategy.
NEEDS ASSESSMENT QUESTIONS 1 2 3 NA
GENERAL
• Have committee members
been trained to conduct a
needs assessment?
• Are methods for the needs
assessment adequate?
• Is the time allotted for
conducting the needs
assessment adequate?
• Has the target population
been adequately sampled?
• Was the sampling technique
planned by competently
trained individuals?
• Are assessment instruments
available, valid, and reliable?
• Have you clearly indicated
the various types of data to be
collected?
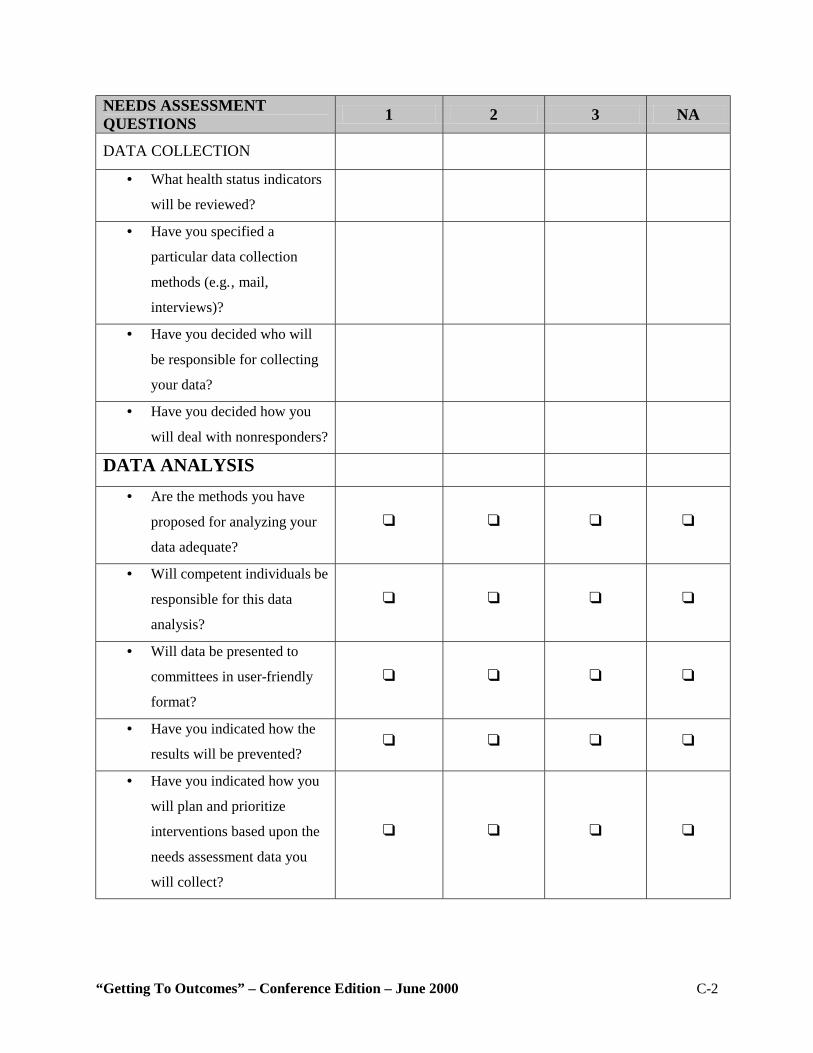
“Getting To Outcomes” – Conference Edition – June 2000 C-2
NEEDS ASSESSMENT QUESTIONS 1 2 3 NA
DATA COLLECTION
• What health status indicators
will be reviewed?
• Have you specified a
particular data collection
methods (e.g.‚ mail,
interviews)?
• Have you decided who will
be responsible for collecting
your data?
• Have you decided how you
will deal with nonresponders?
DATA ANALYSIS
• Are the methods you have
proposed for analyzing your
data adequate?
! ! ! !
• Will competent individuals be
responsible for this data
analysis?
! ! ! !
• Will data be presented to
committees in user-friendly
format?
! ! ! !
• Have you indicated how the
results will be prevented? ! ! ! !
• Have you indicated how you
will plan and prioritize
interventions based upon the
needs assessment data you
will collect?
! ! ! !
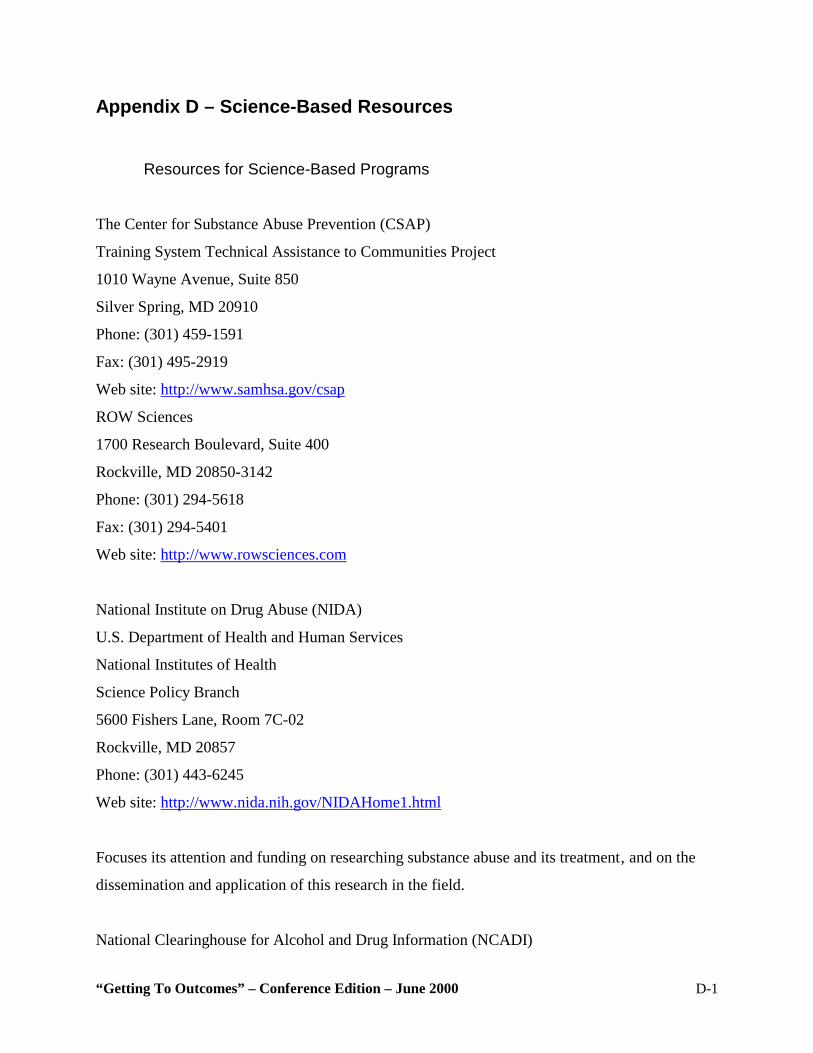
“Getting To Outcomes” – Conference Edition – June 2000 D-1
Appendix D – Science-Based Resources Resources for Science-Based Programs
The Center for Substance Abuse Prevention (CSAP)
Training System Technical Assistance to Communities Project
1010 Wayne Avenue, Suite 850
Silver Spring, MD 20910
Phone: (301) 459-1591
Fax: (301) 495-2919
Web site: http://www.samhsa.gov/csap
ROW Sciences
1700 Research Boulevard, Suite 400
Rockville, MD 20850-3142
Phone: (301) 294-5618
Fax: (301) 294-5401
Web site: http://www.rowsciences.com
National Institute on Drug Abuse (NIDA)
U.S. Department of Health and Human Services
National Institutes of Health
Science Policy Branch
5600 Fishers Lane, Room 7C-02
Rockville, MD 20857
Phone: (301) 443-6245
Web site: http://www.nida.nih.gov/NIDAHome1.html
Focuses its attention and funding on researching substance abuse and its treatment‚ and on the
dissemination and application of this research in the field.
National Clearinghouse for Alcohol and Drug Information (NCADI)
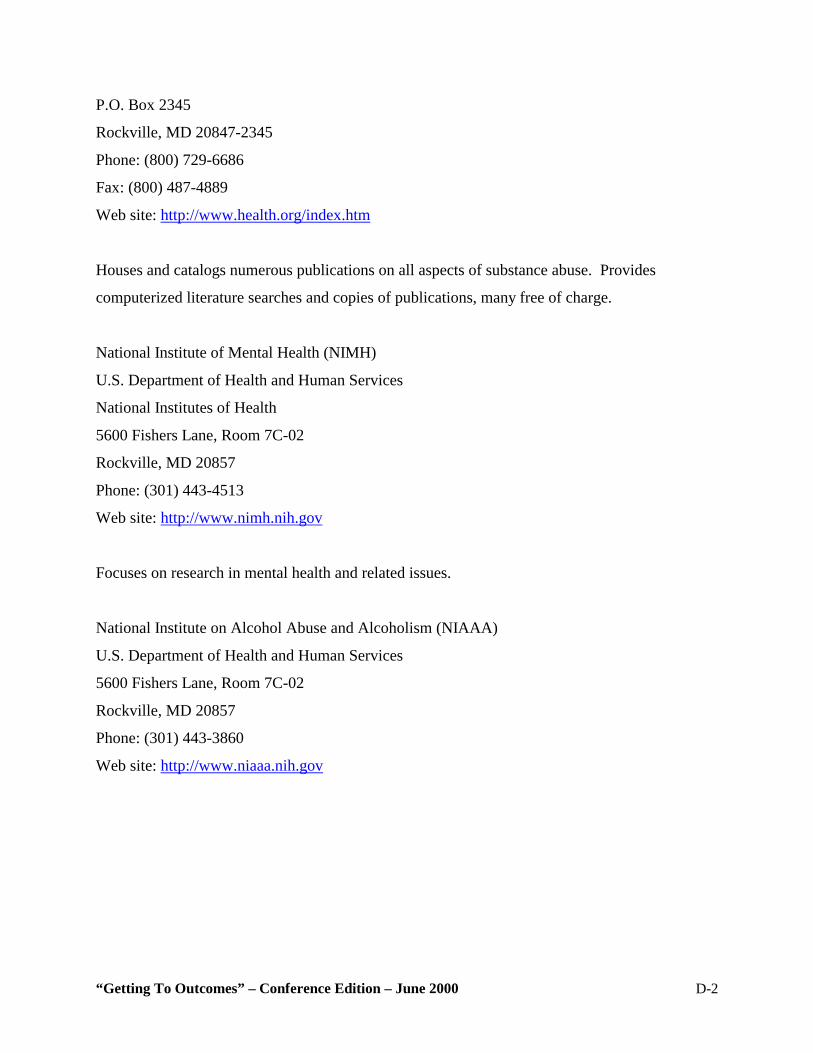
“Getting To Outcomes” – Conference Edition – June 2000 D-2
P.O. Box 2345
Rockville, MD 20847-2345
Phone: (800) 729-6686
Fax: (800) 487-4889
Web site: http://www.health.org/index.htm
Houses and catalogs numerous publications on all aspects of substance abuse. Provides
computerized literature searches and copies of publications, many free of charge.
National Institute of Mental Health (NIMH)
U.S. Department of Health and Human Services
National Institutes of Health
5600 Fishers Lane, Room 7C-02
Rockville, MD 20857
Phone: (301) 443-4513
Web site: http://www.nimh.nih.gov
Focuses on research in mental health and related issues.
National Institute on Alcohol Abuse and Alcoholism (NIAAA)
U.S. Department of Health and Human Services
5600 Fishers Lane, Room 7C-02
Rockville, MD 20857
Phone: (301) 443-3860
Web site: http://www.niaaa.nih.gov
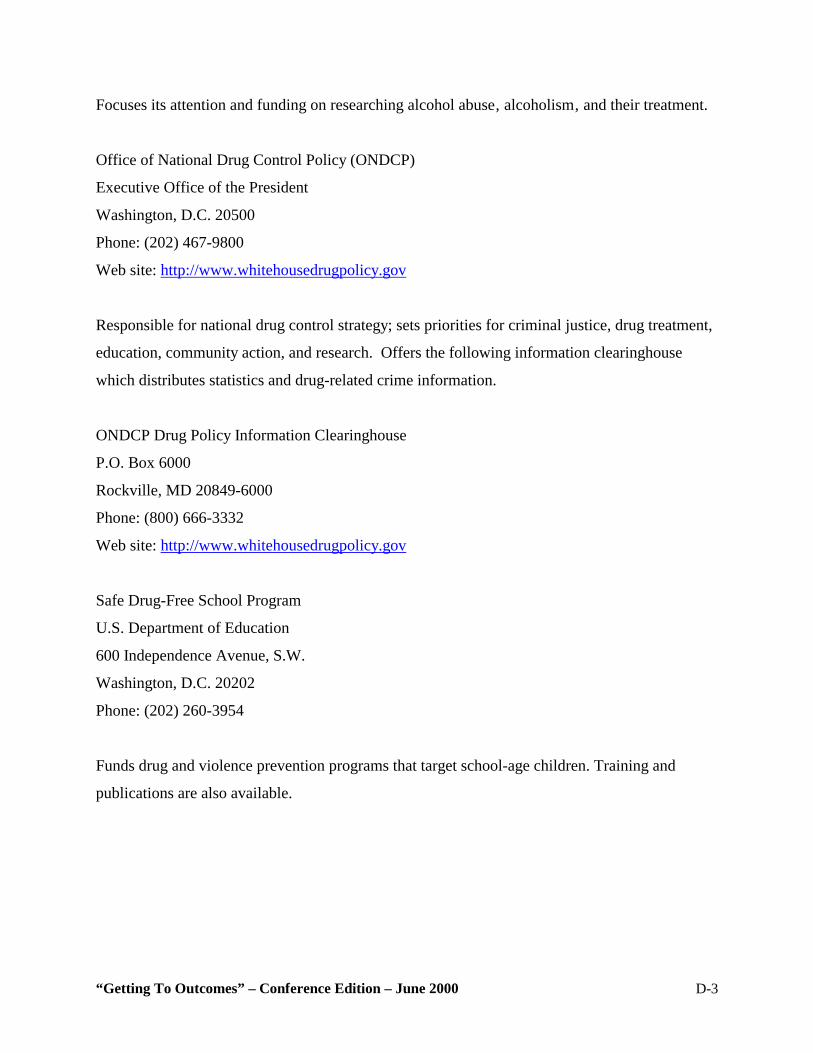
“Getting To Outcomes” – Conference Edition – June 2000 D-3
Focuses its attention and funding on researching alcohol abuse‚ alcoholism‚ and their treatment.
Office of National Drug Control Policy (ONDCP)
Executive Office of the President
Washington, D.C. 20500
Phone: (202) 467-9800
Web site: http://www.whitehousedrugpolicy.gov
Responsible for national drug control strategy; sets priorities for criminal justice, drug treatment,
education, community action, and research. Offers the following information clearinghouse
which distributes statistics and drug-related crime information.
ONDCP Drug Policy Information Clearinghouse
P.O. Box 6000
Rockville, MD 20849-6000
Phone: (800) 666-3332
Web site: http://www.whitehousedrugpolicy.gov
Safe Drug-Free School Program
U.S. Department of Education
600 Independence Avenue, S.W.
Washington, D.C. 20202
Phone: (202) 260-3954
Funds drug and violence prevention programs that target school-age children. Training and
publications are also available.
“Getting To Outcomes” – Conference Edition – June 2000 D-4
Community Anti-Drug Coalition of America (CADCA)
901 North Pitt Street, Suite 300
Alexandria, VA 22314
Phone: (703) 706-0560
Fax: (703) 706-0565
Web site: http://www.cadca.org
A membership organization for community alcohol and other drug prevention coalitions, with a
current membership of more than 3,500 coalition members. Provides training and technical
assistance, publications and advocacy services, and hosts a National Leadership Forum annually.
Narcotics Education
6830 Laurel Street, NW.
Washington, D.C. 20012
Phone: (202) 722-6740 or (800) 548-8700
Publishes pamphlets, books, teaching aids, posters, audiovisual aids, and prevention materials‚
on narcotics and other substance abuse designed for classroom use.
National Center for the Advancement of Prevention (NCAP)
5515 Security Lane, Suite 1101
Rockville, MD 20852
Phone: (301) 816-2400
Fax: (301) 816-1041
Produces and disseminates documents on a variety of prevention and community mobilization
and readiness topics.
“Getting To Outcomes” – Conference Edition – June 2000 D-5
National Families in Action
2957 Clairmont Road, Suite 150
Atlanta, GA 30329
Phone: (404) 248-9676
Fax: (404) 248-1312
Web site: http://www.emory.edu/NFIA
Maintains a drug information center with more than 200,000 documents; publishes Drug Abuse
Update, a quarterly journal containing abstracts of articles published in academic journals and
newspapers on drug abuse and other drug issues.
Partnership for a Drug-Free America
405 Lexington Avenue, 16th Floor
New York, NY 10174
Phone: (212) 922-1560
Web site: http://www.drugfreeamerica.org
Conducts advertising and media campaigns to promote awareness of substance abuse issues.
Prevention First, Inc.
2800 Montvale Drive
Springfield, IL 62704
Phone: (217) 793-7353 Web site: http://www.prevention.org
“Getting To Outcomes” – Conference Edition – June 2000 D-6
Produces a variety of print and audiovisual products on various prevention topics.
Drug Strategies
1575 Eye St. NW., Suite 210
Washington, D.C. 20005
Phone: (202) 289-9070
Fax: (202) 414-6199
Web site: http://www.drugstrategies.org
Join Together
441 Stuart Street, 6th Floor
Boston, MA 02116
Phone: (617) 437-1500
Web site: http://www.jointogether.org
“Getting To Outcomes” – Conference Edition – June 2000 E-1
Appendix E – ONDCP’s Principles
EVIDENCE-BASED PRINCIPLES AND GUIDELINES FOR SUBSTANCE ABUSE PREVENTION AND MANAGEMENT Draft – September 9, 1999 The 1999 National Drug Control Strategy’s Performance Measures of Effectiveness require the
Office of National Drug Control Policy to “develop and implement a set of research-based
principles upon which prevention programming can be based.” The following principles and
guidelines were drawn from literature reviews and guidance supported by the Federal
departments of Education, Justice, and Health and Human Services, as well as the White House
Office of National Drug Control Policy. Some prevention interventions covered by these
literature reviews have been tested in laboratory, clinical, and community settings, using the
most rigorous of research methods. Additional interventions have been studied with the use of
techniques that meet other recognized standards. The principles and guidelines presented here
are broadly supported by this growing body of research.
PREVENTION INTERVENTIONS
1. Select and clearly define a target population.
A preventive intervention should focus on a clearly defined target population, since no one
intervention fits all populations. The intervention should be developmentally and culturally
appropriate and sensitive to the gender, ethnicity, education, socioeconomic status, and
geographic location of the target population. It should be sensitive to the needs, thoughts, and
motivations of individuals in the population.
“Getting To Outcomes” – Conference Edition – June 2000 E-2
2. Address the major forms of drug abuse
Communities should address the major forms of drug abuse, and not just one drug. This is
especially important because of the underage use and abuse of alcohol and tobacco, the
sequencing of drug use, the substitution of drugs (depending on availability, costs, perceived
safety, and the like), and the prevalence of poly-drug abuse.
3. Address the major risk and protective factors.
Communities should address factors that place individuals at increased risk of drug abuse, as
well as factors that protect individuals from such risk. Preventive interventions should seek to
reduce the risk factors and enhance the protective factors.
4. Intervene in families.
Numerous scientific investigations have established that families can strongly influence how
young people handle the temptations to use alcohol, cigarettes, and illegal drugs. Communities
can select from among proven and effective preventive interventions that focus on the family.
5. Intervene in other major community institutions as well.
While targeting families is important, a comprehensive prevention approach should address other
community institutions as well, especially those that can strongly affect families, such as schools,
faith communities, and workplaces.
6. Intervene early enough.
The higher the level of risk in the target population, the earlier the intervention should begin and
the more intensive it should be. A prenatal, early childhood, adolescent, or early adulthood
intervention may be called for, depending on the target population.
“Getting To Outcomes” – Conference Edition – June 2000 E-3
7. Intervene often enough.
Community prevention programs should be long-term, with booster sessions that reinforce
original prevention goals and achievements. Special attention should be paid to booster sessions
during critical life transitions, such as the one from middle school to high school.
8. Address availability and marketing.
Communities should seek to reduce the availability and marketing of illicit drugs, and of alcohol
and tobacco to underage populations, via community-wide policies and strategies. Reducing the
physical, economic, social, and legal availability of drugs obviously will make it more difficult
to acquire and use them.
9. Share information.
Preventive interventions should convey information about drug abuse. Information should be
accurate, credible, and appropriate for the age, gender, and race/ethnicity of the target
population‚ including its families, peers, and other caring adults.
10. Strengthen anti-drug use attitudes and norms.
Communities should assess and strengthen social norms against drug use. Establishing anti-drug
use social norms will encourage anti-drug use attitudes and behaviors.
11. Strengthen life skills and drug-refusal skills.
Preventive interventions should impart life skills (in critical thinking, communication, and social
competency) and drug refusal skills, to help individuals understand, reinforce, and act upon
personal anti-drug use commitments.
“Getting To Outcomes” – Conference Edition – June 2000 E-4
12. Consider alternative activities.
Communities should consider providing structured and supervised alternative activities, as part
of comprehensive prevention programming that includes other preventive interventions as well.
13. Use interactive techniques.
Preventive interventions should use interactive techniques, such as role-playing and peer
discussion groups, to reinforce learning and pro-social bonding that are likely to persist.
PROGRAM MANAGEMENT
14. Assess community needs and resources.
A prevention program should be built on a scientific assessment of community drug use, drug
abuse, and drug-related problems.
15. Use evidence-based interventions.
A preventive intervention should be selected and implemented based on evidence that it has been
efficacious in a controlled situation or effective in a community.
16. Ensure that program components are complementary.
A community should ensure that the prevention components contributed by different parts of the
community are complementary and, whenever possible, integrated.
“Getting To Outcomes” – Conference Edition – June 2000 E-5
17. Train staff and volunteers.
A prevention program should emphasize training for those who will implement the program, to
ensure that it is delivered and administered as intended.
18. Monitor and evaluate.
Prevention programs should be evaluated periodically to assess progress in achieving goals and
objectives. Evaluation results should be used to refine, improve, and strengthen program
approaches, and to refine goals and objectives as appropriate.
19. Strive for cost-effectiveness.
A preventive intervention should be effective. It should be cost-effective as well; its costs should
be justified by its ameliorative effects.
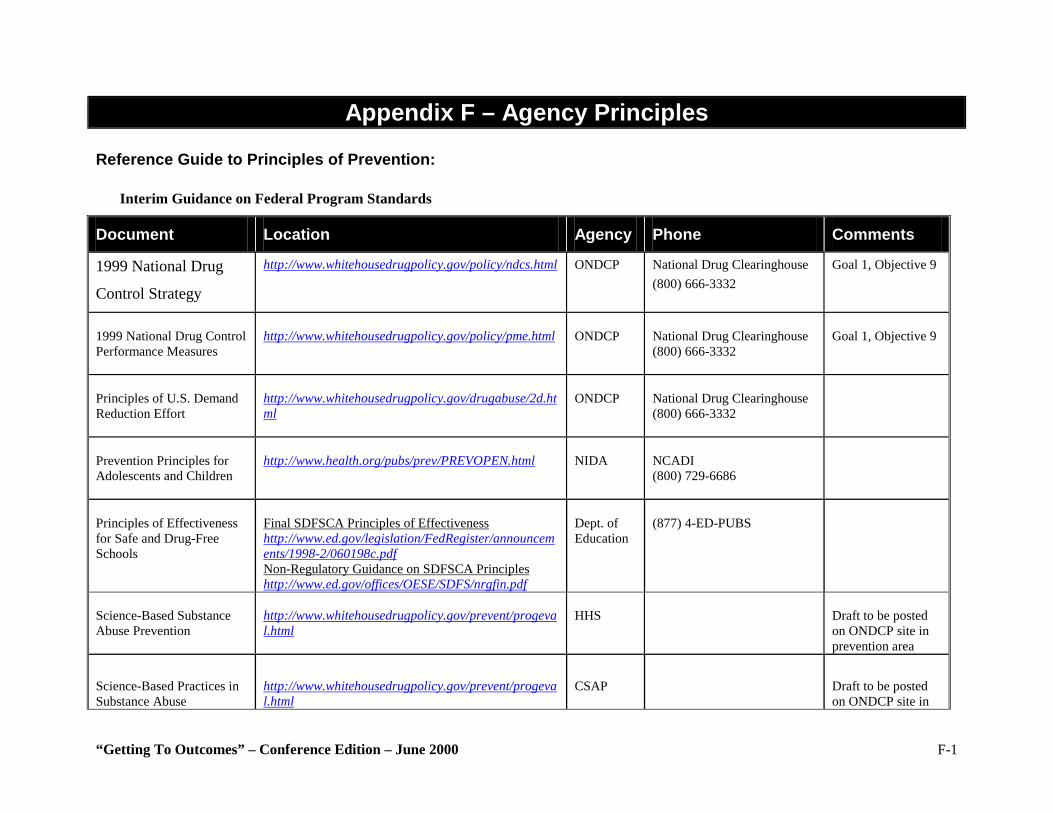
“Getting To Outcomes” – Conference Edition – June 2000 F-1
Appendix F – Agency Principles Reference Guide to Principles of Prevention:
Interim Guidance on Federal Program Standards
Document Location Agency Phone Comments
1999 National Drug
Control Strategy
http://www.whitehousedrugpolicy.gov/policy/ndcs.html ONDCP National Drug Clearinghouse (800) 666-3332
Goal 1, Objective 9
1999 National Drug Control Performance Measures
http://www.whitehousedrugpolicy.gov/policy/pme.html
ONDCP
National Drug Clearinghouse (800) 666-3332
Goal 1, Objective 9
Principles of U.S. Demand Reduction Effort
http://www.whitehousedrugpolicy.gov/drugabuse/2d.html
ONDCP
National Drug Clearinghouse (800) 666-3332
Prevention Principles for Adolescents and Children
http://www.health.org/pubs/prev/PREVOPEN.html
NIDA
NCADI (800) 729-6686
Principles of Effectiveness for Safe and Drug-Free Schools
Final SDFSCA Principles of Effectiveness http://www.ed.gov/legislation/FedRegister/announcements/1998-2/060198c.pdf Non-Regulatory Guidance on SDFSCA Principles http://www.ed.gov/offices/OESE/SDFS/nrgfin.pdf
Dept. of Education
(877) 4-ED-PUBS
Science-Based Substance Abuse Prevention
http://www.whitehousedrugpolicy.gov/prevent/progeval.html
HHS
Draft to be posted on ONDCP site in prevention area
Science-Based Practices in Substance Abuse
http://www.whitehousedrugpolicy.gov/prevent/progeval.html
CSAP
Draft to be posted on ONDCP site in
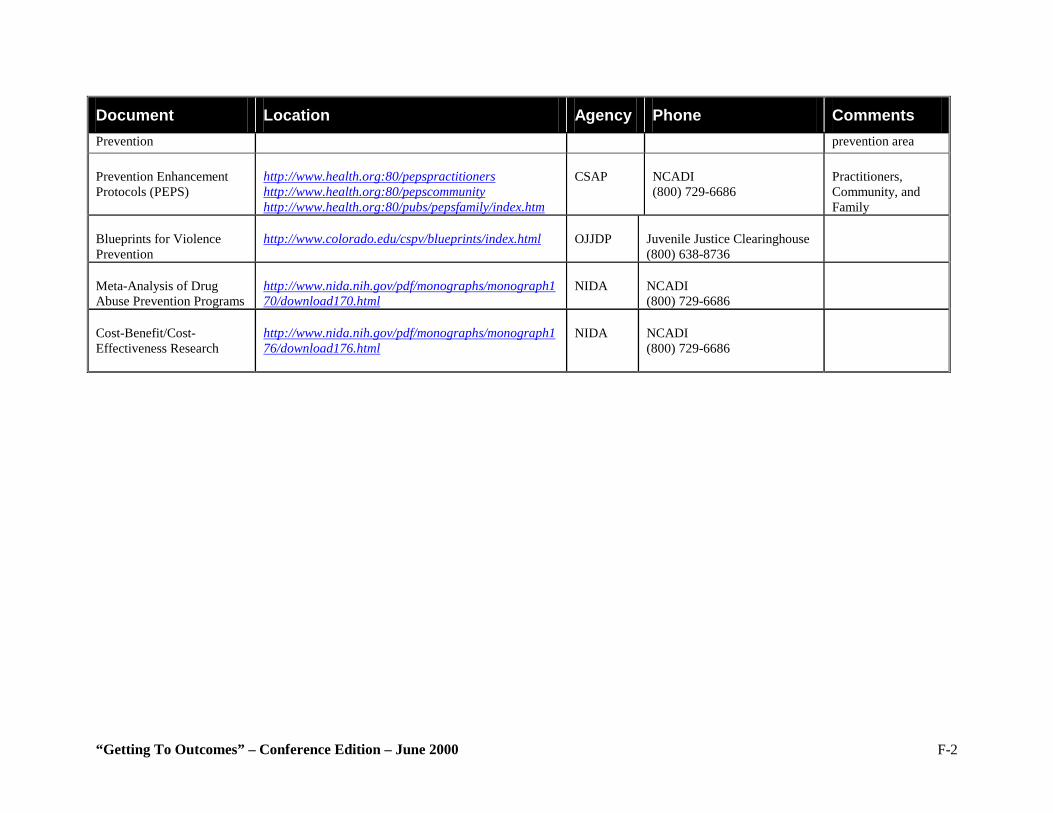
“Getting To Outcomes” – Conference Edition – June 2000 F-2
Document Location Agency Phone Comments Prevention prevention area Prevention Enhancement Protocols (PEPS)
http://www.health.org:80/pepspractitioners http://www.health.org:80/pepscommunity http://www.health.org:80/pubs/pepsfamily/index.htm
CSAP
NCADI (800) 729-6686
Practitioners, Community, and Family
Blueprints for Violence Prevention
http://www.colorado.edu/cspv/blueprints/index.html
OJJDP
Juvenile Justice Clearinghouse (800) 638-8736
Meta-Analysis of Drug Abuse Prevention Programs
http://www.nida.nih.gov/pdf/monographs/monograph170/download170.html
NIDA
NCADI (800) 729-6686
Cost-Benefit/Cost-Effectiveness Research
http://www.nida.nih.gov/pdf/monographs/monograph176/download176.html
NIDA
NCADI (800) 729-6686
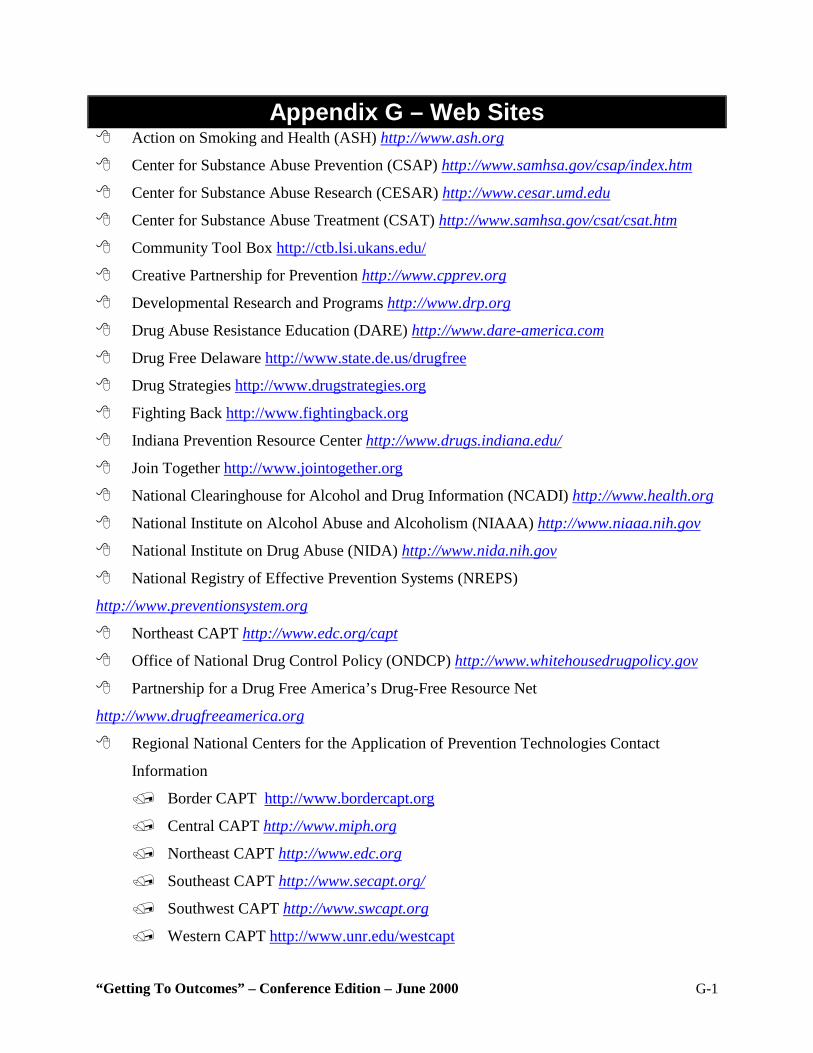
“Getting To Outcomes” – Conference Edition – June 2000 G-1
Appendix G – Web Sites $ Action on Smoking and Health (ASH) http://www.ash.org
$ Center for Substance Abuse Prevention (CSAP) http://www.samhsa.gov/csap/index.htm
$ Center for Substance Abuse Research (CESAR) http://www.cesar.umd.edu
$ Center for Substance Abuse Treatment (CSAT) http://www.samhsa.gov/csat/csat.htm
$ Community Tool Box http://ctb.lsi.ukans.edu/
$ Creative Partnership for Prevention http://www.cpprev.org
$ Developmental Research and Programs http://www.drp.org
$ Drug Abuse Resistance Education (DARE) http://www.dare-america.com
$ Drug Free Delaware http://www.state.de.us/drugfree
$ Drug Strategies http://www.drugstrategies.org
$ Fighting Back http://www.fightingback.org
$ Indiana Prevention Resource Center http://www.drugs.indiana.edu/
$ Join Together http://www.jointogether.org
$ National Clearinghouse for Alcohol and Drug Information (NCADI) http://www.health.org
$ National Institute on Alcohol Abuse and Alcoholism (NIAAA) http://www.niaaa.nih.gov
$ National Institute on Drug Abuse (NIDA) http://www.nida.nih.gov
$ National Registry of Effective Prevention Systems (NREPS)
http://www.preventionsystem.org
$ Northeast CAPT http://www.edc.org/capt
$ Office of National Drug Control Policy (ONDCP) http://www.whitehousedrugpolicy.gov
$ Partnership for a Drug Free America’s Drug-Free Resource Net
http://www.drugfreeamerica.org
$ Regional National Centers for the Application of Prevention Technologies Contact
Information
% Border CAPT http://www.bordercapt.org
% Central CAPT http://www.miph.org
% Northeast CAPT http://www.edc.org
% Southeast CAPT http://www.secapt.org/
% Southwest CAPT http://www.swcapt.org
% Western CAPT http://www.unr.edu/westcapt
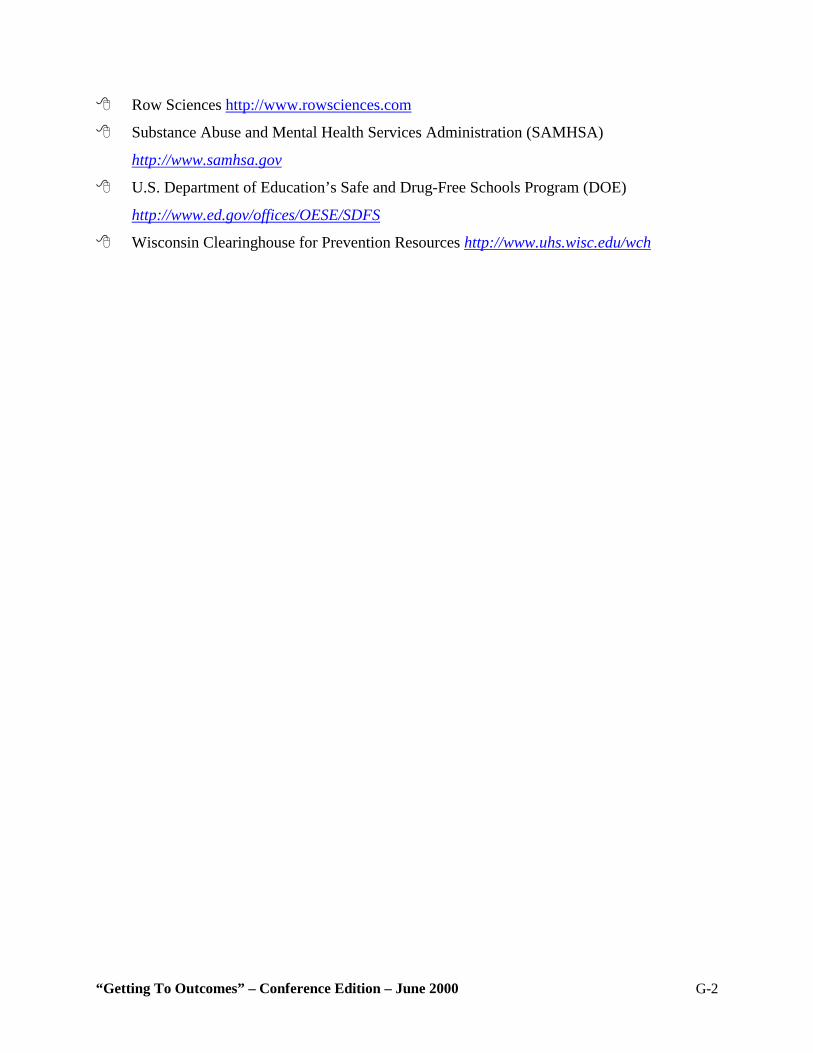
“Getting To Outcomes” – Conference Edition – June 2000 G-2
$ Row Sciences http://www.rowsciences.com
$ Substance Abuse and Mental Health Services Administration (SAMHSA)
http://www.samhsa.gov
$ U.S. Department of Education’s Safe and Drug-Free Schools Program (DOE)
http://www.ed.gov/offices/OESE/SDFS
$ Wisconsin Clearinghouse for Prevention Resources http://www.uhs.wisc.edu/wch
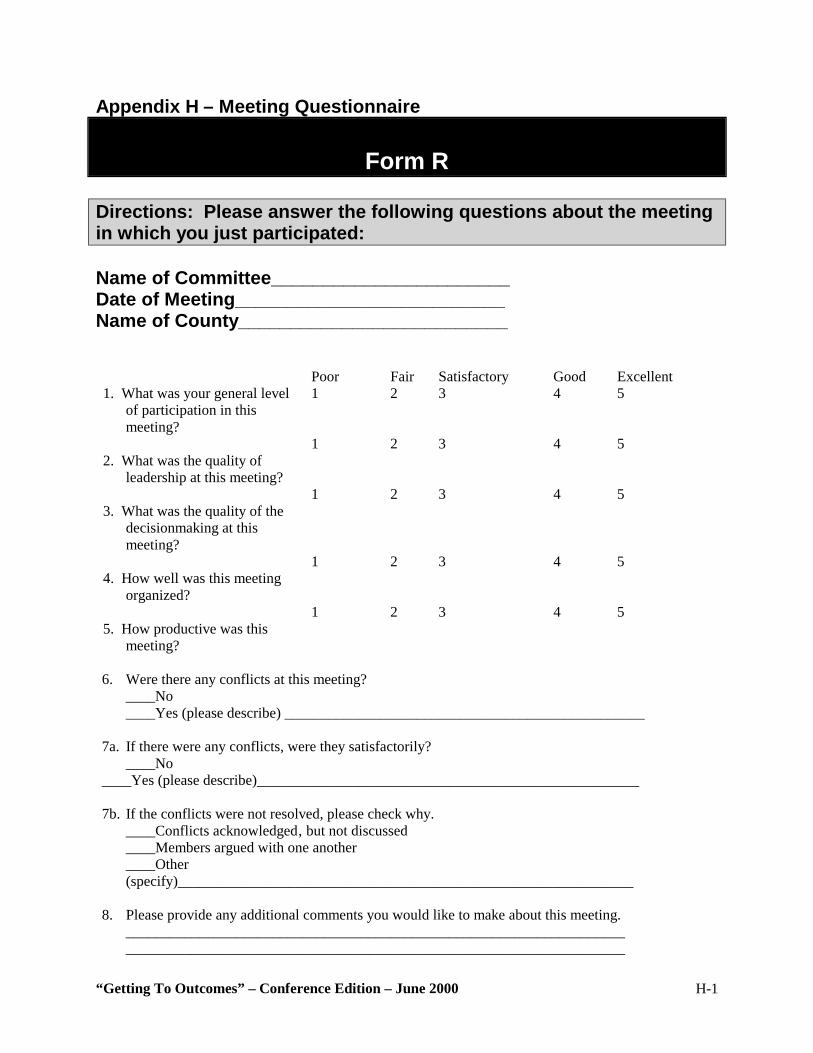
“Getting To Outcomes” – Conference Edition – June 2000 H-1
Appendix H – Meeting Questionnaire
Form R
Directions: Please answer the following questions about the meeting in which you just participated: Name of Committee_______________________ Date of Meeting__________________________ Name of County__________________________ Poor Fair Satisfactory Good Excellent 1. What was your general level
of participation in this meeting?
1 2 3 4 5
2. What was the quality of
leadership at this meeting?
1 2 3 4 5
3. What was the quality of the
decisionmaking at this meeting?
1 2 3 4 5
4. How well was this meeting
organized?
1 2 3 4 5
5. How productive was this
meeting?
1 2 3 4 5
6. Were there any conflicts at this meeting? ____No ____Yes (please describe) _________________________________________________ 7a. If there were any conflicts, were they satisfactorily? ____No ____Yes (please describe)____________________________________________________ 7b. If the conflicts were not resolved, please check why. ____Conflicts acknowledged‚ but not discussed ____Members argued with one another ____Other
(specify)______________________________________________________________ 8. Please provide any additional comments you would like to make about this meeting.
____________________________________________________________________ ____________________________________________________________________
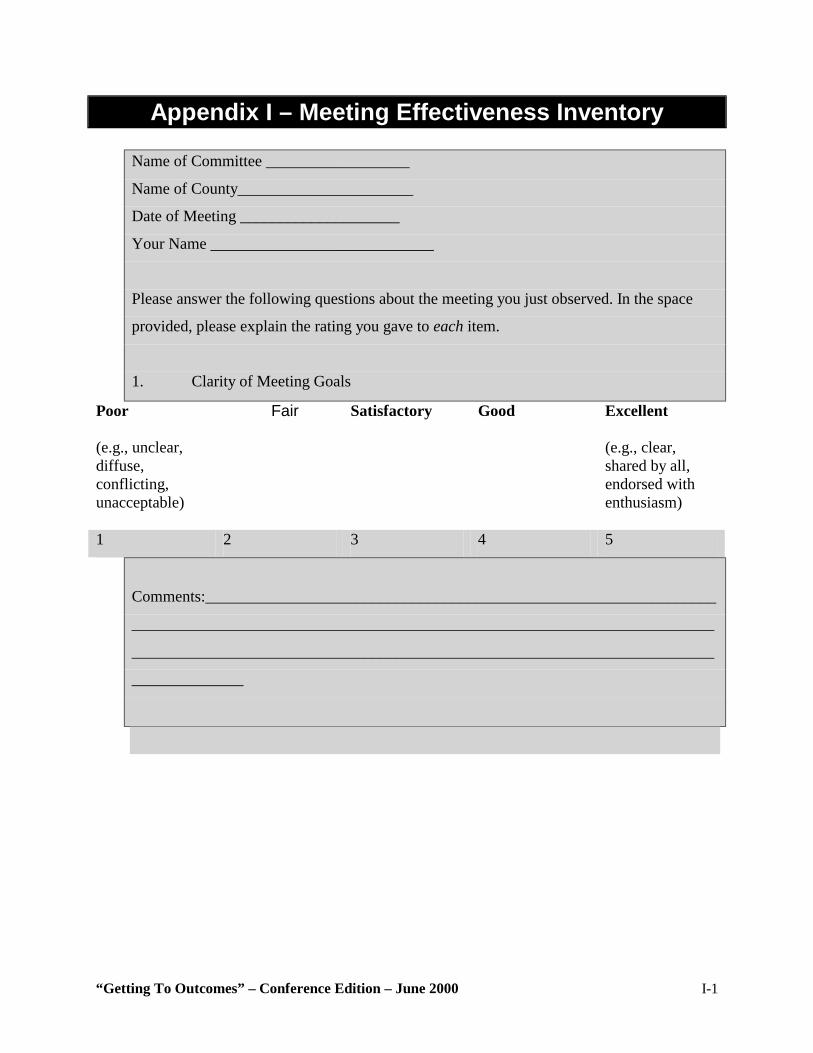
“Getting To Outcomes” – Conference Edition – June 2000 I-1
Appendix I – Meeting Effectiveness Inventory
Name of Committee __________________
Name of County______________________
Date of Meeting ____________________
Your Name ____________________________
Please answer the following questions about the meeting you just observed. In the space
provided, please explain the rating you gave to each item.
1. Clarity of Meeting Goals
Poor (e.g., unclear, diffuse, conflicting, unacceptable)
Fair Satisfactory Good Excellent (e.g., clear, shared by all, endorsed with enthusiasm)
1 2 3 4 5
Comments:________________________________________________________________
_________________________________________________________________________
_________________________________________________________________________
______________
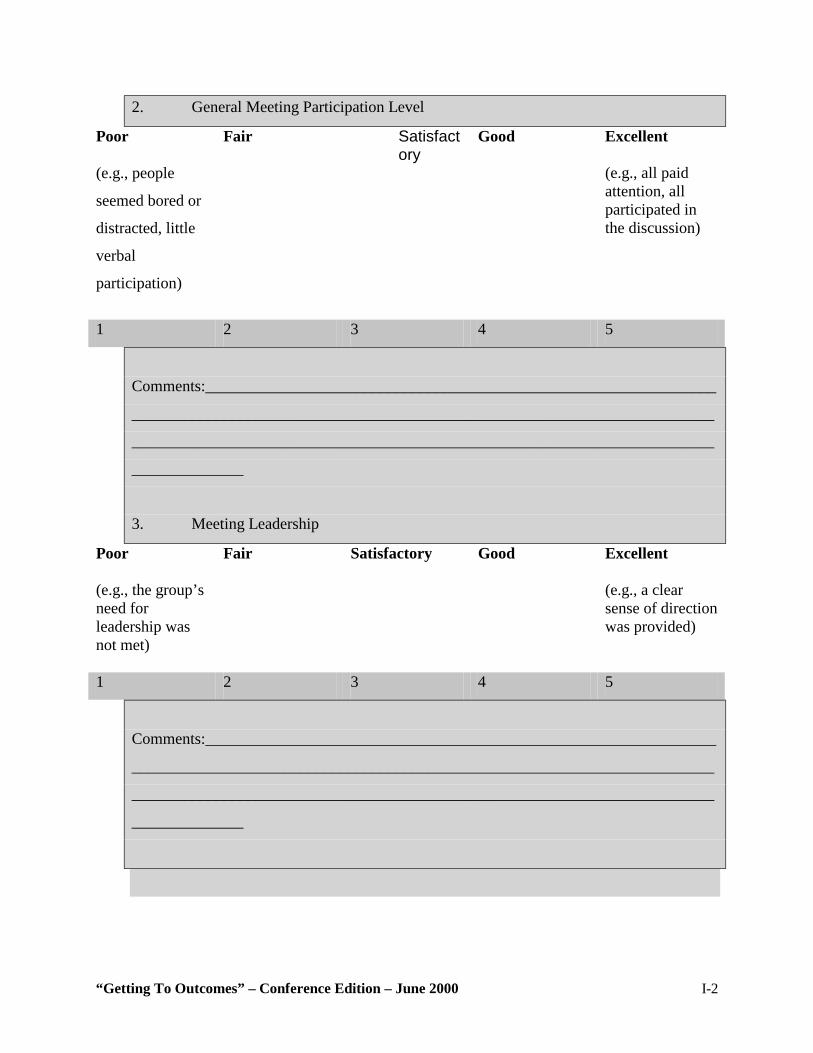
“Getting To Outcomes” – Conference Edition – June 2000 I-2
2. General Meeting Participation Level
Poor (e.g., people
seemed bored or
distracted, little
verbal
participation)
Fair Satisfactory
Good Excellent (e.g., all paid attention, all participated in the discussion)
1 2 3 4 5
Comments:________________________________________________________________
_________________________________________________________________________
_________________________________________________________________________
______________
3. Meeting Leadership
Poor (e.g., the group’s need for leadership was not met)
Fair Satisfactory Good Excellent (e.g., a clear sense of direction was provided)
1 2 3 4 5
Comments:________________________________________________________________
_________________________________________________________________________
_________________________________________________________________________
______________
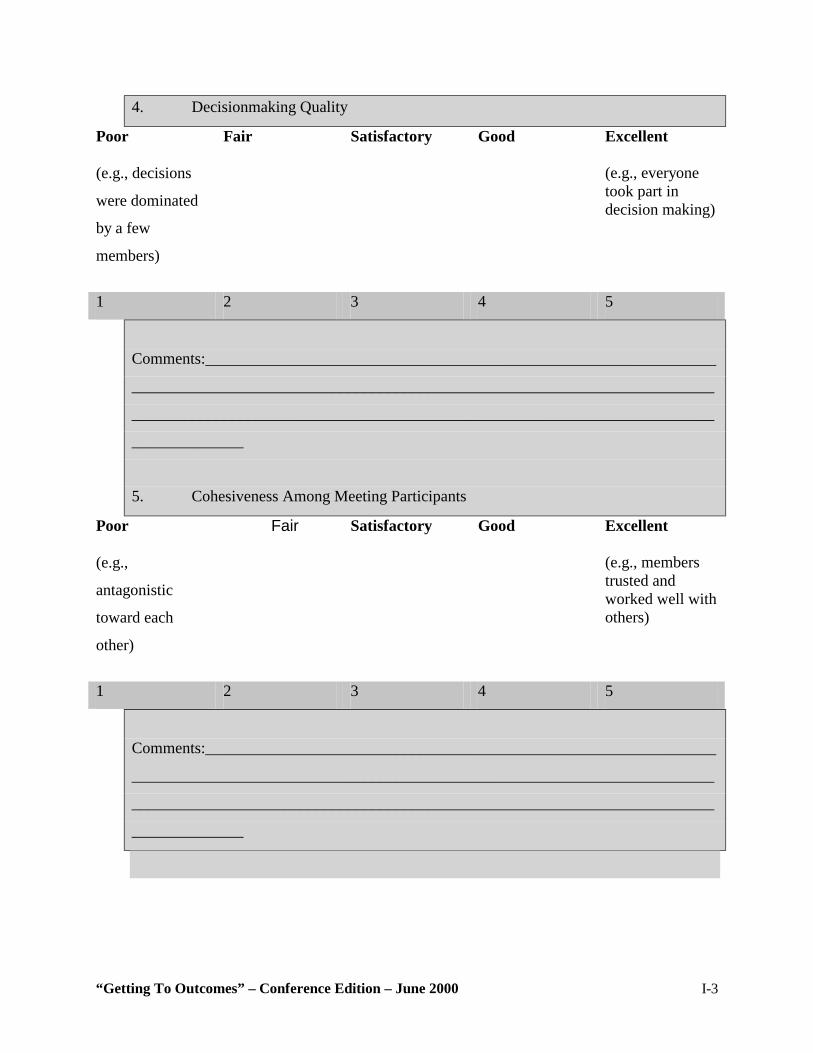
“Getting To Outcomes” – Conference Edition – June 2000 I-3
4. Decisionmaking Quality
Poor (e.g., decisions
were dominated
by a few
members)
Fair Satisfactory Good Excellent (e.g., everyone took part in decision making)
1 2 3 4 5
Comments:________________________________________________________________
_________________________________________________________________________
_________________________________________________________________________
______________
5. Cohesiveness Among Meeting Participants
Poor (e.g.,
antagonistic
toward each
other)
Fair Satisfactory Good Excellent (e.g., members trusted and worked well with others)
1 2 3 4 5
Comments:________________________________________________________________
_________________________________________________________________________
_________________________________________________________________________
______________
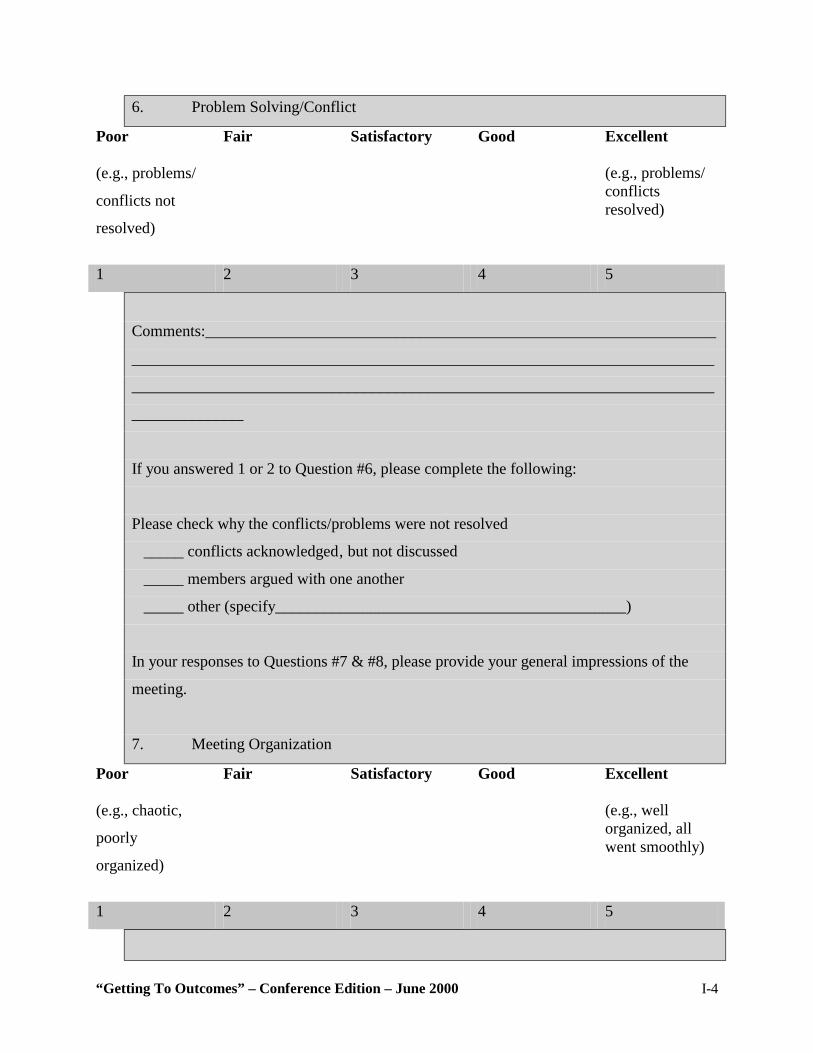
“Getting To Outcomes” – Conference Edition – June 2000 I-4
6. Problem Solving/Conflict
Poor (e.g., problems/
conflicts not
resolved)
Fair Satisfactory Good Excellent (e.g., problems/ conflicts resolved)
1 2 3 4 5
Comments:________________________________________________________________
_________________________________________________________________________
_________________________________________________________________________
______________
If you answered 1 or 2 to Question #6, please complete the following:
Please check why the conflicts/problems were not resolved
_____ conflicts acknowledged‚ but not discussed
_____ members argued with one another
_____ other (specify____________________________________________)
In your responses to Questions #7 & #8, please provide your general impressions of the
meeting.
7. Meeting Organization
Poor (e.g., chaotic,
poorly
organized)
Fair Satisfactory Good Excellent (e.g., well organized, all went smoothly)
1 2 3 4 5
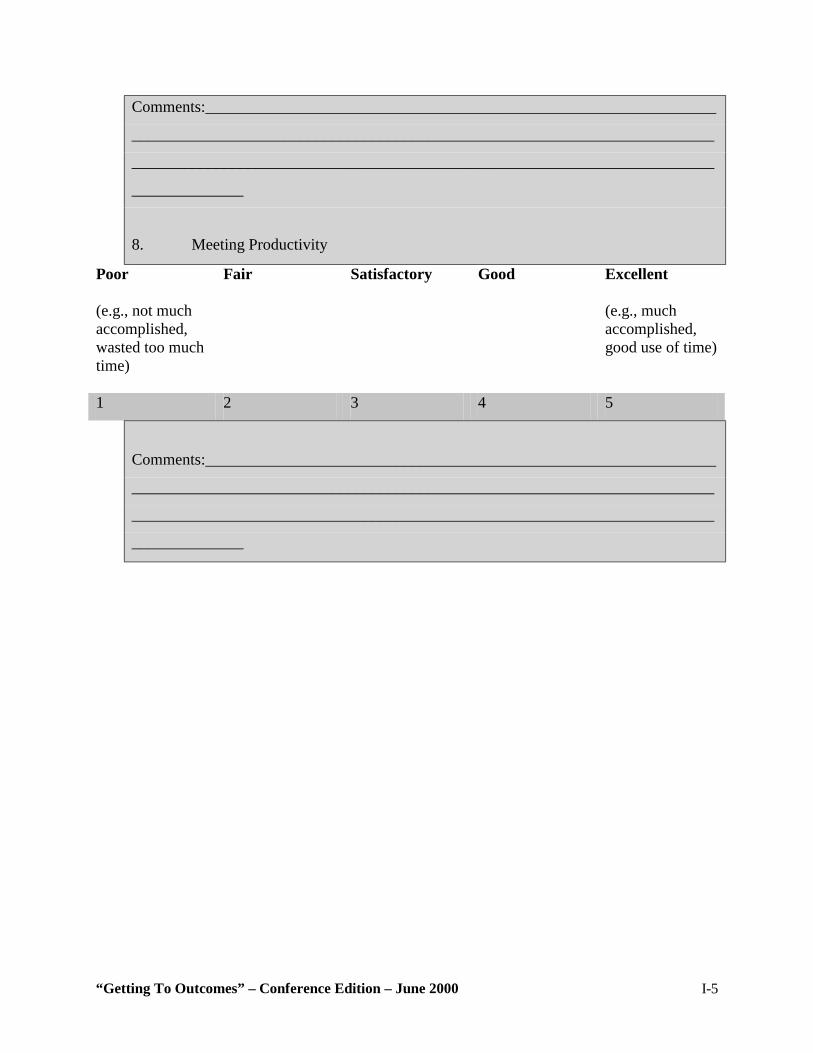
“Getting To Outcomes” – Conference Edition – June 2000 I-5
Comments:________________________________________________________________
_________________________________________________________________________
_________________________________________________________________________
______________
8. Meeting Productivity
Poor (e.g., not much accomplished, wasted too much time)
Fair Satisfactory Good Excellent (e.g., much accomplished, good use of time)
1 2 3 4 5
Comments:________________________________________________________________
_________________________________________________________________________
_________________________________________________________________________
______________
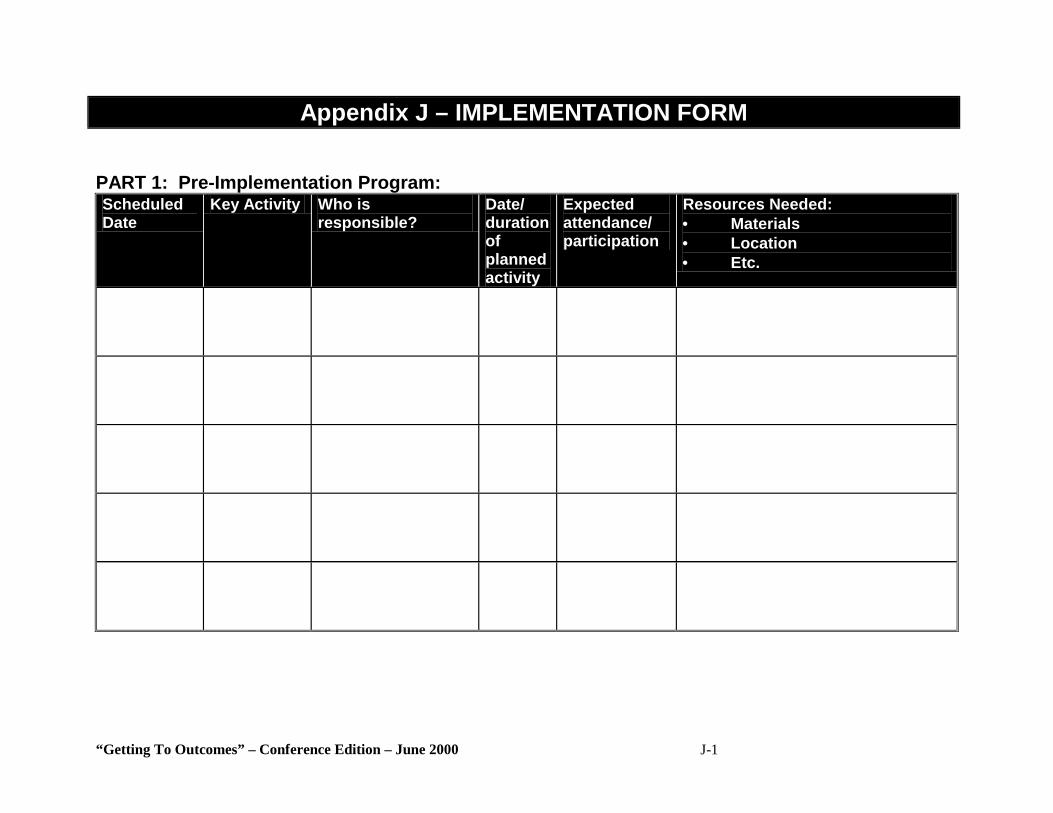
“Getting To Outcomes” – Conference Edition – June 2000 J-1
Appendix J – IMPLEMENTATION FORM PART 1: Pre-Implementation Program: Scheduled Date
Key Activity Who is responsible?
Date/ duration of planned activity
Expected attendance/ participation
Resources Needed: • Materials • Location • Etc.
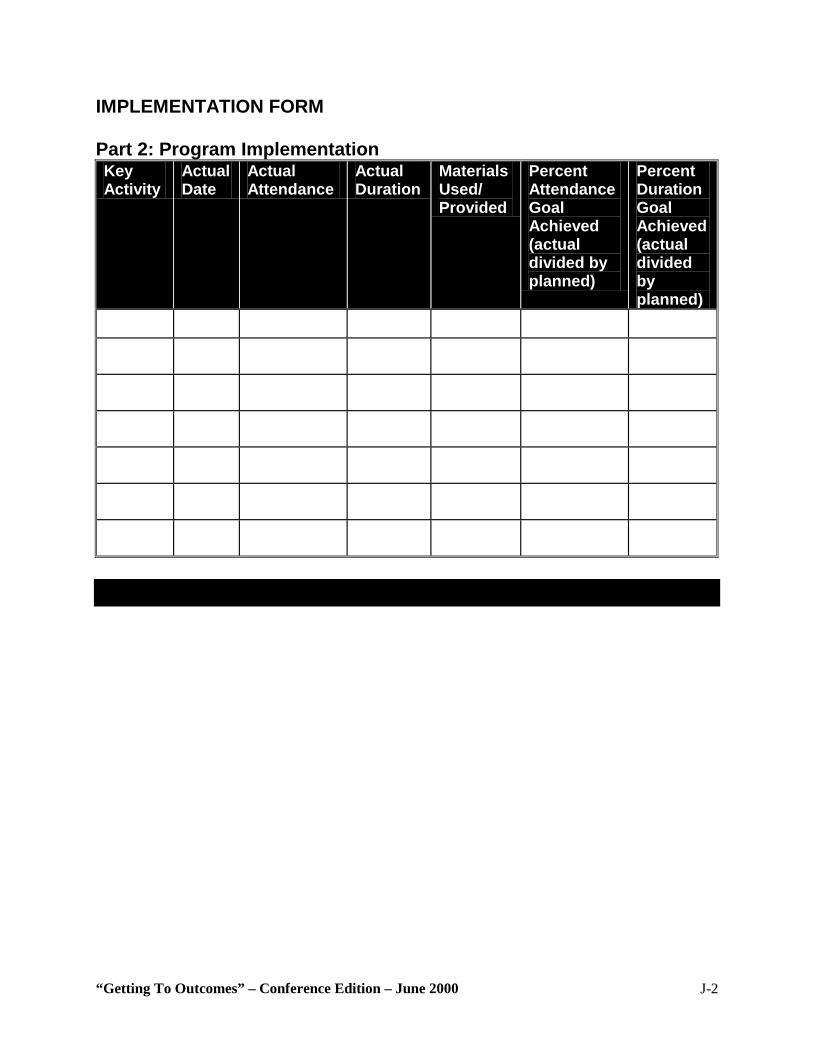
“Getting To Outcomes” – Conference Edition – June 2000 J-2
IMPLEMENTATION FORM Part 2: Program Implementation Key Activity
Actual Date
Actual Attendance
Actual Duration
Materials Used/ Provided
Percent Attendance Goal Achieved (actual divided by planned)
Percent Duration Goal Achieved (actual divided by planned)
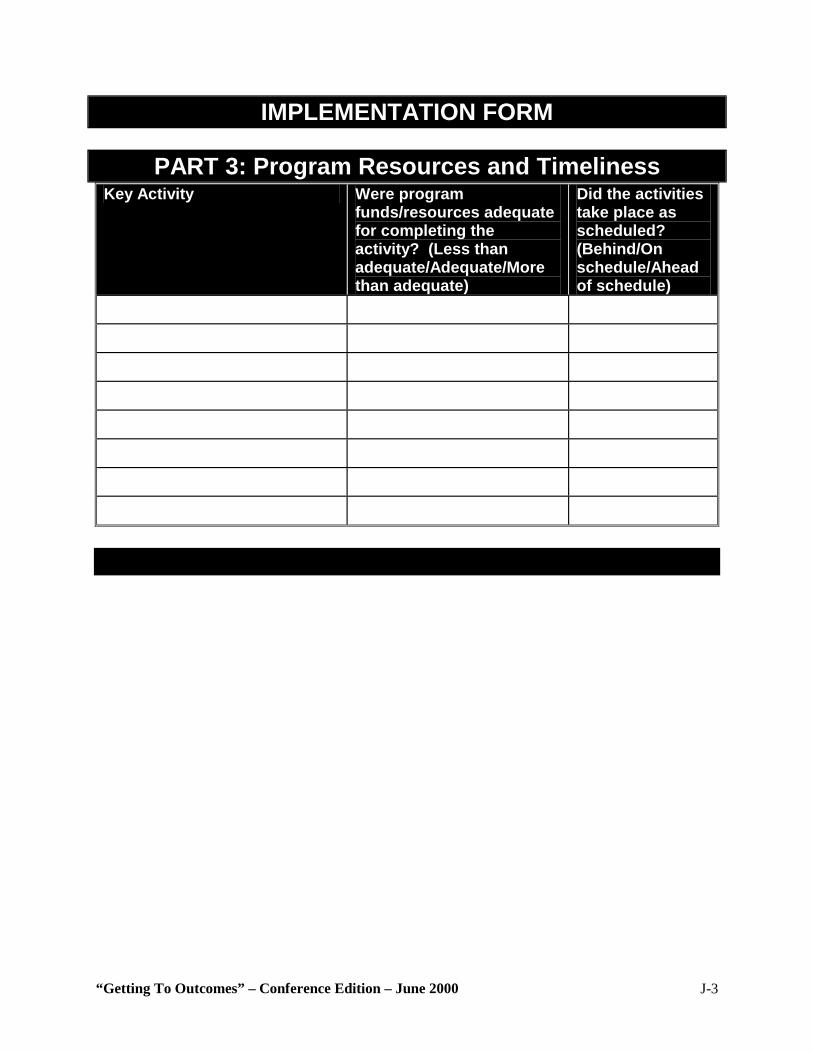
“Getting To Outcomes” – Conference Edition – June 2000 J-3
IMPLEMENTATION FORM
PART 3: Program Resources and Timeliness Key Activity Were program
funds/resources adequate for completing the activity? (Less than adequate/Adequate/More than adequate)
Did the activities take place as scheduled? (Behind/On schedule/Ahead of schedule)
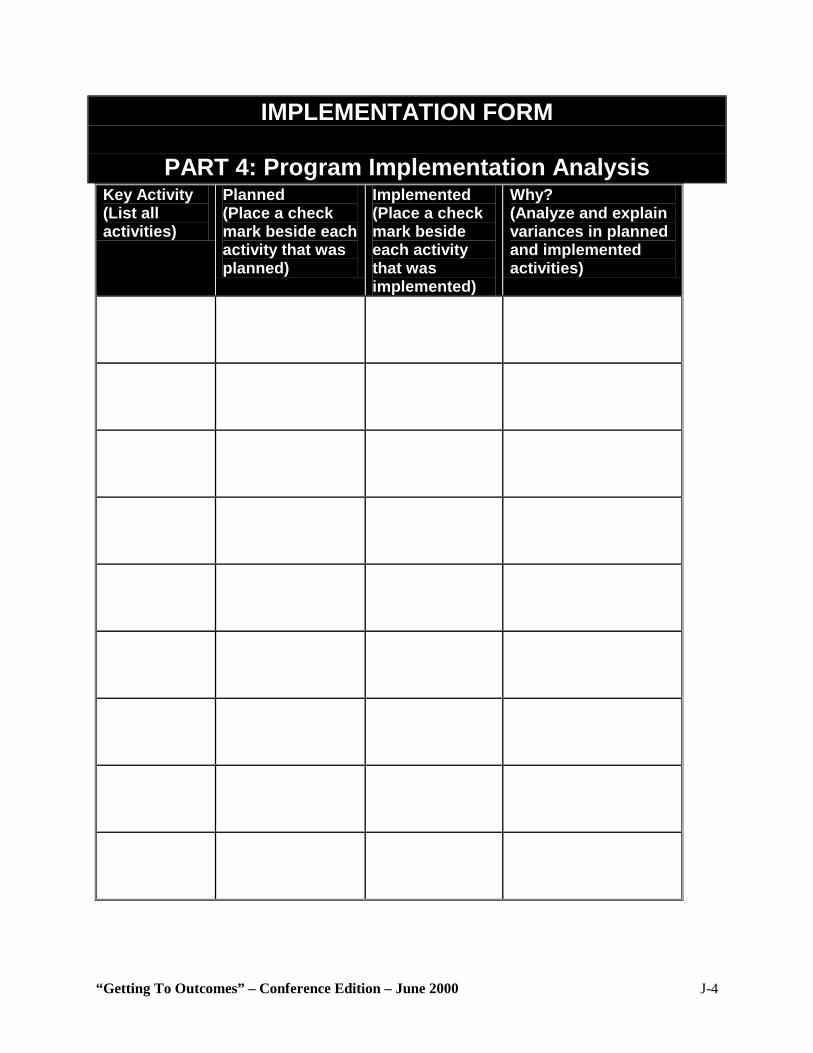
“Getting To Outcomes” – Conference Edition – June 2000 J-4
IMPLEMENTATION FORM
PART 4: Program Implementation Analysis Key Activity (List all activities)
Planned (Place a check mark beside each activity that was planned)
Implemented (Place a check mark beside each activity that was implemented)
Why? (Analyze and explain variances in planned and implemented activities)
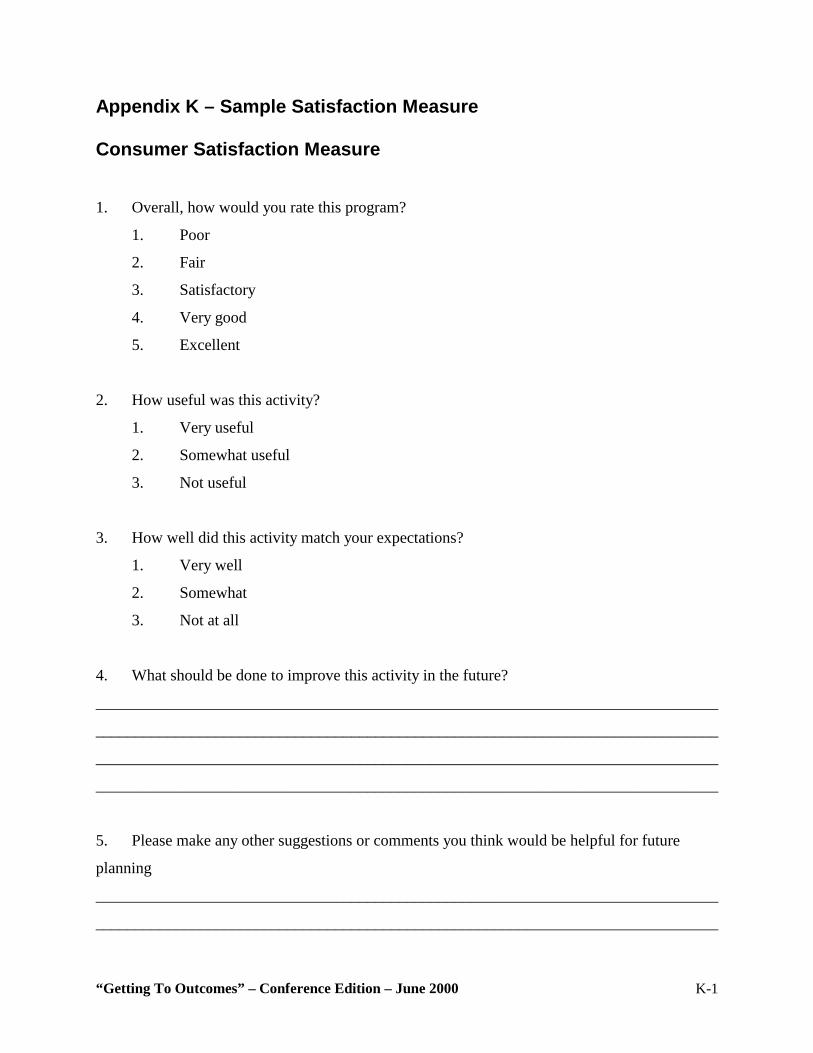
“Getting To Outcomes” – Conference Edition – June 2000 K-1
Appendix K – Sample Satisfaction Measure
Consumer Satisfaction Measure
1. Overall, how would you rate this program?
1. Poor
2. Fair
3. Satisfactory
4. Very good
5. Excellent
2. How useful was this activity?
1. Very useful
2. Somewhat useful
3. Not useful
3. How well did this activity match your expectations?
1. Very well
2. Somewhat
3. Not at all
4. What should be done to improve this activity in the future?
______________________________________________________________________________
______________________________________________________________________________
______________________________________________________________________________
______________________________________________________________________________
5. Please make any other suggestions or comments you think would be helpful for future
planning
______________________________________________________________________________
______________________________________________________________________________
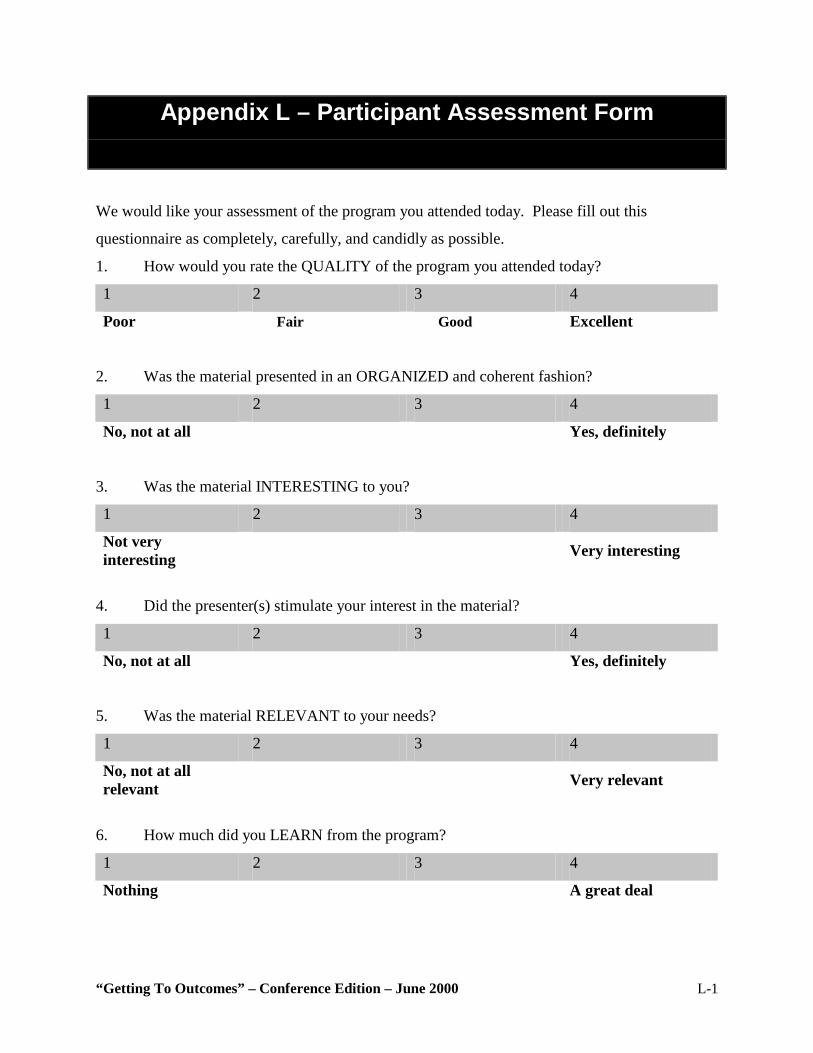
“Getting To Outcomes” – Conference Edition – June 2000 L-1
Appendix L – Participant Assessment Form
We would like your assessment of the program you attended today. Please fill out this
questionnaire as completely, carefully, and candidly as possible.
1. How would you rate the QUALITY of the program you attended today?
1 2 3 4
Poor Fair Good Excellent
2. Was the material presented in an ORGANIZED and coherent fashion?
1 2 3 4
No, not at all Yes, definitely
3. Was the material INTERESTING to you?
1 2 3 4
Not very interesting Very interesting
4. Did the presenter(s) stimulate your interest in the material?
1 2 3 4
No, not at all Yes, definitely
5. Was the material RELEVANT to your needs?
1 2 3 4
No, not at all relevant Very relevant
6. How much did you LEARN from the program?
1 2 3 4
Nothing A great deal
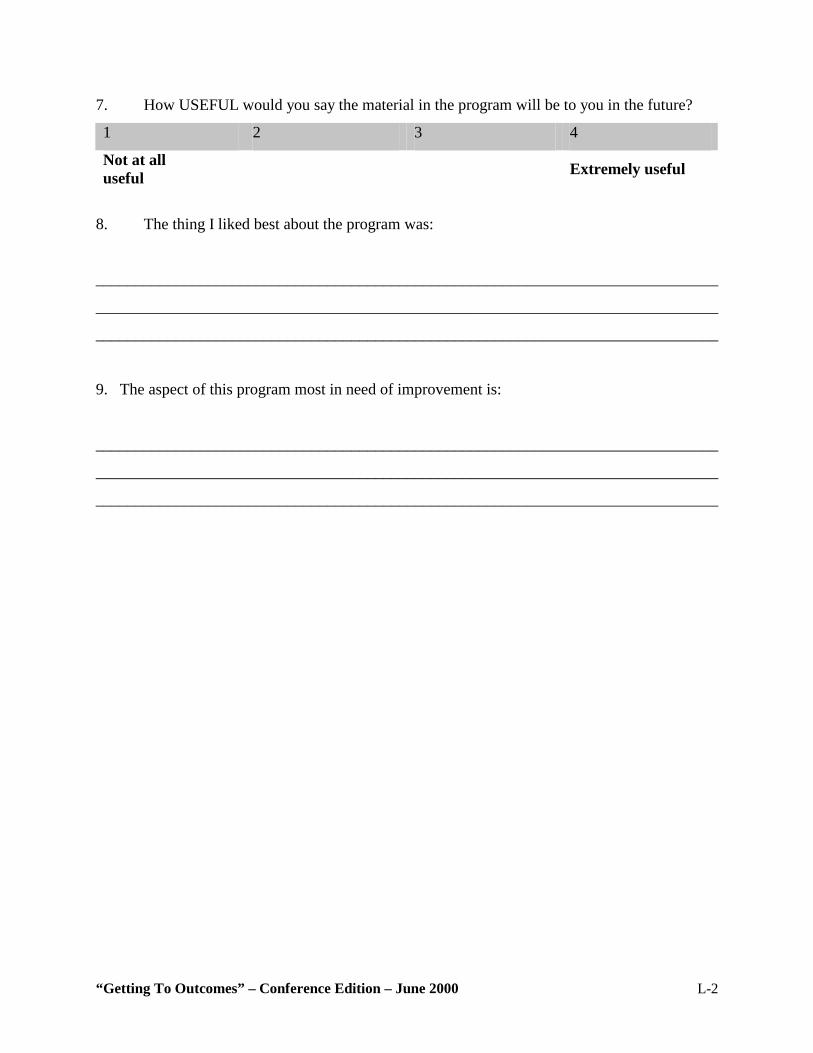
“Getting To Outcomes” – Conference Edition – June 2000 L-2
7. How USEFUL would you say the material in the program will be to you in the future?
1 2 3 4
Not at all useful Extremely useful
8. The thing I liked best about the program was:
______________________________________________________________________________
______________________________________________________________________________
______________________________________________________________________________
9. The aspect of this program most in need of improvement is:
______________________________________________________________________________
______________________________________________________________________________
______________________________________________________________________________
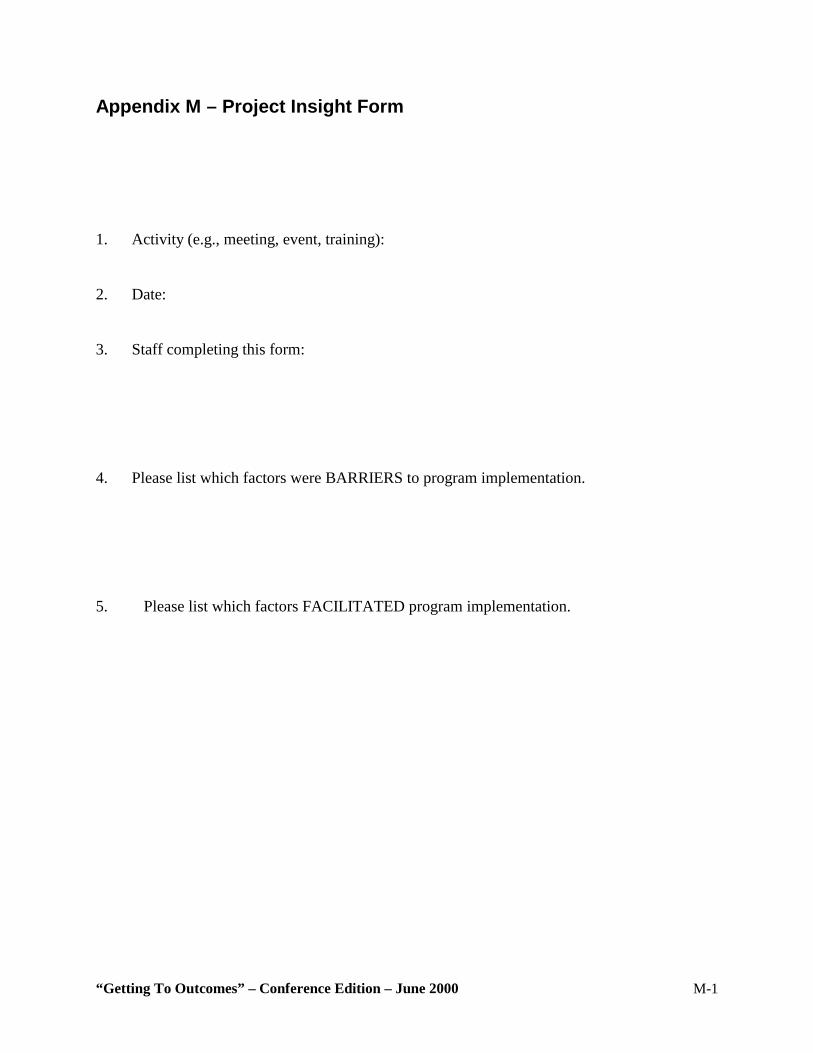
“Getting To Outcomes” – Conference Edition – June 2000 M-1
Appendix M – Project Insight Form 1. Activity (e.g., meeting, event, training): 2. Date: 3. Staff completing this form: 4. Please list which factors were BARRIERS to program implementation. 5. Please list which factors FACILITATED program implementation.
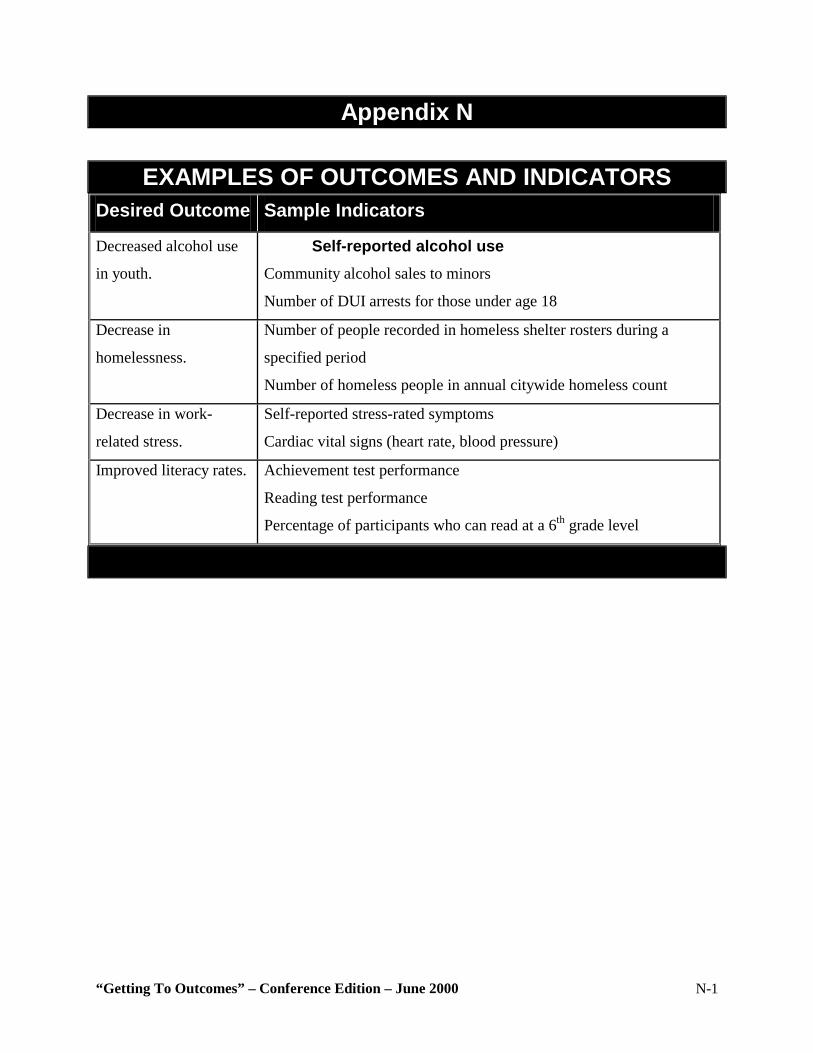
“Getting To Outcomes” – Conference Edition – June 2000 N-1
Appendix N
EXAMPLES OF OUTCOMES AND INDICATORS Desired Outcome Sample Indicators
Decreased alcohol use
in youth.
Self-reported alcohol use Community alcohol sales to minors
Number of DUI arrests for those under age 18
Decrease in
homelessness.
Number of people recorded in homeless shelter rosters during a
specified period
Number of homeless people in annual citywide homeless count
Decrease in work-
related stress.
Self-reported stress-rated symptoms
Cardiac vital signs (heart rate, blood pressure)
Improved literacy rates. Achievement test performance
Reading test performance
Percentage of participants who can read at a 6th grade level
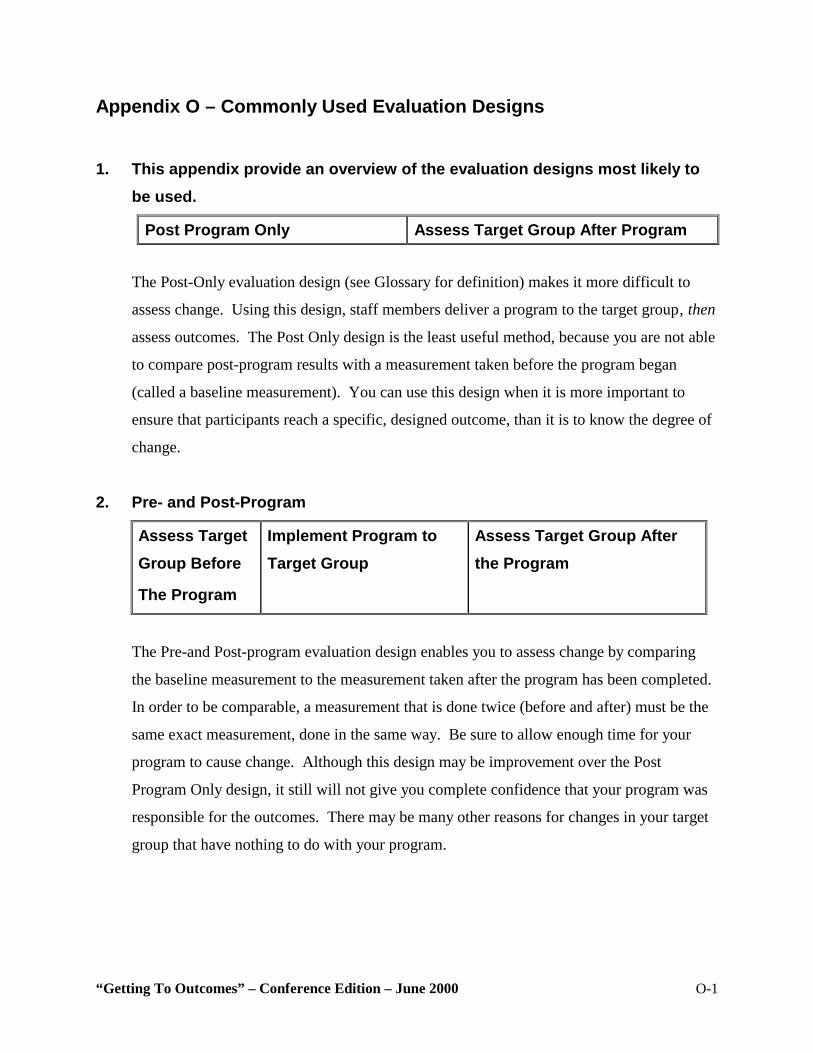
“Getting To Outcomes” – Conference Edition – June 2000 O-1
Appendix O – Commonly Used Evaluation Designs 1. This appendix provide an overview of the evaluation designs most likely to
be used.
Post Program Only Assess Target Group After Program
The Post-Only evaluation design (see Glossary for definition) makes it more difficult to
assess change. Using this design, staff members deliver a program to the target group‚ then
assess outcomes. The Post Only design is the least useful method, because you are not able
to compare post-program results with a measurement taken before the program began
(called a baseline measurement). You can use this design when it is more important to
ensure that participants reach a specific, designed outcome, than it is to know the degree of
change.
2. Pre- and Post-Program
Assess Target Group Before
The Program
Implement Program to Target Group
Assess Target Group After the Program
The Pre-and Post-program evaluation design enables you to assess change by comparing
the baseline measurement to the measurement taken after the program has been completed.
In order to be comparable, a measurement that is done twice (before and after) must be the
same exact measurement, done in the same way. Be sure to allow enough time for your
program to cause change. Although this design may be improvement over the Post
Program Only design, it still will not give you complete confidence that your program was
responsible for the outcomes. There may be many other reasons for changes in your target
group that have nothing to do with your program.
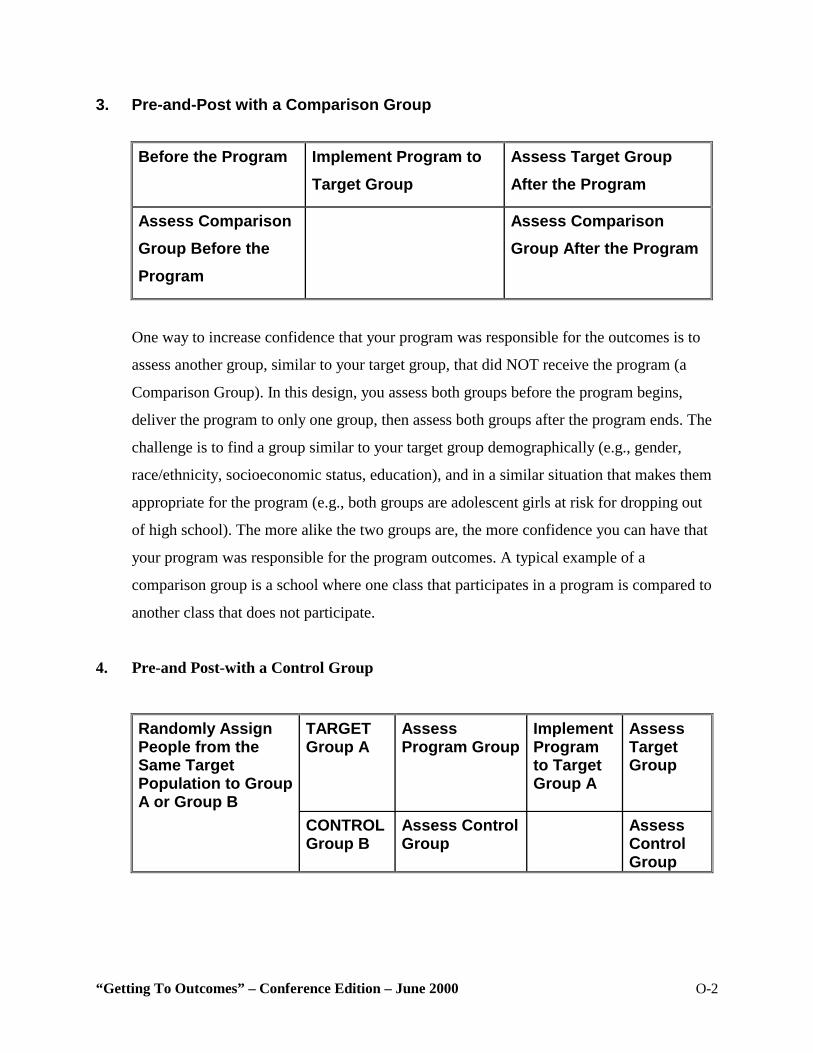
“Getting To Outcomes” – Conference Edition – June 2000 O-2
3. Pre-and-Post with a Comparison Group
Before the Program Implement Program to Target Group
Assess Target Group After the Program
Assess Comparison Group Before the Program
Assess Comparison Group After the Program
One way to increase confidence that your program was responsible for the outcomes is to
assess another group, similar to your target group, that did NOT receive the program (a
Comparison Group). In this design, you assess both groups before the program begins,
deliver the program to only one group, then assess both groups after the program ends. The
challenge is to find a group similar to your target group demographically (e.g., gender,
race/ethnicity, socioeconomic status, education), and in a similar situation that makes them
appropriate for the program (e.g., both groups are adolescent girls at risk for dropping out
of high school). The more alike the two groups are, the more confidence you can have that
your program was responsible for the program outcomes. A typical example of a
comparison group is a school where one class that participates in a program is compared to
another class that does not participate.
4. Pre-and Post-with a Control Group
Randomly Assign People from the Same Target Population to Group A or Group B
TARGET Group A
Assess Program Group
Implement Program to Target Group A
Assess Target Group
CONTROL Group B
Assess Control Group
Assess Control Group
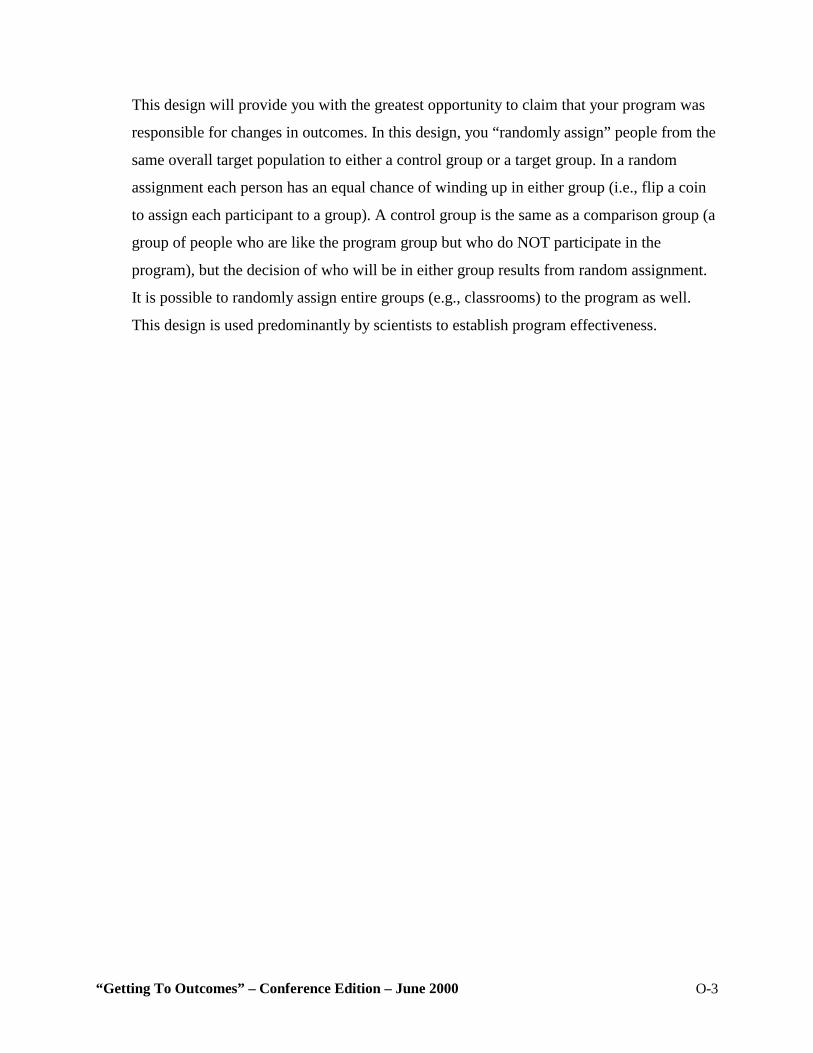
“Getting To Outcomes” – Conference Edition – June 2000 O-3
This design will provide you with the greatest opportunity to claim that your program was
responsible for changes in outcomes. In this design, you “randomly assign” people from the
same overall target population to either a control group or a target group. In a random
assignment each person has an equal chance of winding up in either group (i.e., flip a coin
to assign each participant to a group). A control group is the same as a comparison group (a
group of people who are like the program group but who do NOT participate in the
program), but the decision of who will be in either group results from random assignment.
It is possible to randomly assign entire groups (e.g., classrooms) to the program as well.
This design is used predominantly by scientists to establish program effectiveness.
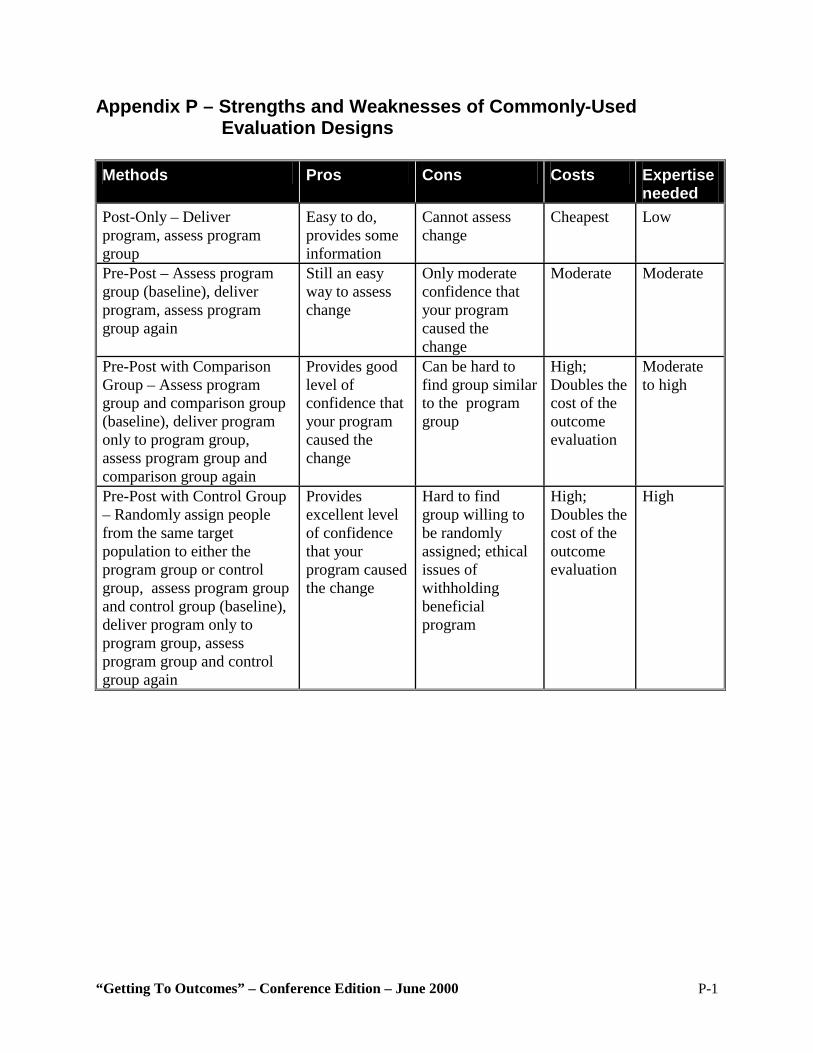
“Getting To Outcomes” – Conference Edition – June 2000 P-1
Appendix P – Strengths and Weaknesses of Commonly-Used Evaluation Designs
Methods Pros Cons Costs Expertise
needed Post-Only – Deliver program, assess program group
Easy to do, provides some information
Cannot assess change
Cheapest
Low
Pre-Post – Assess program group (baseline), deliver program, assess program group again
Still an easy way to assess change
Only moderate confidence that your program caused the change
Moderate Moderate
Pre-Post with Comparison Group – Assess program group and comparison group (baseline), deliver program only to program group, assess program group and comparison group again
Provides good level of confidence that your program caused the change
Can be hard to find group similar to the program group
High; Doubles the cost of the outcome evaluation
Moderate to high
Pre-Post with Control Group – Randomly assign people from the same target population to either the program group or control group, assess program group and control group (baseline), deliver program only to program group, assess program group and control group again
Provides excellent level of confidence that your program caused the change
Hard to find group willing to be randomly assigned; ethical issues of withholding beneficial program
High; Doubles the cost of the outcome evaluation
High
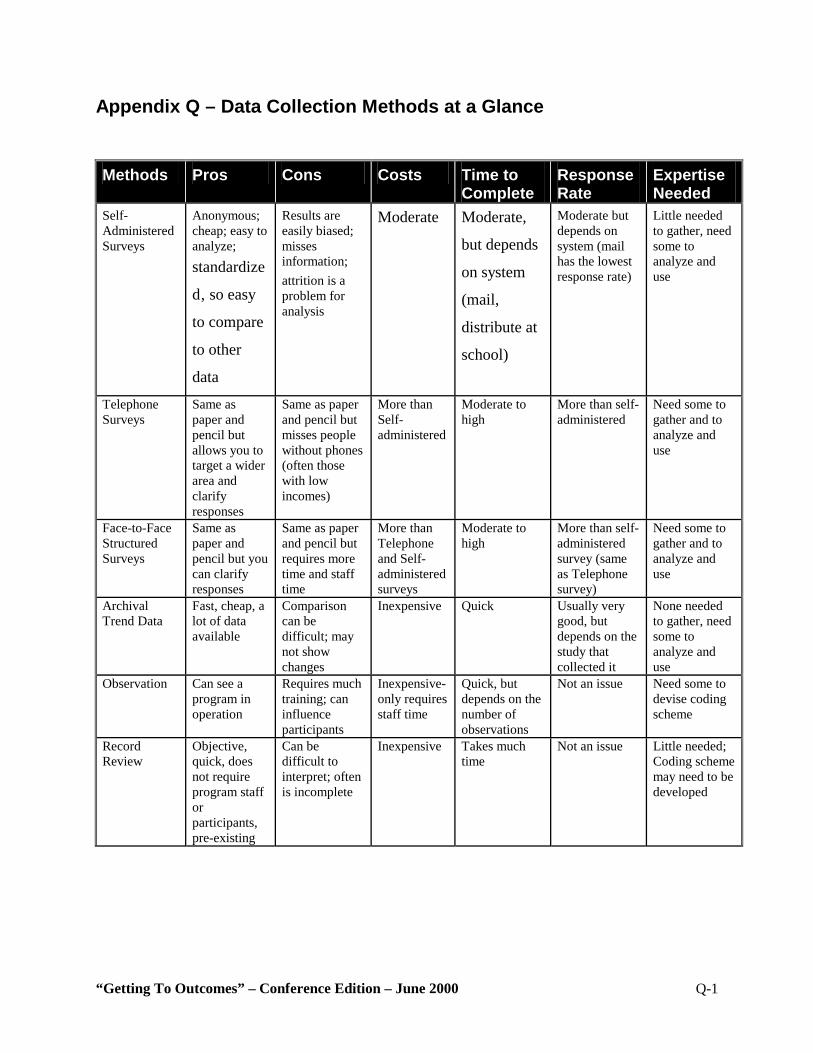
“Getting To Outcomes” – Conference Edition – June 2000 Q-1
Appendix Q – Data Collection Methods at a Glance
Methods Pros Cons Costs Time to Complete
Response Rate
Expertise Needed
Self-Administered Surveys
Anonymous; cheap; easy to analyze; standardize
d‚ so easy
to compare
to other
data
Results are easily biased; misses information; attrition is a problem for analysis
Moderate Moderate,
but depends
on system
(mail,
distribute at
school)
Moderate but depends on system (mail has the lowest response rate)
Little needed to gather, need some to analyze and use
Telephone Surveys
Same as paper and pencil but allows you to target a wider area and clarify responses
Same as paper and pencil but misses people without phones (often those with low incomes)
More than Self-administered
Moderate to high
More than self-administered
Need some to gather and to analyze and use
Face-to-Face Structured Surveys
Same as paper and pencil but you can clarify responses
Same as paper and pencil but requires more time and staff time
More than Telephone and Self-administered surveys
Moderate to high
More than self-administered survey (same as Telephone survey)
Need some to gather and to analyze and use
Archival Trend Data
Fast, cheap, a lot of data available
Comparison can be difficult; may not show changes
Inexpensive Quick Usually very good, but depends on the study that collected it
None needed to gather, need some to analyze and use
Observation Can see a program in operation
Requires much training; can influence participants
Inexpensive- only requires staff time
Quick, but depends on the number of observations
Not an issue Need some to devise coding scheme
Record Review
Objective, quick, does not require program staff or participants, pre-existing
Can be difficult to interpret; often is incomplete
Inexpensive Takes much time
Not an issue Little needed; Coding scheme may need to be developed
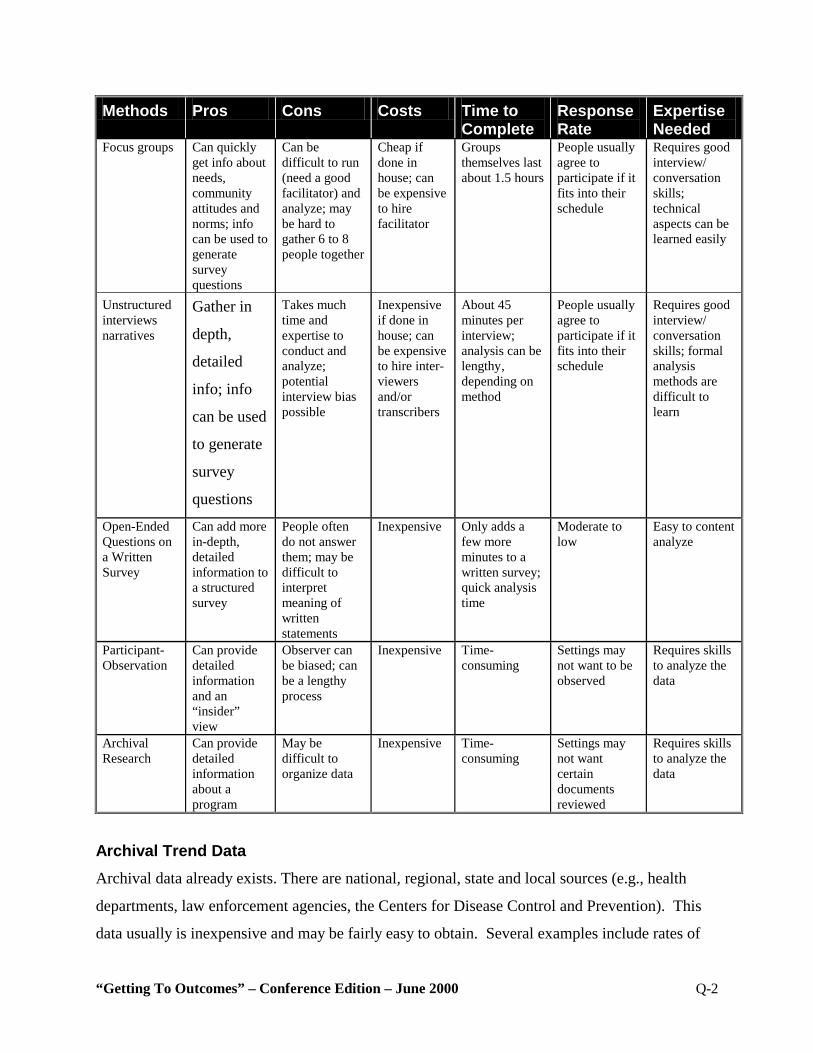
“Getting To Outcomes” – Conference Edition – June 2000 Q-2
Methods Pros Cons Costs Time to Complete
Response Rate
Expertise Needed
Focus groups Can quickly get info about needs, community attitudes and norms; info can be used to generate survey questions
Can be difficult to run (need a good facilitator) and analyze; may be hard to gather 6 to 8 people together
Cheap if done in house; can be expensive to hire facilitator
Groups themselves last about 1.5 hours
People usually agree to participate if it fits into their schedule
Requires good interview/ conversation skills; technical aspects can be learned easily
Unstructured interviews narratives
Gather in
depth,
detailed
info; info
can be used
to generate
survey
questions
Takes much time and expertise to conduct and analyze; potential interview bias possible
Inexpensive if done in house; can be expensive to hire inter-viewers and/or transcribers
About 45 minutes per interview; analysis can be lengthy‚ depending on method
People usually agree to participate if it fits into their schedule
Requires good interview/ conversation skills; formal analysis methods are difficult to learn
Open-Ended Questions on a Written Survey
Can add more in-depth, detailed information to a structured survey
People often do not answer them; may be difficult to interpret meaning of written statements
Inexpensive Only adds a few more minutes to a written survey; quick analysis time
Moderate to low
Easy to content analyze
Participant-Observation
Can provide detailed information and an “insider” view
Observer can be biased; can be a lengthy process
Inexpensive Time-consuming
Settings may not want to be observed
Requires skills to analyze the data
Archival Research
Can provide detailed information about a program
May be difficult to organize data
Inexpensive Time-consuming
Settings may not want certain documents reviewed
Requires skills to analyze the data
Archival Trend Data Archival data already exists. There are national, regional, state and local sources (e.g., health
departments, law enforcement agencies, the Centers for Disease Control and Prevention). This
data usually is inexpensive and may be fairly easy to obtain. Several examples include rates of

“Getting To Outcomes” – Conference Edition – June 2000 Q-3
DUI arrests, unemployment rates, and juvenile drug arrest rates. Many sources can be accessed
using the Internet. However, you may have little choice in the data format since it probably was
collected by someone else for another purpose. It probably will require most quality programs
several years to change archival trend data indicators (if it is even feasible) since archival trend
data usually covers larger groups (e.g.‚ schools, communities, states).
“Getting To Outcomes” – Conference Edition – June 2000 Q-4
Observations Observations involve watching others (usually without their knowledge) and systematically
recording the frequency of their behaviors according to pre-set definitions (e.g., number of times
7th graders in one school expressed anti-smoking sentiments during lunch and recess). This
method requires a great deal of training for observers to be sure each one records behavior in the
same way and to prevent his or her own feelings from influencing the results.
Record Review You can effectively use existing records from different groups or agencies (e.g., medical records
or charts) as a data source. Record reviews usually involve counting the frequency of different
behaviors. One program counted the number of times adolescents who had been arrested for
underage drinking said they had obtained the alcohol by using false identification.
Focus Groups Focus groups typically are used for collecting background information on a subject, creating new
ideas and hypotheses, assessing how a program is working, or helping to interpret the results
from other data sources. “The contemporary focus group interview generally involves 6 to 12
individuals who discuss a particular topic under the direction of a moderator who promotes
interaction and assures that the discussion remains on the topic of interest.” (Stewart and
Shamdasani, 1990). Focus groups can provide a quick and inexpensive way to collect
information from a group (as opposed to a one-on-one interview), allow for clarification of
responses, obtain more in-depth information, and create easy-to-understand results. However‚
since focus groups use only a small number of people‚ they may not accurately represent the
larger population. Also, they can be affected by the bias of the moderator and/or the bias of one
or two dominant group members.
Unstructured Interviews Similar to a focus group, but with just one person, an unstructured interview is designed to obtain
very rich and detailed information by using a set of open-ended questions. The interviewer
guides the participant through the questions, but allows the conversation to flow naturally,
encouraging the participant to answer in his or her own words. The interviewer often will ask
“Getting To Outcomes” – Conference Edition – June 2000 Q-5
follow-up questions to clarify responses or get more information. It takes a great deal of skill to
conduct an unstructured interview and analyze the data. It is important to define criteria that
determine who will be interviewed if you decide to use this method for gathering data.
Open-Ended Questions on a Self-Administered Survey Usually at the end of a self-administered survey, participants will be asked to provide written
responses to various open-ended questions. The resultant data can be analyzed similarly to focus
group data. The analysis requires some skill.
Participant-Observation This method involves joining in the process that is being observed to provide more of an
“insider’s” perspective. Participant-observers then record the processes that occur as well as
their own personal reactions to the process. This method produces detailed information, but it
takes time (i.e., to gain trust, to gather enough data). It can be biased by the observer’s personal
feelings. The information is analyzed like focus group data, which requires a fair amount of
skill.
Archival Research (Write a Qualitative Focus) Rather than counting frequencies of behaviors, qualitative archival research involves reviewing
written documents (e.g., meeting minutes, logs, letters, and reports) to get a better understanding
of a program. This method may clarify other quantitative information or create new ideas to
pursue later.
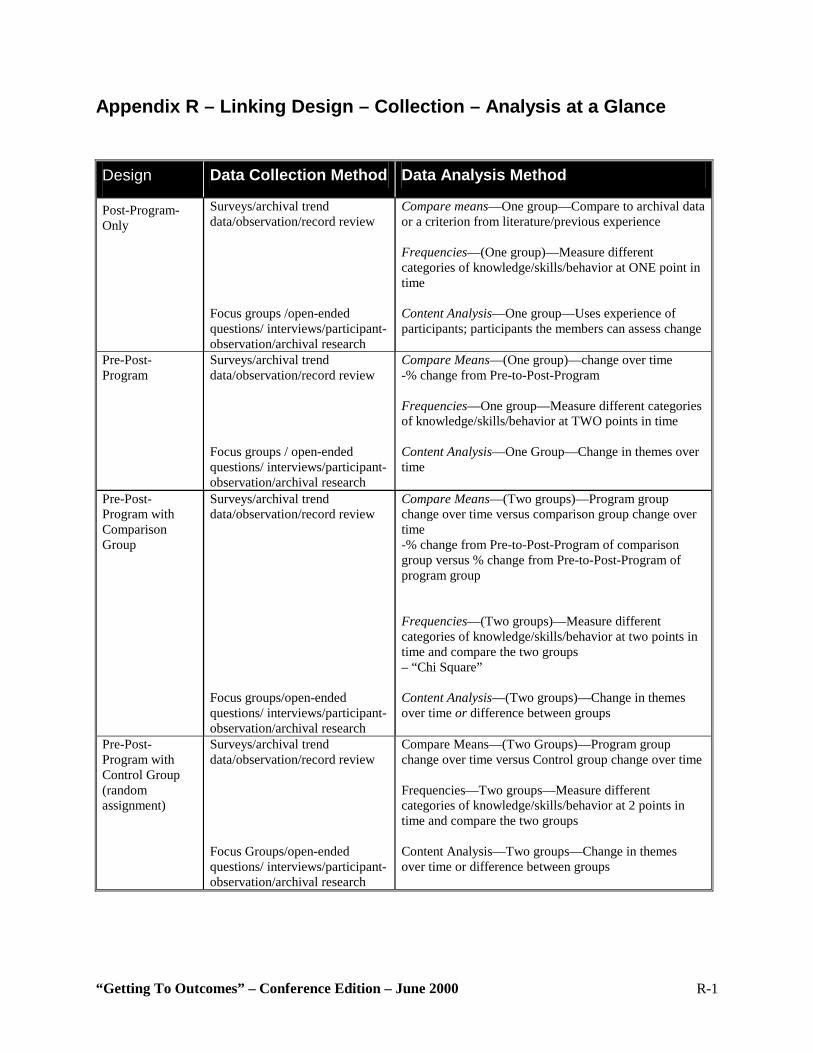
“Getting To Outcomes” – Conference Edition – June 2000 R-1
Appendix R – Linking Design – Collection – Analysis at a Glance
Design Data Collection Method Data Analysis Method
Post-Program-Only
Surveys/archival trend data/observation/record review Focus groups /open-ended questions/ interviews/participant-observation/archival research
Compare means—One group—Compare to archival data or a criterion from literature/previous experience Frequencies—(One group)—Measure different categories of knowledge/skills/behavior at ONE point in time Content Analysis—One group—Uses experience of participants; participants the members can assess change
Pre-Post-Program
Surveys/archival trend data/observation/record review Focus groups / open-ended questions/ interviews/participant-observation/archival research
Compare Means—(One group)—change over time -% change from Pre-to-Post-Program Frequencies—One group—Measure different categories of knowledge/skills/behavior at TWO points in time Content Analysis—One Group—Change in themes over time
Pre-Post-Program with Comparison Group
Surveys/archival trend data/observation/record review Focus groups/open-ended questions/ interviews/participant-observation/archival research
Compare Means—(Two groups)—Program group change over time versus comparison group change over time -% change from Pre-to-Post-Program of comparison group versus % change from Pre-to-Post-Program of program group Frequencies—(Two groups)—Measure different categories of knowledge/skills/behavior at two points in time and compare the two groups – “Chi Square” Content Analysis—(Two groups)—Change in themes over time or difference between groups
Pre-Post-Program with Control Group (random assignment)
Surveys/archival trend data/observation/record review Focus Groups/open-ended questions/ interviews/participant- observation/archival research
Compare Means—(Two Groups)—Program group change over time versus Control group change over time Frequencies—Two groups—Measure different categories of knowledge/skills/behavior at 2 points in time and compare the two groups Content Analysis—Two groups—Change in themes over time or difference between groups
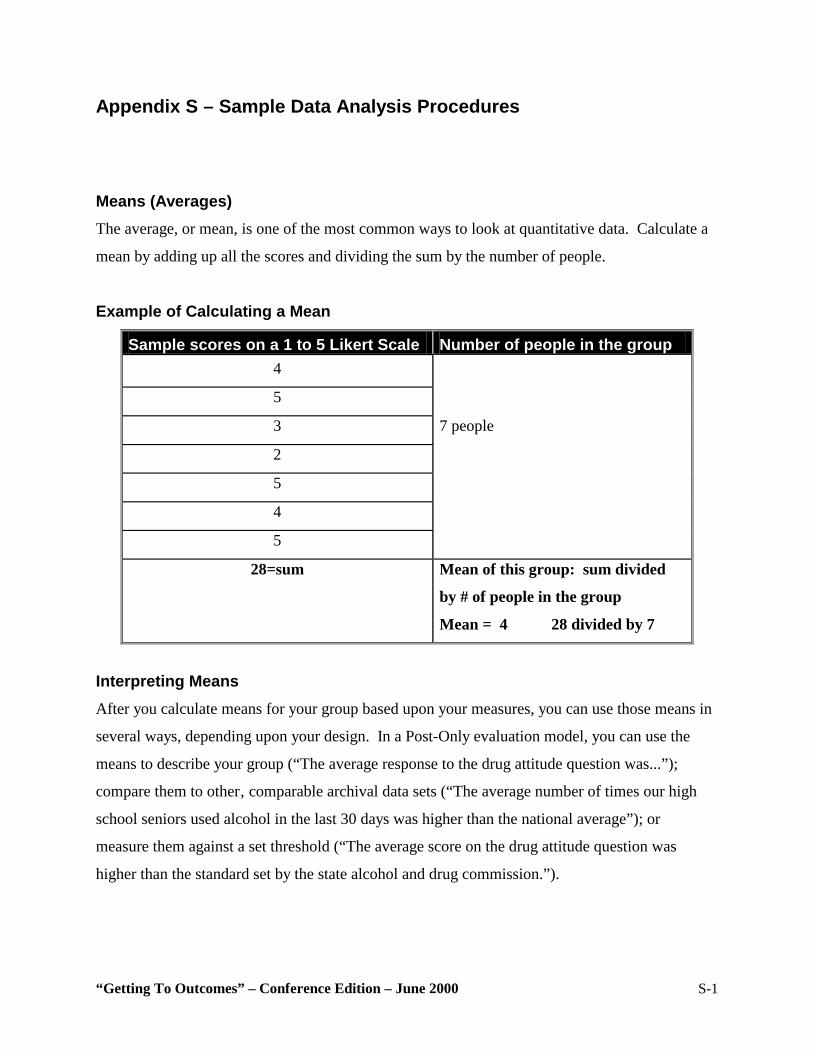
“Getting To Outcomes” – Conference Edition – June 2000 S-1
Appendix S – Sample Data Analysis Procedures Means (Averages) The average, or mean, is one of the most common ways to look at quantitative data. Calculate a
mean by adding up all the scores and dividing the sum by the number of people.
Example of Calculating a Mean
Sample scores on a 1 to 5 Likert Scale Number of people in the group 4
5
3 7 people
2
5
4
5
28=sum Mean of this group: sum divided
by # of people in the group
Mean = 4 28 divided by 7
Interpreting Means After you calculate means for your group based upon your measures, you can use those means in
several ways, depending upon your design. In a Post-Only evaluation model, you can use the
means to describe your group (“The average response to the drug attitude question was...”);
compare them to other‚ comparable archival data sets (“The average number of times our high
school seniors used alcohol in the last 30 days was higher than the national average”); or
measure them against a set threshold (“The average score on the drug attitude question was
higher than the standard set by the state alcohol and drug commission.”).
“Getting To Outcomes” – Conference Edition – June 2000 S-2
If you are doing a Pre-Post evaluation, compare the mean of the Pre-Program with the mean of
the Post-. How much of a change was there between the two? You can calculate the percent
change between the Pre-and Post-Program scores “Students receiving the program improved 40
percent on their ratings of tobacco dangerousness from their Pre-Program measurement to their
Post-Program measurement.” (There is a statistical test called a “T-test” used to see if the
difference is really the result of an identified program. You will probably need outside
consultation for assistance with a T-test.).
If you are doing your evaluation by using either a Pre-Post with Comparison group or a Pre-Post
with Control group model, you will not only want to compare each group from Pre-Program-to-
Post-Program, but you also will want to compare the two against each other. You can do that by
comparing the percent change experienced by the program group to the percent change
experienced by the comparison or control group (“While the comparison group improved 10
percent on their ratings of tobacco dangerousness from their Pre-Program measurement to their
Post-Program measurement, the program group improved 40 percent from their Pre-
measurement to their Post-measurement. This result shows that the program group improved
much more than the comparison group, suggesting that the program is effective”). By doing this
you are answering the question: Which group changed more? (There is a statistical test called
“analysis of variance” or “ANOVA” used to see if the difference is really the result of an
identified program. You will probably need outside consultation to use ANOVA.

“Getting To Outcomes” – Conference Edition – June 2000 Visuals - 1
VISUALS
The Powerpoint Presentation entitled “Getting to Outcomes: Methods and Tools for Self-Evaluation and Accountability” can be downloaded here.
“Getting To Outcomes” – Conference Edition – June 2000 Glossary - 1
GLOSSARY* Accountability The ability to demonstrate to key stakeholders that a program
works, and that it uses its resources effectively to achieve and sustain projected goals and outcomes.
Activities What programs develop and implement to produce desired
outcomes. Archival data Information about ATOD use and trends in national, regional,
state and local repositories (e.g., the Centers for Disease Control and Prevention, county health departments, local law enforcement agencies), which may be useful in establishing baselines against which program effectiveness can be assessed.
Baseline Observations or data about the target area and target
population prior to treatment or intervention, which can be used as a basis for comparison following program implementation.
Best Practice New ideas or lessons learned about effective program
activities that have been developed and implemented in the field, and have been shown to produce positive outcomes.
Comparison group A group of people whose characteristics may be measured
against those of a treatment group; comparison group members have characteristics and demographics similar to those of the treatment group, but members of the comparison group do not receive intervention.
Control group A group of people randomly chosen from the target
population who do not receive an intervention, but are assessed before and after intervention to help determine whether program interventions were responsible for changes in outcomes.
Cultural Competency A set of academic and interpersonal skills that allow
individuals to increase their understanding and appreciation of cultural differences and similarities within, among, and between groups.
Data Information collected and used for reasoning, discussion and
decision-making. In program evaluation, both quantitative (numerical) and qualitative (non-numerical) data may be used.
“Getting To Outcomes” – Conference Edition – June 2000 Glossary - 2
Data analysis The process of systematically examining, studying and evaluating collected information.
Descriptive statistics Information that describes a population or sample, typically using averages or percentages rather than more complex statistical terminology.
Effectiveness The ability of a program to achieve its stated goals and
produce measurable outcomes. Empowerment evaluation An approach to gathering, analyzing and using data about a
program and its outcomes that actively involves key stakeholders in the community in all aspects of the evaluation process, and that promotes evaluation as a strategy for empowering communities to engage in systems change.
Experimental design The set of specific procedures by which a hypothesis about
the relationship of certain program activities to measurable outcomes will be tested, so conclusions about the program can be made more confidently.
External evaluation Collection, analysis and interpretation of data conducted by an
individual or organization outside the organization being evaluated.
Focus group A small group of people with shared characteristics who
typically participate, under the direction of a facilitator, in a focused discussion designed to identify perceptions and opinions about a specific topic. Focus groups may be used to collect background information, create new ideas and hypotheses, assess how a program is working, or help to interpret results from other data sources.
Formative evaluation Systematic collection, analysis‚ and interpretation of data used
to improve or enhance an intervention while it is still being developed.
Goal A broad, measurable statement that describes the desired
impact or outcome of a specific program. Impact A statement of long-term, global effects of a program or
intervention; with regard to ATOD use‚ an impact generally is described in terms of behavioral change.
Incidence The number of people within a given population who have
acquired the disease or health-related condition within a specific time period.
“Getting To Outcomes” – Conference Edition – June 2000 Glossary - 3
Indicated Prevention Prevention efforts that most effectively address the specific risk and protective factors of a target population, and that are most likely to have the greatest positive impact on that specific population, given its unique characteristics.
Internal evaluator An individual (or group of individuals) from within the
organization being evaluated who is responsible for collecting, analyzing and interpreting data.
Internal validity Evidence that the desired outcomes achieved in the course of
a program can be attributed to program interventions and not to other possible causes. Internal validity is relevant only in studies that try to establish a causal relationship, not in most observational or descriptive studies.
Intervention An activity conducted with a group in order to change
behavior. In substance abuse prevention programs, interventions at the individual or environmental level may be used to prevent or lower the rate of substance abuse.
Key informant A person with the particular background, knowledge, or
special skills required to contribute information relevant to topics under examination in an evaluation.
Mean (Average) A middle point between two extremes; or‚ the arithmetic
average of a set of numbers. Methodology A particular procedure or set of procedures used for achieving
a desired outcome‚ including the collection of pertinent data. Needs assessment A systematic process for gathering information about current
conditions within a community that underlie the need for an intervention.
Outcome An immediate or direct effect of a program; outcomes
typically are described in terms of behavioral changes that occurs as an internally validated result of specific interventions.
Outcome evaluation Systematic process of collecting, analyzing‚ and interpreting
data to assess and evaluate what outcomes a program has achieved.
Pre-post tests Evaluation instruments designed to assess change by
comparing the baseline measurement taken before the program begins to measurements take after the program has ended.
“Getting To Outcomes” – Conference Edition – June 2000 Glossary - 4
Prevalence The total number of people within a population who have the disease or health-related condition.
Process evaluation Assessing what activities were implemented, the quality of the
implementation, and the strengths and weaknesses of the implementation. Process evaluation is used to produce useful feedback for program refinement, to determine which activities were more successful than others, to document successful processes for future replication, and to demonstrate program activities before demonstrating outcomes.
Program A set of activities that has clearly stated goals from which all
activities—as well as specific, observable and measurable outcomes—are derived.
Protective Factor An attribute, situation, condition, or environmental context
that works to shelter an individual from the likelihood of ATOD use.
Qualitative data Information about an intervention gathered in narrative form
by talking to or observing people. Often presented as text, qualitative data serves to illuminate evaluation findings derived from quantitative methods.
Quantitative data Information about an intervention gathered in numeric form.
Quantitative methods deal most often with numbers that are analyzed with statistics to test hypotheses and track the strength and direction of effects.
Questionnaire Research instrument that consists of statistically useful
questions, each with a limited set of possible responses. Random assignment The arbitrary process through which eligible study
participants are assigned to either a control group or the group of people who will receive the intervention.
Replicate To implement a program in a setting other than the one for
which it originally was designed and implemented, with attention to the faithful transfer of its core elements to the new setting.
Resource assessment A systematic examination of existing structures, programs‚
and other activities potentially available to assist in addressing identified needs.
“Getting To Outcomes” – Conference Edition – June 2000 Glossary - 5
Risk factors An attribute, situation, condition‚ or environmental context that increases the likelihood of drug use or abuse, or that may lead to an exacerbation of current use.
Risk/protective model A theory-based approach to understanding how substance
abuse happens, and therefore how it can be prevented. The theory highlights “risk factors” that increase the chances a young person will abuse substances, such as chaotic home environments, ineffective parenting, poor social skills, and association with peers who abuse substances. This model also holds that there are “protective factors” that can reduce the chances that young people will become involved with substance abuse, such as strong family bonds and parental monitoring (parents who are involved with their children’s lives and set clear standards for their behavior).
Sample A group of people carefully selected to be representative of a
particular population. Science-based A classification for programs that have been shown through
scientific study to produce consistently positive results. Selected Prevention Prevention efforts targeted on those whose risk of developing
ATOD problems is significantly higher than average. Self-administered instrument A questionnaire, survey‚ or report completed by a program
participant without the assistance of an interviewer. Stakeholder An individual or organization with a direct or indirect interest
or investment in a project or program (e.g., a funder, program champion, or community leader).
Standardized tests Instruments of examination, observation‚ or evaluation that
share a standard set of instructions for their administration, use, scoring, and interpretation.
Statistical significance A situation in which a relationship between variables occurs
so frequently that it cannot be attributed to chance, coincidence‚ or randomness.
Target population The individuals or group of individuals for whom a
prevention program has been designed and upon whom the program is intended to have an impact.
“Getting To Outcomes” – Conference Edition – June 2000 Glossary - 6
Threats to internal validity Factors other than the intervention that may have contributed to positive outcomes, and that must be considered when a program evaluation is conducted. Threats to internal validity diminish the likelihood that an observed outcome is attributable solely to the intervention.
Universal Prevention Prevention efforts targeted to the general population, or a
population that has not been identified on the basis of individual risk. Universal prevention interventions are not designed in response to an assessment of the risk and protective factors of a specific population.
*Adapted from the Virginia Effective Practices Project: Atkinson, A., Deaton, M., Travis, R., & Wessel, T. (1998). James Madison University and the Virginia Department of Education.
“Getting To Outcomes” – Conference Edition – June 2000 Bibliography - 1
BIBLIOGRAPHY The Annie E. Casey Foundation. Family to Family Tools for Rebuilding Foster Care: The Need for Self-Evaluation, Using Data to Guide Policy and Practice. Atkinson, A., Deaton, M., Travis, R., and Wessel, T. 1998. The Virginia Effective Practices Project Programming and Evaluation Handbook. A Guide for Safe and Drug-free Schools and Communities Act Programs. James Madison University and Virginia Department of Education. Bond, S.‚ Boyd, S.‚ and Rapp, K. 1997. Taking Stock: A Practical Guide to Evaluating Your Own Programs. Horizon Research, Inc. Center for Substance Abuse Prevention. 1998. A Guide for Evaluating Prevention Effectiveness. Substance Abuse and Mental Health Services Administration Technical Report. Farnum, M.‚ and Schaffer, R. 1998. YouthARTS Handbook: Arts Programs for Youth at Risk, Produced by Youth ARTS Development Project. Americans for the Arts. Fetterman, D, Kaftarian, S., and Wandersman, A. 1996. Empowerment Evaluation: Knowledge and Tools for Self-Assessment and Accountability. Sage Publications. Fine, A. H.; Thayer, C. E.; and Coghian A. 1998. Program Evaluation Practice in the Nonprofit Sector: A Study Funded by the Aspen Institute Nonprofit Sector Research Fund and the Robert Wood Johnson Foundation. Washington, D.C.: Innovation Network, Inc. Garcia-Nunez, J. 1992. Improving Family Planning Evaluation. A Step-by-Step Guide for Managers and Evaluators. Kumarian Press. Goins, M. 1998. Resource References for the Measurements Workshop. ASQ Certified Quality Manager Training Manuals. Greater Kalamazoo Evaluation Project (GKEP). 1996. Evaluation for Learning A Basic Guide to Program Evaluations for Arts, Culture and Health and Human Services Organizations in Kalamazoo County. Krueger, R. 1988. Focus Groups: A Practical Guide for Applied Research. Sage Publications. Kumpfer, K., Shur, G., Rosee, J., Burnell, K., Librett, J., and Millward, A. 1994. Measurement in Prevention: A Manual on Selecting and Using Instruments to Evaluate Prevention Programs, CSAP Technical Report—8, U.S. Department of Health and Human Services, Center for Substance Abuse Prevention. Kumpfer, K. L.‚ Baxley, G. B.‚ and Associates. 1997. Drug Abuse Prevention: What Works. National Institute on Drug Abuse.
“Getting To Outcomes” – Conference Edition – June 2000 Bibliography - 2
National Crime Prevention Council, 1986. “What, Me Evaluate? A Basic Guide for Citizen Crime Prevention Programs.” National Crime Prevention Council, Washington‚ D.C.: Library of Congress Card Catalog No. 89-62890, ISBN: 0-934513-01-5. National Institute of Drug Abuse. 1997. Community Readiness for Drug Abuse Prevention: Issues, Tips and Tools. National Institutes of Health, Publication No. 97-4111. Office of Substance Abuse Prevention. 1989. Prevention Plus II: Tools for Creating and Sustaining Drug-Free Communities. Office of Substance Abuse Prevention. 1991. Prevention Plus III: Assessing Alcohol and Other Drug Prevention Programs at the School and Community Levels. Patton, M. 1997. Utilization-Focused Evaluation: The New Century Text. Third Edition. Sage Publications. Shalala, Donna, and Riley, Richard W. 1993. Together We Can: A Guide for Crafting a Profamily System of Education and Human Services. Stockdell, S.‚ and Stoehr, M. 1993. How to Evaluate Foundation Programs. The Saint Paul Foundation, Incorporated, St. Paul, MN. Swiss Federal Office of Public Health. 1997. Guidelines for Health and Project Evaluation Planning. Texas Commission on Alcohol and Drug Abuse. 1996. Enhancing Your Program Evaluation: PPIII and Beyond. United Way of America. 1996. Measuring Outcomes: A Practical Approach. University of Pittsburgh. Office of Child Development. 1998. An Agencies Guide to Thinking About Monitoring and Evaluation. A publication of the Policy and Evaluation Project, University of Pittsburgh, Office of Child Development. U.S. Department of Health and Human Services. National Center on Child Abuse and Neglect Evaluation Handbook: A Companion to the Program Manager’s Guide to Evaluation. KRA Corporation for the Administration of Children, Youth, and Families. U.S. Department of Justice Office of Juvenile Justice and Delinquency. 1996. Community Self-Evaluation Workbook. W.K. Kellogg Foundation Evaluation Handbook. 1998. Collateral Management Company. (Compiled and written by J. Sanders)
“Getting To Outcomes” – Conference Edition – June 2000 Acknowledgements - 1
ACKNOWLEDGMENTS
(PRELIMINARY) Getting to Outcomes was authored by a team of scientists dedicated to helping program administrators and staff achieve the best outcomes through empowerment evaluation. This document represents a collaborative effort to synthesize and translate science-based knowledge into practice. The primary authors of this manual are as follows: ABRAHAM WANDERSMAN, Ph.D., Professor of Psychology, Department of Psychology, University of South Carolina SHAKEH KAFTARIAN, Ph.D., Director of Knowledge Synthesis, Center for Substance Abuse Prevention (CSAP), Substance Abuse Mental Health Services Administration (SAMHSA), U.S. Department of Health and Human Services PAMELA IMM, Ph.D., Department of Psychology, University of South Carolina MATTHEW CHINMAN, Ph.D., The Consultation Center, Yale School of Medicine, Yale University The authors wish to express their thanks for the help provided to them by a number of individuals and organizations in producing this manual. Each such individual or group made an invaluable contribution with regard to the concepts‚ references‚ examples‚ formats‚ readability‚ and/or overall usefulness of the information contained in this volume to those working in the ATOD prevention field. Indeed‚ their input proved crucial to the authors’ final deliberations and helped shape this latest draft Special thanks go to the following individuals whose special contributions greatly added to the quality of this manual. APRIL ACE, Department of Psychology, University of South Carolina BEVERLY WATTS DAVIS, Acting Project Director, National Center for the Advancement of Prevention and Vice President of United Way of San Antonio and Bexar County, Texas‚ Fighting Back Division DARLIND DAVIS, Branch Chief of Prevention, Office of Demand Reduction, Office of National Drug Control Policy WAYNE HARDING, Ph.D., Professor, School of Psychiatry, Harvard Medical School, and Senior Evaluator for the Northeast Center for the Application of Prevention Technology NANCY JACOBS, Ph.D., Corporate Representative, National Center for the Advancement of Prevention and Executive Director for the Criminal Justice Research and Evaluation Center, John Jay College of Criminal Justice, City University of New York
“Getting To Outcomes” – Conference Edition – June 2000 Acknowledgements - 2
KAROL KUMPFER, Ph.D., Director, Center for Substance Abuse Prevention, (CSAP), Substance Abuse Mental Health Services Administration (SAMHSA), U.S. Department of Health and Human Services; Professor of Psychology, Department of Psychology, University of Utah MANUEL TOMAS LEON, Associate Director, Border Center for the Application of Prevention Technology CAROL MCHALE, Ph.D., Deputy Director, Office of Knowledge Synthesis, Center for Substance Abuse Prevention (CSAP), Substance Abuse Mental Health Services Administration (SAMHSA), U.S. Department of Health and Human Services SIGRID MELUSE, Policy Analyst, Office of Demand Reduction, Office of National Drug Control Policy KEVIN R. RINGHOFER, Ph.D., Prevention Specialist, Central Center for the Application of Prevention Technology, Anoka, Minnesota STEVE ROCK, Ph.D., Professor, Director of the Center for Research and Educational Planning, University of Nevada, Reno‚ and Senior Evaluator for the Western Center for the Application of Prevention Technology WENDY ROWE, Senior Research Associate, Criminal Justice Research and Evaluation Center, John Jay College of Criminal Justice, City University of New York ALVERA STERN, Ph.D., Special Assistant, Center for Substance Abuse Prevention, (CSAP), Substance Abuse Mental Health Services Administration (SAMHSA), U.S. Department of Health and Human Services CHRISTOPHER WILLIAMS, Ph.D., Deputy Director, National Center for the Advancement of Prevention ROE WILSON, Director of Administration, National Center for the Advancement of Prevention Center for Substance Abuse Prevention (CSAP), Prevention Application Branch, Division of Prevention Application and Education The Border Center for the Application of Prevention Technology The Central Center for the Application of Prevention Technology The Northeast Center for the Application of Prevention Technology The Southeast Center for the Application of Prevention Technology The Southwest Center for the Application of Prevention Technology The Western Center for the Application of Prevention Technology
“Getting To Outcomes” – Conference Edition – June 2000 Core Measures - 1
CSAP CORE MEASURES
CSAP Core Measures
“Getting To Outcomes” – Conference Edition – June 2000 Core Measures - 1
REFERENCES Center for Substance Abuse Prevention. 1995. Cultural Competence for Evaluators: A Guide for Alcohol and Other Substance Abuse Prevention Practitioners Working With Ethnic/Racial Communities. CSAP Cultural Competence Series 1. HHS pub. No. (SMA) 95-3066. Rockville, MD: Center for Substance Abuse Prevention. Goodman et al. 1996 Hawkins, J.D.‚ Catalano, R.F.‚ and Miller, J.L. 1992. “Risk and Protective Factors for Alcohol and Other Drug Problems in Adolescence and Early Adulthood.” Psychological Bulletin 112 (1):64-105. Kretzmann, J., and McKnight, J. 1993. Building Communities from the Inside Out: A Path Toward Finding and Mobilizing a Community’s Assets. Northwestern University. Kumpfer, K. L.‚ Shur, G., H.‚ Ross, J. G.‚ Bunnell, K. K.‚ Librett, J. J.‚ and Millward, A. R. 1993. Measurements in Prevention: A Manual on Selecting and Using Instruments to Evaluate Prevention Programs. Lopez, Cristina. National Council of La Raza. Cultural Competency Continuum. National Institute of Drug Abuse. 1997. Drug Abuse Prevention: What Works. National Institutes of Health. Northeast CAPT. Education Development Center. Newton, MA. Office of Substance Abuse Prevention. 1991. Prevention Plus III: Assessing Alcohol and Other Drug Prevention Programs at the School and Community Levels. Patton, M. 1998. “High-Quality Lessons Learned.” Presented at the American Evaluation Association. Chicago, IL. Resnicow, Ken‚ Soler, Robin‚ Ahluwaia, Jasjit S.‚ Butler, J.‚ Braithwaite, Ronald. 1998. Cultural Sensitivity in Substance Abuse Prevention. Shediac-Rizkallah, M. and Bone, L. 1998. “Planning for the Sustainability of Community-Based Health Programs: Conceptual Frameworks and Future Directions for Research, Practice and Policy.” Health Education Research Theory & Practice. Vol. 13, No. 1, 87-108. Stewart, D. and Shamdasani, P. 1990. Focus Group: Theory and Practice. Sage Publications. Newbury Park, CA. Wandersman, Morrissey, Davino, Seybolt, Crusto, Natron, Goodman, and Imm. 1998. “Comprehensive Quality Programming: Eight Essential Strategies for Effective Prevention.” Journal of Primary Prevention, 19(1): 1-30.