GETTING STARTED Getting Started Getting Started to Success Session 1.
Upload
jeremy-wardCategory
view
360download
1
Jeremy Ward Pacific Northwest PHP Conference
September 12, 2015
Getting Started With Xdebug

• Developer at Westwerk
• Drummer for Loud Nerves
• Board game geek
• Fan of stand-up comedy
About Me
• About ‘Debugging’
• Xdebug: Overview, Features, and Benefits
• Xdebug Installation and Setup
• Application Debugging and Profiling
Today’s Topics


Our Goal


Understanding Debugging and Context
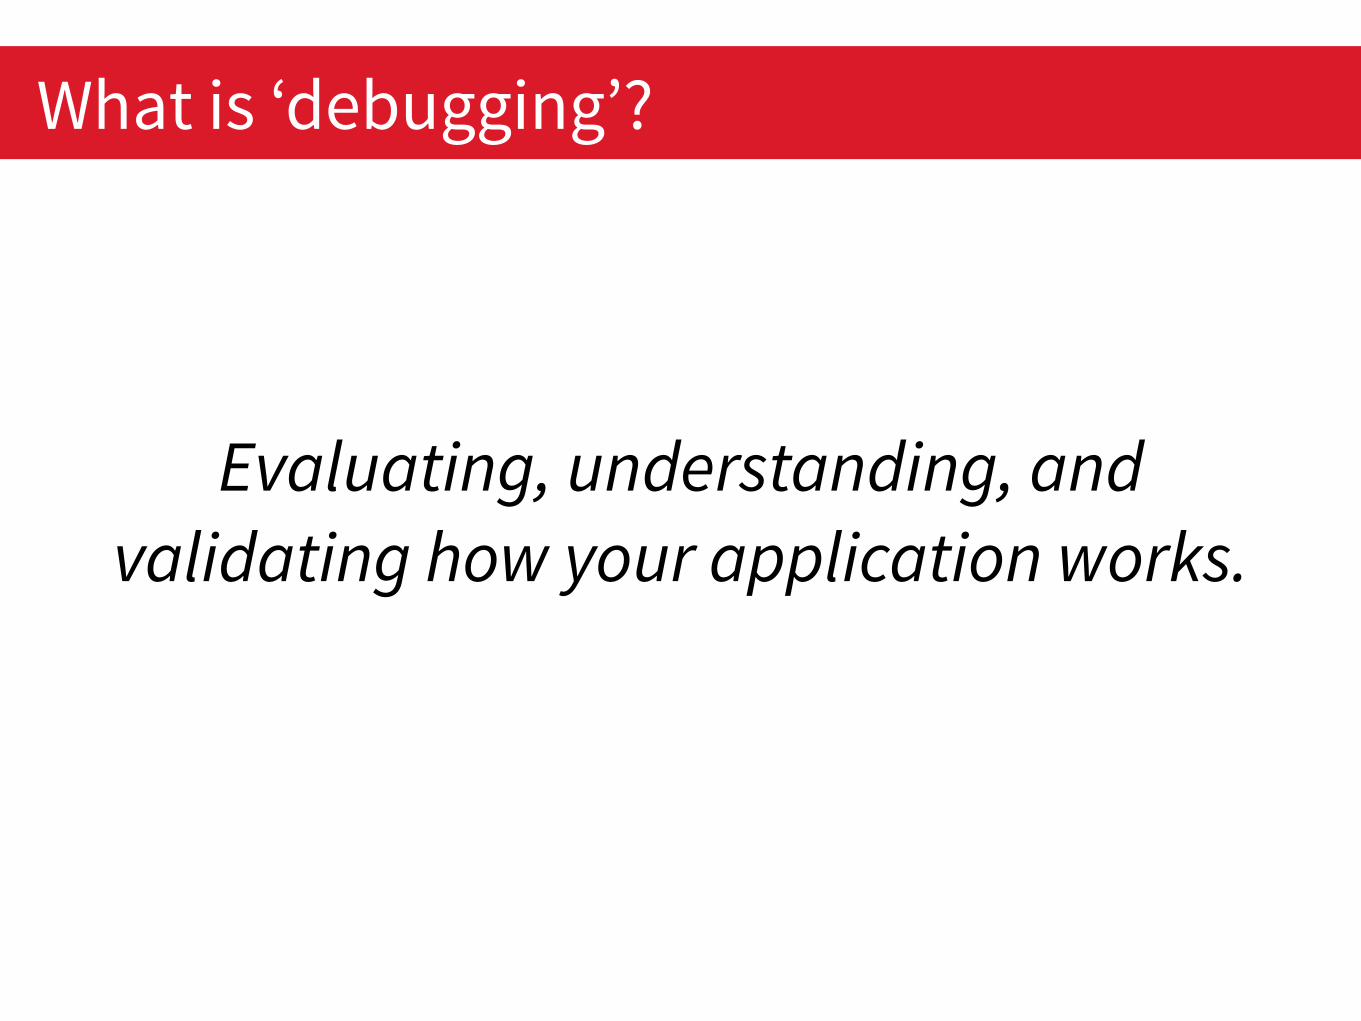
Evaluating, understanding, and validating how your application works.
What is ‘debugging’?

var_dump()

Context Matters

Xdebug Overview
• PHP extension that provides debugging and profiling capabilities
• Developed by Derick Rethans
• First released in May 2002
• Uses the DBGp debugging protocol
What is Xdebug?

• Debugging support
• Stack trace view
• Profiling
• Code coverage analysis
• Function logging
Features
• Step through code operations line-by-line
• View application data in memory at pre-determined breakpoints
• Access function call stack
• Update variable values during runtime
• More detailed error messaging
Benefits
• Xdebug support exists in over a dozen IDES, including:
• PhpStorm
• Eclipse
• NetBeans
• Plain text editors too (with extensions)!
• VIM
• Sublime Text
• Notepad++
Editor Support
Setup and Configuration
Assumptions
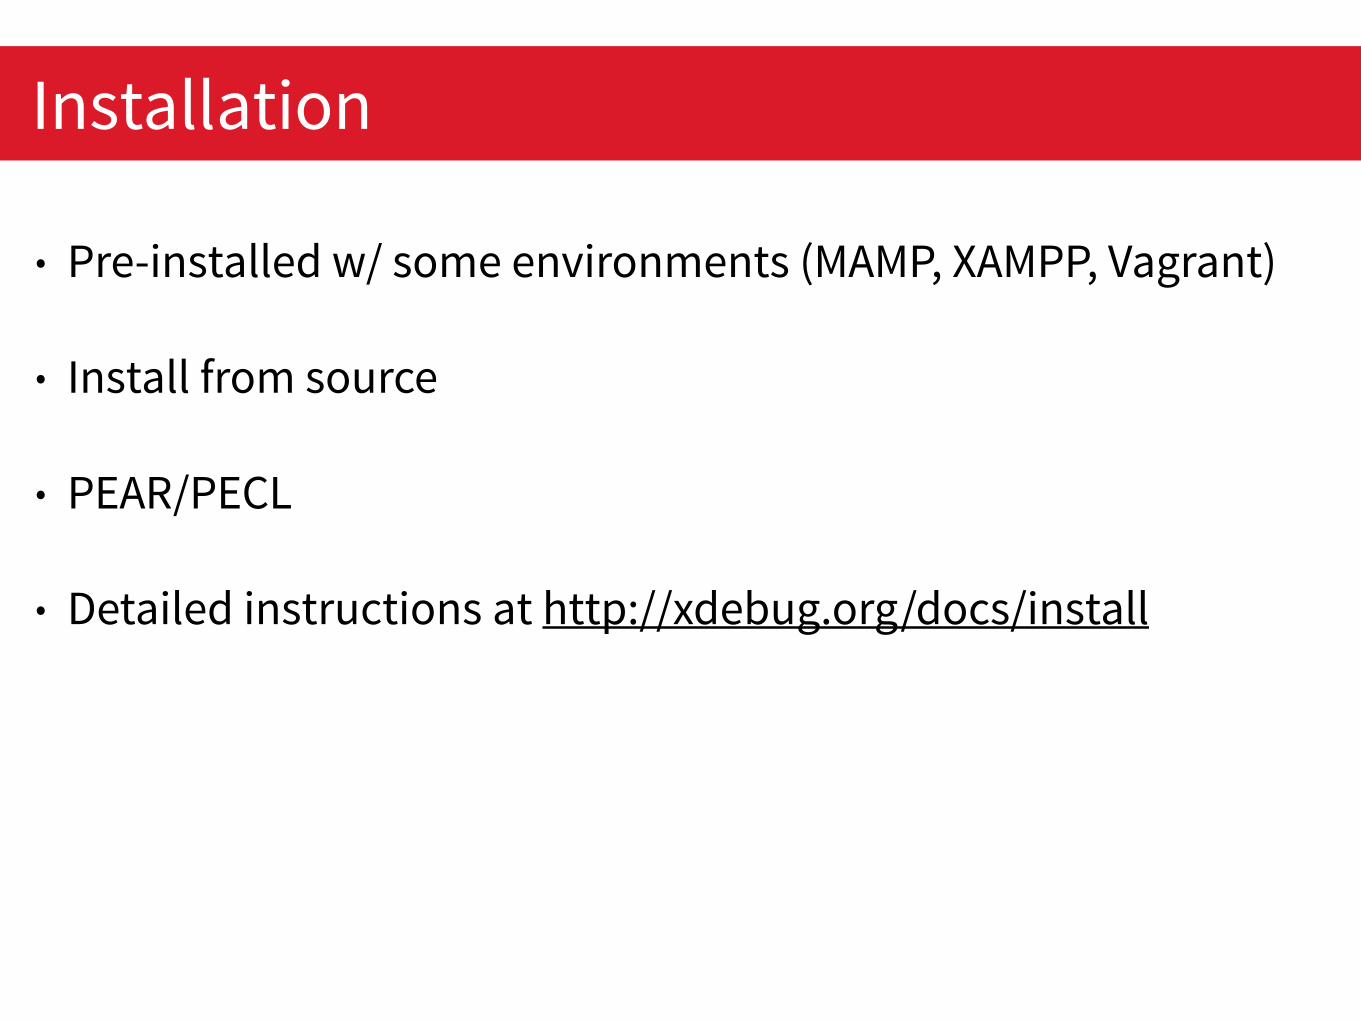
• Pre-installed w/ some environments (MAMP, XAMPP, Vagrant)
• Install from source
• PEAR/PECL
• Detailed instructions at http://xdebug.org/docs/install
Installation
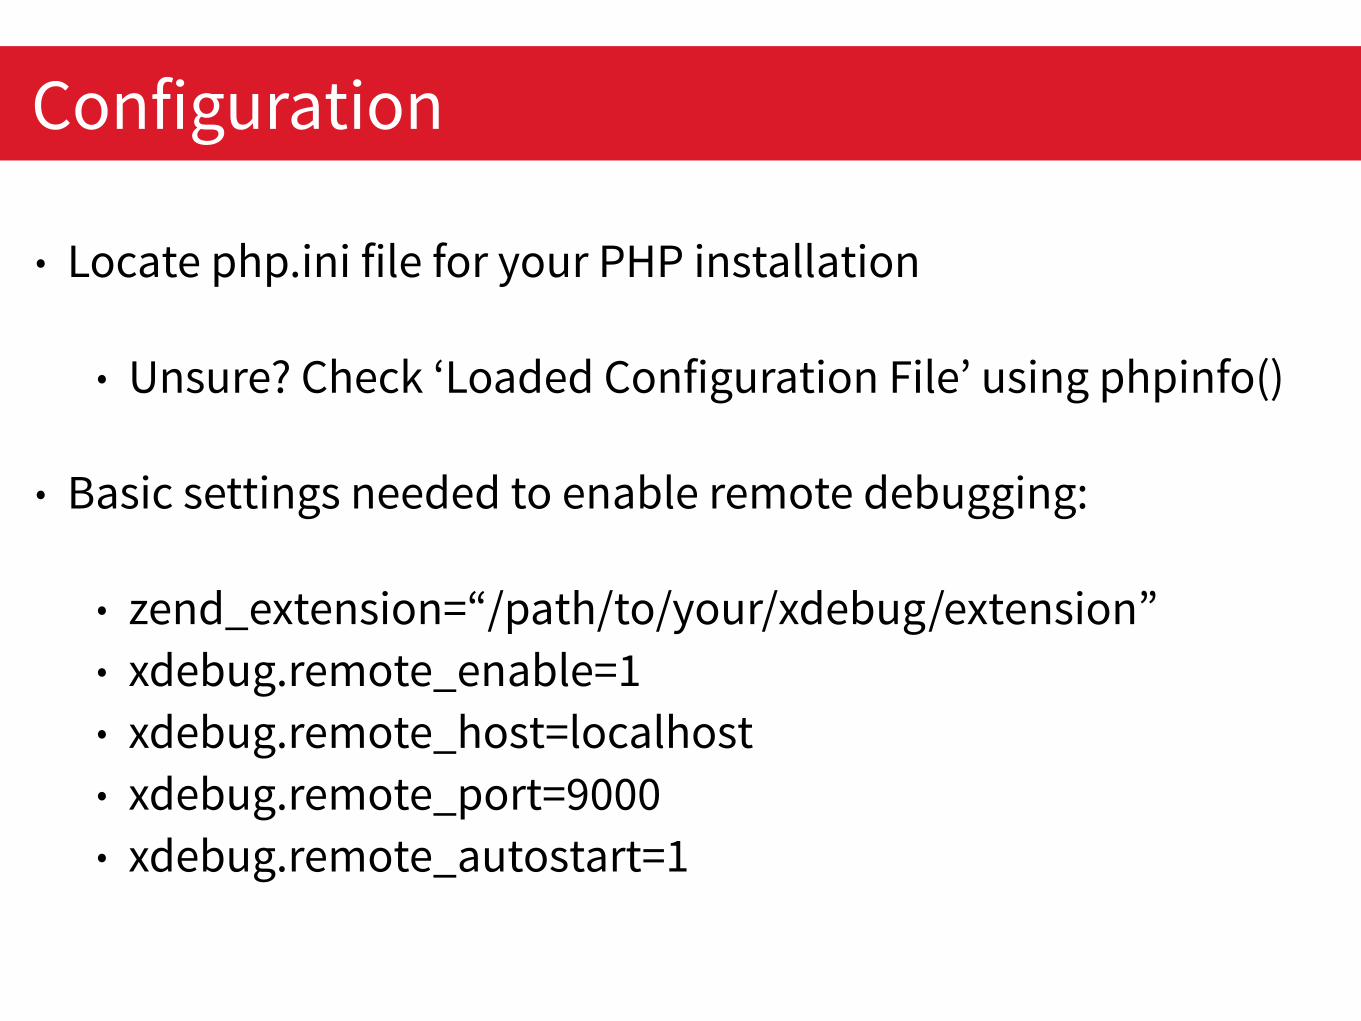
• Locate php.ini file for your PHP installation
• Unsure? Check ‘Loaded Configuration File’ using phpinfo()
• Basic settings needed to enable remote debugging:
• zend_extension=“/path/to/your/xdebug/extension” • xdebug.remote_enable=1 • xdebug.remote_host=localhost • xdebug.remote_port=9000 • xdebug.remote_autostart=1
Configuration

• Used primarily in virtual environments such as Vagrant
• Helps the server layer find the location of local files
• PhpStorm (and presumably other IDEs) include wizards for setting this up
Path Mappings

Using Xdebug
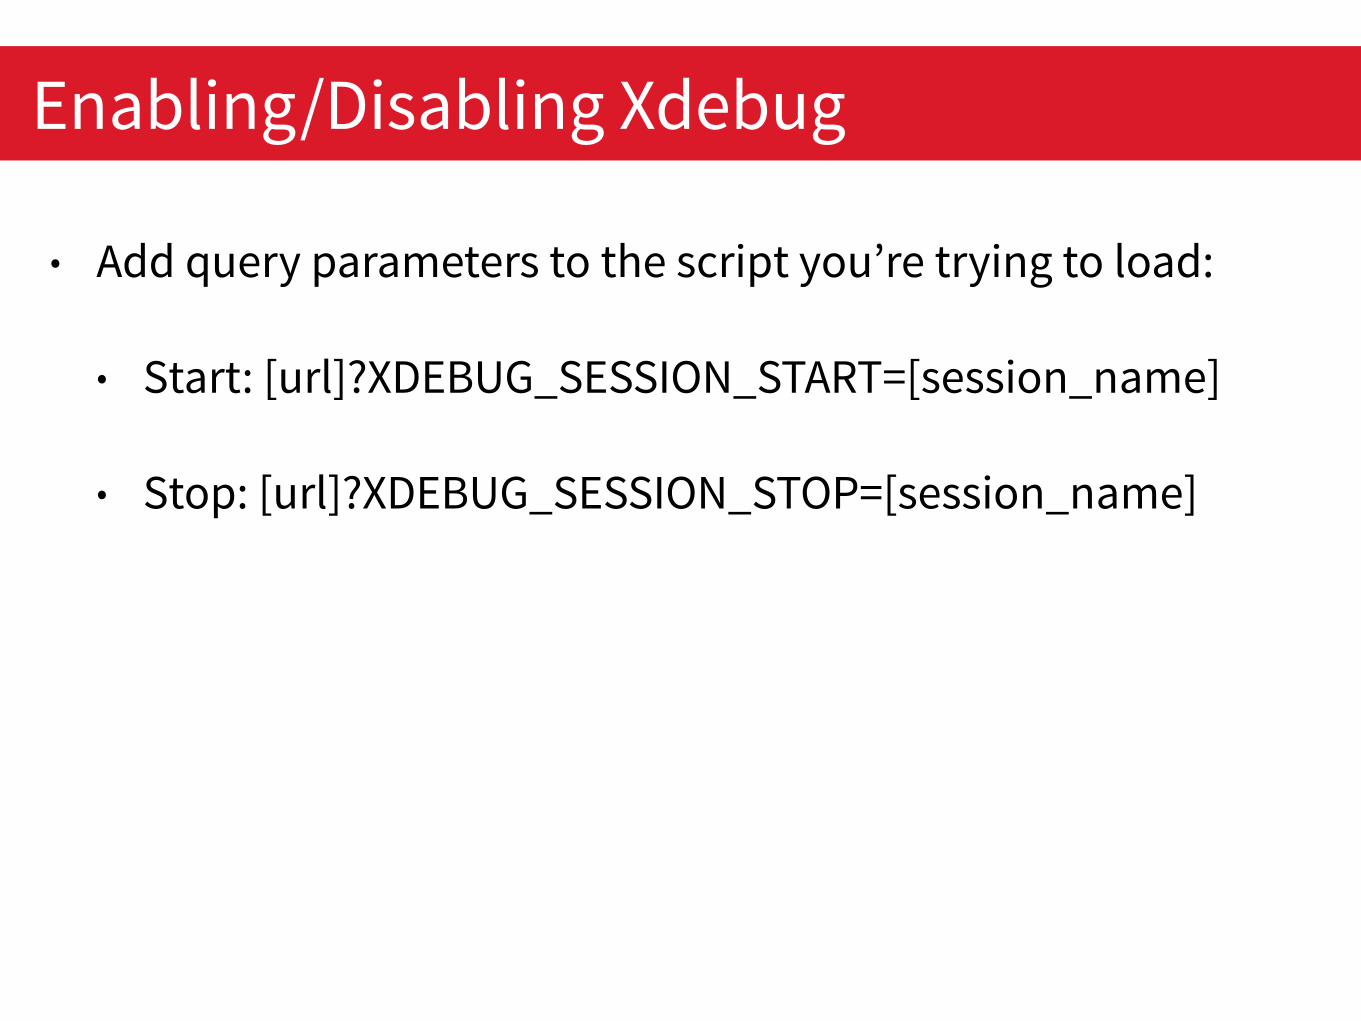
• Add query parameters to the script you’re trying to load:
• Start: [url]?XDEBUG_SESSION_START=[session_name]
• Stop: [url]?XDEBUG_SESSION_STOP=[session_name]
Enabling/Disabling Xdebug
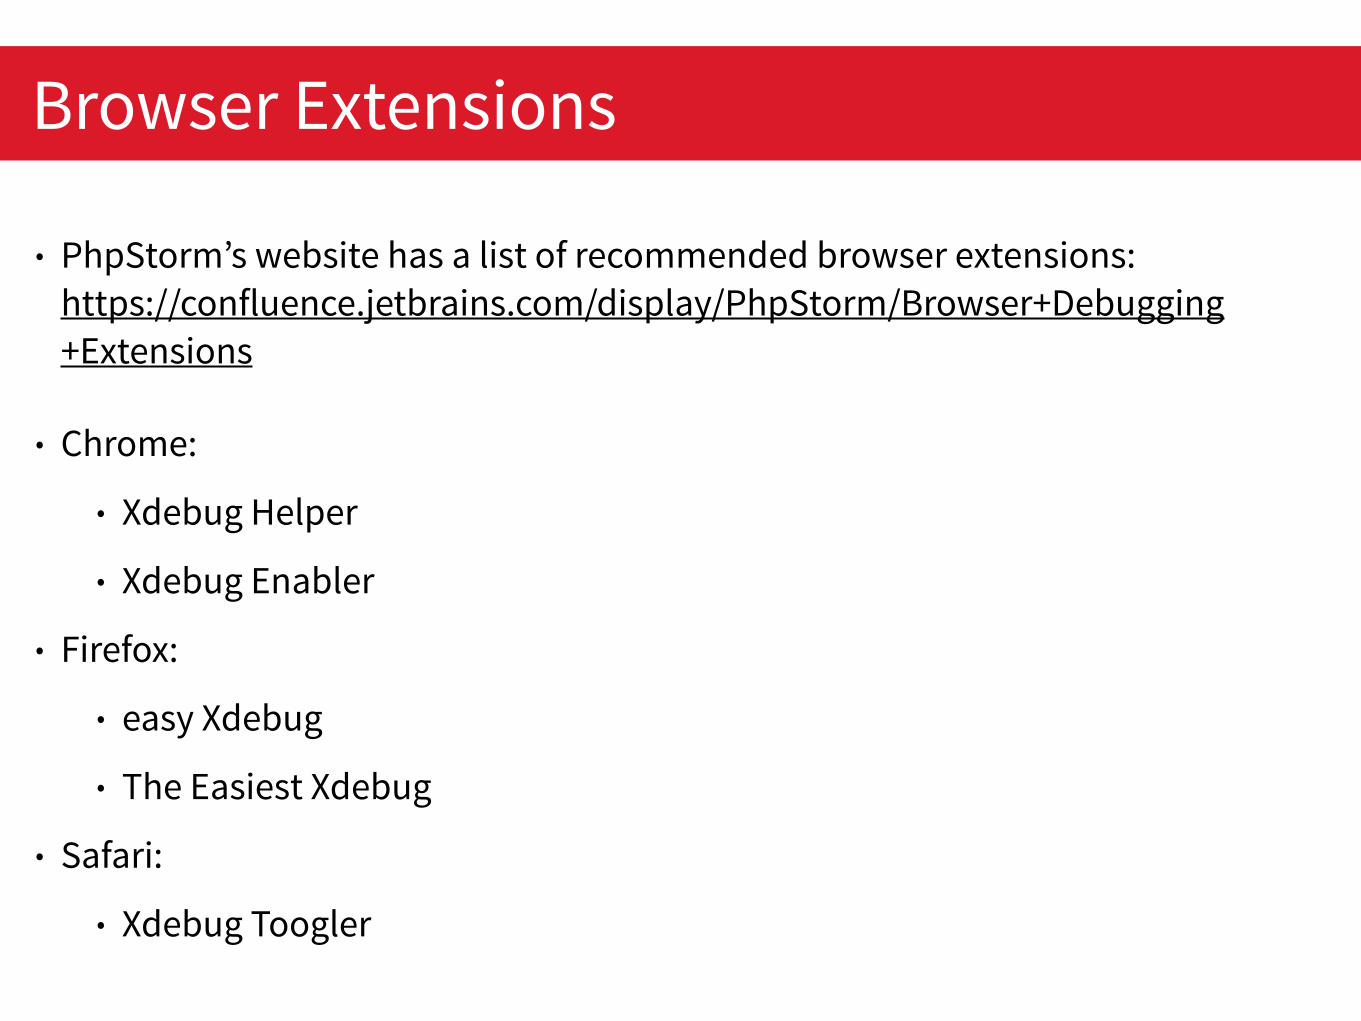
• PhpStorm’s website has a list of recommended browser extensions: https://confluence.jetbrains.com/display/PhpStorm/Browser+Debugging+Extensions
• Chrome:
• Xdebug Helper
• Xdebug Enabler
• Firefox:
• easy Xdebug
• The Easiest Xdebug
• Safari:
• Xdebug Toogler
Browser Extensions
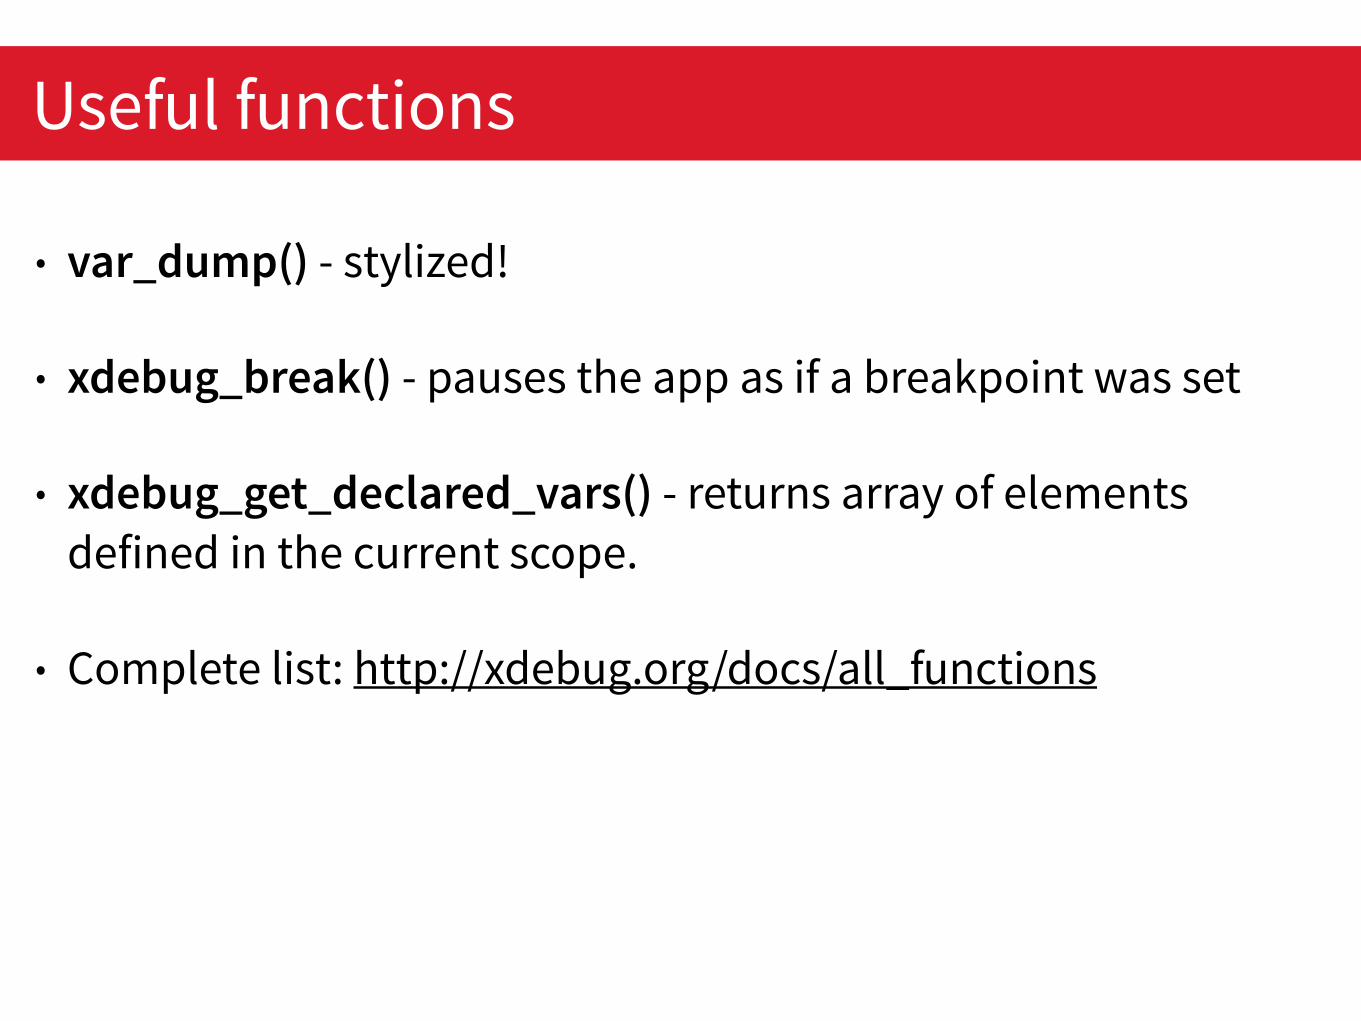
• var_dump() - stylized!
• xdebug_break() - pauses the app as if a breakpoint was set
• xdebug_get_declared_vars() - returns array of elements defined in the current scope.
• Complete list: http://xdebug.org/docs/all_functions
Useful functions
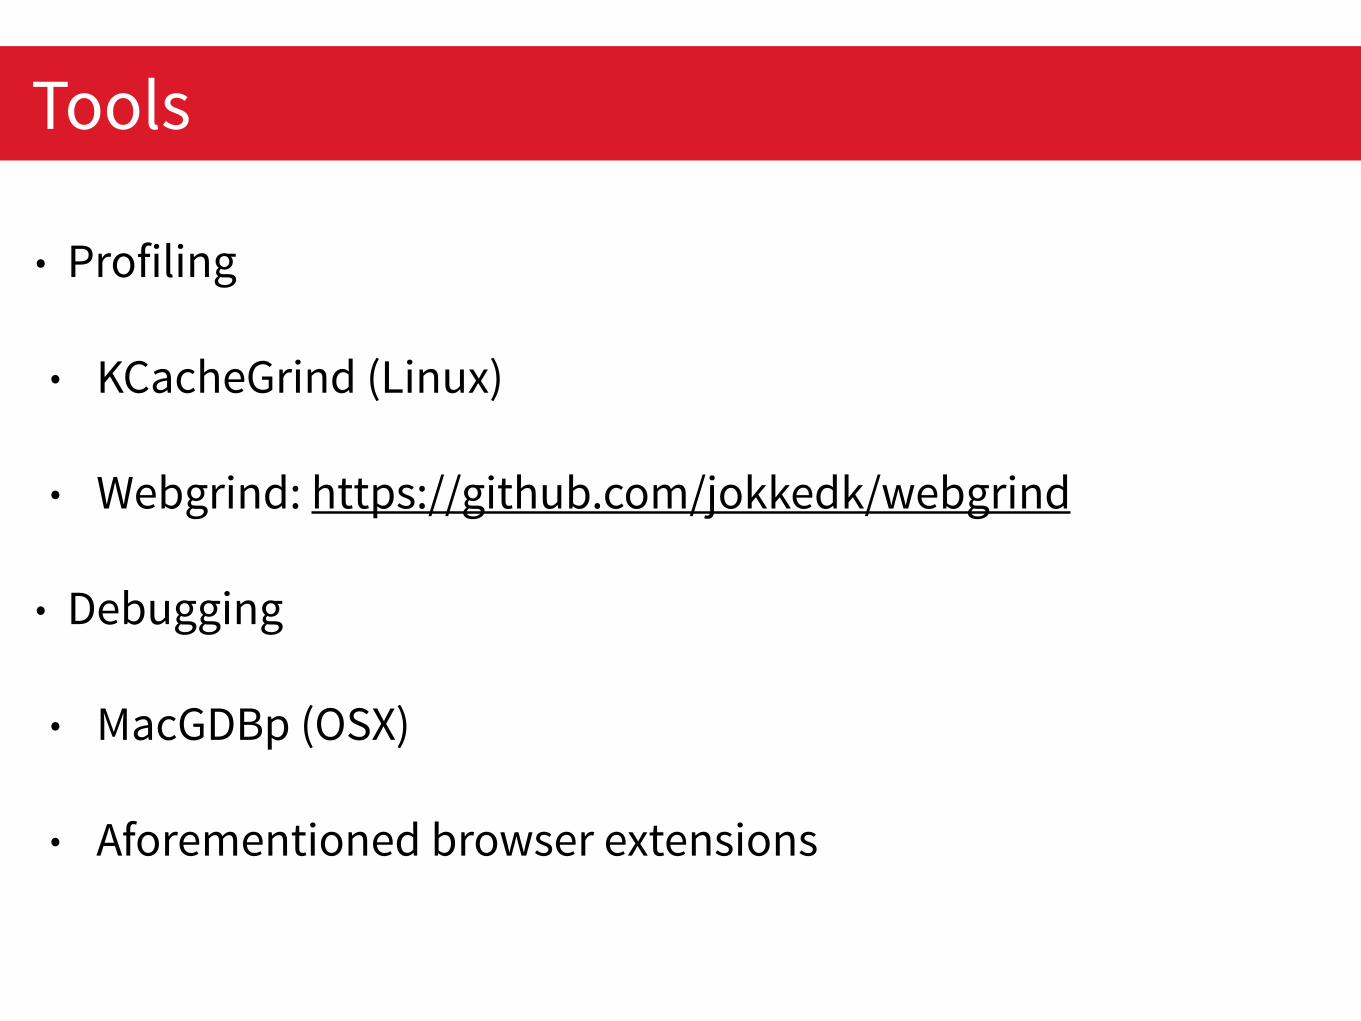
• Profiling
• KCacheGrind (Linux)
• Webgrind: https://github.com/jokkedk/webgrind
• Debugging
• MacGDBp (OSX)
• Aforementioned browser extensions
Tools

Demo
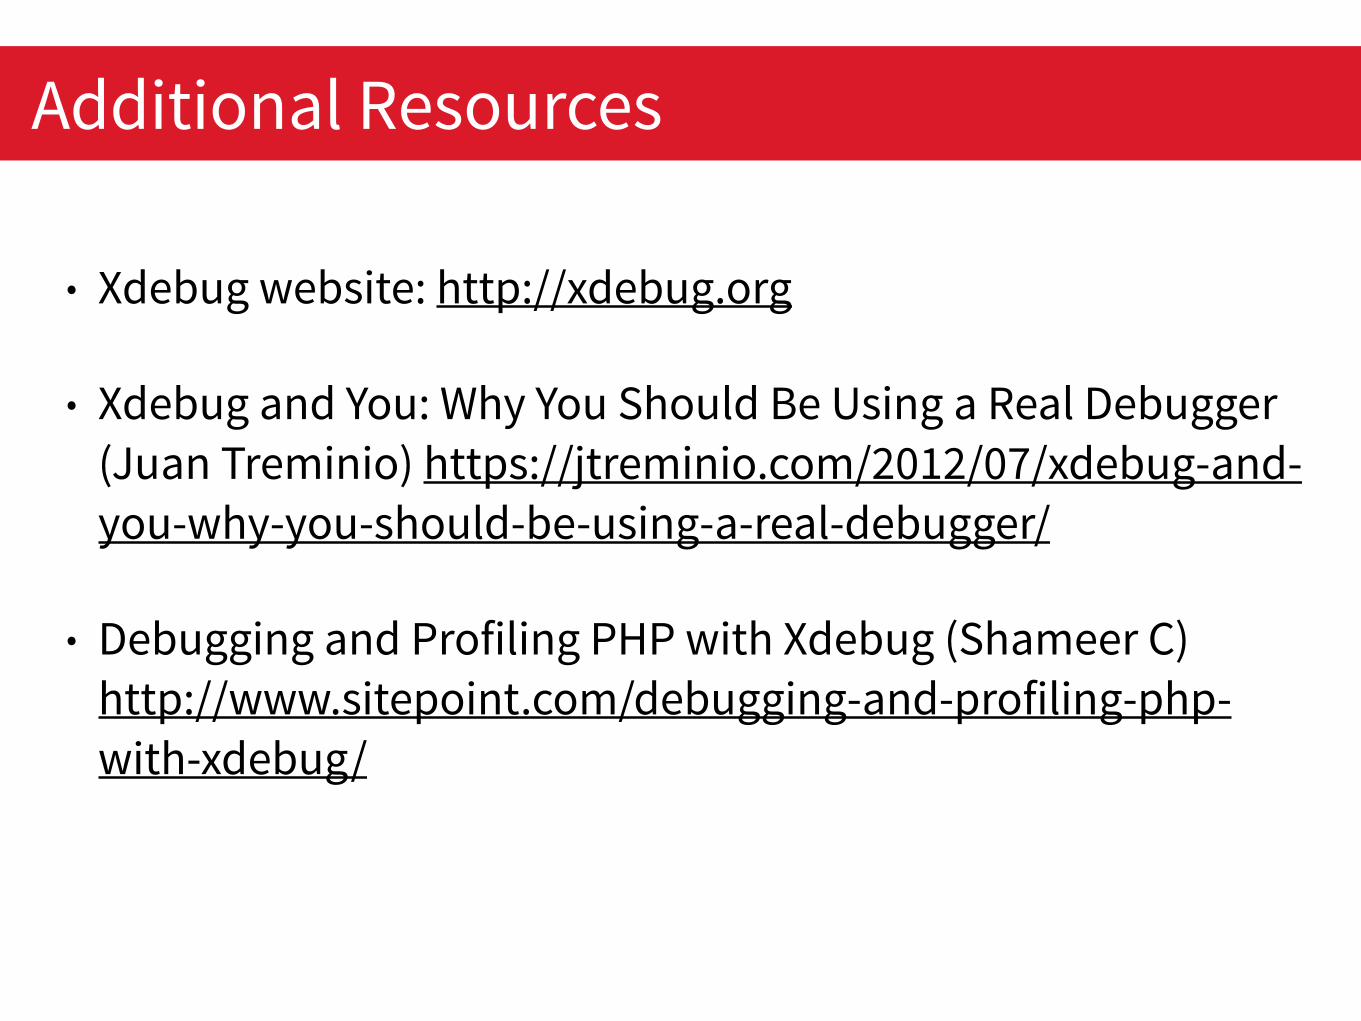
• Xdebug website: http://xdebug.org
• Xdebug and You: Why You Should Be Using a Real Debugger (Juan Treminio) https://jtreminio.com/2012/07/xdebug-and-you-why-you-should-be-using-a-real-debugger/
• Debugging and Profiling PHP with Xdebug (Shameer C) http://www.sitepoint.com/debugging-and-profiling-php-with-xdebug/
Additional Resources

Thank You!Feedback
http://joind.in/15183
Questions? Email: [email protected]
Twitter: @_jmichaelward IRC: jmichaelward


![Skaffold - storage.googleapis.com · [getting-started getting-started] Hello world! [getting-started getting-started] Hello world! [getting-started getting-started] Hello world! 5.](https://static.fdocuments.us/doc/165x107/5ec939f2a76a033f091c5ac7/skaffold-getting-started-getting-started-hello-world-getting-started-getting-started.jpg)