Getting Started with TI-Nspire College Algebra Algebra 2 ©2009 Texas Instruments Incorporated...
49
Getting Started College Algebra
Transcript of Getting Started with TI-Nspire College Algebra Algebra 2 ©2009 Texas Instruments Incorporated...

Getting StartedCollege Algebra
Getting_Started_with_TI-Nspire_College_Algebra.indb OGetting_Started_with_TI-Nspire_College_Algebra.indb O 11/4/09 7:09:56 PM11/4/09 7:09:56 PM

©2009 Texas Instruments Incorporated [email protected] • 1.800.TI.CARES 1Getting Started with TI-Nspire™ College Algebra
About this booklet
This booklet contains 6 activities for college algebra that introduce new users to the key features of TI-Nspire™ and TI-Nspire™ CAS technology. These materials feature screenshots from the TI-Nspire handheld device but are also appropriate for use with the TI-Nspire computer software.
Texas Instruments provides TI-Nspire documents and other resource fi les for these activities on the Activities Exchange. Follow these steps to download the fi les.
Step 1: Go to the Activities Exchange at education.ti.com/exchange.
Step 2: Enter the activity ID number in the quick search box.
NOTE: You will fi nd the activity ID number on the fi rst page of each activity.
Step 3: Click on the title of the activity.
Step 4: Download the attachments to your computer’s hard drive.
Step 5: Distribute the TI-Nspire document (.tns fi le) to student handheld devices using the TI-Nspire™ Computer Link software.
In addition to downloading the activity resource fi les, you can align each activity to curriculum standards and leading textbooks from the Activities Exchange. You can also fi nd additional activities for TI-Nspire technology on the Activities Exchange.
Table of Contents
13421 Exploring Quadratic Equations .......................................................................... 3
13422 Exploring Complex Roots ..................................................................................11
13423 Exploring Asymptotes ....................................................................................... 19
13424 Exponential Growth ........................................................................................... 29
13425 Properties of Logarithms .................................................................................. 35
13426 Exploring Inverse Functions ............................................................................ 41
TI-Nspire Getting Started with College Algebra
Getting_Started_with_TI-Nspire_College_Algebra.indb 1Getting_Started_with_TI-Nspire_College_Algebra.indb 1 11/4/09 7:10:20 PM11/4/09 7:10:20 PM

College Algebra
2 ©2009 Texas Instruments Incorporated Getting Started with TI-Nspire™ College Algebra
Notes
Getting_Started_with_TI-Nspire_College_Algebra.indb 2Getting_Started_with_TI-Nspire_College_Algebra.indb 2 11/4/09 7:10:21 PM11/4/09 7:10:21 PM

Exploring Quadratic Equations
©2009 Texas Instruments Incorporated [email protected] • 1.800.TI.CARES 3Getting Started with TI-Nspire™ College Algebra
Activity OverviewStudents will stretch and translate the parabola given by y � x2 and determine the effects on the equation. Students will also explore fi nding the vertex and zeros of a parabola and relate them to the equation.
Materials
• Technology: TI-Nspire handheld, TI-Nspire CAS handheld, or TI-Nspire computer software
• Documents: Explore_Quadratics.tns, Explore_Quadratics_Student.doc
Problem 1 – Stretching a Parabola
In this problem, students are told y � x2 is an equation in our library of functions and that the graph of y � x2 is called a parabola. We can use the idea of transformations (shifting, stretching, and so on) to obtain other parabolas. Students will make a connection between the curvature of the parabola and the equation. Several questions follow to determine if students have made a connection.
Note: To stretch the graph, the students will see the cursor change to õ. This means the graph can be grabbed and changed without changing the vertex.
Discussion Questions:
• Can you make the coeffi cient of x2 negative?
• What happens to the graph if the coeffi cient of x2 is between 0 and 1? Greater than 1? Less than 0?
• What happens if the coeffi cient of x2 is 0?
Problem 2 – Translating a Parabola
In this problem, students will translate the parabola y � x2 by grabbing the vertex. Students will observe how the graph changes and make a connection between the vertex and equation. Several questions follow to determine if students have made a connection.
Discussion Questions:
• How is the equation different when the vertex is in the fi rst quadrant compared to when it is in the second quadrant?
• For a parabola written in the form y � a(x � h)2 � k, what happens to the graph of y � x2 when the constant k is positive? Negative?
Getting_Started_with_TI-Nspire_College_Algebra.indb 3Getting_Started_with_TI-Nspire_College_Algebra.indb 3 11/4/09 7:10:21 PM11/4/09 7:10:21 PM

College Algebra
4 ©2009 Texas Instruments Incorporated Getting Started with TI-Nspire™ College Algebra
• What happens to the graph of y � x2 when the constant h is positive? Negative?
• How can we change the equation to standard form?
Problem 3 – Finding Zeros of a Quadratic Graphically
In this problem, the students will move a point on the graph of a parabola to fi nd the zeros and the maximum/minimum. Students will answer a question about the zeros found in the exploration.
Discussion Questions:
• What is similar about the coordinates of the points representing the x-intercepts?
• How does the x-coordinate of the vertex relate to the two x-intercepts?
• What happens to the maximum/minimum when there is only one intercept?
• How can we algebraically fi nd the zeros of the functions?
Problem 4 – Connecting Zeros to the Equation
In this problem, students will fi nd the zeros of the parabola by fi nding the intersection of the parabola and the x-axis. Students will see the factored form of the quadratic equation and draw a connection between the zeros and the factored form. Students will then view the intercept form of a quadratic equation to determine how to use this form to fi nd the zeros of the function without a graph.
Discussion Questions:
• How can we use the factored form of the quadratic equation to fi nd the zeros?
• Is there an algebraic way to fi nd the zeros?
• How can you fi nd the zeros of a quadratic without the graph?
• How do we change the equation from intercept form to standard form?
• The x-coordinate of the vertex can be found by averaging the zeros.
Student Solutions
1. a. As coeffi cient of x2 increases in magnitude the graph gets skinnier.
b. When coeffi cient is negative the graph opens down.
Getting_Started_with_TI-Nspire_College_Algebra.indb 4Getting_Started_with_TI-Nspire_College_Algebra.indb 4 11/4/09 7:10:22 PM11/4/09 7:10:22 PM

Exploring Quadratic Equations
©2009 Texas Instruments Incorporated [email protected] • 1.800.TI.CARES 5Getting Started with TI-Nspire™ College Algebra
c. Negative since it opens down.
d. Any positive number will suffi ce.
2. a. Left and right shifts change the number inside the parentheses and up down shifts change the number on the end.
b. h is the x-coordinate of the vertex and k is the y-coordinate.
c. (�4, �2)
d. (3, 1)
e. c(x) � �3(x � 1)2 � 1
f. f(x) � 2(x � 2)2 � 3 answers will vary
g. f(x) � 5(x � 2)2 � 3 answers will vary
3. a.
b.
c.
4. a. p and q are the zeros.
b. �2 and 4. Must be of the form a(x � 2)(x � 4)
c. The x-coordinate of the vertex is the average of the zeros.
Getting_Started_with_TI-Nspire_College_Algebra.indb 5Getting_Started_with_TI-Nspire_College_Algebra.indb 5 11/4/09 7:10:22 PM11/4/09 7:10:22 PM

College Algebra
6 ©2009 Texas Instruments Incorporated Getting Started with TI-Nspire™ College Algebra
Notes
Getting_Started_with_TI-Nspire_College_Algebra.indb 6Getting_Started_with_TI-Nspire_College_Algebra.indb 6 11/4/09 7:10:23 PM11/4/09 7:10:23 PM

©2009 Texas Instruments Incorporated [email protected] • 1.800.TI.CARES 7Getting Started with TI-Nspire™ College Algebra
Name
Class
Problem Statement
There are times when we use a graph to solve a problem and there are times when using a graph is diffi cult. Suppose the functions used in a problem are such that you have no idea how to set your viewing window in order to see key features of the graph needed for a solution. During these times, an algebraic approach might be easier. In order to be able to use both approaches, we need to understand how the graphical solutions are related to the algebraic solutions. In this investigation, we will build these connections.
Stretching a Parabola
1. On page 1.4 of the CollegeAlg_ExpQuadratics.tns fi le is a graph of the function f(x) � x2. Move your cursor to a branch of the parabola and you should see the cursor change to õ. Press and hold the Click key x to grab the parabola. To stretch the parabola, use the NavPad to move the cursor and click again to place the graph.
a. Describe how the equation changes as you manipulate the graph.
b. When the coeffi cient of x2 becomes negative, what happens to the graph?
c. On page 1.7, is the coeffi cient of x2 positive or negative? Explain your reasoning.
d. What is a possible coeffi cient of x2 in the graph on page 1.8 of the CollegeAlg_ExpQuadratics.tns fi le?
Exploring Quadratic Equations
Student Worksheet
Getting_Started_with_TI-Nspire_College_Algebra.indb 7Getting_Started_with_TI-Nspire_College_Algebra.indb 7 11/4/09 7:10:23 PM11/4/09 7:10:23 PM

College Algebra
8 ©2009 Texas Instruments Incorporated Getting Started with TI-Nspire™ College Algebra
Translating a Parabola
2. On page 2.2 is a graph of the function f(x) � x2. Move the cursor to the origin until you see the cursor change to ö. Grab the parabola and move it around the coordinate plane.
a. Describe how the equation changes as you manipulate the graph.
b. Recall that the vertex-form equation for a quadratic is given by y � a(x � h)2 � k. By examining the values for h and k in the algebraic expressions for various graphs, make a conjecture for how the point (h, k) is related to the features of the graph.
c. Based on the algebraic expression for the parabola, what is the vertex of the graph on page 2.5 of the CollegeAlg_ExpQuadratics.tns fi le? Does it match your expecta-tions from the graph?
d. Based on the algebraic expression for the parabola, what is the vertex of the graph of the function f(x) � (x � 3)2 � 1?
e. Which of the following functions has (have) a vertex at (�1, 1)?
a(x) � 2(x � 1)2 � 1
b(x) � �1(x � 1)2 � 1
c(x) � �3(x � 1)2 � 1
f. Write an equation with a vertex of (�2, 3). Check your work by graphing it on page 2.9 of the CollegeAlg_ExpQuadratics.tns fi le.
g. Write a second equation with a vertex of (�2, 3), if possible. If it is not possible, ex-plain why.
Getting_Started_with_TI-Nspire_College_Algebra.indb 8Getting_Started_with_TI-Nspire_College_Algebra.indb 8 11/4/09 7:10:24 PM11/4/09 7:10:24 PM

©2009 Texas Instruments Incorporated [email protected] • 1.800.TI.CARES 9Getting Started with TI-Nspire™ College Algebra
Exploring Quadratic Equations
Student Worksheet
Finding Zeros of a Quadratic Graphically
3. For the graphs on pages 3.2, 3.4, and 3.6 of the CollegeAlg_ExpQuadratics.tns fi le, grab the point on the graph and move it to fi nd the maximum/minimum and zeros (these words will appear when you reach each point).
a. What is (are) the zero(s) of the function on page 3.2? Label your zeros on the graph below.
b. What is (are) the zero(s) of the function on page 3.4? Label your zeros on the graph below.
c. What is (are) the zero(s) of the function on page 3.6? Label your zeros on the graph below.
Getting_Started_with_TI-Nspire_College_Algebra.indb 9Getting_Started_with_TI-Nspire_College_Algebra.indb 9 11/4/09 7:10:24 PM11/4/09 7:10:24 PM

College Algebra
10 ©2009 Texas Instruments Incorporated Getting Started with TI-Nspire™ College Algebra
Connecting Zeros to the Equation
4. In this part of the investigation, we will fi nd the zeros for each given function. To do this graphically, on each of pages 4.3, 4.4, and 4.5, select MENU > Points & Lines > Intersection Points to fi nd the intersection between the parabola and x-axis to determine the zeros. Select the graph and then the x-axis.
a. Describe how the factored forms of the function at the bottom of each page can help fi nd the zeros. For the factored-form equation, y � a(x � p)(x � q), what do p and q represent?
b. What are the zeros of the function given on page 4.8? What general form must the algebraic expression of the function take?
c. In looking at the zeros you found for the parabolas on pages 4.3, 4.4, and 4.5, com-pare the values of the zeros for each with the vertex of the parabola. Describe any patterns you see between the zeros and x-coordinates of the vertices.
Getting_Started_with_TI-Nspire_College_Algebra.indb 10Getting_Started_with_TI-Nspire_College_Algebra.indb 10 11/4/09 7:10:25 PM11/4/09 7:10:25 PM

©2009 Texas Instruments Incorporated [email protected] • 1.800.TI.CARES 11Getting Started with TI-Nspire™ College Algebra
Exploring Complex Roots
Activity OverviewIn this activity, you will explore the relationship between the complex roots of a quadratic equation and the related parabola’s graph. Open the fi le CollegeAlg_ComplexRoots.tns on your TI-Nspire handheld device to work through the activity.
Materials
• Technology: TI-Nspire CAS handheld or TI-Nspire CAS computer software
• Documents: Complex_Roots.tns, Complex_Roots_Student.doc
Student Solutions
Finding Real Solutions
1. a. x � �4 and x � 2
b. Axis of symmetry: x � �1; Vertex: (�1, 9)
Getting_Started_with_TI-Nspire_College_Algebra.indb 11Getting_Started_with_TI-Nspire_College_Algebra.indb 11 11/4/09 7:10:25 PM11/4/09 7:10:25 PM
College Algebra
12 ©2009 Texas Instruments Incorporated Getting Started with TI-Nspire™ College Algebra
c. The line segment joining the real zeros is perpendicular to the axis of symmetry. The real zeros are equidistant from the axis of symmetry and the vertex.
2. a. One real zero; x � 2
b. Axis of symmetry: x � 2; Vertex: (2, 0)
c. The real zero lies on the axis of symmetry and passes through the vertex.
Finding Complex Solutions with Imaginary Parts
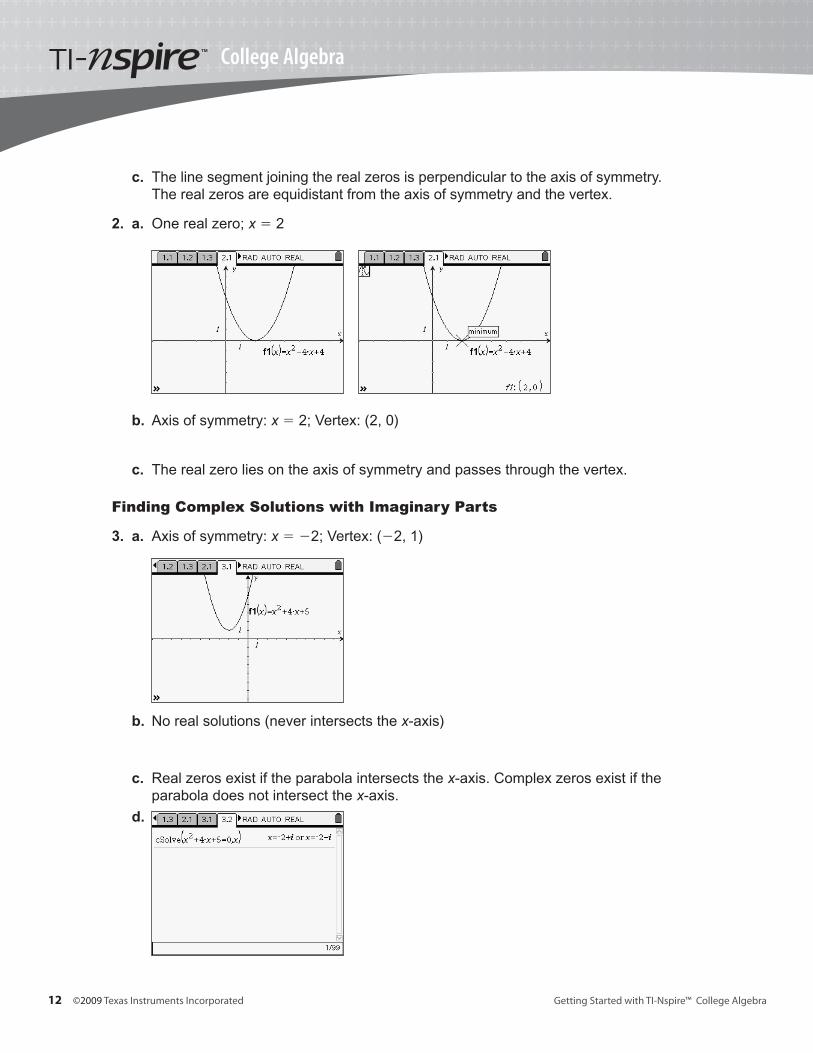
3. a. Axis of symmetry: x � �2; Vertex: (�2, 1)
b. No real solutions (never intersects the x-axis)
c. Real zeros exist if the parabola intersects the x-axis. Complex zeros exist if the parabola does not intersect the x-axis.
d.
Getting_Started_with_TI-Nspire_College_Algebra.indb 12Getting_Started_with_TI-Nspire_College_Algebra.indb 12 11/4/09 7:10:26 PM11/4/09 7:10:26 PM

©2009 Texas Instruments Incorporated [email protected] • 1.800.TI.CARES 13Getting Started with TI-Nspire™ College Algebra
Exploring Complex Roots
Visualizing Complex Roots
4. a. So here we simply need to change the sign in front of the a(x � h)2 part of the expression.
Getting_Started_with_TI-Nspire_College_Algebra.indb 13Getting_Started_with_TI-Nspire_College_Algebra.indb 13 11/4/09 7:10:27 PM11/4/09 7:10:27 PM

Developmental Algebra
14 ©2009 Texas Instruments Incorporated Getting Started with TI-Nspire™ College Algebra
b. At the x-intercepts of the refl ected parabola
c. (�3, 0) and (�1, 0)
d. They coincide.
e. If the parabola does not intersect the x-axis, refl ect it vertically over its vertex. Find the x-intercepts of this refl ection. Rotate these intercepts 90° about their midpoint. The coordinates of these rotated points, written as complex numbers of the form a � bi and a � bi using their x-coordinate as a and their y-coordinate as b, will be the desired roots.
Getting_Started_with_TI-Nspire_College_Algebra.indb 14Getting_Started_with_TI-Nspire_College_Algebra.indb 14 11/4/09 7:10:29 PM11/4/09 7:10:29 PM

©2009 Texas Instruments Incorporated [email protected] • 1.800.TI.CARES 15Getting Started with TI-Nspire™ College Algebra
Name
Class
Problem Statement
While we have developed algebraic tools for fi nding complex solutions of quadratic equations, how do these solutions relate to the graphical representation of the parabola? In this exploration, we will investigate how simple transformations of the graph of a parabola can yield the same complex solutions we usually get by algebraic manipulation.
Finding Real Solutions
1. Recall that the real solutions of a quadratic equation of the form ax 2 � bx � c � 0 are the x-intercepts of the graph of the function f(x) � ax 2 � bx � c and can be represented by one of two situations. Advance to page 1.3 by pressing / and the right side of the NavPad.
a. Examine the graph of the function f(x) � x 2 � 2x � 8 and locate the exact zeros by tracing until zero displays. What are the roots of the equation x 2 � 2x � 8 � 0?
b. Next, locate the vertex of the parabola by tracing until minimum appears on the screen. Give the axis of symmetry and the coordinates of the vertex of the graph of f(x) � x 2 � 2x � 8.
c. Describe the relationship you see between the location of the real zeros and the axis of symmetry.
2. Advance to page 2.1 of the fi le CollegeAlg_ComplexRoots.tns by pressing / and the right side of the NavPad. Examine the graph of the function f(x) � x 2 � 4x � 4 and locate the exact zeros and vertex as you did in question 1.
a. How many distinct real zeros are there? Give the distinct real zeros.
Exploring Complex Roots
Student Worksheet
Getting_Started_with_TI-Nspire_College_Algebra.indb 15Getting_Started_with_TI-Nspire_College_Algebra.indb 15 11/4/09 7:10:29 PM11/4/09 7:10:29 PM

College Algebra
16 ©2009 Texas Instruments Incorporated Getting Started with TI-Nspire™ College Algebra
b. Give the axis of symmetry and the coordinates of the vertex of the graph of f(x) � x 2 � 4x � 4.
c. Describe the relationship you see between the location of the real zeros and the axis of symmetry.
Finding Complex Solutions with Imaginary Parts
3. Advance to page 3.1 of the fi le CollegeAlg_ComplexRoots.tns by pressing / and the right side of the NavPad, and view the graph.
a. Locate the vertex of the parabola by tracing until minimum appears on the screen. Give the axis of symmetry and the coordinates of the vertex of the graph of f(x) � x 2 � 4x � 5.
b. Is it possible to fi nd the solutions to x 2 � 4x � 5 � 0 as you did earlier in questions 1 and 2? Explain.
c. Describe how you can decide whether or not a quadratic equation of the form ax 2 � bx � c � 0 has real solutions by looking at the graph of f(x) � ax 2 � bx � c.
d. Advance to page 3.2 of the fi le CollegeAlg_ComplexRoots.tns, fi nd the complex solutions of x 2 � 4x � 5 � 0 using the cSolve( command, and express them in a � bi form. Give the complex solutions of x 2 � 4x � 5 � 0.
Getting_Started_with_TI-Nspire_College_Algebra.indb 16Getting_Started_with_TI-Nspire_College_Algebra.indb 16 11/4/09 7:10:30 PM11/4/09 7:10:30 PM

©2009 Texas Instruments Incorporated [email protected] • 1.800.TI.CARES 17Getting Started with TI-Nspire™ College Algebra
Visualizing Complex Roots
4. Advance to page 3.3 of the fi le CollegeAlg_ComplexRoots.tns, use the k value in the vertex form of the graph of the function f(x) � x 2 � 4x � 5 � (x � 2) 2 � 1, and refl ect the parabola over the line y � k. Recall that to refl ect the graph of f(x) � a(x � h) 2 � k over y � k, we can fi rst refl ect it about the x-axis, getting �(a(x � h) 2 � k) � �a(x � h) 2 � k. However, the vertex of the graph of this expression would be 2k units below (or above, depending on the sign of k) the old vertex, so we need to adjust by adding 2k to the function’s expression. This gives �a(x � h) 2 � k � 2k � �a(x � h) 2 � k. So here we simply need to change the sign in front of the a(x � h) 2 part of the expression.
a. Enter the refl ected function for f2(x) and graph it. Sketch and label your graph below.
Complex numbers of the form a � bi are graphed by using the x-axis as the real axis for a and the y-axis as the imaginary axis for bi. Advance to page 3.4 and plot the complex roots by selecting MENU � Points & Lines � Point. Move the pencil to each complex root (intersection point will display) and press · or a.
Now draw the segment joining the plotted complex roots by selecting MENU � Points & Lines � Segment. Cursor over to each plotted complex root and press · or a and d to exit this menu. Locate the midpoint of the segment joining the plotted complex roots by selecting MENU � Construction � Midpoint. Cursor over to the segment and press · or a and d to exit this menu.
Rotate clockwise the segment joining the plotted complex roots about its midpoint by selecting MENU � Transformation � Rotation. Select the segment, then select the center point of the rotation (segment midpoint), and then select three points that determine a clockwise rotation by 90° (top endpoint and midpoint of the segment and any other point on the x-axis for the rotation angle).
b. Describe where the endpoints of the rotated segment joining the plotted complex roots are located.
Exploring Complex Roots
Student Worksheet
Getting_Started_with_TI-Nspire_College_Algebra.indb 17Getting_Started_with_TI-Nspire_College_Algebra.indb 17 11/4/09 7:10:30 PM11/4/09 7:10:30 PM

College Algebra
18 ©2009 Texas Instruments Incorporated Getting Started with TI-Nspire™ College Algebra
c. Locate the zeros of the refl ected function f2(x) as you did earlier. What are the coordinates of the zeros of the refl ected function?
d. What can you conclude about the location of the roots of the function f(x) � x 2 � 4x � 5 and the endpoints of the rotated segment?
e. Explain how the complex roots of a quadratic equation can be found using the graph of its refl ected function.
Getting_Started_with_TI-Nspire_College_Algebra.indb 18Getting_Started_with_TI-Nspire_College_Algebra.indb 18 11/4/09 7:10:31 PM11/4/09 7:10:31 PM

©2009 Texas Instruments Incorporated [email protected] • 1.800.TI.CARES 19Getting Started with TI-Nspire™ College Algebra
Exploring Asymptotes
Activity OverviewIn this activity, students will explore asymptotes and singularities, paying particular attention to the connection between the algebraic and graphical representations.
Material
• Technology: TI-Nspire handheld, TI-Nspire CAS handheld, or TI-Nspire CAS Computer software
• Documents: Asymptotes.tns, Asymptotes_Student.doc
Rational Functions
Part 1 involves an exploration of asymptotes involving graphing, exploring a table of values, and algebraic manipulation. Students will use a variety of TI-Nspire tools to identify undefi ned values of x. First, a graphic representation is explored. From the graph, students can get reasonable approximations of undefi ned values. Ask students how they can be certain of the undefi ned values. What tools are provided on the graphing screen to help with this?
Horizontal Asymptotes
Students explore what was learned in Part 1 to develop an understanding of the patterns involved with asymptotes and rational functions. This part provides a great opportunity for students working in pairs or small groups to develop a deeper understanding of what was learned in Part 1.
Getting_Started_with_TI-Nspire_College_Algebra.indb 19Getting_Started_with_TI-Nspire_College_Algebra.indb 19 11/4/09 7:10:31 PM11/4/09 7:10:31 PM

College Algebra
20 ©2009 Texas Instruments Incorporated Getting Started with TI-Nspire™ College Algebra
Functions and Relations to Vertical & Horizontal Asymptotes
Students apply what was learned in Parts 1 and 2 to fi nding singularities and asymptotes for
the function f(x) � 5x � 7 _____________ 4x2 � 8x � 12 .
Lead Coefficients and Relations to Asymptotes
Students again apply what has been learned, but the challenge level increases. In this situation, the function is represented in two different ways, one of which helps to illustrate the vertical shift of a simpler graph. You may wish to have students graph
f(x) � 1 __________ x2 � x � 12 and compare it to the
second function given. If time allows, consider having students verify algebraically that the two functions given on page 6.5 are equivalent. Also, have students label the asymptotes on the function graph with equations.
Student Solutions
1. a. No; certain values of x are skipped
b. The table displays (...) for the undefi ned x-values.
c. �3 have no values
d. (x � 3)(x � 3)
e. The factors match the skipped x-values. (x � 3) matches with the skipped value of 3, and (x � 3) matches with the skipped value of �3.
f. These values make the denominator equal to zero, causing the function to be undefi ned at these values of x. Students might expect asymptotes here.
Getting_Started_with_TI-Nspire_College_Algebra.indb 20Getting_Started_with_TI-Nspire_College_Algebra.indb 20 11/4/09 7:10:32 PM11/4/09 7:10:32 PM

©2009 Texas Instruments Incorporated [email protected] • 1.800.TI.CARES 21Getting Started with TI-Nspire™ College Algebra
Exploring Asymptotes
g. Would expect asymptotes at x � 3 and x � �3.
h. Only one asymptote at x � �3.
i. The x � 3 cancels for everything except x � 3 and so it does not go to infi nity.
2. a. Yes; y � 0
b. The denominator gets very small making the fraction very large in magnitude.
3. Vertical asymptotes are always at x � a and x � b.
4. a. Horizontal asymptotes are present whenever the degree of the numerator is less than or equal to the degree of the denominator. They may or may not be present when the numerator degree exceeds that of the denominator.
b. y � p/q, or at y � (ratio of leading coeffi cient of numerator to leading coeffi cient of denominator)
c. y � 0
5. a. x � �1 and x � 3
b. Yes; y � 0
6. a. (x � 3)(x � 4); singularities at x � 3 and x � �4
b.
c. Since 1 __________ x2 � x � 12 approaches zero as x tends to infi nity, the second representation
clearly tends to 2.
Getting_Started_with_TI-Nspire_College_Algebra.indb 21Getting_Started_with_TI-Nspire_College_Algebra.indb 21 11/4/09 7:10:33 PM11/4/09 7:10:33 PM

College Algebra
22 ©2009 Texas Instruments Incorporated Getting Started with TI-Nspire™ College Algebra
Notes
Getting_Started_with_TI-Nspire_College_Algebra.indb 22Getting_Started_with_TI-Nspire_College_Algebra.indb 22 11/4/09 7:10:33 PM11/4/09 7:10:33 PM

©2009 Texas Instruments Incorporated [email protected] • 1.800.TI.CARES 23Getting Started with TI-Nspire™ College Algebra
Name
Class
Rational Functions
1. On page 1.3 of the CollegeAlg_Asymptotes.tns fi le is a graph of the function
f(x) � 1 ______ x2 � 9 .
a. Is the function defi ned over all values of x? Sketch your graph below and explain.
b. On the graph on page 1.3, insert a table of values for the function. While on the graphing screen, press / � T and a function table will be inserted. How does the table of values indicate that a value is undefi ned for a function? What x-values have no corresponding y-value?
c. Go back to the graph on page 1.3 and construct a vertical line perpendicular to the x-axis. Select MENU > Construction > Perpendicular, move the pencil to the x-axis, and press ·. Drag this line horizontally to identify the x-values for which there is no corresponding y-value.
d. In order to understand why certain x-values are undefi ned, it is helpful to look at the function in factored form. Factor the denominator of the function. You can use the Calculator page on the bottom of page 1.7. How does the factored denominator relate to the undefi ned x-values found on the graph?
e. When the undefi ned x-values are substituted into the function, what happens to the denominator? What effect does this have on the function at these values?
Exploring Asymptotes
Student Worksheet
Getting_Started_with_TI-Nspire_College_Algebra.indb 23Getting_Started_with_TI-Nspire_College_Algebra.indb 23 11/4/09 7:10:34 PM11/4/09 7:10:34 PM

College Algebra
24 ©2009 Texas Instruments Incorporated Getting Started with TI-Nspire™ College Algebra
These undefi ned x-values that result in a denominator becoming equal to zero are referred to as singularities. In the case of the given function, the singularities are �3 and 3 because these values make the denominator equal to zero.
f. Look back over your graph on page 1.3. Notice that the function value approaches �� to the left and right of the values for which the function is undefi ned. In this particular case, this means that the locations of the x-values where the function is undefi ned are also locations of asymptotes, or lines on the graph that the function approaches, getting closer and closer, but never reaches. Do you think x-values where the function is undefi ned will always give asymptotes? Explain your reasoning.
g. On the Calculator page at the bottom of page 1.11, factor the denominator of the
function f(x) � x � 3 ______ x2 � 9 . For what values of x would you expect the graph of f(x) to have
asymptotes?
h. Graph f(x) � x � 3 ______ x2 � 9 on page 1.13 of the TI-Nspire document. From the graph of the
function f(x) � x � 3 ______ x2 � 9 , what is (are) the vertical asymptote(s)?
i. Explain why the number of asymptotes as seen on the graph does not match the number expected by looking at the factored form of the denominator.
Getting_Started_with_TI-Nspire_College_Algebra.indb 24Getting_Started_with_TI-Nspire_College_Algebra.indb 24 11/4/09 7:10:34 PM11/4/09 7:10:34 PM

©2009 Texas Instruments Incorporated [email protected] • 1.800.TI.CARES 25Getting Started with TI-Nspire™ College Algebra
Horizontal Asymptotes
2. Asymptotes are generally represented with dashed lines. On the graphing page on page 2.2, insert the vertical asymptotes (lines) at x � 3 and x � �3. Select a line and select MENU > Actions > Attributes and press · to change attributes for the line. The sec-ond choice in the attributes menu will allow you to arrow left or right to select dashed.
When the degree of the numerator is less than or equal to the degree of the denominator of a rational function, a horizontal asymptote may exist. Horizontal asymptotes are represented by dashed lines. In this case, since the horizontal asymptote is on the x-axis, it will not be constructed as a dashed line on the graph.
When the degree of the numerator equals the degree of the denominator, a horizontal asymptote exists at y � (ratio of leading coeffi cients of numerator and denominator). If the degree of the numerator is less than that of the denominator, a horizontal asymptote exists at y � 0.
a. Does the function graphed on page 2.2 have a horizontal asymptote? If yes, what is the equation of the horizontal asymptote?
b. By thinking about the values of the denominator as x gets closer to the vertical asymptote(s), explain why the graph would behave as it does.
Functions and Relations to Vertical & Horizontal Asymptotes
3. Next, we will explore the relationships between functions and their vertical and horizon-tal asymptotes. On page 3.2 of the TI-Nspire document, explore what happens to the vertical asymptotes as the values for a and b change. You can change the values of these parameters by clicking on the up and down arrows. Describe how the location of vertical asymptote(s) is related to a and b for the equation.
Exploring Asymptotes
Student Worksheet
Getting_Started_with_TI-Nspire_College_Algebra.indb 25Getting_Started_with_TI-Nspire_College_Algebra.indb 25 11/4/09 7:10:34 PM11/4/09 7:10:34 PM

College Algebra
26 ©2009 Texas Instruments Incorporated Getting Started with TI-Nspire™ College Algebra
Lead Coeffi cients and Relations to Asymptotes
4. On page 4.2 of the TI-Nspire document, you will explore how the values of p, q, and r impact horizontal asymptotes. First, change only r to see how the degree of the polyno-mial impacts the situation.
a. When only the value of r is changed, based on visual inspection, horizontal asymp-totes may not be present when
b. On page 4.2, let r � 2 so the degree of the numerator and denominator are equal, and manipulate the values for p and q. When the degree of the numerator and denominator are equal, the equation has a horizontal asymptote at...
c. On page 4.2, let r � 1, and then let r � 0. Vary p and q in both situations and observe where horizontal asymptotes exist for the resulting graphs. When the degree of the denominator is greater than the degree of the numerator, a horizontal asymptote exists at...
5. Consider the function f(x) � 5x � 7 ____________ 4x2 � 8x � 12 . Graph the function on page 5.2 and identify
values for which the function is undefi ned.
a. Factor the denominator to algebraically identify the singularities for the given function.
b. Go back to the graph on page 5.2 and construct the vertical asymptotes for the ratio-nal function using dashed lines. Do any horizontal asymptotes exist for this function?
Getting_Started_with_TI-Nspire_College_Algebra.indb 26Getting_Started_with_TI-Nspire_College_Algebra.indb 26 11/4/09 7:10:35 PM11/4/09 7:10:35 PM

©2009 Texas Instruments Incorporated [email protected] • 1.800.TI.CARES 27Getting Started with TI-Nspire™ College Algebra
6. Consider the function f(x) � 2x 2 � 2x � 23 ____________ x2 � x � 12 . Graph the function on page 6.2 and identify
values for which the function is undefi ned.
a. Factor the denominator to algebraically identify the singularities for the given function.
b. Go back to the graph on page 6.2 and construct all vertical and horizontal asymp-totes for the given rational function using dashed lines.
c. The function f(x) � 2x 2 � 2x � 23 ____________ x2 � x � 12 may be rewritten as f(x) � 1 __________
x2 � x � 12 � 2.
What information does the second representation yield about the horizontal asymp-tote of the function? Does this agree with the information on page 2.4?
Exploring Asymptotes
Student Worksheet
Getting_Started_with_TI-Nspire_College_Algebra.indb 27Getting_Started_with_TI-Nspire_College_Algebra.indb 27 11/4/09 7:10:35 PM11/4/09 7:10:35 PM

College Algebra
28 ©2009 Texas Instruments Incorporated Getting Started with TI-Nspire™ College Algebra
Notes
Getting_Started_with_TI-Nspire_College_Algebra.indb 28Getting_Started_with_TI-Nspire_College_Algebra.indb 28 11/4/09 7:10:36 PM11/4/09 7:10:36 PM

©2009 Texas Instruments Incorporated [email protected] • 1.800.TI.CARES 29Getting Started with TI-Nspire™ College Algebra
Activity OverviewThe purpose of this exploration is to investigate properties of exponential functions including the relationship between graphical and algebraic forms of the function.
Materials
• Technology: TI-Nspire handheld, TI-Nspire CAS handheld, or TI-Nspire computer software
• Documents: Exponential_Growth.tns, Exponential_Growth_Student.doc
Student Solutions
1. a. Students should respond that these functions are decreasing and that when a fraction between 0 and 1 is raised to higher positive powers, it gets smaller. When it is raised to negative powers, the reciprocal gives a number larger than 1, and thus on the left of the origin, the graph takes on larger y-values as x tends to negative infi nity.
b. The graph is a constant function. The graph is y � 1 since 1x � 1.
c. Here, since b � 1, as x increases, so will the function.
Exponential Growth
Getting_Started_with_TI-Nspire_College_Algebra.indb 29Getting_Started_with_TI-Nspire_College_Algebra.indb 29 11/4/09 7:10:36 PM11/4/09 7:10:36 PM

College Algebra
30 ©2009 Texas Instruments Incorporated Getting Started with TI-Nspire™ College Algebra
d. If b � 0, then we would have negative numbers raised to exponents. If the exponents are real numbers, they may not always yield a real number for the function.
2. a. Slope is always positive and always increases.
b. Slope can’t be negative or zero, since the function is always increasing.
3. a. It seems to move in a similar path as the original function.
b.
c. The number is e.
Getting_Started_with_TI-Nspire_College_Algebra.indb 30Getting_Started_with_TI-Nspire_College_Algebra.indb 30 11/4/09 7:10:37 PM11/4/09 7:10:37 PM

©2009 Texas Instruments Incorporated [email protected] • 1.800.TI.CARES 31Getting Started with TI-Nspire™ College Algebra
Name
Class
Problem Statement
As you have probably noticed by now, graphs of functions can often be categorized into basic families based on their geometric behavior. In addition, the algebraic form of the function can give us insight into how the graph will behave. In this investigation, we will explore one family of functions and make connections between the algebraic and graphical representations of them.
1. On page 1.3 of the CollegeAlg_ExpGrowth.tns fi le, the graph of the function y(x) � bx (for b � 0) is displayed. The slider bar allows the value of b to be changed. Change the value of b using the slider. Observe how the value of b affects the shape of the graph. Specifi cally, investigate the effects of b on the graph under the following conditions: 0 � b � 1, b � 1, and b � 1 and respond accordingly below.
a. Describe the behavior of the graph when 0 � b � 1, sketching some of your graphs to illustrate. Explain why you think the graph behaves as it does.
b. Describe the behavior of the graph when b � 1, sketching some of your graphs to illustrate. Explain why you think the graph behaves as it does.
Exponential Growth
Student Worksheet
Getting_Started_with_TI-Nspire_College_Algebra.indb 31Getting_Started_with_TI-Nspire_College_Algebra.indb 31 11/4/09 7:10:37 PM11/4/09 7:10:37 PM

College Algebra
32 ©2009 Texas Instruments Incorporated Getting Started with TI-Nspire™ College Algebra
c. Describe the behavior of the graph when b � 1, sketching some of your graphs to illustrate. Explain why you think the graph behaves as it does.
d. Explain what would happen if b were negative.
2. On page 2.2 of the CollegeAlg_ExpGrowth.tns fi le, you will see the graph of f1(x) � 2x. A tangent line to the curve has been constructed at point T. The slope of the tangent line (which can also be thought of as the instantaneous slope of the function) is displayed. Grab and drag point T along the curve and observe the changing slope.
a. As you drag the point from left to right, what happens to the values of the slope? Explain what the values of the slope tell you about how the function is changing.
b. In the case where b � 2, are there any values that the slope can never equal? Explain why your observation would be so.
3. On page 3.2 of the CollegeAlg_ExpGrowth.tns fi le, you will again see the graph of f1(x) � bx. This time, you will explore the relationship between the slope of the tangent line and the value of the function. Pick a value for b and then move point T. Observe the relationship between the slope and the y-value. Slope is a measure of rate of change in a function. In this example, sometimes the slope is less than y, and sometimes it is greater than y. There is only one value of b for which the rate of change of the function y � bx at any point is equal to the value of the function itself.
a. To help explore this phenomenon, on page 3.5 of the CollegeAlg_ExpGrowth.tns fi le, a point on the “slope function” corresponding to the point, T, has been plotted (the dark point). The coordinates of the point are (x, slope at x). Drag the original point on the tangent line and observe the movement of the “slope point.” Describe the movement relative to the shape of the original function below.
Getting_Started_with_TI-Nspire_College_Algebra.indb 32Getting_Started_with_TI-Nspire_College_Algebra.indb 32 11/4/09 7:10:38 PM11/4/09 7:10:38 PM

©2009 Texas Instruments Incorporated [email protected] • 1.800.TI.CARES 33Getting Started with TI-Nspire™ College Algebra
Exponential Growth
Student Worksheet
In order to better analyze the relationship between the original function and the “slope function,” it would be nice to see the path the slope point follows. To do this, select the Locus tool from under the Construction menu and then click on the slope point followed by the original point on the function. You will see the path of the slope point appear.
b. Find an approximate value of this number, b, whose slope function is the same as
the function itself. (The ratio slope
_____ y displayed on the graph as well as the locus of the
slope point should help.) If you need to obtain more decimal accuracy, move your cursor over the number until the number appears grey. Then press + to get more digits. Likewise, pressing - will decrease the number of digits displayed. Sketch several of your graphs below, showing some of your attempts.
c. This approximation may look familiar. Have you encountered this number before in your study of mathematics? Explain.
Getting_Started_with_TI-Nspire_College_Algebra.indb 33Getting_Started_with_TI-Nspire_College_Algebra.indb 33 11/4/09 7:10:38 PM11/4/09 7:10:38 PM

College Algebra
34 ©2009 Texas Instruments Incorporated Getting Started with TI-Nspire™ College Algebra
Notes
Getting_Started_with_TI-Nspire_College_Algebra.indb 34Getting_Started_with_TI-Nspire_College_Algebra.indb 34 11/4/09 7:10:39 PM11/4/09 7:10:39 PM

©2009 Texas Instruments Incorporated [email protected] • 1.800.TI.CARES 35Getting Started with TI-Nspire™ College Algebra
Properties of Logarithms
Activity Overview
Logarithms are just another way of writing exponents. Just like exponents, logarithms have properties that allow you to simplify expressions and solve equations. In this activity, you will discover some of these properties by graphing and confi rm them with algebra.
Materials
• Technology: TI-Nspire handheld, TI-Nspire CAS handheld, or TI-Nspire computer software
• Documents: Properties_Of_Logs.tns, Properties_Of_Logs_Student.doc
Student Solutions
1. a.
b. The graph is curved as it should be, since it is a quadratic plot.
c.
d. Students may be surprised to see a line instead of a curve. Answers will vary. The point here is to get the students discussing their thoughts on why this line occurred.
e. Since y � log(b) and x � log(a), we get log(b) � 2log(a). But since b � a2, we can write this as log(a2) � 2log(a). Students might then extend this pattern to the more general relationship of log(an) � nlog(a).
Getting_Started_with_TI-Nspire_College_Algebra.indb 35Getting_Started_with_TI-Nspire_College_Algebra.indb 35 11/4/09 7:10:39 PM11/4/09 7:10:39 PM

College Algebra
36 ©2009 Texas Instruments Incorporated Getting Started with TI-Nspire™ College Algebra
2. a.
b. Students should note the expectation of a linear pattern, since the a values were simply multiplied by 6.
c.
d. Students may not be sure what to expect at fi rst. Once they calculate 100.778151, they should realize that 0.778151 is the exponent that gives 6 when you raise 10 to it. Since the 6 is the coeffi cient of the a values from earlier, this is somehow related to the y-intercept of the new linear graph.
e. Here the equation becomes log(6a) � log(a) � log(6).
3. a. Since we are transforming the axes via a logarithm and the log(1) � 0, the normal 0 points on the axes become 1 under the transformation.
b. Convenient points to use are 8 __ 1 � 8, 8 __
2 � 4, and 8 __ 4 � 2. Once these are plotted at the
appropriate intersection points of the grid, we get a line.
c. Student responses will vary, but may state that the graph seems to be a line that involves the difference between a decimal number and the denominator of
the original function y � 8 __ x .
d. Students may try the approach used earlier to see what they get with 100.90309. Here they will obtain a result of 8, yielding the numerator of the original rational function.
e. log ( b __ a ) � log(b) � log(a)
Getting_Started_with_TI-Nspire_College_Algebra.indb 36Getting_Started_with_TI-Nspire_College_Algebra.indb 36 11/4/09 7:10:40 PM11/4/09 7:10:40 PM

©2009 Texas Instruments Incorporated [email protected] • 1.800.TI.CARES 37Getting Started with TI-Nspire™ College Algebra
Name
Class
Problem Statement
As you have probably noticed by now, in algebra it is often useful to write expressions in different forms so that we can more easily notice properties or behaviors of these expressions. Logarithms are no different. Suppose you wanted to write the logarithm of a power like log(a2) without the use of the power. How might you do it?
1. We will begin investigating this question by defi ning a new variable b � a2.
a. Enter a formula in Column B on page 1.5 of the TI-Nspire document CollegeAlg_PropsOfLogs.tns to calculate b for the given values of a. Record some of your values on the screen to the right.
b. Plot avals vs. bvals as a scatter plot on page 1.7 of the TI-Nspire document and sketch your graph on the axes to the right. Describe the shape of the graph. Is this what you expected? Explain your thoughts below.
c. Now we will defi ne x and y. Enter formulas in Columns C and D of page 1.5 so that x � log(a) and y � log(b). Record some of your values from the spreadsheet on the screen below. Then plot xvals vs. yvals as a scatter plot on page 1.9 of the TI-Nspire document and make a sketch of your graph below.
d. Describe the shape of the graph. Is this what you expected? Explain your thoughts below. On your Graphs & Geometry page, use the Line tool to draw a line through the points and sketch it above. Use the Coordinates and Equations tool to fi nd the equation of the line and record your equation.
Properties of LogarithmsStudent Worksheet
Getting_Started_with_TI-Nspire_College_Algebra.indb 37Getting_Started_with_TI-Nspire_College_Algebra.indb 37 11/4/09 7:10:41 PM11/4/09 7:10:41 PM

College Algebra
38 ©2009 Texas Instruments Incorporated Getting Started with TI-Nspire™ College Algebra
e. We can substitute back the original expressions we used for x and y to rewrite this as an equation in terms of a and b. Use the equation of the line you found and make the substitutions x � log(a) and y � log(b) to get a relationship between a and b. State this property formally as the power property of logarithms for the general log expression log(an).
2. At this point, we have examined the relationship for taking the logarithm of a variable raised to a power, but what about other arithmetic operations and their relationship with logarithms? As before, let’s defi ne a new variable b � 6a.
a. Enter a formula in Column B on page 2.3 of the TI-Nspire document to calculate b for the given values of a. Record some of your values on the screen below. Now plot xvals vs. yvals as a scatter plot on page 2.5 of the TI-Nspire document and make a sketch of your graph below.
b. Describe the shape of the graph. As before, draw a line through the data and show the equation of the line. What is its slope and y-intercept? Is this what you expected? Explain your thoughts below.
c. Now defi ne x and y. Enter formulas in Columns C and D of page 2.3 of the TI-Nspire document so that x � log(a) and y � log(b). Record some of your values from the spreadsheet on the screen below. Then plot xvals vs. yvals as a scatter plot on page 2.7 of the TI-Nspire document and make a sketch of your graph below.
d. Describe the shape of the graph. As before, draw a line through the data and show the equation of the line. Use the Graph Trace tool to fi nd the coordinates of the y-intercept to 4 or more decimal places. Is this what you expected? Where did this y-intercept come from? Here’s a hint: Calculate 100.778151. What is 0.778151? Explain your thoughts below.
Getting_Started_with_TI-Nspire_College_Algebra.indb 38Getting_Started_with_TI-Nspire_College_Algebra.indb 38 11/4/09 7:10:41 PM11/4/09 7:10:41 PM

©2009 Texas Instruments Incorporated [email protected] • 1.800.TI.CARES 39Getting Started with TI-Nspire™ College Algebra
e. Using the linear equation you found in x and y, substitute x � log(a) and y � log(b) into your equation to rewrite this as an equation in terms of a. This equation is an example of the product property of algorithms. In general, for a � 0 and b � 0, state this property for log(a b) based on your observations from this investigation.
3. In Problems 1 and 2, you used substitution to identify two properties of logarithms. In particular, you let x � log(a) and y � log(b). There is a special kind of graph paper called log-log paper that lets you make these substitutions graphically, by hand. Page 3.3 of the TI-Nspire document is an example of log-log paper. Examine the graphing page—a copy of the page is given below for your reference. Log-log paper is made by taking the logarithm of each value of x and y and then renumbering the axes.
a. Why do the axes start at 1 instead of 0? Explain your thoughts below.
Note that spaces between the lines are not equal. That is because the distance from 1 to 2 on a logarithmic scale is equal to log 2 � 0.30102999566398 unit, and the distance from 1 to 3 is equal to log 3 � 0.47712125471967 unit, and so on. To illustrate how this graphical representation works, we will use the log-log paper to simplify the
expression log ( 8 __ a ) .
b. Defi ne y � 8 __ a . Then use the Point tool to graph the function y � 8 __
x on the log-log
paper by calculating values and placing the points on the grid. Graph only points with whole-number coordinates. What is the shape of the graph? What is its slope? Record your fi ndings below.
c. As before, draw a line through the points. Use the Coordinates and Equations tool to fi nd the equation of the line. Sketch your results on the axes below. What is the y-intercept of the line? Use the Graph Trace tool to fi nd the coordinates of the y-intercept to 4 or more decimal places. Explain your thoughts below.
d. Where did this y-intercept come from? Can you guess? Use the Calculator application below to check. Explain how 0.90309 is related to this situation.
e. Use the fact that on your graph, y 5 log ( 8 __ a ) and x 5 log(a) to substitute into the
linear equation you found. Now rewrite this as an equation in terms of a. This can be referred to as the quotient property of logarithms. In general, for a � 0 and b � 0, state the property below by fi nishing the equation and explaining your reasoning.
log ( b __ a )
Properties of Logarithms
Student Worksheet
Getting_Started_with_TI-Nspire_College_Algebra.indb 39Getting_Started_with_TI-Nspire_College_Algebra.indb 39 11/4/09 7:10:42 PM11/4/09 7:10:42 PM

College Algebra
40 ©2009 Texas Instruments Incorporated Getting Started with TI-Nspire™ College Algebra
Notes
Getting_Started_with_TI-Nspire_College_Algebra.indb 40Getting_Started_with_TI-Nspire_College_Algebra.indb 40 11/4/09 7:10:43 PM11/4/09 7:10:43 PM

©2009 Texas Instruments Incorporated [email protected] • 1.800.TI.CARES 41Getting Started with TI-Nspire™ College Algebra
Exploring Inverse Functions
Activity Overview
Students will investigate the fundamental concept of an inverse, generate the inverse graphs of relations applying this concept, and algebraically determine the inverse.
Materials
• Technology: TI-Nspire handheld, TI-Nspire CAS handheld, or TI-Nspire CAS computer software
• Documents: Inverse_Functions.tns, Inverse_Functions_Student.doc
Student Solutions
Inverses Point-by-Point
1. {(5, 2), (5, �4), (�2, �9), (�3, 0)}
2. Point moves like the original function, only fl ipped about y � x.
Inverses as a Graphical Relation
3. a. Moves like the original parabola turned on its side
b. Yes
c.
d. Two halves of y � √__
x and y � � √__
x or simply y 2 � x
Getting_Started_with_TI-Nspire_College_Algebra.indb 41Getting_Started_with_TI-Nspire_College_Algebra.indb 41 11/4/09 7:10:43 PM11/4/09 7:10:43 PM

College Algebra
42 ©2009 Texas Instruments Incorporated Getting Started with TI-Nspire™ College Algebra
Inverses as Functions
4. a. If there exists a horizontal line that intersects the graph at more than one point, then the inverse relation is not a function.
b. It is a function.
Finding Inverses Algebraically
5.
6. a. Yes, it matches the locus.
b. The composition gives a result of x. This is important because the composition of a function with its inverse should give the identity function (maps x directly back to x).
Getting_Started_with_TI-Nspire_College_Algebra.indb 42Getting_Started_with_TI-Nspire_College_Algebra.indb 42 11/4/09 7:10:44 PM11/4/09 7:10:44 PM

©2009 Texas Instruments Incorporated [email protected] • 1.800.TI.CARES 43Getting Started with TI-Nspire™ College Algebra
Name
Class
Problem Statement
In this activity, you will explore inverse relations and functions. Two relations are said to be inverses if they “undo” each other. For example, if a relation maps 5 to 2, then the inverse relation maps 2 back to 5. In general for a function, if f(a) � b, then its inverse function is denoted f�1(b) � a.
Inverse Point-by-Point
1. One way to fi nd the inverse of a relation is to switch the mapping of the x- and y-coordinates of each ordered pair in the relation. That is, the inverse of the point (x, y) is (y, x) on the inverse relation. Find the inverse of this relation: {(2, 5), (�4, 5), (�9, �2), (0, �3)}.
2. Now that we have defi ned the inverse of a relation by the “undoing” nature it has for the mapping of points, what does this defi nition mean when we think of the relation graphically? On page 2.2 of the CollegeAlg_Inverses.tns fi le, you will fi nd the function f(x) � x3 graphed and a point on the function labeled. Under the Construction menu, use the Measurement Transfer tool to map the x-coordinate of the labeled point onto the y-axis and the y-coordinate of the point onto the x-axis. To do this, click on the number in the ordered pair followed by the axis you desire.
Now “plot” the point on the inverse function by constructing a line perpendicular to the x-axis, passing through the point on the x-axis. Similarly, do the same for the point on the y-axis. Now mark the intersection point of the two perpendicular lines. This is the inverse point of the point on the original function, f(x) 5 x3.
Move the original point by dragging it. Describe how the inverse point moves.
Inverses as a Graphical Relation
3. On page 3.2, you will fi nd the graph of f(x) � x2, along with point a on the graph. The inverse of point a is also shown, created in the same way we did in the last question. On this graph, we have hidden the perpendicular lines so that we can observe the movement of the inverse point more easily.
a. Drag point a and describe how its inverse point moves.
b. Does the point move in a manner consistent with your observations from question 2?
c. To display the entire collection of inverse points, we can use the Locus tool found under the Construction menu. To do this, after selecting the Locus tool, click on the inverse point followed by the original point on the function. You will see the “path” of the inverse point appear. Describe the shape of the inverse relation. Does it match your earlier sketch? Sketch a path for your point below.
d. What relation does the locus of points appear to represent?
Exploring Inverse Functions
Student Worksheet
Getting_Started_with_TI-Nspire_College_Algebra.indb 43Getting_Started_with_TI-Nspire_College_Algebra.indb 43 11/4/09 7:10:44 PM11/4/09 7:10:44 PM

College Algebra
44 ©2009 Texas Instruments Incorporated Getting Started with TI-Nspire™ College Algebra
Inverses as Functions
4. In the previous problem, the graph of the inverse relation was not a function (evident by the fact that it does not pass the vertical line test). However, the original relation was a function (as it does pass the vertical line test).
a. Describe how you might test the graph of a relation to see if its inverse is a function.
b. Decide if the inverse of the graph of y � x3 � 5 shown on page 4.4 of the CollegeAlg_Inverses.tns fi le is a function by checking for intersections with horizontal lines. Display the locus of the inverse points to confi rm your conclusion. Make a sketch of your graph below.
Finding Inverses Algebraically
5. So far, this activity has focused on the method of switching x- and y-values on a local or graphical scale (one point at a time) to fi nd the inverse of a function. It is now time to switch to a global scale—to algebraically calculate the inverse of a function. Here we will require that the inverse be a function as well.
To understand how to fi nd the inverse function of a given function, we must fi rst consider another way that the inverse is understood. Recall from elementary school that for even basic operations on numbers such as addition and multiplication, we have the relationship between inverse elements and the identity element. The identity element is the element under the operation that leaves everything alone. For example, under addition, 0 is the identity since 5 1 0 5 5, leaving 5 unchanged. Under multiplication, 1 acts as the identity since 7 ? 1 5 7, leaving 7 unchanged. So what are the inverses in these cases? Consider
that 5 1 25 5 0 and 7 ? 1 __ 7 5 1. Here the idea is that if you combine an element with its
inverse, you get the identity element.
On the Calculator page 5.4, defi ne a function, call it e(x), that you think will leave all other functions unchanged when composed with them. Then test your “identity” function by composing it with other functions you defi ne. Do your other functions remain unchanged? Continue until you fi nd an identity function. Is your identity function surprising to you? Explain.
6. The idea of an inverse is to get the identity function when it is composed with the original function. Based on your observation from the last question, this would mean that f(f–1(x)) � x, where f–1(x) represents the inverse function of f(x). On the Calculator page 6.2, defi ne f(x) � x3 � 5. Now to fi nd the inverse function, we would like f(y) � x, where y here is representing the inverse function (note the “switching” of the x- and y-coordinates as we did in the graphical swap in question 2).
Getting_Started_with_TI-Nspire_College_Algebra.indb 44Getting_Started_with_TI-Nspire_College_Algebra.indb 44 11/4/09 7:10:45 PM11/4/09 7:10:45 PM

©2009 Texas Instruments Incorporated [email protected] • 1.800.TI.CARES 45Getting Started with TI-Nspire™ College Algebra
a. Use the solve( command under the Algebra menu to solve the equation f(y) � x for y. The syntax for the solve( command is solve(f(y)=x,y). Give your inverse function and go back to page 4.4 and graph it. Does it match the locus you created? Sketch the graph of your inverse function below.
b. Now go back to page 6.2 and defi ne your new inverse function as g(x). Compose f(g(x)). Do you get the expected identity function? Explain why your composition result should yield just x.
Exploring Inverse Functions
Student Worksheet
Getting_Started_with_TI-Nspire_College_Algebra.indb 45Getting_Started_with_TI-Nspire_College_Algebra.indb 45 11/4/09 7:10:45 PM11/4/09 7:10:45 PM

College Algebra
46 ©2009 Texas Instruments Incorporated Getting Started with TI-Nspire™ College Algebra
Notes
Getting_Started_with_TI-Nspire_College_Algebra.indb 46Getting_Started_with_TI-Nspire_College_Algebra.indb 46 11/4/09 7:10:46 PM11/4/09 7:10:46 PM

Education
education.ti.com
E-MAIL: [email protected] CALL: 1.800.TI.CARES
TI and leading publishers have developed a variety of high-quality, ready-to-use curricular materials that help teachers easily and effectively integrate classroom technology and increase student understanding and success.
EXPLORATIONS™ SERIES ACTIVITY BOOKS In collaboration with educators from around the nation, TI has created subject-specific books that help integrate
TI technology from kindergarten through college. Our student exercises and teacher guides support mathematics
and science graphing technology, computer software, data collection and more!
For the latest EXPLORATIONS Series books visit education.ti.com/activities
PUBLISHER CONNECTIONSFor more than 10 years, TI has been working with publishers of textbooks and supplemental materials to integrate
the use of TI technology into their mathematics and science offerings.
Ease Into Technology with Texas Instruments
Getting_Started_with_TI-Nspire_College_Algebra.indb 47Getting_Started_with_TI-Nspire_College_Algebra.indb 47 11/4/09 7:10:46 PM11/4/09 7:10:46 PM

© 2009 Texas Instruments Printed in U.S.A. CL10031
Easier to search, find and download Activities for Your Classroom
FREE! Activities ExchangeRevamped with more user-friendly features than ever before,
the Activities Exchange makes it easier for educators to
download TI technology activities aligned to state, national
and provincial standards - all at no charge. ■ Browse 3,500+ activities by subject and topic ■ Quickly locate activities aligned to standards
and leading textbooks ■ Find activities matched to specific TI technology ■ Easily download activity files to use in class ■ Share favorite activities with colleagues
These activities, created by educators, TI and leading publishers can help provide innovative ways to incorporate
TI educational technology into your lesson plans. Visit TI’s Activities Exchange at education.ti.com/exchange.
Getting Started SeriesFeaturing activities from the Activities Exchange, the Getting Started series makes it easy for educators to integrate the
use of TI technology in classrooms. Visit education.ti.com/activities and click Getting Started to receive your choice
from the Getting Started series. Graphing Technology: ■ Apps: Math & Science ■ TI-Navigator™ System: Algebra ■ TI-Navigator™ System: Middle Grades ■ Geometry: Cabri™ Jr. ■ TI Assessment ■ Science
By registering to receive the free activity booklets, you will receive periodic emails about product upgrades, free activity
materials, and other communications from Texas Instruments.
NEW - Subject-specific activities for
TI-Nspire™ Technology, including: ■ Getting Started with TI-Nspire™■ Getting Started with High School Math
Getting_Started_with_TI-Nspire_College_Algebra.indb 48Getting_Started_with_TI-Nspire_College_Algebra.indb 48 11/4/09 7:10:51 PM11/4/09 7:10:51 PM