GETTING AROUND Survey - James Bay Neighbourhood ... and Beyond Report - FINAL.pdf · 1 getting...
30
GETTING AROUND JAMES BAY PROJECT JAMES BAY NEIGHBOURHOOD ASSOCIATION ALTERNATIVE TRANSPORTATION COMMITTEE FEBRUARY 2017 Survey Results
Transcript of GETTING AROUND Survey - James Bay Neighbourhood ... and Beyond Report - FINAL.pdf · 1 getting...
1
GETTING AROUND JAMES BAY PROJECT
JAMES BAY NEIGHBOURHOOD ASSOCIATION ALTERNATIVE
TRANSPORTATION COMMITTEE
FEBRUARY 2017
Survey
Results

Executive SummaryThis report presents the findings of a transportation survey of the James Bay neighbourhood. In addition to establishing a baseline of existing transportation patterns within, into and out of James Bay, the findings also identify major transportation issues within James Bay.
The survey was developed and administered in the fall of 2016 by the James Bay Neighbourhood Association’s Active Transportation Committee (ATC). The ATC was formed in the summer of 2016 as part of the Neighbourhood Association’s multi-pronged program to assess and improve the access to our streets within and connecting to James Bay.! The program is focused on making our streets more inviting and safer for all users with a focus on residents and visitors staying in the neighbourhood. The ATC’s mission is to recommend to the City of Victoria by fall of 2017 a
mobility network for James Bay that allows people to get around James Bay safely and efficiently using active modes of transportation.
The Survey was distributed both electronically and in hard copy around the James Bay community. A total of 483 surveys were completed: 178 paper surveys and 305 electronic surveys.
The results of the James Bay Active Transportation Survey show that the overwhelming majority of the neighbourhood population uses active transportation and transit as part of their daily lives.
For destinations within James Bay, 74% of trips are made on foot, 13% by bike, 3% by public transit and 9% by car or truck.
For trips made to destinations outside of James Bay, well over half are done using active
transportation and transit modalities, and this rate is even higher among people going to work with 65% of commuters using active transportation to get to work.
These findings correspond closely with the transportation goals of the City of Victoria’s Official Community Plan (OCP) which aim to have a minimum of 60% of all trips and 70% of commutes by Victoria residents take place by walking, cycling and public transit by 2041.
With more than 90% of all trips made in James Bay done by active transportation and transit, the neighbourhood is already exceeding the City’s long-term transportation goals. The hundreds of comments to the survey’s questions about areas for improvement show that there are indeed many areas where improvements are still needed.
Given the dominant use of active transportation and transit both within and to places outside of James Bay, priority needs to be given by the City of Victoria to transportation planning and infrastructure in the neighbourhood that increases the comfort and convenience for people of all abilities to use all modes of transportation.
In the project’s next phase of work, the JBNA’s Active Transportation Committee will consult with residents on different concepts for making the neighbourhood's infrastructure better reflect their everyday transportation preferences and needs. The Committee looks forward to inviting the City’s staff and Council to participate in this process and reporting back the community’s preferences later in 2017.
2

Table of Contents Executive Summary 2Introduction 4Context: The Neighbourhood 5Methods 6Demographics: Age 8Demographics: All Ages and Abilities 9Connections to James Bay 10Findings: Destinations in James Bay 11Findings: Transportation Choices to Places in James Bay 13Findings: Mobility Choices, Frequency of Trips, and Age in James Bay 14Findings: Destinations Outside of James Bay 15Findings Transportation Choices to Places Outside of James Bay 17Findings: Commuting Out of and Into James Bay 18Findings: Mobility Choices, Frequency of Trips, and Age (Outside of James Bay) 19Findings: Types of Improvements 20Conclusion 25Appendix A: James Bay Transportation Survey 26Appendix B: City of Victoria Transportation Hierarchy 28Appendix C: Traffic Accidents Involving Pedestrians or People Riding Bikes 29Appendix D: Major Events Held in James Bay 30
3
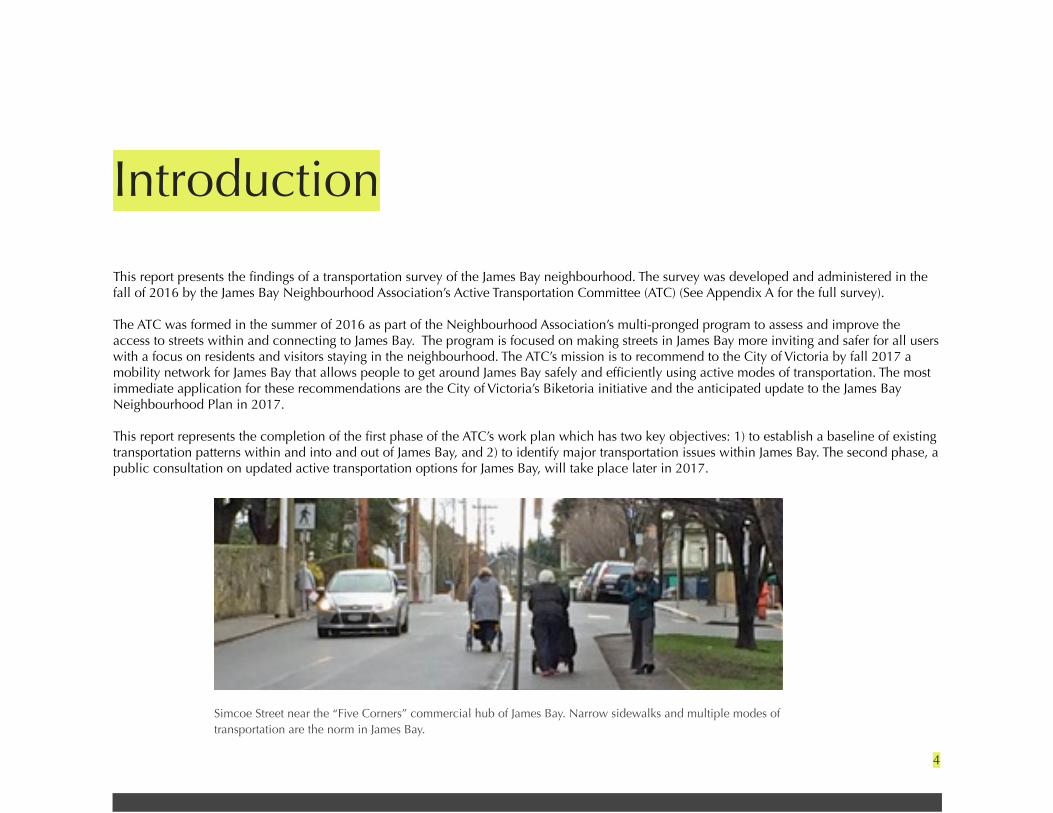
IntroductionThis report presents the findings of a transportation survey of the James Bay neighbourhood. The survey was developed and administered in the fall of 2016 by the James Bay Neighbourhood Association’s Active Transportation Committee (ATC) (See Appendix A for the full survey).
The ATC was formed in the summer of 2016 as part of the Neighbourhood Association’s multi-pronged program to assess and improve the access to streets within and connecting to James Bay.! The program is focused on making streets in James Bay more inviting and safer for all users with a focus on residents and visitors staying in the neighbourhood. The ATC’s mission is to recommend to the City of Victoria by fall 2017 a mobility network for James Bay that allows people to get around James Bay safely and efficiently using active modes of transportation. The most immediate application for these recommendations are the City of Victoria’s Biketoria initiative and the anticipated update to the James Bay Neighbourhood Plan in 2017.
This report represents the completion of the first phase of the ATC’s work plan which has two key objectives: 1) to establish a baseline of existing transportation patterns within and into and out of James Bay, and 2) to identify major transportation issues within James Bay. The second phase, a public consultation on updated active transportation options for James Bay, will take place later in 2017.
4
Simcoe Street near the “Five Corners” commercial hub of James Bay. Narrow sidewalks and multiple modes of transportation are the norm in James Bay.

Context: The Neighbourhood James Bay has the clearest physical definition of any neighbourhood in Victoria. Rather than having other neighbourhoods share its boundaries, it has government buildings and hotels to the north, the Greater Victoria Harbour Authority (GVHA) foreshore lands to the north and west, open parkland and ocean to the south, and Beacon Hill Park to the east. This isolation presents unique benefits and challenges to residents of James Bay. James Bay is the highest density neighbourhood in Victoria with 15% of the city’s population living within one square kilometre. It also has the largest group of residents aged 65+ in Victoria, and over 70% of residents rent their homes. The Five Corners is the centre or village of James Bay. The Menzies corridor from Belleville through to the Five Corners is an extension of the heart of James Bay. This corridor links key public facilities along the inner harbour to the Five Corners, namely JB New Horizons and JB Community Project. To the west of Five Corners, on Oswego, is a third public facility, JB Community School & Centre. These public amenities deliver health and other social services programs. Other public facilities include a second elementary school, substantial publicly subsidized housing, the Royal BC Museum and the Legislature District. As shown in this report, residents within James Bay favour walking and cycling within James Bay. However, the community also serves as a major transit corridor for the greater Victoria area for ferries, cruise ships, helicopters, the Canadian Coast Guard, fishing boats, pleasure craft and tourist vehicles such as horse-drawn carriages and pedicabs. James Bay serves as an “image” of Victoria which promotes tourism. The old streets of James Bay and the remaining vintage housing stock serve as character components which emphasize the Victorian charm of the city. Fisherman’s Wharf, and the Dallas Road walkway add to the ambiance of our delightful city.
5
Fisherman’s Wharf Park - a popular destination for residents and visitors of all ages.

Methods The Survey was distributed both electronically and in hard copy around the James Bay community. The electronic survey was distributed thorough various networks including: James Bay Neighbourhood Association Mailing List, Parent Advisory Councils at both of the local elementary schools, the local cooperative housing network, and various other rental housing agencies.
Hard copies were distributed and collected in various locations around the community and were published in the James Bay Beacon. There were a total of nine different hard copy locations spread throughout the neighbourhood. These locations were Serious Coffee, Imagine Cafe, Bird Cages, Niagara Grocery, James Bay Community School Centre, James Bay Community Project, James Bay Beacon, New Horizons Community Centre, and BC transit pop-up bus. The Five Corners area was also canvassed to collect surveys.
A total of 483 surveys were completed: 178 paper surveys and 305 electronic surveys. The map on the next page (Figure 1) shows the distribution of survey respondents based on those who provided either their postal code or closest major intersection. Nearly all lived in James Bay and almost everyone else lived in the Capital Region District.
The survey data were separated into three broad categories: demographic information, empirical responses and qualitative responses.
The demographic data identified a strong reporting bias within the 60-80 year old age-groups. This resulted in the
under 40 age-groups being under-represented within our survey responses. As a result the empirical responses were corrected for age biases prior to analysis. This was done using age-weights calculated on the most recent census available, which in the fall of 2016 was the 2011 census. These age-weights were then applied to the data before analysis of trips within James Bay and trips leaving James Bay.
Age-weights were not applied when there were not enough responses across all-categories to negate the risks involved with using a particularly small sample set. This included all analysis done on commuters to James Bay (N=24) and commuters leaving James Bay (N=122) as well as the locations of where people travel to, since some locations had very few respondents within each of the age-groups. For example it is not ideal to apply an age-weighting to a group of less than five individuals.
There were three open-ended, qualitative questions. The responses for these questions were organized using key word classification. In some cases multiple comments were made within one response, and each comment counted as a separate response. Comments were grouped by subject matter allowing identification of the most frequently mentioned topics. Some examples of comments for the different groupings were then selected for use in the report.
6

7
Figure 1. The Number of Survey Respondents According to Where They Live

Demographics: Age The age distribution of our survey respondents (Figure 2) heavily favoured the over 50 age group compared to 2011 census data for James Bay (Figure 3). In Fact 30% of respondents were in the 60-69 age group, with only 7% under the age of 30. Various means were used to attract younger respondents, however, it is not unusual to have a low response rate amount younger adults. The demographic data identified a strong reporting bias within the 60-80 year old age-groups. This resulted in the under 40 age-groups being under-represented within our survey responses. As discussed in the methods section of the report, empirical responses were corrected for age biases prior to analysis. This was done using age-weights calculated on the 2011 census.
8
!"
#"
!$"
!%"
!#"&$"
!'"
#"!"#$%&'(($)(*&$)&*%$)%*+$)+*#$)#*'$)'*)(&*%&*+$%
Figure 2. Distribution of Respondents by Major Age Categories
Figure 3. 2011 Census - Distribution of Age by Major Age Categories
9%
14%
13%
11% 15%
15%
10%
13% Under 20 20-29 30-39 40-49 50-59 60-69 70-79 80 or over

Demographics: All Ages and Abilities
As shown in the 2011 census, the ages of people living in James Bay is more or less evenly distributed among all of the census’s major age categories. From a active transportation perspective, this broad distribution of ages means there is a wide range of abilities and needs in the community with regards to active transportation, ranging from people who either use or live with somebody who uses a mobility aid (14% of survey respondents, Figure 4) to families with children (16% of survey respondents, Figure 5).
9
If everything we do in our public spaces is great for an 8 year old and an 80 year old, then it will be great for all people. - 8 80 Cities
Figure 4. Respondents with a mobility challenge and or living
with a person with mobility challenges
!"#
$%#
!"# $%
!"#
$%#
!"# $%
Figure 5. Respondents living with children under
15-years old

Connections to James Bay
Survey respondents were asked to indicate their main reason(s) for coming to James Bay (Figure 6). For most of the survey’s 483 respondents, their primary reason for traveling in the neighbourhood is that they live there. Other popular responses included shopping, services and recreation, and volunteering or working in the neighbourhood. The responses to this question also helped to determine which individuals commute into James Bay but live outside of the neighbourhood.
10
!"
#$
%&
'!
"#(
$ )$ ($$ ()$ &$$ &)$ #$$ #)$ "$$ ")$ )$$
*+,-+.-+/0123+405+6-7+8939.9:,;+3<-==9:,;+32789>23+0:?@-7+72>720.9-:
*+-7+3-12A-?5+9:+15+6019B5+,-23+.-+3><--B+-7+?05>072+9:+/0123+405
*+8-BC:.227+9:+/0123+405
*+D-7E+9:+/0123+405
*+B982+9:+/0123+405
Figure 6. Respondents Primary Reasons for Being in James Bay

Findings: Destinations In James Bay Respondents were provided with a list of destinations within James Bay and asked how frequently they go to each destination (if ever). The destinations are listed and grouped below into categories of activities:
Shopping: Thrifty's and nearby shops, and Niagara Grocery Schools and Daycare: South Park Elementary School, James Bay Community School, Your child's daycare in James Bay Outdoor Recreation (visiting parks): Beacon Hill Park, Fishermen's Wharf/Park, Irving Park, Ogden Point Employment: Your workplace in James Bay Community Services: New Horizons, Community Project Belleville Area: Hotel District, Royal BC Museum, Legislature
In addition to these destinations, respondents were also given an option to identify “other” destinations in James Bay they travel to. 97 “Other” responses were received out of the total 483 responses, suggesting that primary destinations in James Bay were captured.
Figure 7 shows the total number of trips respondents make in a typical week to participate in one activity or another within James Bay. What stands out in this graph is how many of the trips made to places within the neighbourhood are for recreational activities and shopping and how few are made to get to an employer within James Bay.
11
0
500
1000
1500
2000
2500
3000
1
Tota
l num
ber o
f trip
s pe
r wee
k
Shopping Schools and Daycare Outdoor Recreation Employment Community Services Belleville Area
Figure 7. What Activities are Respondent Traveling to Within James Bay - Total Trips Per Week
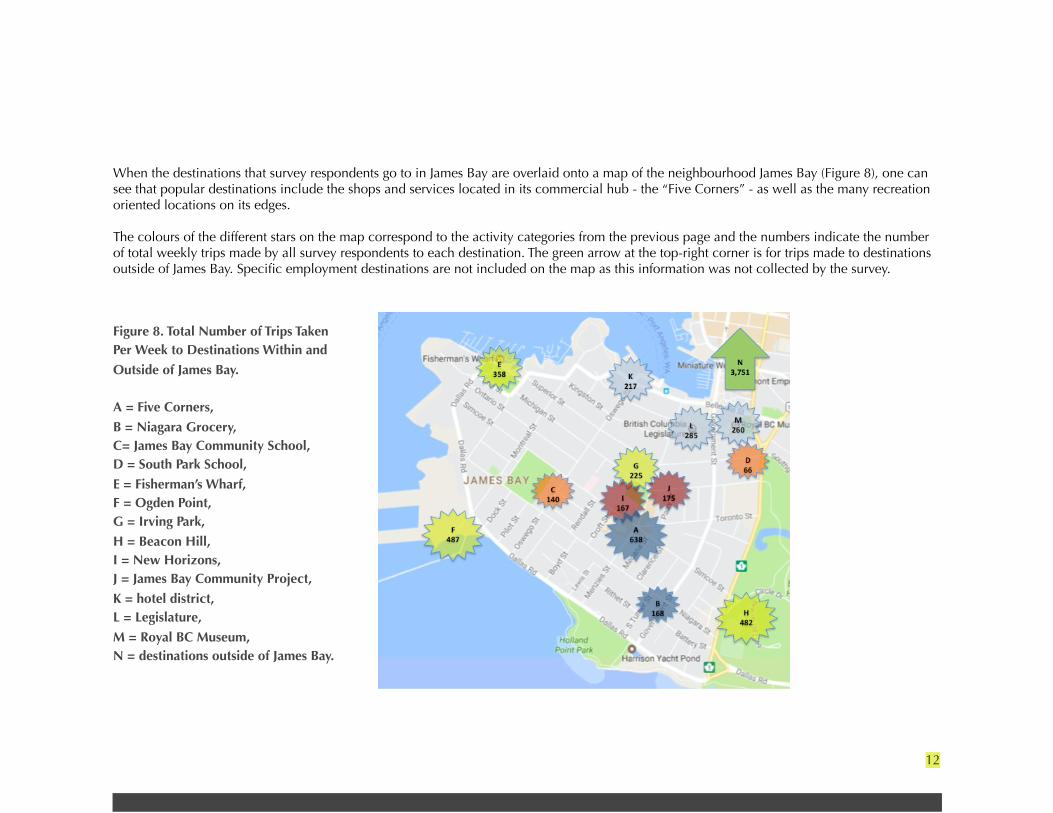
When the destinations that survey respondents go to in James Bay are overlaid onto a map of the neighbourhood James Bay (Figure 8), one can see that popular destinations include the shops and services located in its commercial hub - the “Five Corners” - as well as the many recreation oriented locations on its edges.
The colours of the different stars on the map correspond to the activity categories from the previous page and the numbers indicate the number of total weekly trips made by all survey respondents to each destination. The green arrow at the top-right corner is for trips made to destinations outside of James Bay. Specific employment destinations are not included on the map as this information was not collected by the survey.
12
Figure 8. Total Number of Trips Taken Per Week to Destinations Within and
Outside of James Bay.
A = Five Corners,
B = Niagara Grocery, C= James Bay Community School, D = South Park School,
E = Fisherman’s Wharf, F = Ogden Point, G = Irving Park,
H = Beacon Hill, I = New Horizons, J = James Bay Community Project,
K = hotel district, L = Legislature,
M = Royal BC Museum, N = destinations outside of James Bay.

Findings: Transportation Choices To Places In James Bay In addition to asking respondents how frequently they travel to different destination within James Bay, the survey also asked them to identify
what mode of transportation they typically take to get there: walk, bike, car or truck, public transit, mobility aid, skateboard, or other. The responses to this question showed that nearly all trips to destinations within James Bay are done by walking (74%). The second most popular
mode was cycling (13%) followed by driving there with a car or truck (9%) (Figure 9).
With more than 90% of all trips made in James Bay done by active transportation and transit, the neighbourhood already exceeds the long-term
transportation goals included in the City of Victoria’s Official Community Plan (OCP) which aim to have a minimum of 60% of all trips by Victoria residents take place by walking, cycling and public transit by 2041.
13
Figure 9. Percentage of Trips Made Within James Bay by Different Modes of Transportation

Findings: Mobility Choices, Frequency of Trips, and Age (In James Bay) To get a fuller picture of factors that effect people’s transportation choices within James Bay, the transportation modal data were segregated by frequency of trips to a destination in a typical week and by age. As per Figure 10, the number of times respondents travel to a particular destination within James Bay has no discernible impact on their choice of transportation mode - walking is by far the most popular mode followed by cycling and driving for all three frequency categories.
When the data are segregated by age group (Figure 11), the most significant variation from this result is a higher use of bikes by people under 50 and bike use gradually tapering off with each older age group. Only time will tell if this pattern is due more to social differences between generations or to health-related limitations to cycling for older respondents. If the former, one should expect to see more people over 50 riding bikes over the next 10 to 20 years as those who are currently under 50-years old and ride a bike regularly continue to frequently use them as they age.
14
Figure 11. Modality Choice by age to All Destination Within James Bay
Figure 10. Modality Choice by Frequency of Trips to All Destination Within James Bay

Findings: Destinations Outside of James Bay When looking at the places respondents go when leaving James Bay (Figure 12), workplaces make up the largest share of the total trips taken over the course of a typical week. Other popular reasons for people to leave James Bay include shopping and dining, and visiting friends and family.
It is worth noting that it is likely that the survey data under-estimate the total number of trips made for work, school and daycare because the under 40 age group is under-represented and Figure 11 was not age corrected to account for this. Unfortunately age-weighting the trip data as a function of location is inappropriate for this particular data because the sample sizes are small, and thus would result in disproportionate weighting. (i.e., any of the locations where less than 100 trips were made would involve very small numbers when broken down across our 7 different age groups).
15
!
"!!
#!!
$!!
%!!
&!!
'!!
(!!
)!!
*!!
"
+,-./,-/0,123455-678,,1/,-/9:;7:-5<-,75-=5>?485-/>8,@@=3A/:3B/B=3=3AC5:148/D@@,=34E534F57-5:4=,30=>=4/G-=53B>HG:E=1;
Figure 12. Total Number of Trips per Week Outside of James Bay

When the destination data for places traveled to outside of James Bay are broken out into different frequency groupings (Figure 13), it shows that a high number of respondents make one or two trips out of James Bay every week to buy groceries, shop, receive services and visit friends and family. As reflected in Figure 11, work is the single biggest reason for respondents to leave James Bay five or more times in a typical week.
16
!
"!
#!!
#"!
$!!
$"!
%!!
"&'(&)'(*&+,)*- %./&+,)*-&0&1**2 #.$&+,)*-&0&1**2
3'(2&'(&4'567+**(89:''5&'(&;0<90(*=('9*(,*->+:*(&-:'??,7@&07A&A,7,7@B*05+:&C??',7+)*7+D*9(*0+,'74,-,+&E(,*7A-FE0),5<
Figure 13. Destinations Outside of James Bay by Frequency per Week

Findings: Transportation Choices To Places Outside of James Bay The travel modes typically used by respondents to get to destinations outside of James Bay vary quite a bit more than they do for trips to places inside James Bay. As shown in Figure 14, driving a car or truck is most frequently used to leave James Bay (41% of trips), followed more or less evenly by walking (20% of trips), bike (20% of trips) and public transit (18% of trips). This difference between modes used within James Bay and to places outside of it is likely due to the convenience of using non-walking modes for getting to destinations that are farther away.
17
Figure 14. Percentage of Trips to Destinations Outside of James Bay by Mode of Transportation
41%
20%
18%
20%
1%
Drive
Bike
Transit
Walk
Mobility Aid

Findings: Commuting Out of and Into James Bay When looking at the transportation modality used for commuters leaving James Bay, a full 65% of these respondents use active transportation for their daily commute, while 35% use a car or truck to get to work (Figure 15). About the same percentage of commuters walk and bike to work and a somewhat lower number use public transit. This share of active transportation for getting to work is somewhat higher than the 53% reported by the 2011 census for James Bay: 28% walk, 11% bicycle, 13% public transit compared to 45% for drive and 3% for other.
In addition to people commuting to workplaces outside of James Bay, there are a number of employers in James Bay, including the Coast Guard, marine businesses, multiple hotels, retail shops and service providers. Though a number of individuals both live and work in James Bay, the survey included 24 respondents who live outside of James Bay and commute in for work (Figure 16). Although this number of respondents is too low to draw any concrete conclusions, similar to people leaving James Bay to work, it shows a variety of transportation modes are used by commuters coming into James Bay to work. The most significant difference between the two commuter subsets is the higher use of transit and lower use of cars or trucks by respondents coming into James Bay for work.
18
35%
23% 18%
24% Drive
Bike
Transit
Walk
Figure 15. Percentage of Trips by Commuters to Work Places Outside of James Bay by Mode of Transportation (not age weighted)
27%
23% 27%
23% Drive
Bike
Transit
Walk
Figure 16. Percentage of Trips by Commuters to Work Places Inside of James Bay by Mode of Transportation (not age weighted)

Findings: Mobility Choices, Frequency of Trips and Age (Outside James Bay) Similar to trips made to destinations inside of James Bay, modality choices were analyzed by frequency of trips and age of respondents to see whether these factors may influence the choice of transportation used when leaving James Bay.
The frequency of trips made outside of James Bay does appear to affect mode of transportation (Figure 17). People appear more likely to drive for trips that are made infrequently (i.e., for groceries or health appointments), with more than 50% of those infrequent trips involving a vehicle. In contrast driving only makes up 34% of frequent trips, indicated as 5 or more times per week.
When considering the modes of transportation for trips that involve entering and leaving James Bay it appears that age does play a factor (Figure 18). In particular, cycling decreases noticeably with age, whereas driving and walking increase with age. It is worth noting that approximately 25% of individuals under the age of 40 make trips by bicycle, despite the lack of cycling infrastructure to connect James Bay through downtown.
19
!"
#!"
$!"
%!"
&!"
'!"
(!"
)!"
*!"
+!"
#!!"
',-.,/-.0,12/03 %4&,12/03,5,6007 #4$,12/03,5,6007
8-92:21;,<2=>5:[email protected]
Figure 18. Modality Choice by age to All Destination Outside of James Bay
Figure 17. Modality Choice by Frequency of Trips to All Destination Outside of James Bay

Findings: Types of Improvements There were three qualitative questions included in the survey to allow respondents an opportunity to provide more detailed answers about transportation issues in James Bay, as well as the strengths of the transportation network in the neighbourhood. The first question listed a number of improvements and asked respondents to identify which ones they thought were the most urgent.
Figure 19 shows the number of times each of the suggested improvements was selected by respondents. From that question “safe pedestrian crossings” was selected the most frequently, with 71% of respondents selecting it as a priority. All of the other improvements listed, meanwhile, were selected by 30% to 54% of respondents as priorities. When grouped together by broad themes - pedestrian (blue in the graph), bike specific (red in the graph), roadways (green in the graph), and transit (purple in the graph) - pedestrian related improvements were selected most frequently, followed by roadway improvements and bike specific improvements.
20
Figure 19. Frequency of Times that a Transportation Improvement Was Selected as a Priority for James Bay

The priority given to pedestrian improvements is consistent with its high-level modal share for trips made in James Bay. It is also worth noting, that the kinds of improvements suggested for roadways would benefit both cyclists and motorists and likely even pedestrians in the case of reduced traffic volume and/or speed. This ordering of priorities for transportation improvements closely reflects the transportation hierarchy included in the City of Victoria’s Official Community Plan (See Appendix B).
The two remaining improvement-related questions included in the survey were open-ended to give respondents more of an opportunity to express in their own words transportation issues that they felt were working well and not so well in James Bay.
One question asked directly about the way transportation could be improved: “Are there places in James Bay you would like to see improved to make it easier or safer for you to travel around or into and out of the neighbourhood? If there are, where are these locations and what improvements would you like to see?”. There was a total of 246 responses for this question and each response was coded by subject. These were the 7 most frequently cited responses.: 1. Pedestrians 72 responses 2. Bike Lanes 40 responses 3. 5 Corners 31 responses 4. General Safety 25 responses 5. Traffic 19 responses 6. Speeding 16 responses 7. Transit 12 responses
The survey finished with the following question: “Do you have any additional comments you want to share with us about getting around James Bay?” There was a total of 182 responses made to this question. Each response was coded into the following seven categories:
1. Tourism 43 responses 2. Walkability 31 responses 3. Bike 25 responses 4. Transit 25 responses 5. Everything is Great 21 responses 6. Drivability 14 responses 7. Safety 12 responses
21
Street signs are frequently the only place available to park and securely lock up a bike in most areas of James Bay.

The answers to these qualitative questions provided hundreds of valuable insights into specific transportation-related benefits and challenges experienced by residents and visitors alike. For example, there was a broad array of responses identifying locations that needed improvement. However a few streets and intersections came up numerous times as being particularly difficult for pedestrians, bikes and cars. These roads are: Oswego St., Menzies St. and Simcoe St., with the intersections of Simcoe and Oswego, and Five Corners being frequently identified as problematic. This is unsurprising, since these roads and intersections all are at the heart of James Bay (with their proximity to the school, community centres and shopping).
Over all James Bay needs more cross walks, wider sidewalks and more 4 way stops for vehicles.
We need pedestrian crosswalks along Dallas, Erie, St Lawrence, Kingston.
There should also be a crosswalk in front of James Bay Community School on Oswego or at the very least a stop sign at Simcoe and Oswego. How are children supposed to cross the street here safely when cars won't stop?
The block where the Q and the Landmark sit [Douglas/Belleville/Blanshard] has only one crosswalk at Douglas and Belleville. Residents must go across busy traffic lanes in between traffic to cross at any other point, which is often scary and dangerous due to traffic speed and the semi-blind corner coming down the hill from Southgate and Blanshard.
Many respondents generally saw James Bay as being a walkable community with daily life needs within walking distance. This appears to be one of a most appealing aspects of living in James Bay.
I feel very safe already. James Bay is easily navigable by foot, bike, car etc…. James Bay is a wonderful place to live. Everything is within walking distance.
22
James Bay’s narrow sidewalks must meet the needs of a wide variety of users.

However, there was recognition of the need to make the sidewalks (streets) more accessible and usable for those with mobility challenges, including the elderly who may not be as secure in walking or have hearing/sight problems, and those who have need of wheeled pedestrian aids, such as scooters, walkers, and baby carriages. Problems identified include uneven sidewalk surfaces, obstacles on sidewalks, too narrow sidewalks, and sloped sidewalks.
Many of the sidewalks are very uneven. I have severe and painful nerve damage in my feet. You can easily trip on sidewalks as they are joined poorly. That's why I now have to drive.
I see people in scooters and motorized wheelchairs forced to abandon sidewalks because of obstructions or poorly maintained surfaces. Looking at the demographic of JB there will only be more of these devices coming . . . address issue now. . . make JB more attractive place to live for everyone. A pedestrian friendly neighborhood that is easy to navigate is great for all ages. Whether pushing a carriage with a child or using a stroller for mobility, smooth even surfaces are appreciated. If you decide to have bike lanes then designate them as scooter lanes as well.
Vehicular speed was seen as excessive especially when compared to the time needed for the very elderly to cross streets (See Appendix C for maps of pedestrian and bicycle road accidents).
Create community in which walking and cycling is encouraged, not made unsafe for benefit of a small number of motorists who [rush] through. . . Speeding . . . the ONLY reason I do not always support the boost that cruise ships give to Greater Victoria's economy.
The key safety transportation issue is vehicle speed… At risk are many kids walking to/from school and many seniors walking to/from Thrifty's -- at typical car speeds.
Given how many young families and seniors live in James Bay, we support making James Bay more pedestrian and scooter friendly . . . slow down with emphasis on safe travel for walkers, bikers, strollers, scooters and lastly cars.
23
Respondents were split on the need for dedicated bike lanes and the impact they would have on other modes of transportation. Family cycling was most sited as important. Conflict between cyclists and pedestrians was raised.
I would never bike in James Bay. Most roads are too narrow for bike lanes and already have on-street parking. Plus the speeding taxis would probably run me over!
Don't waste energy, time, and money on better bike routes in James Bay. James Bay is immensely bicycle-friendly -- arguably unparalleled as an urban neighbourhood in CRD.
It is on my bike, which I use often, that is the real daily issue safety-wise.
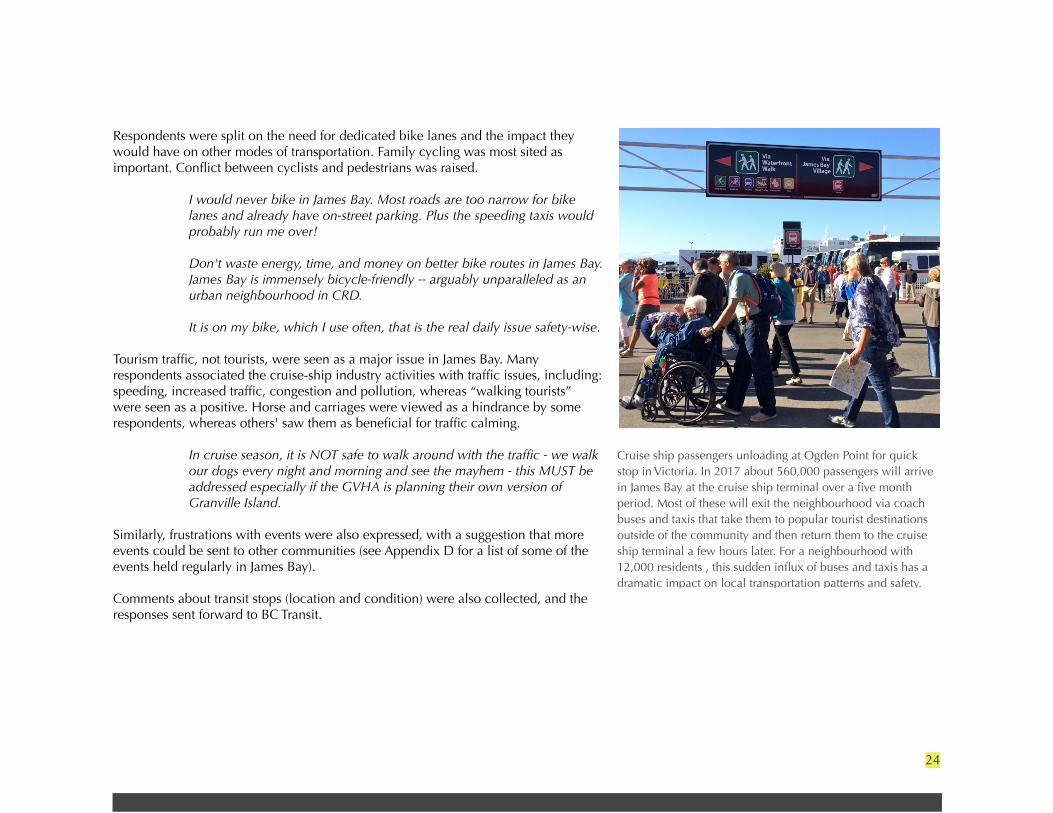
Tourism traffic, not tourists, were seen as a major issue in James Bay. Many respondents associated the cruise-ship industry activities with traffic issues, including: speeding, increased traffic, congestion and pollution, whereas “walking tourists” were seen as a positive. Horse and carriages were viewed as a hindrance by some respondents, whereas others' saw them as beneficial for traffic calming.
In cruise season, it is NOT safe to walk around with the traffic - we walk our dogs every night and morning and see the mayhem - this MUST be addressed especially if the GVHA is planning their own version of Granville Island.
Similarly, frustrations with events were also expressed, with a suggestion that more events could be sent to other communities (see Appendix D for a list of some of the events held regularly in James Bay).
Comments about transit stops (location and condition) were also collected, and the responses sent forward to BC Transit.
24
Cruise ship passengers unloading at Ogden Point for quick stop in Victoria. In 2017 about 560,000 passengers will arrive in James Bay at the cruise ship terminal over a five month period. Most of these will exit the neighbourhood via coach buses and taxis that take them to popular tourist destinations outside of the community and then return them to the cruise ship terminal a few hours later. For a neighbourhood with 12,000 residents , this sudden influx of buses and taxis has a dramatic impact on local transportation patterns and safety.
Conclusion The results of the James Bay Active Transportation Survey show that the overwhelming majority of the neighbourhood population uses active transportation and transit as part of their daily lives.
For destinations within James Bay, 74% of trips are made on foot, 13% by bike, 3% by public transit and only 9% by car or truck. It is worth also noting that in the area around the Five Corners, James Bay's primary shopping centre, the concentration of pedestrians is likely even higher than this because many individuals who may have cycled or driven to that area for shopping will subsequently complete their tasks by walking from one service to another.
For trips made to destinations outside of James Bay, more than half are done using active transportation and transit modalities, and this rate is even higher among commuters, 65% of whom reported using walking, biking, or transit as their primary mode for getting to work.
Total trips made within James Bay exceed the transportation goals of the City of Victoria’s Official Community Plan (OCP) which aim to have a minimum of 60% of all trips by Victoria residents take place by walking, cycling and public transit by 2041. Meanwhile, the percentage of trips made to work by James Bay residents using one of these three modes of active transportation falls just short of the OCP’s ambitious 70% target.
Although James Bay is already nearly meeting or exceeding the City’s long-term transportation goals, this does not mean that more should not be done to improve the safety, comfort and convenience of how people get around and into and out of the neighbourhood. The hundreds of responses to the survey’s questions about areas for
improvement to the neighbourhood’s transportation infrastructure show that there are indeed many areas where improvements are still needed. For example, although the vast majority of trips made in and around the Five Corners area are done on foot, the area’s transportation design and infrastructure is dominated by measures that were built to accommodate motor vehicles first and foremost. In addition, there are absolutely no provisions made on any of the roadways in James Bay for increasing the safety of people using bicycles. Although the survey shows that there are already a relatively high number of trips made by bicycle, this number is likely to remain unchanged if the City continues to ignore the special transportation needs of people on bikes. Similarly, special provisions are needed to to make it more comfortable and convenient for people using mobility aids, such as scooters. For people who rely on mobility aids to get around this is a serious quality of life issue. Over the next decade, as more mobility aids are used, the problems faced by people using them today will only increase unless addressed.
Given the dominant use of active transportation and transit both within and to places outside of James Bay, priority needs to be given by the City of Victoria to transportation planning and infrastructure in the neighbourhood that increases the comfort and convenience for people of all abilities to use all modes of transportation.
In the project’s next phase of work, the JBNA’s Active Transportation Committee will consult with residents on different concepts for making the neighbourhood's infrastructure better reflect their everyday transportation preferences and needs. The Committee looks forward to inviting the City’s staff and Council to participate in this process and reporting back the community’s preferences.
25
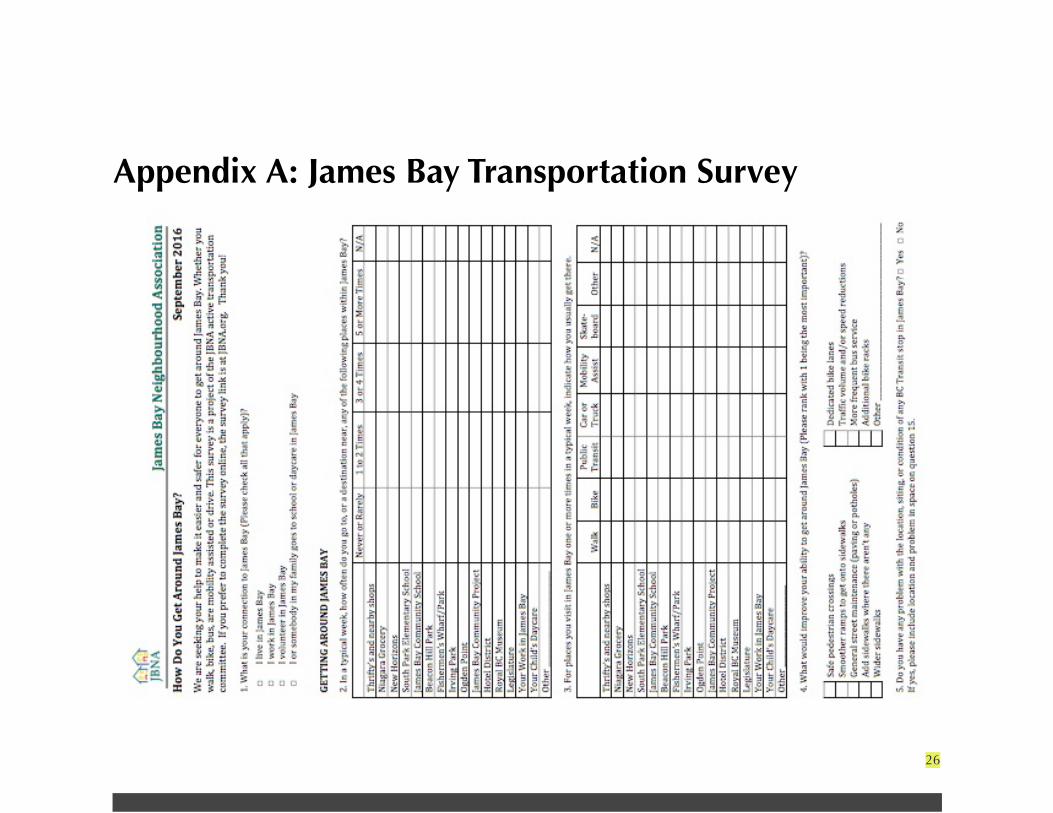
Appendix A: James Bay Transportation Survey
26

27

Appendix B: City of Victoria Transportation Hierarchy
28
Source: City of Victoria. Official Community Plan.

Appendix C: Traffic Accidents Involving Pedestrians or People Riding Bikes
29
Source: ICBC Statistics (2009-2013), http://www.icbc.com/about-icbc/newsroom/Pages/Pedestrians.aspx
Source: City of Victoria, Biketoria Project.

Appendix D: Major Events Held in James Bay
A list of some of the major events that impact transportation flows into and around James Bay:
• Times Colonist10k • Canada Day July 1 • Legislature Criterion • Symphony Splash • Tour de Victoria • Marathon • Remembrance Day
• 241 cruise ships over 119 days • Antique car rallies • Demonstrations • Pride Parade • Christmas Parade • Victoria Day Parade
30
The antique car rally in the summer of 2016 was enjoyed by tens of thousands of people and closed down a number of major connecter roads into and out of James Bay over the course of an entire weekend.


![James Bay Neighbourhood Plan [PDF - 8.7 MB]](https://static.fdocuments.us/doc/165x107/5868bfdb1a28ab61568baf36/james-bay-neighbourhood-plan-pdf-87-mb.jpg)