Germanium in fly ash and its spectrochemical determination
22
Transcript of Germanium in fly ash and its spectrochemical determination


Digitized by the Internet Archive
in 2012 with funding from
University of Illinois Urbana-Champaign
http://archive.org/details/germaniuminflyas216mach

nnEDni
CIRCULAR 215
ILLINOIS STATE GEOLOGICAL SURVE>URBANA
114
STATE OF ILLINOISWILLIAM G. STRATTON, GovernorDEPARTMENT OF REGISTRATION AND EDUCATIONVERA M. BINKS, Director
GERMANIUM IN FLY ASHAND ITS SPECTROCHEMICALDETERMINATION
byJ.S. Machin
Juanita Witters
DIVISION OF THE
ILLINOIS STATE GEOLOGICAL SURVEYJOHN C FRYE. Chief URBANA
CIRCULAR 216 1956
ICL1NOIS GEOLOGICA?
SURVEY (JP r
JUL 5 1953
GERMANIUM IN FLY ASH AND ITSSPECTROCHEMICAL DETERMINATION
by
J. S. Machin and Juanita Witters
ABSTRACTThirty-four samples of fly ash from coal were collected from
public utility steam power plants in Chicago and downstate Illinois
to determine whether the ash were a possible source of germani-um. The germanium oxide content of the ashes ranged from 0.046
to 0.004 percent. It is improbable that germanium oxide content of
less than 0.1 percent would be of commercial interest. A high-volt-
age A.C. arc spectrochemical method used for the determination of
germanium is described. A short resume of the occurrence, uses,
and market for germanium is included.
PART I. INTRODUCTION
by
J. S. Machin
Historical Background
In 1871 Mendeleef, the great Russian chemist, on the basis of his periodic
arrangement of the chemical elements predicted the discovery of a then un-
known element. He called the element ekasilicon and predicted some of its
properties. Fifteen years later Winkler found the element in the mineral ar-
gyrodite and it received the name germanium.Germanium is estimated to be present in the earth's crust in amounts of
the order of 0.1 to 0.2 ounce per ton (Goldschmidt, 1935). This is the sameorder of magnitude as the average concentration of arsenic, tin, and lead in the
earth's crust. These metals, however, occur in relatively concentrated deposits,
whereas germanium, with comparatively few exceptions, occurs thinly dispersedand associated with a variety of sulfide and silicate minerals with a preferencefor those types which had their origin in processes involving water at elevated
temperatures and pressures (Rankama and Sahama, 1950). Carbonaceous ma-terials, particularly coal, contain germanium in amounts of the order of a fewparts per million (Goldschmidt, 1930).
The quantity of germanium in coal generally is about the same as in other
sedimentary materials. Some coals, however, have a germanium content nota-bly above average. A rather extensive survey of American coals by Stadnichenkoand co-workers (1953) indicated wide distribution of germanium in our coals,
but no large deposit was located in which the concentration of the metal washigh enough to invite commercial exploitation under present market conditions.
Germanium has assumed increasing importance during the last 15 yearsowing to the development of a germanium rectifier having unusually desirable
properties, and owing even more to the invention of an amplifying device which
[3]
4 ILLINOIS STATE GEOLOGICAL SURVEY
physicists have named the transistor and which has assumed critical impor-
tance in the electronics industry. Another application of germanium that per-
haps has attracted less public attention is its use in certain types of illumin-
ating equipment to modify the character of light produced, in such a way as to
make it more nearly like daylight.
Advances in the application of semiconductors (a name applied to materials
having electrical characteristics similar to those of germanium) and their uti-
lization in defense equipment during World War II and more recently in com-
mercial and military equipment, created a growing market for germanium that
has at times resulted in a market price of about $350 per pound for the refined
metal. The price in July 1955 was about $250 per pound. The future outlook
for the germanium market is not clear. Some competitive materials, notably
silicon, have properties in some respects superior to those of germanium. , It
seems likely, however , that despite this competition germanium will not in the
near or perhaps even the foreseeable future cease to be an important metal in
the electronics industry. There have been estimates that the need for germa-
nium in the United States in 1956 would be several times the 1953 production.
It is doubtful whether the extent to which substitute materials have since enter-
ed into the picture was considered in making the estimates. In any event the
shortage, if existent, was not reflected in the price as of July 1955.
The Eagle -Picher Co. has been the most important producer of germani-
um in the United States. This company has produced it as a by-product of their
zinc operation at Henryetta, Oklahoma (Thompson and Musgrave, 1952). The
production in 1953 was estimated at about three tons. There are other produc-
ers in the United States, but their production is believed to be small as yet.
In Great Britain germanium is produced almost exclusively from gas-works
flue dusts (Crawley, 1955). The Japanese have produced it on a pilot-plant
scale from gas-works liquor (K. Nagashima, personal communication).
The fact that germanium is widely distributed in coals and that it was sue-,
cessfully extracted from flue dust from gas producers in England, naturally
suggested that fly ash from large coal-burning steam -gene rating installations
might contain concentrations of germanium. This thought prompted investiga-
tion of fly ashes.
Forrest et al. (1955) examined 60 samples of dust and deposits from vari-
ous types of steam power plants in England with discouraging results. Theyfound indications of some concentration of germanium at various parts of steam-
generating equipment. They found some enrichment of germanium in the fly
ash from some stoker -fired equipment, but the amounts were not large enough
to pay for recovery in general.
Germanium in Illinois Power Plants
Samples of fly ash were collected for our study from a number of the large
steam-powered electric -generating plants located in Chicago and in several
widely separated places in downstate Illinois. The samples were analyzed for
germanium by a spectrochemical method developed by Witters and described
in part II of this report. The results are set forth in tables 3 and 6.
One -tenth percent germanium, corresponding to about 14 hundredths per-
cent GeO^, tentatively may be assumed to be about the minimum amount that
GERMANIUM IN FLY ASH FROM COAL 5
might conceivably be considered of commercial interest in a fly ash. It will
be seen on examination of the data that none of the fly ashes sampled contain
even this minimum amount.
We found no published report of any research on the mechanism by whichgermanium is transported in combustion dusts or gases. The fact that it is
concentrated in gas liquors and in the flue dusts in closed systems such as gasproducers suggests that it may be transported as a vapor that, when it arrives
at some point where the temperature conditions are favorable, condenses on
any dust particles or cool surface with which it comes in contact. It is not
even known in what form germanium occurs in coal. There is some evidence
that it is associated with the carbonaceous part of the coal rather than with the
associated minerals such as pyrite, clay, or calcite.
When more is known of the fundamentals of the mechanism of transport,
it may be possible to modify the design of steam-generating equipment to favor
collection of the germanium present in the fuel.
The present powdered-coal installations, which are most commonly usedfor large steam-generating plants, should not be expected to be good sources
of germanium because all the ash is carried along with the products of com-bustion. Chain-grate or other stoker types of installations are more likely to
concentrate germanium in the fly ash because the fly ash forms only a smallproportion of the total ash.
PART II. SPECTROCHEMICAL PROCEDURE
by
Juanita Witters
The spectrochemical method herein described provides for the determina-
tion of 0.01 to 0.08 percent of germanium oxide occurring in fly ash from coal.
It is a preliminary stage in our effort to develop an analytical method that will
be free of composition effects. The spectrochemical method provides a basis
for selection of samples whose compositions show a significant effect on ger-
manium line intensity. The method can be used for quantitative analysis with
calibration checks for samples having a composition not covered by the current
composition study.
Outline of Method
The steps in the procedure were developed from a method suggested by
Kenneth B. Thomson of this laboratory. The composition of each sample is
determined by a preliminary semiquantitative D.C. arc excitation. Bismuth as1 Bi203 is then added to the fly ash as an internal standard and the powder mix-
ture is packed in a shallow annular cavity in a graphite electrode. The high-
voltage A.C. arc spectrum is photographed. All exposures are step-sectored
to provide an intensity calibration. Analytical calibration is provided by addi-
tions of Ge02 to samples selected to cover the composition range encountered.
Apparatus
Commercially available spectrographs equipment is used with modifica-
tion as indicated.
ILLINOIS STATE GEOLOGICAL SURVEY:
1. Excitation source. - The source of excitation is a modified 4600-volt
A.C. arc unit of a National Spectrographs Laboratories, Inc., "Spec Power."
2. Spectrograph. - The spectrograph is a Bausch and Lomb large quartz 1
Littrow, having a nominal reciprocal linear dispersion of 5 A per mm at 3200
A.3. Recording equipment. - The spectrum is recorded on an Eastman Ko-
dak 33 plate. Five stepped exposures are taken on a 4 by 10 inch plate.
4. Microphotometer. - The transmittances of the spectral lines are meas
ured with a Jarrell-Ash JA-200 nonrecording microphotometer.
5. Developing equipment. - The plate is processed in a thermostatically
controlled rocking developing machine, washed in running water, and dried in
a warmed air stream.
6. Sample preparation equipment. - Samples are ground and mixed by a
motor -driven mullite pestle and mortar.
Procedure
Standard samples. - All standards are prepared by adding chemically
pure GeO^ (Bi not detected) to similar uniform portions of fly ash samples. Aseries of such additions are made to each of several samples selected to cover
the range of composition of the samples submitted for analysis, the range hav-
ing been determined by a preliminary semiquantitative D.C. arc excitation and
analysis. For each such sample a minimum of three additions are made, equiv-
alent to about 1/2 X, X, and 2X percent GeO^, where X percent Ge02 is equiv-
alent to the Ge spectrochemically observed. One part Bi^Os (reagent grade;
Ge not detected) is added to 29 parts ash to serve as an internal standard. Stoc .
of Ge02 and of Bi£03 are hand -ground in a mullite mortar and pestle to pass a
200-mesh silk screen.
A preliminary mixture of ash plus 1 percent Ge02 is made by adding 30.0
mg Ge02 to 2.970 gm of ash. The mixture is tumbled in a stoppered vial, then,
ground and mixed to sufficient uniformity. Separate portions are then diluted
with ash and Bin03 added to form the three or more desired addition standards.
(Erratic location of the four or more calibration points obtained would suggest
an insufficient blending of Ge07 in the preliminary mixture or errors in sub-
sequent weighing.) If the desired addition level is less than .01 percent Ge02»!
:
two separate preliminary mixtures of 1 percent and 3 percent added Ge02 are
made. Each becomes the head of a decade dilution series carried down to the
required addition level.
Sample preparation . - The amounts of sample submitted have ranged from
about 200 grams to a few kilograms. The entire sample is transferred to a
large sheet of clean brown paper. Any lumps are removed to a mullite mortar,
crushed, and returned. The sample is gently rolled and tumbled on the paper
about three times the period required for visible uniformity. One or more por-
tions of about 15 grams is removed. Use of two or more portions as separate
samples shows the analytical uniformity at this stage. The sample is quartered
by parting, opposite quadrants retained, retumbled, and again parted. Conven-tional quartering apparatus is avoided because of possible loss of fly-ash fines,
which might be expected to be richer in Ge than the sample mean. One part
Bi2°3> ground to pass 200-mesh, is added to 29 parts of dry ash. Heating or
GERMANIUM IN FLY ASH FROM COAL 7
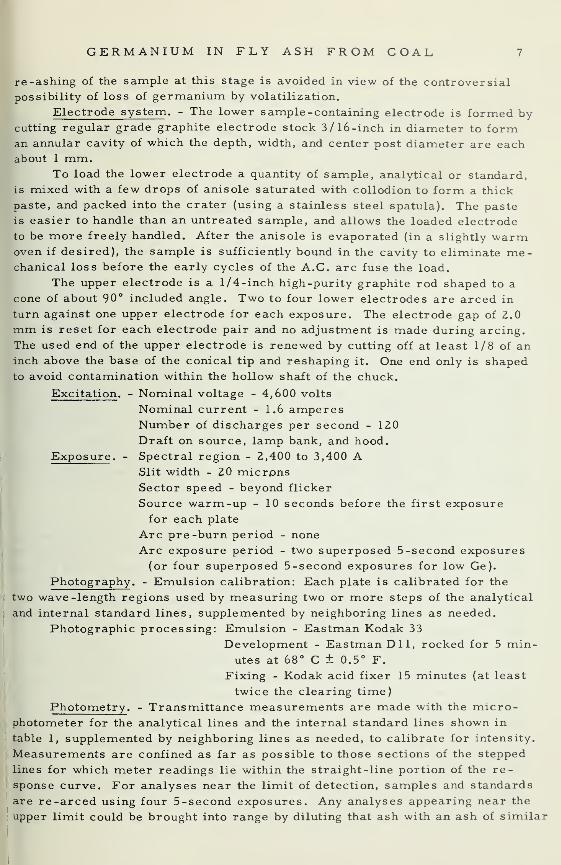
re -ashing of the sample at this stage is avoided in view of the controversialpossibility of loss of germanium by volatilization.
Electrode system . - The lower sample -containing electrode is formed bycutting regular grade graphite electrode stock 3/16-inch in diameter to forman annular cavity of which the depth, width, and center post diameter are eachabout 1 mm.
To load the lower electrode a quantity of sample, analytical or standard,
is mixed with a few drops of anisole saturated with collodion to form a thick
paste, and packed into the crater (using a stainless steel spatula). The paste
is easier to handle than an untreated sample, and allows the loaded electrode
to be more freely handled. After the anisole is evaporated (in a slightly warmoven if desired), the sample is sufficiently bound in the cavity to eliminate me-chanical loss before the early cycles of the A.C. arc fuse the load.
The upper electrode is a 1/4-inch high -purity graphite rod shaped to a
cone of about 90° included angle. Two to four lower electrodes are arced in
turn against one upper electrode for each exposure. The electrode gap of 2.0
mm is reset for each electrode pair and no adjustment is made during arcing.
The used end of the upper electrode is renewed by cutting off at least 1/8 of aninch above the base of the conical tip and reshaping it. One end only is shapedto avoid contamination within the hollow shaft of the chuck.
Excitation . - Nominal voltage - 4,600 volts
Nominal current - 1.6 amperesNumber of discharges per second - 120
Draft on source, lamp bank, and hood.
Exposure . - Spectral region - 2,400 to 3,400 ASlit width - 20 micrpnsSector speed - beyond flicker
Source warm-up - 10 seconds before the first exposurefor each plate
Arc pre -burn period - none
Arc exposure period - two superposed 5-second exposures
(or four superposed 5-second exposures for low Ge).
Photography . - Emulsion calibration: Each plate is calibrated for the
two wave-length regions used by measuring two or more steps of the analytical
and internal standard lines, supplemented by neighboring lines as needed.
Photographic processing: Emulsion - Eastman Kodak 33
Development - Eastman Dll, rocked for 5 min-
utes at 68° C ± 0.5° F.
Fixing - Kodak acid fixer 15 minutes (at least
twice the clearing time)
Photometry . - Transmittance measurements are made with the micro-photometer for the analytical lines and the internal standard lines shown in
table 1, supplemented by neighboring lines as needed, to calibrate for intensity.
Measurements are confined as far as possible to those sections of the stepped
lines for which meter readings lie within the straight-line portion of the re-
sponse curve. For analyses near the limit of detection, samples and standards
are re-arced using four 5-second exposures. Any analyses appearing near the
upper limit could be brought into range by diluting that ash with an ash of similar
8 ILLINOIS STATE GEOLOGICAL SURVEY
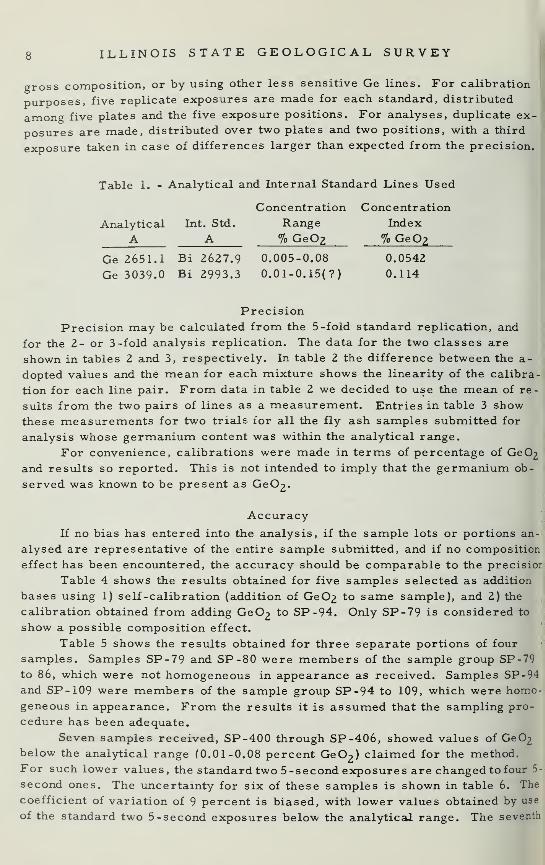
gross composition, or by using other less sensitive Ge lines. For calibration
purposes, five replicate exposures are made for each standard, distributed
among five plates and the five exposure positions. For analyses, duplicate ex-
posures are made, distributed over two plates and two positions, with a third
exposure taken in case of differences larger than expected from the precision.
Table 1. - Analytical and Internal Standard Lines Used
Concentration Concentration
Analytical Int. Std. Range Index
A A % GeQ2 % GeQ2
Ge 2651.1 Bi 2627.9 0.005-0.08 0.0542
Ge 3039.0 Bi 2993.3 0.01-0.15(7) 0.114
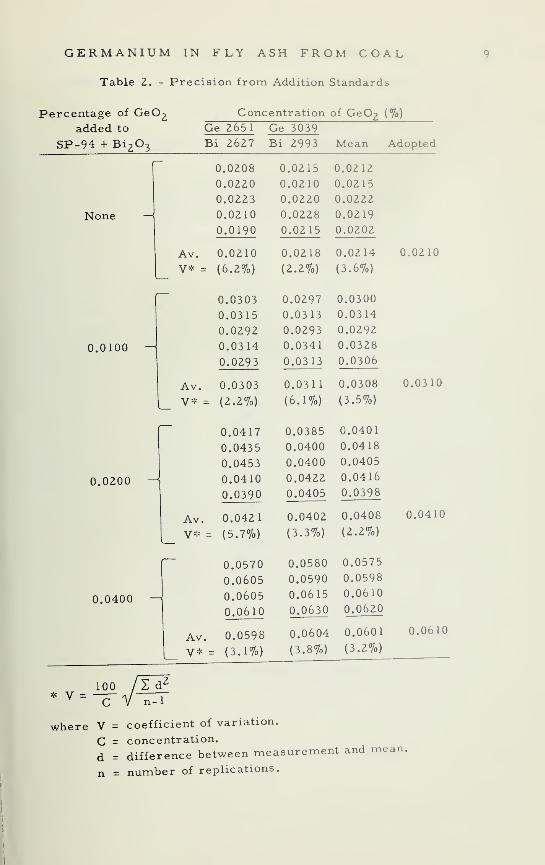
Precision
Precision may be calculated from the 5 -fold standard replication, and
for the 2- or 3 -fold analysis replication. The data for the two classes are
shown in tables 2 and 3, respectively. In table 2 the difference between the a-
dopted values and the mean for each mixture shows the linearity of the calibra-
tion for each line pair. From data in table 2 we decided to use the mean of re-
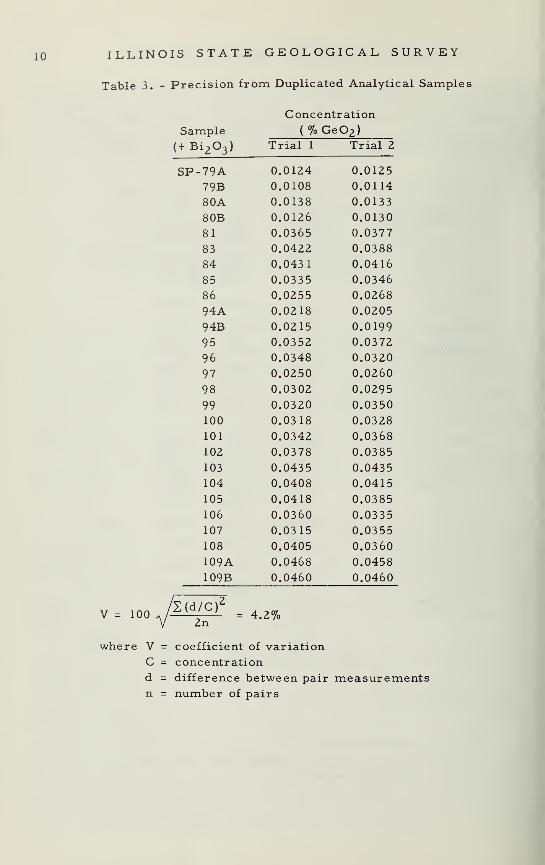
sults from the two pairs of lines as a measurement. Entries in table 3 show
these measurements for two trials for all the fly ash samples submitted for
analysis whose germanium content was within the analytical range.
For convenience, calibrations were made in terms of percentage of Ge02and results so reported. This is not intended to imply that the germanium ob-
served was known to be present as Ge02«
Accuracy
If no bias has entered into the analysis, if the sample lots or portions an-
alysed are representative of the entire sample submitted, and if no composition
effect has been encountered, the accuracy should be comparable to the precisior
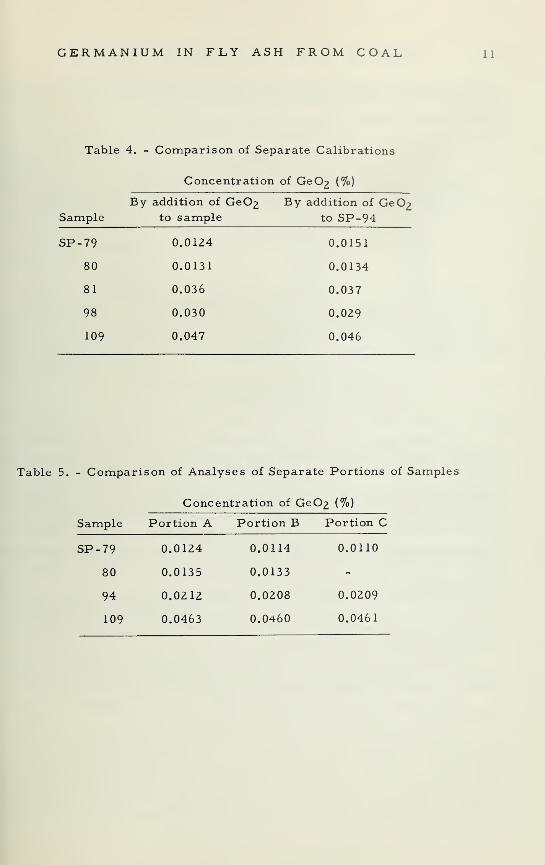
Table 4 shows the results obtained for five samples selected as addition
bases using 1) self -calibration (addition of Ge02 to same sample), and 2) the
calibration obtained from adding Ge02 to SP-94. Only SP-79 is considered to
show a possible composition effect.
Table 5 shows the results obtained for three separate portions of four
samples. Samples SP-79 and SP-80 were members of the sample group SP-79
to 86, which were not homogeneous in appearance as received. Samples SP-94and SP-109 were members of the sample group SP-94 to 109, which were homo-
geneous in appearance. From the results it is assumed that the sampling pro-
cedure has been adequate.
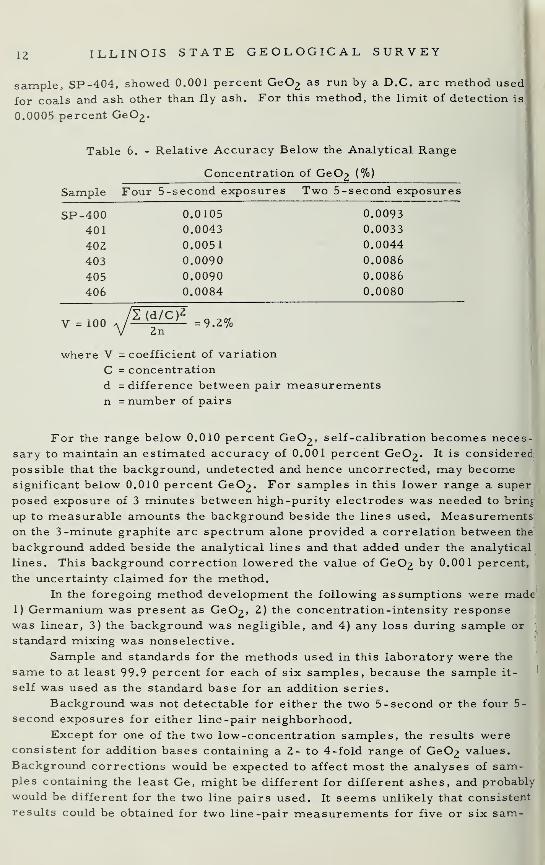
Seven samples received, SP-400 through SP-406, showed values of GeO£below the analytical range (0.01-0.08 percent Ge0
2 ) claimed for the method.For such lower values, the standard two 5 -second exposures are changed to four 5-
second ones. The uncertainty for six of these samples is shown in table 6. The
coefficient of variation of 9 percent is biased, with lower values obtained by use
of the standard two 5 -second exposures below the analytical range. The seventh
GERMANIUM IN FLY ASH FROM COAL
Table 2. - Precision from Addition Standards
Percentage of Ge02
Concentration of Ge02 (%)
added to
SP-94 + Bi 2 3
Ge 2651 Ge 3039
Bi 2627 Bi 2993 Mean Adopted
None
0.0208
0.0220
0.0223
0.0210
0.0190
0.0100
0.0200 ~i
0.0400
Av. 0.0210
V* = (6.2%)
0.0303
0.0315
0.0292
0.0314
0.0293
Av. 0.0303
V* = (2.2%)
0.0417
0.0435
0.0453
0.0410
0.0390
Av. 0.0421
V* - (5.7%)
0.0570
0.0605
0.0605
0.0610
Av. 0.0598
V* = (3.1%)
* Vioo /S a 2
~C~V n-l
0.0215 0.0212
0.0210 0.0215
0.0220 0.0222
0.0228 0.0219
0.0215 0.0202
0.0218
(2.2%)
0.0214
(3.6%)
0.0297 0.0300
0.0313 0.0314
0.0293 0.0292
0.0341 0.0328
0.0313 0.0306
0.0311
(6.1%)
0.0385
0.0400
0.0400
0.0422
0.0405
0.0402
(3.3%)
0.0580
0.0590
0.0615
0.0630
0.0604
(3.8%)
0.0308
(3.5%)
0.0401
0.0418
0.0405
0.0416
0.0398
0.0408
(2.2%)
0.0575
0.0598
0.0610
0.0620
0.0601
(3.2%)
= coefficient of variation,
C = concentration.
0.0210
0.0310
0.0410
0.0610
c
where V
d = difference between measurement and mean,
n = number of replications
10 ILLINOIS STATE GEOLOGICAL SURVEY
Table 3. - Precision from Duplicated Analytical Sample
Concentration
Sample (%GeOz )
(+Bi 2 3 ) Trial 1 Trial 2
SP-79A 0.0124 0.0125
79B 0.0108 0.0114
80A 0.0138 0.0133
8OB 0.0126 0.0130
81 0.0365 0.0377
83 0.0422 0.0388
84 0.0431 0.0416
85 0.0335 0.0346
86 0.0255 0.0268
94A 0.0218 0.0205
94B 0.0215 0.0199
95 0.0352 0.0372
96 0.0348 0.0320
97 0.0250 0.0260
98 0.0302 0.0295
99 0.0320 0.0350
100 0.0318 0.0328
101 0.0342 0.0368
102 0.0378 0.0385
103 0.0435 0.0435
104 0.0408 0.0415
105 0.0418 0.0385
106 0.0360 0.0335
107 0.0315 0.0355
108 0.0405 0.0360
109A 0.0468 0.0458
109B 0.0460 0.0460
1002(d/cy
2n= 4.2%
where V = coefficient of variation
C = concentration
d = difference between pair measurementsn = number of pairs
GERMANIUM IN FLY ASH FROM COAL 11
Table 4. - Comparison of Separate Calibrations
Concentration of GeO£ (%)
By addil
SampleBy addition of GeO^ By addition of Ge02
to sample to SP-94
SP-79 0.0124
80 0.0131
81 0.036
98 0.030
109 0.047
0.0151
0.0134
0.037
0.029
0.046
Table 5. - Comparison of Analyses of Separate Portions of Samples
Concentration of GeO£ (%)
Sample Portion A Portion B Portion C
SP-79 0.0124 0.0114 0.0110
80 0.0135 0.0133 -
94 0.0212 0.0208 0.0209
109 0.0463 0.0460 0.0461
l Z ILLINOIS STATE GEOLOGICAL SURVEY
sample, SP-404, showed 0.001 percent Ge02 as run by a D.C. arc method used
for coals and ash other than fly ash. For this method, the limit of detection is
0.0005 percent Ge02 .
Table 6. - Relative Accuracy Below the Analytical Range
Concentration of Ge02 (%)
Sample Four 5-second exposures Two 5-second exposures
0.0093
0.0033
0.0044
0.0086
0.0086
0.0080
SP-400 0.0105
401 0.0043
402 0.0051
403 0.0090
405 0.0090
406 0.0084
v =100A
/li|Z£li =9 .2%
where V = coefficient of variation
C = concentration
d = difference between pair measurementsn = number of pairs
For the range below 0.010 percent GeO^, self -calibration becomes neces-
sary to maintain an estimated accuracy of 0.001 percent Ge02 . It is considered
possible that the background, undetected and hence uncorrected, may becomesignificant below 0.010 percent Ge02 . For samples in this lower range a super
posed exposure of 3 minutes between high-purity electrodes was needed to bring
up to measurable amounts the background beside the lines used. Measurementson the 3 -minute graphite arc spectrum alone provided a correlation between the
background added beside the analytical lines and that added under the analytical
lines. This background correction lowered the value of Ge02 by 0.001 percent,
the uncertainty claimed for the method.
In the foregoing method development the following assumptions were made''
1) Germanium was present as Ge02 , 2) the concentration-intensity response
was linear, 3) the background was negligible, and 4) any loss during sample or
standard mixing was nonselective.
Sample and standards for the methods used in this laboratory were the
same to at least 99.9 percent for each of six samples, because the sample it-
self was used as the standard base for an addition series.
Background was not detectable for either the two 5-second or the four 5-
second exposures for either line-pair neighborhood.
Except for one of the two low -concentration samples, the results wereconsistent for addition bases containing a 2- to 4 -fold range of Ge02 values.
Background corrections would be expected to affect most the analyses of sam-ples containing the least Ge, might be different for different ashes, and probably
would be different for the two line pairs used. It seems unlikely that consistent
results could be obtained for two line -pair measurements for five or six sam-
GERMANIUM IN FLY ASH FROM COAL 13
pies of 2- to 4-fold different concentration if undetected background were sig-
nificant.
The precision of the A.C. arc is dependent on reproducible volatilization
of the sample from the electrode as well as on reproducible excitation of the
material in the analytical gap. Accordingly, arcing to exhaustion is to be avoid-
ed with the A.C. arc source with which the exposure period is confined to a
period of reproducible emission for analytical element and internal standard.
Increasing the arcing period beyond this condition brings about erratic results.
The period used was selected from trials made for two 5-second, four 5 -sec-
ond, one 10-second, two 10-second, and one 20-second exposures.
Selection of a proper internal standard makes the arcing period a less
critical factor.
SummaryWith the spectrochemical method described for use of the high voltage
A.C. arc for the analysis of germanium in fly ash, a precision of 4 percent is
obtained for the analytical range from 0.01 to 0.08 percent Ge02» For lowervalues down to 0.004 percent Ge02» the precision of 10 percent accuracy is con-
sidered comparable.
REFERENCESCrawley, R.H. A., 1955, Sources of germanium in Great Britain: Nature, v. 175,
no. 4450, p. 291.
Forrest, J. D., et al., 1955, Germanium in power station boiler plant: Nature,
v. 175, no. 4456, p. 558.
Goldschmidt, V. M., 1930, Uber das Vorkommer des Germaniums in Steinkohlen
und Steinkohlen-Produkten: Nachr. Ges. Wiss. Gottingen, Math.-physik.
Klasse, v. 398.
Goldschmidt, V. M., 1935, Rare elements in coal ashes: Ind. and Eng. Chem-istry> v. 27, no. 9, p. 1100.
Rankama, Kalervo, and Sahama, Th. G., 1950, Geochemistry, p. 729-737, The
University of Chicago Press.
Stadnichenko, Taisia, et-al., 1953, Concentration of germanium in the ash of
American coals: A progress report: U.S. Geol. Survey Circ. 272.
Thompson, A. P., and Musgrave, J. R., 1952, Germanium, produced as a by-
product, has become of primary importance: Journal of Metals, v. 4, no.
11.


ILLINOISJ&uidofjCvicofa'I
CIRCULAR 216
ILLINOIS STATE GEOLOGICAL SURVEYURBANA