German Economic Team Moldova - get-moldau.de · We would like to thank our colleagues Angela...
30
German Economic Team Moldova Policy Study Series [PS/01/2017] The economic impact of FDI in Moldova - Results from an empirical analysis - Woldemar Walter, Matthias Luecke, Adrian Lupusor Berlin/Chişinău, October 2017
Transcript of German Economic Team Moldova - get-moldau.de · We would like to thank our colleagues Angela...

German Economic Team Moldova
Policy Study Series [PS/01/2017]
The economic impact of FDI in Moldova
- Results from an empirical analysis -
Woldemar Walter, Matthias Luecke, Adrian Lupusor
Berlin/Chişinău, October 2017

II
About the German Economic Team Moldova
The German Economic Team Moldova (GET Moldova) advises the Moldovan government and other Moldovan state authorities such as the National Bank on a wide range of economic policy issues. Our analytical work is presented and discussed during regular meetings with high-level decision makers. GET Moldova is financed by the German Federal Ministry of Economics and Energy. Our publications are publicly available at our website (www.get-moldova.de).
German Economic Team Moldova (GET Moldova) c/o BE Berlin Economics GmbH Schillerstr. 59 D-10627 Berlin Tel: +49 30 / 20 61 34 64 0 Fax: +49 30 / 20 61 34 64 9 [email protected] www.get-moldau.de
About the Authors
Professor Matthias Lücke is a senior researcher at the Kiel Institute for the World Economy, an adjunct professor at Kiel University, and a Fellow at the CASE Centre for Social and Economic Research, Warsaw.
His research interests include the development impact of labour migration and remittances in migrants’ countries of origin, resource-based development (especially in Central Asia), international trade policy, and the relationship between globalization, technological change, and income inequality.
From 2000 until 2003, Matthias Lücke was a senior economist at the IMF where he worked on the country desks for Turkmenistan, Kazakhstan, and Moldova, covering macroeconomic developments, systemic transformation, and programme administration.
Professor Lücke has been a consultant to several national governments and international organizations, especially on issues related to WTO accession and labour migration. His teaching at Kiel University focusses on the economics of European integration. Since 2011 Professor Lücke is a senior consultant for international trade policy and labour migration with the German Economic Team Moldova.
Contact: [email protected] +49 30 / 20 61 34 64 0
Woldemar Walter is project manager of the German Economic Team Moldova and consultant at Berlin Economics. His work focuses on macroeconomic country analysis and trade related issues.
Mr. Walter completed his B.Sc. and M.Sc. in public economics at the Free University of Berlin, and has worked in the Federal Ministry of Finance, Deutsche Bank Research, and the Market Economy Foundation.
Contact: [email protected] +49 30 / 20 61 34 64 51
© 2017 German Economic Team Moldova
All rights reserved.

III
Executive Summary
Most people would agree that FDI is important for Moldova; however, nobody so far has been able to quantify the role of FDI in the Moldovan economy. This is not only a problem for economic research, but also for economic policy making. Without knowing and quantifying the impact of FDI on the economy, it is more difficult to argue for further FDI attraction.
One major reason for this situation is the lack of processed data on the importance of FDI in the economy. While the raw data already exist, they have not been processed as needed. In order to fill this gap, we have joined forces with the National Bureau of Statistics to process the relevant data and analyse the impact of FDI on different economic variables.
In order to show where Moldova stands in terms of FDI attraction, we first look at the stock of FDI as calculated by the National Bank of Moldova (NBM). In 2015, FDI stock in Moldova amounted to USD 741 per capita or 41% of GDP. Both values are not high in international comparison. Therefore, there appears to be much room to attract more FDI. EU countries are the main source of FDI, accounting for 61% of Moldova’s FDI stock.
In a further step, based on the processed data from the NBS, we analyse the contribution of companies with FDI (i.e. wholly foreign or mixed ownership) to the Moldovan economy:
Relevance of companies with FDI in Moldova Number of
entreprises Value added Employment CIT revenues
Social security contirbutions
Mixed companies 3% 10% 6% 14% 10%
Foreign companies 4% 13% 9% 21% 11%
Total companies with FDI
7% 23% 15% 34% 21%
These numbers suggest that companies with FDI already play an important role in Moldova, despite the relatively low FDI stock. Companies with FDI are an essential part of the economy and have a strong economic impact. They tend to be bigger and more profitable than the average company, which makes them attractive for the government from a fiscal point of view.
Furthermore, companies with FDI are on average 71% more productive (value added/employee) than domestic companies, thus contributing to higher economic growth. Also, companies with FDI pay higher wages to their employees. Wages of mixed companies are 52% and of foreign companies 59% higher than average wages. Companies with FDI this way contribute to the wellbeing of the population and probably also mitigate emigration. This also implies that companies with FDI not only increase budget revenues through their payments of corporate income tax, but also through other taxes, which are connected to higher wages.
We also find that a large share of the output of manufacturing firms with FDI is exported. Many foreign-owned production facilities are part of the international value chains of their parent firms. Such manufactured exports provide external stability by helping to contain Moldova’s current account deficit.
All in all: FDI has a strong positive impact on the Moldovan economy. Therefore, more should be done to attract FDI.
Acknowledgements
We would like to thank our colleagues Angela Gherman-Cernei and Dumitru Nederita from the National Bank of Moldova and Iurie Mocanu and Andrei Craciun from the National Bureau of Statistics for helpful insights and explanations and providing the data, without which this analysis would not have been possible.

IV
Contents
1 Introduction .................................................................................................................................. 1
2 FDI: Concepts and data sources ..................................................................................................... 2
2.1 The two concepts of FDI used in this analysis ................................................................................ 2
2.2 Data sources Conclusion ............................................................................................................... 2
3 Why is FDI important for transition economies?............................................................................ 4
4 Analysis based on data of the National Bank of Moldova............................................................... 8
4.1 Aggregate FDI stock in Moldova – international comparison ......................................................... 8
4.2 FDI origin by countries .................................................................................................................. 9
4.3 FDI by sectors.............................................................................................................................. 11
5 Impact of companies with FDI on the overall economy – analysis based on data of the National Bureau of Statistics .................................................................................................................................... 12
6 Sectoral Analysis ......................................................................................................................... 18
6.1 Impact on value added ................................................................................................................ 18
6.2 Impact on employment ............................................................................................................... 20
6.3 Impact of companies with FDI on productivity............................................................................. 21
6.4 Impact on exports in manufacturing............................................................................................ 23

1
1 Introduction
We believe that there is a gap of information about the relevance of companies with FDI in Moldova. In fact, there are statistics on FDI flows and FDI stocks, and about where FDI is coming from, but there is little knowledge about the role played by companies with FDI in the economy – mainly because, although rich raw data exists, it has never been processed and analysed.
For this study, we have therefore cooperated with the National Bureau of Statistics to create a statistical database on companies with foreign or mixed ownership. On this basis, we can link existing FDI data to the role of companies with FDI in the Moldovan economy, including their share in national value added, employment, corporate income tax revenue, and social security contributions. Additionally, we analyse productivity and wages of companies with FDI and discuss the contribution of companies with FDI to Moldova’s manufactured exports. We conduct this analysis for the whole economy and disaggregated by sectors.
This paper is structured as follows.
In the second section we describe the definitions used and explain our data sources. In section three we discuss why foreign companies and FDI attraction is important for transition economies like Moldova, by reviewing the literature as well as several empirical studies regarding the effects of companies with FDI.
Section four shows how Moldova competes to other countries regarding FDI attraction by analysing FDI stocks. We disaggregate FDI by source countries and sectors. After that we analyse, in section five, what FDI means for the economy by showing the impact on the aforementioned variables.
In section six, finally, we are going even deeper in the analysis by showing the impact of FDI on the mentioned variables on various sectors of the economy. The sectoral analysis is interesting because there are large differences in the impact of FDI on different sectors. In addition, we can analyse the impact of FDI on exports that are only available for manufacturing.

2
2 FDI: Concepts and data sources
2.1 The two concepts of FDI used in this analysis
For our analysis we use two concepts of FDI. The first concept follows the balance of payments methodology of the IMF. The balance of payments is the method countries use to monitor all international monetary transactions for a specific period. The goal is to determine how much money is going in and out of a country. FDI is one part of these transactions. Basically speaking, FDI in this concept is the money a foreign investor is transferring into the country to buy shares of a company or providing a loan to a company. These transactions are only counted as FDI if the foreign investor has a “strategic long-term relationship with the direct investment enterprise to ensure a significant degree of influence by the direct investor in the management of the direct investment enterprise.” This “lasting interest” is evidenced when the investor owns at least 10% of the voting power of the enterprise.1 This data is calculated and published by National Banks. Because this definition is also used by the National Bank of Moldova (NBM) we call it NBM concept. This data is usually available on a stock and flow basis. For our analysis, only the stock is of interest. This stock shows FDI by sectors and by investing countries. To find out how well Moldova competes regarding FDI attraction, we compare the total amount of FDI in Moldova to the stocks in other countries. Another goal is to show, which sectors are attracting most FDI and are therefore, most attracting for investors.
The second concept we use, is not based on the balance of payments but on company data collected by the National Bureau of Statistics (NBS). International transfers play no role in this concept, it is only about finding out whether an enterprise has foreign capital in its share capital or not. Three cases are possible in the statistics. If a company has no foreign capital in its share capital, it is called domestic company. If it has more than 0% but less than 100% foreign capital in its share capital, it is called mixed company. And if a company has 100% foreign capital in its share capital, it is called foreign company2. The sum of mixed companies and foreign companies we call companies with FDI. To this definition we will refer in the rest of the study as NBS concept. The NBS data includes both a breakdown by different variables and sectors. While the NBM concept shows from which countries the money is coming and in which sectors it is invested, this data shows what its economic impact is. Thus, it provides a link to the real economy and enables us to show what effects FDI has on various variables. We are able to do it for the whole economy as well as for different sectors.
Conclusion: Two concepts are used in this study. The NBM concept is used to make international comparisons of FDI stocks, to show the source countries of FDI and to identify sectors with most FDI. The NBS concept is used to analyse the relevance and impact of FDI on the economy, which is the main purpose of this study.
2.2 Data sources Conclusion
We use data provided by the NBM and the NBS. The NBM is now the only institution which is responsible for the FDI data dissemination and publication, which was different in the past. The data published by
1 In contrast to direct investment there is portfolio investment, if the investor has a share of the company which is below 10%. In
this case, it is assumed that the investor has no influence on the management of the company. 2 Strictly speaking they should be called foreign owned company, but we follow here the terminology of the NBS.

3
the NBM does, however, not include all the data necessary for the present analysis. Therefore, we cooperated with the NBS to get additional data that is collected but not published in the necessary form.
For the international comparison and the origin of FDI we use NBM CDIS data (NBM concept). CDIS stands for Coordinated Direct Investment Survey. The CDIS dates back to an IMF initiative with the goal to improve the quality and availability of International Investment Position statistics (IIP).3 Data for CDIS statistics is compiled by the NBM from different forms. These include the “FDI survey 1-INVEST” and “Financial Statements” which are collected by NBS. Additionally, banks’ balance sheets, banks’ shareholder’s information and ITRS (International Transactions Reporting System) are used.
For the rest of the analysis, the analysis of the economic impact of FDI, we use NBS data (NBS concept). Part of the data is publicly available. The basis for our data was a sectoral disaggregation of economic activities according to NACE rev. 2 methodology available on the NBS webpage showing different enterprise indicators like number of enterprises, number of employees, turnover etc. These data are taken from companies’ financial statements. The disaggregation by form of ownership was, however, compiled by the NBS for our analysis. The NBS was able to provide the same table for foreign companies and for mixed companies and add additional variables. The main source of the data are again companies’ financial statements and the FDI survey “1-INVEST”, but other sources are also used. Value added data was compiled from national accounts data, wages from wages statistics etc.
There are some shortcomings of the NBS data: For foreign and mixed companies it does not include financial institutions. FDI data on financial institutions is collected and evaluated by the NBM only. This means that it is included in the indicators for the whole economy but not for foreign and mixed companies in our disaggregation, therefore, it is not useful to compare some indicators in the financial sector.
Another shortcoming is that no disaggregation at company level is possible as well as cross tables that show which country is investing in which sector. This is not possible due to confidentiality reasons.
3 At the moment, the CDIS data published by Moldova somewhat differs from the BoP definition described above. There is no
difference between FDI and portfolio investment. The share that would be portfolio investment in other countries is also counted as FDI in Moldova. However, we do not see these differences as a big problem. Most companies with a foreign share are completely foreign-owned companies and are FDI by any definition. Regarding the other investments there is certainly a share, which we treat as FDI what should be treated as portfolio investment but this share shouldn’t change the basic results.

4
3 Why is FDI important for transition economies?
Foreign direct investment is quite diverse: The foreign investor may acquire an existing domestic firm (brownfield investment) or establish a new firm (greenfield investment). The investor may focus on serving the market of the host country (horizontal investment) or on integrating local operations into international value chains (vertical investment). Conditions also vary across sectors, from the exploitation of non-renewable resources to wholesale and retail trade.
Yet in all these situations, the foreign firm enters into a close relationship with a domestic firm and exerts some measure of control over it. Because of the associated cost to the foreign firm, it is plausible that it will only do so if it plans to invest so much in this long-term relationship that the additional level of control is required to protect the investment. Such investment in the relationship may involve the transfer of technology, sharing of proprietary knowledge about business strategy, or the establishment of marketing channels.
Against this background, a large empirical research literature asks how FDI affects the performance of domestic firms, especially when the investor is based in an advanced economy and the investment is in a developing or transition economy. While it is immediately plausible that foreign-owned firms often benefit from transfers of technology and knowledge, empirical studies have also found spillovers to locally owned firms – for instance, through forward or backward linkages (purchases from or sales to locally owned firms) or through shared labour markets with locally owned firms (Box 2).
Possible social benefits from FDI through higher productivity carry an important policy implication. Very often, foreign investors are not rewarded through higher profits for the social benefits that they bring along. Rather, they may face extra costs if they invest in a developing or transition economy that is unfamiliar to them, especially if they are the first foreign investors to do so – either in the host country or in their particular sector. As a result, the host country may receive less foreign direct investment – and fewer of the associated social benefits – than would be optimal. This is an economic justification for carefully targeted government support to compensate foreign investors for their extra costs and associated social benefits. Such support would be additional to the host government’s important role in maintaining a supportive business environment for all firms, both domestically and foreign-owned.
When FDI inflows are large enough relative to GDP (see Section 4.1), they may have important macroeconomic consequences. As direct investors are interested in a long-term relationship with a domestic firm, there is a presumption that FDI is less volatile than other sources of external finance (foreign currency earnings) such as portfolio investment and international loans. This presumption was borne out in the financial crises in Asia and Russia during the late 1990s when investors withdrew short-term capital following a loss of confidence in the economic prospects of the host countries. While current FDI inflows may also fall during a crisis, investors are less likely to attempt to withdraw the existing FDI stock.
One upshot of this argument is that a current account deficit may be sustainable to the extent that it is financed through FDI inflows, whereas a similar deficit financed through government or corporate debt or portfolio investment would be more problematic.

5
Box 1: Impact of FDI on the economy of Poland
FDI had a crucial contribution to the modernisation of Poland’s economy4, which set the basis for what many call “Poland’s economic miracle5”. During the last 20 years, it managed to attract over USD 240 bn net inflows of FDI6, placing it the second top performer among its neighbors7 in this regard (the first one is Germany). During the same period of time, it boosted its GDP per capita8 by 2.2 times, allowing it to converge to the average level among its neighbors9. Moreover, Poland was the single country in Europe that did not experience recession during the international financial and economic turmoil of 2007-2009.
The main beneficiaries of the FDI inflows were companies from wholesale and retail trade, industrial and financial sectors10. These are sectors that usually generate relatively high value-added for the economy.
The benefits of FDI for the Polish economy are related also to increased efficiency and competitiveness of firms. According to estimations, firms that passed into foreign ownership began to grow faster – they increased added value at an annual rate of 2.2 percentage points greater than other companies11. Moreover, the FDI has strong intra-industry effects, as the benefits spread not only across firms that were taken over by foreign investors, but also across contractors, customers and suppliers12. This is explained by the fact that FDI came with important innovations in product, technology, management and marketing with strong positive spillover effects for the entire economy.
Also, FDI had a major role for boosting labor productivity. It is estimated13 an average 0.2% increase in gross-value added per employee due to FDI inflows. It set the basis for higher wages and more decent jobs that induced a higher well-being for the population. Particularly, the net effect of FDI on wages was estimated at 9-10% - the wages would have been lower without FDI. Importantly, the FDI did not only improve the levels of incomes of the population, but also their distribution: income inequality, measured by the Gini coefficient, would have been by 5% higher without FDI.
Last, but not least, the positive impact of FDI on the production of firms and incomes of the population, translated into larger tax base for the Government: there has been a 10-12 per cent increase in the tax base in the long term thanks to the inflow of FDI14. It reinforces the virtuous circle between FDI and economic growth, as more FDI lead to more revenues into the state budget, allowing the Government to invest more in infrastructure, attracting even more FDI.
While FDI is one important type of long-term relationship between foreign and domestic firms that may increase the productivity of domestic firms, it is not the only one. Other types of long-term inter-firm relationships may have similar effects, although they are sometimes more difficult to identify in available
4 “The Impact of Foreign Direct Investment: Contribution to the Policy economy in the past quarter century”, Polityka Insight, 2017
5 http://www.accaglobal.com/uk/en/member/member/accounting-business/2017/06/insights/poland-miracle.html 6 USD 240.6 bn Foreign direct investment (net inflows (BoP, current USD)), during 1996-2016. Source: World Bank. 7 Ukraine, Belarus, Slovak Republic, Czech Republic, Lithuania and Germany. 8 PPP (constant 2011 international Dollar). Source: World Bank. 9 From 81.6% in 1996 to 99.6%.
10 “The Impact of Foreign Direct Investment: Contribution to the Policy economy in the past quarter century”, Polityka Insight, 2017 11 Marcin Kolasa, „How does FDI inflow affect productivity of domestic firms? The role of horizontal and vertical spi llovers, absorptive capacity and competition,” NBP Working Paper, no. 42, 2007. 12 Nuno Crespo and Maria Paula Fontoura, „Determinant Factors of FDI Spillovers – What Do We Really Know?”, World Development, vol. 35, no. 3, pp. 410-425, 2007. 13 “The Impact of Foreign Direct Investment: Contribution to the Policy economy in the past quarter century”, Polityka Insight, 2017 . 14 Idem

6
data. For example, foreign firms that use outward processing often provide their partners not only with raw materials (as required for outward processing). They may also provide product designs, quality control, production machinery, or financing; they will naturally handle the marketing of the processed final product. While outward processing can be identified in international trade statistics, it is not as apparent from firm-level data as foreign ownership.
Other long-term relationships such as long-term purchase contracts are even less obvious, but may still improve firm performance. Over time, such close, long-term inter-firm relationships and the associated transfers of technological and business knowhow have helped many firms in developing and transition economies to emerge from an exclusive focus on processing operations to take on higher-value-added activities. Many policies that promote FDI by reducing international communication and other transaction costs also facilitate other long-term, international inter-firm relationships. When designing such policies, policy-makers may want to bear in mind such wider effects.
Box 2. The impact of FDI on the performance of domestic firms – research findings
There is a large empirical research literature on the effects and determinants of FDI in developing and transition economies. In this box, we discuss three strands of this literature that are especially relevant to understanding the possible contribution of FDI to structural transformation in transition economies and to the design of supportive policies. First, how does inward FDI affect the productivity of domestic firms? Second, how do foreign-owned firms affect the host country’s exports and imports? And third, what drives inward FDI in transition economies in a cross-country perspective? As a large amount of research has been conducted on these issues, we concentrate on recent, high-quality contributions, especially survey articles.
FDI and the productivity of host country firms
Foreign-owned firms typically pay substantially higher wages than domestic firm (Javorcik, 2015). This finding applies across many countries, sectors, and time periods. While there are many possible explanations, the most likely is that labour productivity in foreign-owned firms is higher. It has also been pointed out that foreign firms may be unfamiliar with the local labour market and therefore end up paying higher wages, or economic rents may be shared throughout a multinational enterprise, with local workers also benefiting.
If labour productivity (measured as output per worker) is indeed higher in foreign-owned firms, there are, again, several possible explanations that are not mutually exclusive. Foreign-owned firms may be more capital-intensive or they may require higher skills, possibly unobservable, from their workers. Most importantly for our purposes, many empirical studies find that foreign ownership tends to lead to higher total factor productivity (TFP) in host country firms. In this context, total factor productivity may be interpreted as a measure of technological progress. There is also evidence that some multinational firms provide more training to their workers and transfer technology in-house between parent and affiliate companies. In fact, passing on and protecting proprietary technological knowledge is one motive provide for setting up an affiliate, rather than cooperating with independent firms.
Often, technological advances and TFP growth are not limited to foreign-owned firms. Many studies have found spillovers of new technological knowledge to other host country firms through a variety of channels (Javorcik, 2008; Keller, 2010). Backward linkages (i.e. foreign-owned firms transferring new technological knowledge to their domestic suppliers) seem to be a particularly effective channel (Gorodnichenko et al., 2014; Hanousek et al., 2011). Backward linkages may operate not only within the manufacturing sector, but also when foreign investors in the retail sector support their domestic

7
suppliers in modernizing their products and production processes (Iacovone et al., 2011). Based on her review of this literature, Javorcik (2008) discusses how spillovers may justify carefully targeted policy interventions to promote foreign direct investment.
FDI and international trade at the firm level
The relationship between FDI and host country exports and imports depends crucially on the type of FDI (for a detailed discussion see Helpman, 2006). When firms decide how to serve a foreign market, they choose between exporting to the partner country directly or investing in the partner country to produce for the local market (“horizontal FDI”). To the extent that a foreign-owned firm targets the domestic market, it does not export its output, but it may import intermediate products that replace earlier imports of the final product.
By contrast, vertical FDI seeks to benefit from the host country’s comparative advantages and integrates operations in the host country into a multinational firm’s international production chains. A large share of output is typically exported; intermediate products are often imported. As a result, the host country becomes more intensely integrated into the international division of labour. Of course, higher exports are not an end in themselves. However, better access to export markets should clearly benefit developing and transition economies as they diversify and grow.
Determinants of FDI in developing and transition countries
A large literature addresses the determinants of FDI from a cross-country perspective. One concern is whether host countries might out-compete one another in terms of their policy interventions to attract FDI, particularly when they offer tax incentives and other subsidies to foreign investors. A race to the bottom might result, with hollowed-out government finances and low-quality government services, while total FDI to all countries together might not be much higher than in the absence of subsidies.
Empirical research findings generally do not bear out these concerns. By definition, foreign direct investors maintain physical operations in the host country. Thus their profitability depends not only on tax rates, but also on the quality of the local infrastructure, how well workers are educated, the efficient working of the public administration, etc. Therefore, investors tend to consider the whole package of taxes and public services and the cost of doing business more generally, in addition to other economic variables in line with Dunning’s OLI model (ownership, localisation, internalisation; Dunning, 1988).
For example, Demekas et al. (2007) study FDI in Central and South-Eastern Europe and find that “gravity” factors (host market size and geographical and cultural proximity between source and host country) dominate the allocation of FDI across countries. Other government policies play a more limited role: High corporate taxes discourage FDI, whereas an efficient infrastructure encourages FDI. Overesch and Wamser (2010) also find that company taxes in EU accession countries had only a relatively small effect on German FDI to the region. Kinda (2010) finds that a low-quality business environment reduces FDI in a wide range of developing countries. Based on these and many other studies, it is safe to conclude that host countries that seek to attract foreign direct investment should not focus on cutting tax rates, but should rather use their tax revenues wisely to provide high-quality public services and a good business environment.

8
4 Analysis based on data of the National Bank of Moldova
4.1 Aggregate FDI stock in Moldova – international comparison
In this section we compare the aggregate FDI stock in Moldova to peer countries. The NBM concept of FDI is used (see section 2.1 for details). Figure 1 shows the FDI stock per capita in USD for different countries in 2015. The top performer in this comparison is Estonia with an FDI stock per capita of over USD 14,000. Moldova has the second lowest stock in this group with around USD 741 per capita, a lower stock has only Ukraine with USD 623. Therefore, the Moldovan FDI capital stock is quite low according to this comparison.
Figure 1
FDI per capita USD per capita
Source: Own calculations based on IMF WEO and IMF CDIS data, 2015
This observation has to be qualified in two respects. First, official data (which we use in Figure 1) overestimate the population of Moldova. The official number is around 3.5 m, however the census in 2014 came to a result of around 3 m people. Secondly, such comparisons also have the disadvantage that countries differ strongly in terms of GDP. Countries that are economically bigger tend to have higher levels of foreign direct investment. For these reasons, a comparison of FDI stock with GDP is also useful. Figure 2 shows this comparison.
14,479
8,060
4,829 4,064 3,986 3,537
2,322 1,896 1,793 1,484 741 623
0
2,000
4,000
6,000
8,000
10,000
12,000
14,000
16,000USD per capita
9
Figure 2
FDI as share of GDP
Source: Own calculations based on IMF WEO and IMF CDIS data, 2015
A comparison of FDI stock with GDP shows a much more favourable picture. Moldova now holds a position in the middle. The FDI stock in USD now represents about 41% of GDP. In this comparison, Moldova is behind Macedonia and just ahead of neighbouring Romania. Georgia has a peak value with an FDI stock that is higher than the annual GDP. This is mainly due to large investments in the tourism sector as well as infrastructure in Georgia. Russia is last in this comparison with an FDI stock of just under 19% of GDP.
Conclusion: The assessment of the Moldovan FDI stock is, depending on the method, quite low to medium. The FDI per capita was USD 741 in 2015 or 41% of GDP. Therefore, there is plenty of room for improvement and it makes sense to further support FDI attraction.
4.2 FDI origin by countries
In this section, we show from which countries the investments come. The NBM concept for FDI is used. According to the NBM CDIS database total FDI was USD 2,634 m in 2015. Figure 3 shows the breakdown of source countries. As one can see, Russia is the most important source country for Moldovan FDI with 28%.15 However, the countries that follow are all members of the EU. If one adds up all investments from the EU, this shows that 61% of Moldova's FDI comes from the EU. The EU is therefore of paramount importance for Moldovan FDI.
15
One reason for the high share is the fact that Russian Gazprom owns 50% of the natural gas supplier Moldovagaz, which was acquired through a debt to equity swap in 2000. Russian FDI consists mainly of debt rather than equity.
106
85 78
50 48 41 40 38 38
32 29
19
0
20
40
60
80
100
120%

10
Figure 3
FDI by investing countries
Source: NBM, 2015
The chart shows some peculiarities, such as Cyprus being the third most important country of origin for FDI after Russia and the Netherlands. That is not very credible. In fact, these data show only the immediate investors' country. Countries often invest via Cyprus or the Netherlands through offshore companies, as this is easier from a legal point of view and perhaps in some cases also for other reasons. It is extremely difficult to determine the real investors in all cases, which is why such data are usually only available in this way. Such figures should, therefore, be treated with caution as they do not fully reflect all ultimate beneficial owners. Nevertheless, we believe that this is a good approximation of the real situation as European companies also use offshore companies for business.
Conclusion: The most important country of origin for Moldovan FDI is Russia with 28% FDI share. However, European countries together make up the vast majority (61%) of FDI in Moldova.
Russian Federation 28%
Netherlands 12%
Cyprus 8%
Spain 8%
France 8%
Romania 6%
Italy 5%
Germany 5%
United Kingdom 3%
Other EU countries 6%
United States 2%
Other 9%
EU-28 61%

11
4.3 FDI by sectors
To show the distribution of FDI investments across sectors the NBM concept is used. At the same time we use NBS value added data to compare FDI stock to the value added of the sectors. Six sectors account for more than 96% of FDI in Moldova. By far the most important sector accounting for one third of total FDI is the energy and water supply with USD 877 m investment.16 Second is the financial sector with USD 469 m; together with utility sector they account for over 50% of FDI stock.
Figure 4
Sector investment vs. value added
Source: NBM, NBS, 2015
The sectors that seem to be of most interest to investors are not the sectors with the highest value creation in Moldova. In 2015, only 3.5% of the country's value added was generated in the energy and water supply sector, while at the same time it is by far the most important sector for international investors. However, a large part of the share is likely to be the shares of Moldovagaz owned by Gazprom.
The situation is similar in financial intermediation. It accounted for 7.6% of value added in 2015. Against this background the share of 18% in FDI appears also quite high. Now there is a complicated situation in the banking sector regarding FDI as significant foreign shares of the three biggest banks were blocked by the NBM due to transparency issues. More recent data could therefore show a different picture.
The ratio of value added and FDI is much more balanced in manufacturing and wholesale and retail trade. Manufacturing accounts for around 14% in total value added and for 16% of FDI stock. Wholesale and retail trade account for 16% in value added and 9% in FDI stock. Interesting is also the situation in
16 Includes Moldovagaz as well as Red Unión Fenosa and Gas Natural Fenosa Furnizare Energie (subsidiaries of Gas Natural
Fenosa), which are engaged in electricity distribution and sales. These companies explain to a large extend the high value FDI stock in the sector even though we cannot quantify the definite amount as no company data is available.
33%
18% 16%
10% 9% 9%
1% 3%
8%
14%
4% 1%
16% 14%
0%
5%
10%
15%
20%
25%
30%
35%
Electricity, gasand water
supply
Financialintermediation
Manufacturing Real estate,renting and
businessactivities
Hotels andrestaurants
Wholesale andretail trade
Agriculture
Share in FDI Share of sector in value added

12
agriculture. Agriculture has a very high importance in the Moldovan economy, it accounted for 14% value added in 2015, but FDI stock is very low, only USD 35 m in 2015 or 1% of total FDI.
Conclusion: FDI is existent in all sectors of the Moldovan economy. It is, however, unequally distributed. FDI is concentrated in energy supply and financial intermediation, 33% and 18% of total FDI, respectively. The share of these sectors in value added is relatively small, 3% and 8%, respectively. In manufacturing, the share in investment is comparable to value added, 16% share in investment vs. 14% share in value added. At the same time there seems to be underinvestment in agriculture, only 1% of FDI, but 14% in value added.
5 Impact of companies with FDI on the overall economy – analysis based on data of the National Bureau of Statistics
After presenting the investment stocks in the last section, we will show in this part the impact of these investments on the economy. This is done using the NBS concept (see dection 2.1) and NBS date (see section 2.2). According to this data there were 36,132 active enterprises in Moldova in 2015, of which 1,308 were foreign, and 1,010 mixed. These are 4% and 3% of total active enterprises, respectively.
Figure 5
Number of companies with FDI in Moldova and EU
Source: NBS, Eurostat, 2015. Note: FATS statistics include only business economy.
That number seems to be quite high. For an international comparison we use the foreign affiliates statistics FATS from Eurostat. FATS focus on enterprises in which the companies are majority-owned by a single investor or by a group of associated investors acting in concert and owning more than 50% of ordinary shares or voting power. These numbers are, therefore, not perfectly comparable to the definition that is used in Moldova, because there is no 50% threshold but a “>0%” threshold in Moldova.
1% 1% 0.5%
6%
1% 4%
3%
0%
1%
2%
3%
4%
5%
6%
7%
8%
Moldova EU Estonia Poland Romania Slovakia
Mixed Foreign FATS (foreign and mixed with FDI>50%)
Share in companies
7%
13
Another difference in definition is that FATS statistics takes into account only the business economy17; Moldovan data, however, include the whole economy. Nevertheless, we believe that a comparison makes sense to get an understanding of the situation.
For the EU-28 the share of FATS enterprises makes up only 1% of total enterprises in business economy, but there are high differences among countries. In Romania that is closer to Moldova from the perspective of economic and historic development, they account for 6%. But there are also large differences among previous Soviet Union countries, e.g. Estonia has a share of only 1%. Against this background, foreign companies in Moldova seem to be relatively numerous.
The importance of companies with FDI becomes even more obvious when looking at the share in value added of these companies (see figure 6). The share of value added of foreign and mixed companies in Moldova is 13% and 10%, respectively - out of total MDL 104 bn value added including business and non-business economy. The share of companies with FDI is, however, somewhat underestimated as their value added in the financial institutions sector is not covered by our figures. The share of FATS in EU value added is 24% in the business economy. In most post Soviet Union countries the shares are often even higher. Nevertheless is this an extraordinary result. Despite the fact of a relatively low FDI stock in international comparison, the number shows that companies with FDI are of immense significance as they account to almost one fourth of the Moldovan GDP. This does not mean that without FDI the GDP would be lower by almost a quarter, since FDI is not exclusively greenfield investments. Nevertheless, this shows that FDI has a huge economic significance for Moldova. There is a link between FDI inflows and economic performance. The importance is already very high today, despite the relatively low investment. At the same time, the international comparison shows what is possible. In Romania and Slovakia, the share of companies with FDI even exceeds 40% of business economy value added. If only the business economy is considered, the share of companies with FDI in Moldova is 37%.
17
The business economy includes the sectors of industry, construction and distributive trades and services. This refers to economic activities
covered by Sections B to J and L to N including S95 of NACE Rev. 2 and the enterprises or its legal units that carry out thos e activities. It excludes financial and insurance activities and agriculture.

14
Figure 6
Value added of companies with FDI in Moldova and EU
Source: NBS, Eurostat, 2015. Note: FATS statistics include only business economy.
What do these shares beside that tell us? Moldova has relatively many companies with FDI. These have an over-proportionally high share in value added. This means companies with FDI must on average be much bigger than local companies. In fact, an average foreign company has on average 34 employees, a mixed company has 31 employees and a domestic company 13 employees. However, it is noticeable that the importance of large companies is lower than in some other countries, e.g. in Romania we see a high concentration of value added in fewer companies.
Another important variable for policy makers is the importance of companies with FDI for employment. According to NBS data the total employment was about 510,000 people in 2015, out of which almost 45,000 were working for foreign companies and 31,000 for mixed companies, this equals 9% and 6% of total employment, respectively. In contrast to value added data, our employment data do not include employment that is financed from the budget; our data source only covers self-financing companies and institutions, excluding areas like public administration, public schools, police etc. Using the numbers from another source, which also includes all public employment, we estimate the share of companies with FDI in total employment in Moldova to be around 12-13%. On the other hand, if only business economy in the sense of Eurostat definition is accounted for, companies with FDI represent 18% of employment.
24% 26% 29%
44% 43%
13%
10%
0%
5%
10%
15%
20%
25%
30%
35%
40%
45%
50%
Moldova EU Estonia Poland Romania Slovakia
Mixed Foreign FATS (foreign and mixed with FDI>50%)
Share in value added
23%
37% (in business economy)

15
Figure 7
Employment of companies with FDI in Moldova and EU
Source: NBS, Eurostat, 2015. Note: Moldova without public budget financed employment. FATS statistics include only business economy.
Companies with FDI are, therefore, also very important for employment in Moldova. At the same time they are less important than in many EU countries as can be seen in figure 7. An implication of these numbers is that companies with FDI are not only larger than domestic companies but also more productive. 15% of the employees account for 23% of value added. Value added and employment data suggests that companies with FDI are in average 71% more productive (value added per employee) than domestic companies (and 55% more productive than country average). This implicates that FDI and companies with FDI are a major source for economic growth. Disregarding the benefits discussed in section 3, there is a direct link between companies with FDI and economic growth coming from a higher productivity in companies with FDI.
Connected to higher productivity is another indicator we want to stress, which is not only important for the economy but also for the population. Foreign owned and mixed companies are on average paying much higher wages than domestic companies. The average wage of foreign companies was MDL 7,222 per month in 2015. For mixed companies it was MDL 6,885. This is 59% and 52% higher than the average wage of MDL 4,538. Moldova has a big problem of a steady emigration of the young and well educated workforce to other countries. One of the main reasons for this emigration are the significantly higher wages in the destination countries. By having a higher value added, companies with FDI can pay higher wages and mitigate emigration.
Foreign and mixed companies play also an important role for the state budget, as shown in figure 8. They have a high share in the corporate income tax (CIT) and in social security contributions. Total tax amount was MDL 2,262 m in 2015, 34% of CIT were paid by companies with FDI.
15%
23%
18%
27% 25%
9%
6%
0%
5%
10%
15%
20%
25%
30%
Moldova EU Estonia Poland Romania Slovakia
Mixed Foreign FATS (foreign and mixed with FDI>50%)
Share in employment
15%
18% (in business economy)

16
Figure 8
Importance of companies with FDI in Moldova – different indicators
Source: NBS, 2015. Note: Employment without public budget financed employment.
Foreign and mixed companies seem, therefore, to be much more profitable than domestic companies. This is a very strong result. It means that from the government budget point of view, companies with FDI are much better than domestic companies. If companies with FDI are more profitable even brownfield investments should be supported as it should lead to bigger tax revenues. According to all we know, this result is probably right. Nonetheless, a qualification must be made: 44% of the CIT revenues of companies with FDI are paid from companies of the electricity and gas supply sector and the information and communication sector. In the electricity and gas supply sectors almost all CIT payments are paid by foreign companies (98%), and we therefore assume that this high share of companies with FDI in total CIT is somewhat misleading, at least at this high level. There is one or more large utility companies that are foreign owned and pay almost all the taxes in the sector. Would this or these companies be domestically owned, we would probably see a different picture. The same applies partly to information and communication sector, 50% of the taxes in this sector are paid by mixed companies from the sub-sector communications. Nevertheless, our results remain intact even if we exclude these payments and count them as domestic, only the gap between domestic and companies with FDI becomes smaller. Interesting is also that companies with FDI are paying higher CIT despite the fact that many of these companies operate from Free Economic Zones in which they have to pay a reduced CIT rate.
Apart from CIT, the government receives also higher personal income taxes as companies with FDI are paying higher wages. This is reflected also by the high share of 21% of companies with FDI in social security contributions. The significance of companies with FDI for the budget goes, therefore, beyond CIT revenues. They are contributing to other revenues through higher wages and additionally, they stabilise the social system. Therefore, in addition to the arguments that we presented in section 3, we see in these statistics strong empirical results for the government to facilitate business for existing companies with FDI and to attract more FDI.
4%
13% 9%
21%
11% 3%
10%
6%
14%
10%
0%
5%
10%
15%
20%
25%
30%
35%
40%
Number activeenterprises
Value added Employment Corporate incometax
Social securitycontributions
Mixed Foreign
Share in total
7%
21%
34%
15%
23%

17
Conclusions: In this section we have analysed the importance of FDI regarding the impact on the economy. By doing so we linked FDI inflows to their impact on economic indicators. We have got very meaningful results.
FDI is very important for the Moldovan economy as companies with FDI account for 23% of total value added.
Companies with FDI account for 15% of total employment
Companies with FDI are in average 71% more productive than domestic companies, which results directly in higher economic growth
Companies with FDI are paying higher wages to its employees, improve this way the wellbeing of the population and probably also mitigate emigration
Companies with FDI are very important for tax revenues as they account alone to 34% of CIT revenues
Additionally the are contributing to other taxes through higher wages and are stabilising the social system through higher social security contributions
From our point of view, this justifies the promotion of existing companies with FDI and efforts for the attraction of additional FDI.
Importance of companies with FDI in Moldova
Share in number of entreprises
Share in value added
Share in employment
Share in CIT revenues
Share in social security
contirbutions
Mixed companies 3% 10% 6% 14% 10%
Foreign companies 4% 13% 9% 21% 11%
Total companies with FDI
7% 23% 15% 34% 21%
Note: Employment without public budget financed employment.

18
6 Sectoral Analysis
After showing the impact of companies with FDI on different economic variables on the level of the whole economy, we are going in this section more in a in depth analysis by analysing the impact on the different sectors. As in the previous section we are using again the NBS concept of FDI.
6.1 Impact on value added
As already shown in section 5, companies with FDI have on average a higher value added than domestic companies. Figure 9 shows the disaggregation of value added by sectors companies with FDI. The manufacturing sector is particularly important for value added of companies with FDI, it accounts for 31% of total value added of companies with FDI and for 41% of the value added in total manufacturing sector. In some sub-sectors of manufacturing, companies with FDI are even more important. These subsectors are manufacturing of beverages (52% of total value added in the sub-sector), wearing apparel (53% of total value added in the sub-sector), mineral products (52% of total value added in the sub-sector) and electrical equipment (90% of total value added in the sub-sector).
Figure 9
Value added of companies with FDI by sectors
Source: NBS, 2015
The second most important sector in terms of value added of companies with FDI is wholesale and retail trade, it accounts for 22% of total value added of companies with FDI. Its share in total wholesale and retail trade sector is around 25%.
The third most important sector in terms of value added of companies with FDI is the information and communication sector. It accounts for 17% of total value added of companies with FDI and has a share of 46% of total value added in the sector. Especially the sub-sectors computer programming, consultancy and related activities are dominated by foreign companies.
We see that the importance of companies with FDI differs from sector to sector. However, companies with FDI are not only concentrated in sectors, where they profit from cheap labour but also in capital
0%
5%
10%
15%
20%
25%
30%
35%
40%
45%
50%
Total economy Manufacturing Wholesale and retail trade
Information and communication
Transportation and storage
Real estate activities
Agriculture Construction Professional and technical
activities
Mixed Foreign
Share in value added
23% 20%
18%
5%
12%
25%
46%
25%
41%
19
intensive and knowledge based areas such as manufacturing electrical equipment and information and communication sector, which makes them especially important for future growth.
Result: Manufacturing is the most important sector for FDI value added, it accounts to 41% of total sector value added. In some sub-sectors companies with FDI represent more than half of value added, e.g. manufacture of beverages, wearing apparel and electrical equipment. The same applies for some sub-sectors of information and communication, e.g. computer programming, consultancy and related activities. Therefore, there is a high concentration of companies with FDI in capital intensive and knowledge based sectors. They have therefore and important role in technological development and future growth.
Box 3. Impact of FDI on the Moldovan economy: the case of Draexlmaier
One of the largest and most prominent investors in Moldova is Draexlmaier Automotive. The company started its production facilities in Moldova in 2007, consisting of assembling auto parts related to the electrical and electronic components for the on-board systems of Daimler and other top car manufacturers. After 10 years of operation, this investment can be considered a game-changer for the Moldovan economy, due to its major and multilateral contribution to the development of the country. We can identify at least five key areas where the company left a long-lasting footprint:
1. Development of a new sector with a clear competitive advantage. Draexlmaier contributed to
changing the structure of Moldova’s exports. Thus, the share of automotive sector (electrical
equipment) in total exports increased from 5.1% in 2006 to 10.5% in 2008. Currently, this is one
of the strategic exporting industries of Moldova, accounting for 14.6% in total exports in 2016
and represents one of the top-7 priority industries of the Government, according to the
Investment Attraction and Export Promotion Strategy 2016-2020.
2. Job creation. The company created around 3000 jobs and is planning to hire 2500 more people
for its third factory that is planning to be launched by the end of this year. Its operations are in
Bălți, meaning that it contributed essentially to the increase in the employment rate in the
northern part of Moldova. During 2007 and 2008, the number of employees in Balti municipality
increased by 2972 (+8%) compared to 2006, whereas in the entire country, the total number of
employees shrank by 7832 (-1.2%) people during the same period of time.
3. Integration with other industries. Besides providing direct jobs and exports, Draexlmaier favored
the creation of another several thousand jobs in the ancillary sectors of raw material and services
suppliers18.
4. Contributing to the reform of the educational system. Draexlmaier directly contributed to piloting
the dual system of education, comprised on the mix between theoretical and practical learning.
The company has launched a project in cooperation with the vocational schools in the country,
that train specialists according to the requirements of the German Concern and based on a
curriculum developed by Draexlmaier and approved by the Minister. The entire didactic and
applicative activity is developed in the classrooms which were set up in the company19.
18
http://miepo.md/success-story/draexlmaier-%E2%80%93-german-seriousness-and-quality
19 Idem

20
5. Attracting other FDI. Besides the effects described above, another important contribution of
Draexlmaier is that it proved in practice that Moldova can be a good place for FDI, which
attracted other foreign companies from automotive sector (Leoni and Sumitomo started
operations in 2010, Fujikura – in 2017).
Source: Own research
6.2 Impact on employment
We have already shown that companies with FDI employ almost 76,000 people which equals a 15% of total employment (without public budget financed employment). Figure 8 presents the distribution of employment among companies with FDI by sectors. The ranking of the top 3 sectors is similar to the importance regarding value added. The manufacturing sector accounts for the highest number of employment of companies with FDI, in total 32,000 people (42% of total employment of companies with FDI). It is followed by wholesale and retail trade (17,500 people, 23% of total) and information and communication sector (6,700 people, 9% of total).
Figure 10
Employment in companies with FDI by sectors
Source: NBS, 2015. Note: Employment without public budget financed employment.
In manufacturing, 35% of total employment is in companies with FDI. Interesting is also a look at the sub-sectors. Most jobs are in the textile sector (textiles, wearing apparel and leather) with over 14,000 jobs and a share of 60% of total sector. The next important are food products and beverages with together 8,800 people employed and a share of 26% in the total foodstuffs sector. The third most important sector in manufacture is electrical equipment with 3,40020 persons employed and a share of 93% in the
20
This figure refers to the 2015. However, in 2016 and 2017 there was very strong growth in the automotive sector, including ma nufacture of
electrical equipment. According to expert estimates, the current employment in the automotive sector by companies with FDI is in the range of 10,000.
0%
5%
10%
15%
20%
25%
30%
35%
40%
Total employment
Manufacturing Wholesale and retail trade
Information and
communication
Professional and technical
activities
Agriculture Construction Transportation and storage
Real estate activities
Mixed Foreign
Share in employment
15% 12%
5% 7% 6%
20%
31%
15%
35%

21
sub-sector. Therefore, in this relative perspective it becomes obvious that companies with FDI are of crucial importance, some sectors would be much smaller to non-existent without companies with FDI.
The picture is somewhat different in wholesale and retail trade. While the total number of people employed is quite high, the number of people employed by companies with FDI is, compared to total employment in the sector, with 15% relatively small. In information and communication sector the situation is comparable to manufacturing sector. Out of the total number of jobs in the sector 30% are from companies with FDI. The relative importance of companies with FDI is, therefore, quite high.
Another important result from analysing the jobs created in companies with FDI is, again, that companies with FDI tend to be much larger in size than domestic companies. In the whole manufacturing sector the average number of employees per company is 27, while it is 129 in foreign companies and 79 in mixed companies. The sub-sector with the largest foreign companies regarding employment is manufacture of electrical equipment with 356 employees on average.
Conclusions: Companies with FDI have a high importance for employment creation and maintenance. The most important sectors regarding total FDI employment are manufacturing (32,000), wholesale and retail trade (17,500) and information and communication (6,700). In some sub-sectors companies with FDI are the most important employers with employment rates of above 50%. These subsectors are e.g. textiles and electrical equipment in manufacturing and computer programming, consultancy and related activities in the information and communication sector.
6.3 Impact of companies with FDI on productivity
In section 5 we have already shown that companies with FDI are more productive than domestic companies by 71%. This is why they can afford to pay higher wages. For the analysis of productivity on sectoral level, we use data on sectoral average wages. Wages are suitable proxies for productivity of foreign and mixed companies as discussed in section 3. Figure 11 provides an overview. We only show sectors that have at least 200 employees in each category to avoid distortions.
22
Figure 11
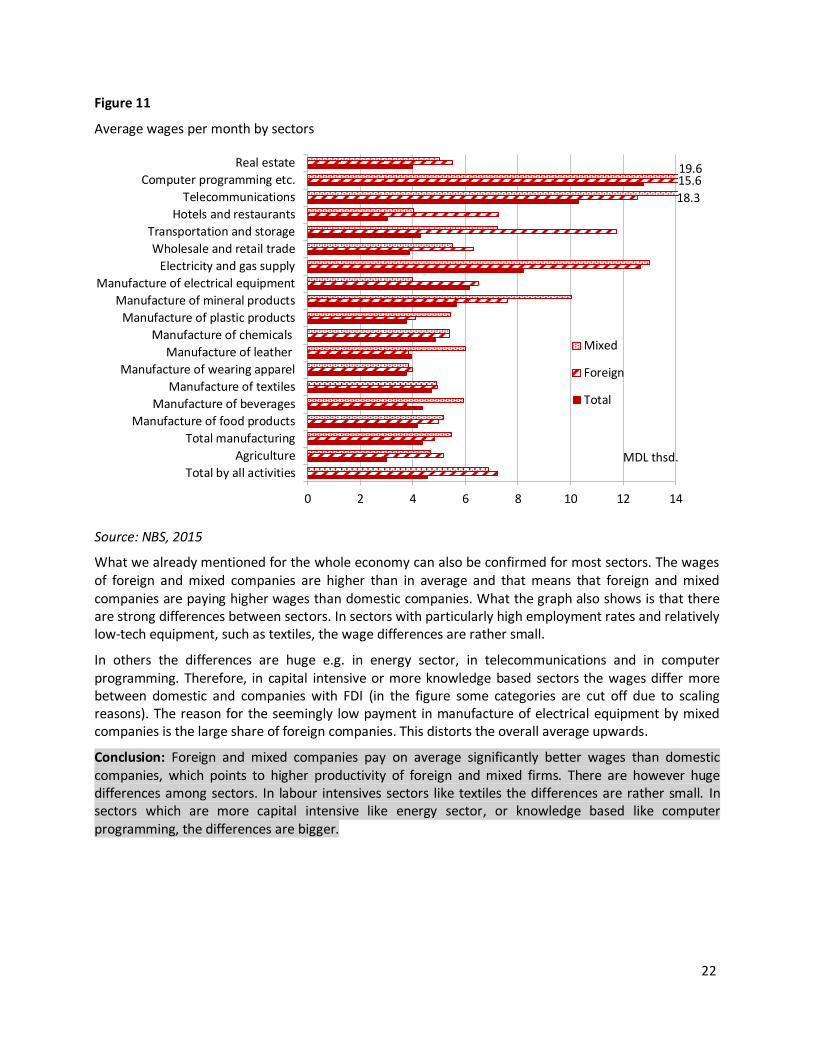
Average wages per month by sectors
Source: NBS, 2015
What we already mentioned for the whole economy can also be confirmed for most sectors. The wages of foreign and mixed companies are higher than in average and that means that foreign and mixed companies are paying higher wages than domestic companies. What the graph also shows is that there are strong differences between sectors. In sectors with particularly high employment rates and relatively low-tech equipment, such as textiles, the wage differences are rather small.
In others the differences are huge e.g. in energy sector, in telecommunications and in computer programming. Therefore, in capital intensive or more knowledge based sectors the wages differ more between domestic and companies with FDI (in the figure some categories are cut off due to scaling reasons). The reason for the seemingly low payment in manufacture of electrical equipment by mixed companies is the large share of foreign companies. This distorts the overall average upwards.
Conclusion: Foreign and mixed companies pay on average significantly better wages than domestic companies, which points to higher productivity of foreign and mixed firms. There are however huge differences among sectors. In labour intensives sectors like textiles the differences are rather small. In sectors which are more capital intensive like energy sector, or knowledge based like computer programming, the differences are bigger.
0 2 4 6 8 10 12 14
Total by all activities
Agriculture
Total manufacturing
Manufacture of food products
Manufacture of beverages
Manufacture of textiles
Manufacture of wearing apparel
Manufacture of leather
Manufacture of chemicals
Manufacture of plastic products
Manufacture of mineral products
Manufacture of electrical equipment
Electricity and gas supply
Wholesale and retail trade
Transportation and storage
Hotels and restaurants
Telecommunications
Computer programming etc.
Real estate
Tausende
Mixed
Foreign
Total
MDL thsd.
19.6 15.6
18.3

23
6.4 Impact on exports in manufacturing
Another interesting point regarding the importance of companies with FDI and their integration into international value chains is the share of exports in production. This data are only available for the manufacturing sector, as they are only required here in the company surveys. The figures do therefore not correspond to the official statistics because they are not covered by customs but are provided by the companies themselves. Nevertheless, these figures are a good indicator of how much of the companies' output is earmarked for the international market. Figure 12 gives an overview how much of the manufacturing production is destined for export. Again, only sectors are shown which have at least 200 employees in each category.
Figure 12
Production destined for export
Source: NBS, 2015
In total manufacturing sector, about one third of production is destined for export. In the case of foreign companies, this figure is as high as two-thirds. In the textile sector, foreign companies produce almost exclusively for the foreign market. This shows us that foreign companies have a clear focus on the foreign sales market. This is also the case for beverages and electrical equipment.
This leads to several results. First, it shows that Moldova enjoys a large part of its attractiveness due to free trade and its good links to international markets. First and foremost to the EU, but certainly also to the CIS in the foodstuffs sector. Second, the numbers underline the importance of international companies' involvement in international value chains, which means that Moldova benefits from technology transfer etc. (see section 3).
And thirdly, it reveals the importance of foreign companies for exports and thus for the trade and current account balance. Moldova generally has a large current account deficit. The role of FDI as a source of external financing is relatively limited. Increasing it would mean to stabilise the current account through two channels. The first channel is direct, FDI inflows reduce the current account deficit.
0 10 20 30 40 50 60 70 80 90 100
Total manufacturing
Manufacture of food products
Manufacture of beverages
Manufacture of textiles
Manufacture of wearing apparel
Manufacture of leather
Manufacture of chemicals
Manufacture of plastic products
Manufacture of mineral products
Manufacture of electrical equipment
MixedForeignTotal
%

24
The second, indirect and so far unnoticed channel is through increased exports of companies with FDI. The promotion of foreign companies is thus a strong tool to reduce this deficit in the long term.
Conclusions: A large part of the manufacturing production is exported; in particular many foreign companies are building production facilities in order to serve the foreign market. This is the case in textile sectors, beverages and electrical equipment. Moldova thus benefits for FDI attraction from its free trade agreements. Positive effects from technology transfers can be expected from the high integration of foreign companies into international value-added chains. Another positive aspect is that companies with FDI mitigate the trade deficit not just in macroeconomic perspective through FDI inflows but also due to the exports of companies with FDI. A fact that should be considered in future policy decisions.

25
Refences
Demekas, D. G., Horváth, B., Ribakova, E., & Wu, Y. (2007). Foreign direct investment in European transition economies-The role of policies. Journal of Comparative Economics, 35(2), 369–386. http://doi.org/10.1016/j.jce.2007.03.005
Dunning, J. (1988). The Eclectic Paradigm of International Production: A Restatement and Some Possible Extensions. Journal of International Business Studies. Vol. 19(1), 1–31.
Gorodnichenko, Y., Svejnar, J., & Terrell, K. (2014). When does FDI have positive spillovers? Evidence from 17 transition market economies. Journal of Comparative Economics, 42(4), 954–969.
http://doi.org/10.1016/j.jce.2014.08.003
Hanousek, J., Kočenda, E., & Maurel, M. (2011). Direct and indirect effects of FDI in emerging European markets: A survey and meta-analysis. Economic Systems, 35(3), 301–322.
http://doi.org/10.1016/j.ecosys.2010.11.006
Helpman, E. (2006). Trade, FDI, and the Organization of Firms. Journal of Economic Literature, XLIV(September), 589–630.
Iacovone, L., Javorcik, B., Keller, W., & Tybout, J. (2011). The two faces of Wal-Mart in Mexico. VOX, 20 August. http://voxeu.org/article/two-faces-wal-mart-mexico
Javorcik, B. S. (2008). Can Survey Evidence Shed Light on Spillovers from Foreign Direct Investment? The World Bank Research Observer, 23(2), 139–159.
http://documents.worldbank.org/curated/en/357581468157188258/pdf/767820JRN0WBRO00Box374387B00PUBLIC0.pdf
Javorcik, B. S. (2015). Does FDI Bring Good Jobs to Host Countries? The World Bank Research Observer, 30(1), 74–94. http://doi.org/10.1093/wbro/lku010
Keller, W. (2010). International trade, foreign direct investment, and technology spillovers. In: Handbook of the Economics of Innovation (Vol. 2). Elsevier B.V. http://doi.org/10.1016/S0169-7218(10)02003-4
Kinda, T. (2010). Investment Climate and FDI in Developing Countries: Firm-Level Evidence. World Development, 38(4), 498–513. https://doi.org/10.1016/j.worlddev.2009.12.001
Overesch, M., & Wamser, G. (2010). The effects of company taxation in EU accession countries on German FDI. Economics of Transition, 18(3), 429–457. http://doi.org/10.1111/j.1468-0351.2009.00385.x

26
List of recent Policy Papers
Impact assessment of Moldova’s participation in the extended WTO Information Technology Agreement (ITA), by Anne Mdiniradze and Jörg Radeke, Policy Paper PP/02/2017.
How to absorb excess liquidity in the banking sector?, by Cyrus de la Rubia, Ricardo Giucci and Woldemar Walter, Policy Paper PP/01/2017.
Assessing the Potentials of a Cluster-Oriented Approach to Attract Investment Projects from the Automotive Supply Industry to Moldova, by Björn Vogler, Policy Paper PP/05/2016
Impact assessment of an increase of Moldova’s reduced Value Added Tax (VAT) rate for selected agricultural and food products, by Jörg Radeke and Jürgen Ehrke, Policy Paper PP/04/2016
Leveraging Clusters for Industrial Development in Moldova. Preconditions, Potentials and Key Steps to Introduce a Cluster-Oriented Approach, by Björn Vogler, Policy Paper PP/03/2016
The limited use of non-cash payments in Moldova: Diagnosis and policy options, by Matthias Luecke, Dumitru Pintea, Ricardo Giucci, Policy Paper PP/02/2016
The National Committee on Financial Stability. Why and how to reform it, by Adrian Lupusor and Ricardo Giucci, Policy Paper PP/01/2016
Fiscal Policy: Challenges in 2016, by Jörg Radeke, Katharina Kolb and Matthias Luecke, Policy Paper PP/04/2015
List of recent Policy Briefings
Impact assessment of Moldova’s participation in the extended WTO Information Technology Agreement (ITA), by Jörg Radeke and Anne Mdinaradze, Policy Briefing PB/06/2017.
Banking Sector Monitoring Moldova, by Ricardo Giucci, Dumitru Pintea, Woldemar Walter, Policy Briefing PB/05/2017.
How to absorb excess liquidity in the banking sector? - Summary of results -, by Ricardo Giucci, Cyrus der la Rubia and Woldemar Walter, Policy Briefing PB/04/2017.
Moldovan imports and the impact of the DCFTA, by Ricardo Giucci and Woldemar Walter, Policy Briefing PB/03/2017
Introducing a Cluster-oriented Approach in the Republic of Moldova, by Björn Vogler, Policy Briefing PB/02/2017
Moldovan exports and the impact of the DCFTA, by Ricardo Giucci and Woldemar Walter, Policy Briefing PB/01/2017
Moldova’s export potential for processed agricultural products to the EU, by Carsten Holst and Jörg Radeke, Policy Briefing PB/06/2016
Papers, briefings and further publications can be downloaded free of charge under: http://www.get-moldau.de/wordpress/de/publikationen/beraterpapiere/. For more information please contact the German Economic Team Moldova via [email protected]