gep fm.qxd 12/5/02 4:16 PM Page i Global Economic Prospects
234
Global Economic Prospects and the Developing Countries 2003
Transcript of gep fm.qxd 12/5/02 4:16 PM Page i Global Economic Prospects

GlobalEconomicProspectsand the Developing Countries
2003
gep_fm.qxd 12/5/02 4:16 PM Page i

© 2003 The International Bank for Reconstruction and Development / The World Bank1818 H Street, NWWashington, DC, USA 20433Telephone: 202-473-1000Internet: www.worldbank.orgE-mail: [email protected]
All rights reserved.
1 2 3 4 04 03 02
This volume is a product of the staff of the World Bank. The findings, interpretations, andconclusions expressed herein do not necessarily reflect the views of the Board of ExecutiveDirectors of the World Bank or the governments they represent.
The World Bank does not guarantee the accuracy of the data included in this work. Theboundaries, colors, denominations, and other information shown on any map in this workdo not imply any judgment on the part of the World Bank concerning the legal status of anyterritory or the endorsement or acceptance of such boundaries.
Rights and Permissions
The material in this work is copyrighted. Copying and/or transmitting portions or all of thiswork without permission may be a violation of applicable law. The World Bank encouragesdissemination of its work and will normally grant permission promptly.
For permission to photocopy or reprint any part of this work, please send a request withcomplete information to the Copyright Clearance Center, Inc., 222 Rosewood Drive, Danvers,MA 01923, USA, telephone 978-750-8400, fax 978-750-4470, www.copyright.com
All other queries on rights and licenses, including subsidiary rights, should be addressed tothe Office of the Publisher, World Bank, 1818 H Street NW, Washington, DC 20433, USA,fax 202-522-2422, e-mail [email protected]
ISBN 0-8213-5338-1ISSN 1014-8906Library of Congress catalog card number: 91-6-440001 (serial)
gep_fm.qxd 12/5/02 4:16 PM Page ii
Contents
iii
Foreword ix
Acknowledgments xi
Summary xiii
Abbreviations and Data Notes xxi
Chapter 1 The International Economy and Prospects for Developing Countries 1A recovery constrained by major risks 4Investment cycles in developing countries 23Growth and poverty to 2015: coming changes in savings and
investment patterns 28Notes 41References 42
Chapter 2 Changes in Global Business Organization 45The surge in trade and FDI 46The rise in service sector FDI 52Global production networks 55Good policies attract FDI 66Notes 69References 71
Chapter 3 Domestic Policies to Unlock Global Opportunities 77Investment climate and investment policies 78Promoting efficient private investment: harnessing competition 85Public investment in infrastructure and human capital 103Policies to promote competition 107Notes 109References 110
gep_fm.qxd 12/5/02 4:16 PM Page iii
Chapter 4 International Agreements to Improve Investment and Competition for Development 117
International efforts to promote investment 119International agreements to promote competition and competition policy 133Conclusions 145Notes 146References 147
Appendix 1 Regional Economic Prospects 151
Appendix 2 Global Commodity Price Prospects 175
Appendix 3 Global Economic Indicators 199
Figures1.1 The recovery was initiated in a typical fashion 61.2 A brief rebound in industrial countries was underway 61.3 Rebound in industrial countries boosted production in East Asia 61.4 Non-oil commodities are recovering but stand well below previous peaks 71.5 Private sector creditors have cut debt exposures so far in 2002 91.6 FDI flows to emerging Asia are proving to be quite resilient 101.7 Investment recovery is still uncertain 101.8 World trade rebounds along with GDP, 1998–2004 131.9 2002 marks the start of a moderate recovery 151.10 LAC and MENA are not experiencing the recovery 151.11 Low case: world trade and other indicators will be much lower than
the baseline 201.12 G-7 investment falls sharply 211.13 Investment growth and net capital flows into Latin America are
strongly correlated 221.14 Oil prices spike 231.15 Investment is more volatile than GDP in East Asia 231.16 Investment is more volatile than GDP in Latin America 231.17 Central Europe and Turkey experience greater volatility in
investment than in GDP 241.18 Investment volatility declines with income 241.19 A better investment climate reduces volatility of investment cycles 251.20 Impact of policy climate on investment volatility after correcting for
income remains strong 251.21 Growth of working-age population decelerates 331.22 Productivity has not been the dominant source of growth in regions 351.23 Productivity is expected to be more significant in the longer term 351.24 Major structural shifts in investment and savings behavior have occurred 371.25 Youth dependency ratio will fall everywhere except Japan 391.26 Elderly dependency ratios will rise in some regions 392.1 Exports-to-GDP ratios have increased since the 1970s 472.2 All regions have benefited from rising FDI flows 472.3 FDI is concentrated in large countries, but many small countries receive large amounts
relative to GDP 48
G L O B A L E C O N O M I C P R O S P E C T S 2 0 0 3
iv
gep_fm.qxd 12/5/02 4:16 PM Page iv

2.4 The service sector dominated the 1990s mergers and acquisitions boom 492.5 Cross-border mergers and acquisitions are small compared with
stock market capitalization 492.6 U.S. aggregate concentration has held steady 502.7 Global concentration has not increased significantly 512.8 Share of FDI in the service sector increased in major industrial countries 522.9 U.S. cars are produced in many countries 552.10 Cross-border networks capture increasing shares of production and trade 562.11 The role of production networks continued to increase through
most of the 1990s 562.12 Tariff rates fell in the last two decades 572.13 Reforming countries boosted exports through production networks 582.14 Parts and components exports grew rapidly, 1981–2000 612.15 Developing countries’ share of global parts and component exports
rose between 1981 and 2000 612.16 Developing countries’ parts and component exports are highly
concentrated, 2000 622.17 Strong rule of law attracts foreign investors 662.18 Foreign investors have been shifting away from weaker investment
climate locations 672.19 Private infrastructure investment surged in the 1990s 683.1 Domestic capital is the largest source of investment in developing countries 783.2 Incentives for FDI are varied and numerous 803.3 Competition and ease of entry are associated with higher growth 863.4 Competition from imports checks markups in concentrated markets 873.5 High tariffs are correlated with lower productivity 883.6 High entry costs inhibit FDI inflows 903.7 Barriers to entry can become barriers to exit 923.8 Barriers to entry and exit allow inefficient firms to stay in the market 943.9 Difficulties in obtaining licenses and permits discourage FDI 943.10 Inefficient customs hurt Indian exports 953.11 Inefficient ports raise India’s transport costs far above competitors’
transport costs 953.12 Privatization revenues soared in the 1990s 963.13 Granting monopoly rights brings in revenues 983.14 More competition means more phones 983.15 Better infrastructure means higher growth 1053.16 Greater literacy is associated with higher growth 1063.17 Education raises the productivity of FDI, which leads to higher growth 1074.1 Countries are increasingly liberalizing their investment regimes 1234.2 South-South FDI is rising 1234.3 Share of South-South FDI in total FDI is rising 1244.4 Revealed preferences: governments shield services more often than
manufacturing from the winds of investment competition 1264.5 FDI is growing faster than exports and output 1284.6 OECD countries spent $230 billion in 2001 to support agricultural producers 1354.7 Imports affected by cartels rose from 1981 to 2000 for both rich and
poor countries 138
C O N T E N T S
v
gep_fm.qxd 12/5/02 4:16 PM Page v
Tables1.1 Global conditions affecting growth in developing countries and
world GDP growth 31.2 External environment for developing countries, 1991–2004 141.3 Global effects in a low-case scenario, 2003–04 201.4 Low case: contributions to global effects in 2003 211.5 Relative volatility of investment is high in developing countries 241.6 Upturns can be financed abroad and domestically 261.7 Capital inflows lead investment in middle-income countries: correlation
between investment ratios and (past or future) capital flows 261.8 Long-term prospects are projected to be stronger for most regions 291.9 Large poverty reductions in EAP and SAR partially offset by
poverty increases in SSA 301.10 Savings fall in high-income countries, but increase in most other regions 382.1 FDI inward stocks in services and manufacturing, 1988–99 522.2 Growth of exports of parts and components, 1981–2000 552.3 Export activity for product groups with the fastest growth in
world exports, 1980–98 622.4 Rapid growth and structural change experienced by
network participants 653.1 Profitability on equity, concentration, and market share (percent):
Brazil, 1971–78 993.2 Cartel enforcement in selected developing countries 1014.1 Many antidumping investigations were initiated during the 1995–2001
period 1364.2 International cartels can be expensive: estimates of sales and overcharge 1384.3 National exemptions to competition law for exporters 1414.4 Breaking up floating cartels could help developing countries 142
Boxes1.1 Is Latin America going against the rising tide? 81.2 Integration pays off where policies are supportive 121.3 The terrorist attacks of September 11, 2001 had an economic impact 161.4 Consumption in low- and middle-income countries is smoothed over
the business cycle 271.5 Is the World Bank overestimating global poverty? 311.6 Technological progress is an important determinant of growth 342.1 Intra-firm trade increases worldwide 593.1 Trade restrictions shield MNCs from competitive forces at enormous cost:
the case of Argentina 893.2 Competition policy and competition law share similar objectives
across countries 1023.3 Does public investment “crowd out” or “crowd in”
private investment? 104
G L O B A L E C O N O M I C P R O S P E C T S 2 0 0 3
vi
gep_fm.qxd 12/5/02 4:17 PM Page vi

4.1 What is a BIT? 1204.2 The Multilateral Agreement on Investment (MAI) 1224.3 South-South flows: who invests and who receives? 1254.4 Do BITs increase investment flows? Only a bit 1294.5 Disciplines on corporations can also improve the investment climate 1324.6 The lysine cartel, 1995–2001 1394.7 International cooperation aids competition policy 144
C O N T E N T S
vii
gep_fm.qxd 12/5/02 4:17 PM Page vii

gep_fm.qxd 12/5/02 4:17 PM Page viii
Foreword
ix
Productivity increases and efficient investment are essential conditions for rapid growth andpoverty reduction. The key to accelerating technological improvement and increasing in-vestment is improving the “investment climate.” In the broadest sense, this term encom-
passes the policy and institutional environment that fosters entrepreneurship, learning, and pro-ductive investment.
In this report, we argue that the investment climate for developing countries has both a globaldimension and a national dimension. The global investment climate, although less amenable topolicy initiatives of developing countries, nonetheless presents opportunities, risks, and at timesobstacles for developing countries. In this report, we focus on two aspects of the global invest-ment climate: the current state of the world economy as it affects developing countries’ financialoutlook, exports, and growth prospects (chapter 1) and the organization of global business,notably the proliferation of multinational companies and associated production networks (chap-ter 2). In previous reports we have studied other aspects of the global investment climate, in-cluding the world trading system (Global Economic Prospects 2002) and aspects of the globalfinancial system (Global Development Finance 2002).
The national dimension of the investment climate for developing countries is discussed inchapter 3. This dimension is composed of the policy and institutional environment that fostersentrepreneurship—and that strongly influences the pace of productivity growth and the rate ofinvestment. Differences in national policies help explain why some countries grow rapidly andothers do not, even though all operate within the same international investment climate. In short,policymakers have considerable scope for choosing policies that influence the amount and pro-ductivity of investment.
For the purposes of this report, we focus on two types of national policies that affect howcountries use globalization to grow. The first type is investment policies—for example, tax in-centives, tariffs, subsidies, and policies to channel investment into particular activities, as well aspublic investment. The second type is policies that promote or limit competition—for example,tariffs, entry restrictions, and state monopolies as well as conventionally defined competitionpolicy.
We chose these policy areas for three reasons. First, these policy areas directly link the do-mestic policy dimensions of the investment climate with the global economy. Second—in contrastto macroeconomic policies, property rights, and other institutional features that primarily affectthe quantity of investment—policies fostering investment and competition work instead throughmicroeconomic incentives to influence the quality of investment (as measured by its productivity).Finally, these policies are at the center of global debate, figuring prominently in discussions of the
gep_fm.qxd 12/5/02 4:17 PM Page ix

Doha Development Agenda launched at the World Trade Organization (WTO) Ministerial Meet-ing in November 2001.
To inform that debate, the final chapter of this report asks how the international communitycan support developing countries in their quest for better investment climates, both global andnational. The chapter focuses on synergies that can emerge from developing countries’ participa-tion in international agreements on investment and competition policies, topics that are not onlycentral to the WTO Doha Development Agenda but that also figure prominently in manyregional trade negotiations around the world.
Nicholas SternChief Economist and Senior Vice PresidentThe World Bank
G L O B A L E C O N O M I C P R O S P E C T S 2 0 0 3
x
gep_fm.qxd 12/5/02 4:17 PM Page x
Acknowledgments
xi
This report was prepared by the Development Prospects Group in the World Bank, draw-ing on resources throughout the Development Economics Vice Presidency and the WorldBank’s operational units. Richard Newfarmer was the lead author and manager of the
report, under the direction of Uri Dadush. The principal chapter authors were Hans Timmer(chapter 1), William Shaw (chapter 2), Jeffrey Lewis and Scott Wallsten (chapter 3), and RichardNewfarmer and Pierre Sauvé (chapter 4). We are grateful for the ideas and insights of BernardHoekman, Michael Klein, and Theodore Moran (Georgetown University). The report was pre-pared under the general guidance of Nicholas Stern.
Many staff from inside and outside the World Bank contributed to the report. In chapter 1,Caroline Farah, Himmat Kalsi, Robert Keyfitz, Annette I. De Kleine, Robert Lynn, FernandoMartel Garcia, Mick Riordan, and Bert Wolfe contributed to the global trends; Dominique Vander Mensbrugghe provided the long-term analysis; and Shaohua Chen and Martin Ravallioncontributed to the poverty analysis; Kathleen Rollins was the staff assistant. Chapter 2 benefitedfrom background papers and other inputs from Gary Gereffi, Mary Hallward-Driemeier, ShafiqIslam, Frances Ng, Matthew Slaughter, Lawrence White, and Yong Zhang. Similarly, in chapter 3,Claudio Frischtak, Rughvir Khemani, Kamal Saggi, Luis Villela, and Alberto Barreix as wellas Mary Hallward-Driemeier provided background papers that became building blocks for thesections on incentives, investment, competition, and foreign investment, and Denis Medvedevprovided valuable written inputs and research assistance. Chapter 4 was based on backgroundpapers by Simon Evenett and Benno Ferrarini (competition), Bijit Bora (performance require-ments), and Mary Hallward-Driemeier (bilateral investment treaties and investor protections) aswell as inputs from Aaditya Mattoo and Shweta Bagai (various). Beata Smarzynska and JacquesMorisset provided helpful guidance and comments on various aspects of the report. The regionalappendixes benefited from the written inputs of the Regional Chief Economists around the Bankand their staff. John Baffes, Betty Dow, Donald Mitchell, and Shane Streifel prepared the com-modity appendix. The staff assistant for the report was Awatif Abuzeid. Mark Feige provided ed-itorial assistance. Yinne Yu and Yong Zhang as well as Jonathan Koh provided valuable researchassistance at various stages of the report’s preparation. Dorota Nowak coordinated publicationand dissemination activities.
Several experts provided written comments that immeasurably improved the quality of the re-port at various stages: Pierre-Richard Agenor, Robert Anderson, Milan Brahmbhatt, Jean-JacquesDethier, Simeon Djankov, Richard Eglin, Antonio Estache, Shahrokh Fardoust, Alan Gelb,Coralie Gevers, Ian Goldin, Rughvir Khemani, Aart Kraay, Ernesto May, Mustapha Nabli, Anne
gep_fm.qxd 12/5/02 4:17 PM Page xi

McGuirk, Ashoka Mody, Ijaz Nabi, John Panzer, Guillermo Perry, Guy Pfeffermann, KarlSauvant, Todd Schneider, Mark Sundberg, and Roberto Zagha.
We are also grateful for the many substantive comments we received from governmentsaround the world through their Executive Directors on the World Bank’s Board.
Melissa Edeburn, Susan Graham, and Ilma Kramer managed the production for the WorldBank’s Office of the Publisher.
G L O B A L E C O N O M I C P R O S P E C T S 2 0 0 3
xii
gep_fm.qxd 12/5/02 4:17 PM Page xii

Summary
xiii
The global recovery is fragile, becauseinvestment spending is insufficient tounderpin continuing growth—Strong cyclical dynamics, together with aneasing of macroeconomic policies in theUnited States and elsewhere, have boostedlarge parts of the global economy into the ini-tial phase of a recovery in 2002. The drivingforces behind the initial phase of the recoverywere strong, but they have proved short-livedbecause inventory and high-tech cycles areshort and appear to have peaked. Thoughconsumption spending has held firm, this isprecisely the time when investment demandshould pick up and boost recovery onto ahigher trajectory. So far it has not. Financialimbalances, evident in different formsthroughout the world economy, seem to beweighing down growth. Wide-ranging uncer-tainty in financial markets may jeopardize theneeded rebound in fixed investment and maythus diminish prospects for projecting theglobal recovery into the future. Falling andvolatile stock markets, accounting scandals,accumulated debts (domestic and foreign, pri-vate and public), and reassessments of long-run profitability keep investors cautious, ifnot jittery, throughout the world. For thesereasons, growth in 2003 seems certain to beweaker for almost all developing regions thanwe anticipated as recently as six months ago.
Analysis of long-term trends indicates thatthe investment cycle as a determinant of over-all cyclical behavior is as important in low-
and middle-income countries as it is in high-income countries. But the volatility of invest-ment is greater in developing countries than inrich countries. Countries with sound invest-ment climates experience far less volatilitythan countries with deficient policies andinstitutions.
Capital flows to developing countries haveproved to be procyclical. But the direction ofcausality between investment and capital in-flow appears to differ significantly betweenrich and poor countries. In rich countries, aboom in domestic fixed investment tends toattract foreign capital, while in middle-incomecountries it is the acceleration of capitalinflows that typically stimulates domesticinvestment. Similarly, a fall in rich countries’investment tends to reduce net capital inflows,while for middle-income countries reduced netcapital inflows (or increased capital outflows)are the driving forces behind contractions indomestic investment. This dependence on cap-ital flows makes the middle-income countriesespecially vulnerable to tensions in global fi-nancial markets. Low-income countries, withgreater reliance on official aid and with lim-ited access to private capital markets, do notexhibit either of these patterns.
—but long-term prospects remainpromisingOver the long run, new opportunities fortechnological advances (often driven byglobalization), together with more stable
gep_fm.qxd 12/5/02 4:17 PM Page xiii

macroeconomic policies and an improvedbusiness climate, have the potential to acceler-ate growth and to increase investment ratiosin developing countries that currently lagbehind. The outlook for reductions in globalpoverty, while generally positive and of thesame order of magnitude as in our previousreport, is marginally dimmer because of theabsence of a robust recovery today.
At the same time, demographics are likelyto alter existing savings and investment pat-terns and will tend to push countries to be-come more interdependent through capitalflows. Major demographically driven shifts incurrent account balances—particularly inJapan, which is moving toward reduced sur-plus, and in middle-income countries, whichare moving toward increased surplus—arelikely to accelerate financial integration.Underneath large swings in net flows are evenlarger movements of gross capital flows, asforeign direct investment (FDI) expands intogrowing markets in developing countries andas financial agents in developing countriesseek to diversify their portfolios in rich coun-tries. However, because international financialflows have at times fluctuated widely, theyhave sometimes proved damaging to growthand poverty reduction. The international com-munity and developing countries have tosearch for mechanisms to provide greater sta-bility in integration. Developing countries cando much on their own. Improving the domes-tic investment climate, particularly throughsound macroeconomic policies and gover-nance, can reduce the volatility of capitalflows and attract less-volatile FDI.
Global competition is creating newopportunities for developing countriesCross-border trade and direct investment haveexpanded rapidly over the past three decades.Global exports of goods and services in-creased from 14 percent of output in the early1970s to 23 percent by the late 1990s, whileglobal FDI flows have more than doubled rel-ative to the gross domestic product (GDP).The surge in FDI flows accelerated in the late
G L O B A L E C O N O M I C P R O S P E C T S 2 0 0 3
xiv
1990s, rising from $331 billion in 1995 to$1.3 trillion in 2000, before falling off to anestimated $725 billion in 2001. Most of theseflows are destined to rich countries.
FDI flows to developing countries areabout $160 billion. This amount is still rela-tively small compared with all domestic in-vestment in developing countries, now about$1 trillion. Nonetheless, in virtually every re-gion, FDI is a driving force of globalizationand has risen relative to total capital expen-ditures during the 1990s. It has doubled inmiddle-income countries and has tripled inlow-income countries. However, recently FDIflows have fallen. They peaked in 1999 at$184 billion and are experiencing their mostsustained fall since the global recession of1981–83.
These trends over the past decade have in-creased competition in most markets aroundthe world. Despite a sharp increase in mergersand acquisitions, the share of global economicactivity accounted for by the largest compa-nies does not appear to have risen over the1990s. The profits of the top 50 companies ac-counted for 0.8 percent of world GDP in2001. Although their share of aggregate prof-its amounted to 3.3 percent of global savingsin 2000, up from 1.8 percent in 1994, this in-crease is likely to be the result of the boom inthe United States and the overstatement ofearnings of some large U.S. corporations.These factors point to a pattern of stabilityrather than a trend of increases. Similar pat-terns exist for the largest 500 companies.
Four changes in the organization of busi-ness are particularly important for developingcountries. First, the rise of foreign investmentin services is creating a new source of compe-tition—and potential productivity gains—indeveloping countries, where staid state com-panies have often monopolized production fordecades. Recent efforts to privatize these com-panies and to open industries to competitionhave allowed some developing countries toharness this competition for gains. In manydeveloping countries, restrictions on servicesstill remain high, because some countries have
gep_fm.qxd 12/5/02 4:17 PM Page xiv

privatized only slowly and others have priva-tized badly, creating private monopolies stillinsulated from competition.
Second, production networks that span theglobe, once barely a dot on the horizon of in-ternational business, have now become a cen-tral feature. That so many large firms havechosen to outsource production of parts andequipment or to otherwise locate productionfacilities offshore offers new opportunitiesfor developing countries. Firms choosing to“deverticalize” production through outsourc-ing create new opportunities for suppliers andcreate a foundation for a steady increase intrade for participating developing countries.The downside is that this production and theassociated high rates of export growth arehighly concentrated geographically, and sothis door into a greater share of the globaleconomy has, to date, opened only for rela-tively few countries. Taking advantage ofnetworks requires a strong policy environ-ment that fosters private investment and pro-vides complementary public investments (seebelow).
Third, with growing concerns about risk,investors are becoming increasingly sensitiveto investment climates in developing coun-tries, and the result is that money is moving tothe countries with large, rapidly growing, andrelatively stable economic environments.Countries such as China, the Republic ofKorea, and Mexico benefited from the largestinflows in 2000. As a share of domestic in-vestment, however, small-market countries areproving they can keep pace—provided thatthey protect property rights, have stablemacroeconomic environments, and have goodinstitutions. Poor countries that fall short onpolicies and institutions compound the disad-vantages they already experience from havingsmall markets. Hence, they may be virtuallyshut out from foreign investment flows in anysector other than natural resources.
Finally, long-term private investment fi-nancing for infrastructure has fallen off tolevels that may prove persistent. This retrench-ment has two origins. First, the post-1997 rise
S U M M A R Y
xv
in global risk premiums has reduced investors’appetite for risk and for projects with long ges-tations. Adversity to such projects is reflectednot only in the average spreads over U.S. Trea-sury interest rates that developing countriesmust pay to their bondholders in the EmergingMarket Bond Index (even excluding country“outliers” in crisis) but also more generally inspreads of high-risk corporate bonds in theUnited States. Both have more than doubledfrom under 500 basis points to more than1,000. The recent collapse of the telecommu-nications sector, as well as difficulties experi-enced by major power companies associatedwith the Enron scandal, has diminished thenumber of players and enthusiasm amongpotential long-term financiers. Second, manyprojects have suffered payment problemsbecause of the inability of contracts to weathersharp contractions in demands. FromArgentina to Indonesia, the string of defaultsassociated with infrastructure projects and re-structurings has left in its wake a severe re-trenchment. Thus, governments throughoutthe developing world will have to do more tooffset this risk—principally through betterpolicies, and perhaps through a slowing of theretreat from government financing of infra-structure that has occurred under the bannerof privatization.
Harnessing globalization requiresreducing barriers to competition—To raise the productivity of both foreign anddomestic investment, developing countrieshave to harness the full force of competitioninherent in globalization. Too often they havenot done so. In many countries, policy barri-ers to competition—whether they are im-pediments to trade, restrictions on incomingforeign investment, administrative barriers tocompetition, or monopolies granted to stateenterprises—have channeled domestic as wellas foreign investment into less-productiveactivities that dampen productivity improve-ment and hobble growth. Import competition,for example, can limit what would otherwisebe the shared monopoly pricing of a few local
gep_fm.qxd 12/5/02 4:17 PM Page xv
producers. In a wide sample of developingcountries, decreasing imports in concentratedindustries from 25 percent of domestic sales tozero is associated with increases of 8 percentin oligopolistic markups on sales.
Competition-impeding regulations in re-cently privatized industries have underminedpotential benefits from privatization and haveinsulated new owners—frequently foreigncompanies—from efficiency-improving com-petition; the result has been slow growth andresource misallocation. In Africa, for example,telephone services in countries with privatemonopolies have expanded growth only one-third as fast as telephone services in countrieswith competitive networks.
Over time, firms in countries with lowerbarriers to trade and to investment competi-tion tend, as a general rule, to enjoy signifi-cantly higher productivity of investment, bothforeign and domestic, and with it more rapidgrowth. This fact does not imply a single pre-scription for all countries irrespective of theirstage of development. As the experience ofChina—among others—has shown, reformshave to be tailored to country circumstancesand integrated into sustainable developmentstrategies. The analysis does imply, however,that countries wishing to increase their oppor-tunities from globalization would do well tolook first at the incentive features of theirinvestment climate, with special attention tobarriers that impede competition.
—and using targeted interventions with care—Governments may hope to make up for anunfriendly investment environment through in-centive mechanisms. But while there are clearlyexamples in which targeted interventions—such as fiscal incentives, export processingzones (EPZs), or support for economic clus-ters—may indeed lead to higher investmentlevels (and the jobs and related spillovers thatgo along with them), there is, unfortunately,little evidence that such initiatives can besystematically successful. Instead, they tend towork best when they work in support of
G L O B A L E C O N O M I C P R O S P E C T S 2 0 0 3
xvi
broader reform packages, either to catalyzesupport for emerging opportunities (such asclusters) or to create transitional mechanismsand initial constituencies for reform that canbe progressively expanded (such as EPZs). Butmore broadly, investment incentives will gen-erally not make up for serious deficienciesin the investment environment or generatesustained growth. To encourage productiveinvestment and benefit from globalization,governments must tackle the challenges ofpromoting competition and entrepreneurshipand of undertaking complementarily pro-ductive public investment in areas such aseducation.
—and therefore sound public investmentsare essentialPublic investment also plays a crucial role inenhancing growth. Some countries get boththe levels and the composition of investmentright, and their growth rates are high. Othercountries invest too much through the publicsector and crowd out private investment.Because these effects are also associated withinvestments in state enterprises that enjoy mo-nopoly positions protected from competition,the composition effects of public investmentare negative. Other countries invest too littlethrough the public sector. This problem is usu-ally manifested in poor education, poor in-frastructure, and poor public institutionsgenerally—all of which reduce profitable in-vestment opportunities for both domestic andforeign companies. Investing in effective pub-lic institutions has an especially high return.
International agreements on investmentand competition policies can providebenefits through reciprocity—Countries get most of the positive growthstimulus from domestic unilateral reformstailored to local strategy and conditions, andthese reforms should not be held hostage tointernational agreements. Nonetheless, re-forming governments may be able to obtainadditional benefits from international agree-ments. Benefits can take several forms. For
gep_fm.qxd 12/5/02 4:17 PM Page xvi

investment policies, participating in interna-tional agreements that are linked to greatermarket access may elicit more investment bysignaling to investors that changes are perma-nent. Also, participating in international nego-tiations may strengthen the hand of domesticreformers by holding out the prospect of mar-ket access abroad in exchange for new domes-tic policies; simultaneously, negotiations canprompt reciprocal reforms among partnersthat would not otherwise occur. For competi-tion policy, international agreements may leadto the removal of restraints that inhibit com-petition, thereby unleashing new price compe-tition that benefits all countries.
—but agreements on investment policy arelikely to have strong development effectsonly if they deal with the big issues facingdeveloping countries—The purposes of coordinating investmentpolicy are to expand the flow of investmentaround the world, to minimize policy exter-nalities that hurt neighbors, and to helpimprove economic performance. Agreementsmight contribute to achieving these goalsthrough three main channels: protectinginvestors’ rights, which increases incentives toinvest; liberalizing investment flows, whichpermits enhanced access and competition; andcurbing policies that may distort investmentflows and trade at the expense of neighbors.
International agreements that focus on es-tablishing protections for investors cannot beexpected to expand markedly the flow of in-vestment to new signatory countries. This isbecause many protections are already con-tained in bilateral investment treaties (BITs).Even the relatively strong protections in BITsdo not seem to have increased flows of in-vestment to signatory developing countries.These facts suggest that expectations for newflows associated with protections emergingfrom any multilateral agreement should bekept low.
International agreements that allow coun-tries to negotiate reciprocal market liberaliza-tion and to promote nondiscrimination can
S U M M A R Y
xvii
reinforce sound domestic policies and cancontribute to better performance. Since mostof the remaining restrictions are on services,governments around the world can increasemarket access by using the existing multilat-eral framework rather than creating a newone. The General Agreement on Trade in Ser-vices (GATS) provides an as-yet-underutilizedarrangement to negotiate reciprocal marketaccess in services. To date, the coverage ofcommitments for a large number of countriesis limited. About two-thirds of the WorldTrade Organization membership has sched-uled 60 or fewer sectors (of the 160 or so spec-ified in the GATS list). Moreover, in manycases, commitments do not reflect the actualdegree of openness. Finally, in some countries,the commitments that have been made serveonly to protect the privileged position of in-cumbents rather than enhance the contestabil-ity of markets. To remedy these problems,governments must take greater advantage ofthe opportunity offered by the GATS to lendcredibility to reform programs by committingto maintain current levels of openness or byprecommitting to greater levels of futureopenness. To advance the process of servicesreforms beyond levels undertaken indepen-dently and to lead to more balanced outcomesfrom the developing-country point of view,countries could better harness the power ofreciprocity by devising negotiating formulasthat widen the scope for tradeoffs across sec-tors (both in goods and in services) and acrossmodes of delivery, particularly the temporarymovement of workers. While difficult, such ef-forts may prove easier than designing a wholenew international investment arrangement.
Similarly, curbing policy externalities that“beggar thy neighbor” can benefit developingcountries, especially if the countries focuson two critical issues. The first is to reduceinvestment-distorting trade barriers. By de-priving developing countries of market accessand by discouraging their exports, many tradebarriers also lessen the attractiveness of oppor-tunities to invest in developing countries’ ex-port industries for both foreign and domestic
gep_fm.qxd 12/5/02 4:17 PM Page xvii
investors. In Canada, the European Union(EU), Japan, and the United States, average advalorem–equivalent tariffs for manufacturesare roughly twice as high for developing coun-tries as they are for members of the Organisa-tion for Economic Co-operation and Develop-ment. The ad valorem–equivalent tariffs onagriculture (to say nothing of subsidies) inthose countries are also more than three timeshigher than such tariffs on manufactures. Re-ducing trade barriers among developing coun-tries themselves is as important as reducingtrade barriers in rich countries. Developingcountries import from each other at average advalorem–equivalent rates comparable to EUrates for imports from developing countries.This level of protection dampens investment—both domestic and foreign—in affected exportindustries, and removal of these barrierswould have significant development effects.
The second critical issue is to curb theemerging competition among countries to lureforeign investment through investment incen-tives. Unfortunately, information on the ex-tent of investment incentives is inadequate toassess their effects, and so a high priority forinternational collaboration is to systematicallycompile this information.
Finally, participation in international agree-ments on investment may also have benefitsover and above unilateral reforms if the agree-ments include reciprocal market access inareas of importance to developing countries.These benefits can become clear only in thecourse of negotiation.
—and thus competition agreements shouldfocus on restraints to competition thathurt developing countriesGreater competition is associated with morerapid development, and lowering policy barri-ers to trade and foreign investment in devel-oping countries, as shown in chapter 3, is apowerful procompetitive force. Beyond unilat-eral actions, international agreements on com-petition policy might also bring benefits, pro-vided they address the major restrictions thatadversely affect developing countries.
G L O B A L E C O N O M I C P R O S P E C T S 2 0 0 3
xviii
Restrictions on competition in the globalmarketplace that most hurt development takethree forms. The first form consists of policybarriers in markets abroad that limit competi-tion among developing countries in thesemarkets. These barriers, like those discussedabove, discourage investment and create ob-stacles to competition. Particularly harmfulare the $311 billion in agricultural subsidiesand textile quotas, as well as the correspond-ing high border protection, tariff distortions(that is, tariff peaks and escalation), and pro-tectionist use of antidumping. These practicesare only too common in all countries, rich andpoor alike. All of these trade restrictions limitthe ability of exporters in developing countriesto compete in international markets.
Second, private restraints on competitioncan adversely affect prices for consumers andproducers in developing countries—much asthey can in industrial countries. For example,cartel practices among companies based inhigh-income countries taxed consumers indeveloping countries by up to $7 billion in the1990s. Actions that facilitate prosecution ofcartels should be high on the priority list. Suchactions can range from developing more sys-tematic arrangements to exchange informa-tion among competition agencies, to grantingstanding for developing countries to sue underforeign antitrust laws when their trade is ad-versely affected. Indeed, both developing andindustrial countries would benefit from muchgreater efforts to identify and document re-strictive business practices that adversely af-fect prices of their trade.
Third, many governments in high-incomecountries officially sanction trade restraintsthrough antitrust exemptions for their compa-nies in domestic law. For example, many gov-ernments permit their companies to cartelizeexports. Shrouded in the secrecy of governmentregistries, these national export cartels maywell raise prices to developing countries. Ef-forts should be made to make information onnational export cartels transparent. Everyonewould benefit from a decrease in cartels thathave damaging price effects. Similarly, antitrust
gep_fm.qxd 12/5/02 4:17 PM Page xviii
exemptions for ocean transport have given riseto price-fixing arrangements that systematicallyhurt consumers everywhere, including those indeveloping countries. These restraints are esti-mated to cost developing countries more than$2 billion per year and entail similar costs toconsumers in industrial economies.
Finally, competition policies in developingcountries themselves can in many cases beimproved through increased transparency,nondiscrimination, and procedural fairness.However, international cooperation in thiscomplex area of regulation has to recognizethat countries have different capacities andinstitutional settings, warranting caution inrecommending—much less in mandating—across-the-board policies. In this area, volun-tary programs that facilitate the learning and
S U M M A R Y
xix
adoption of best practices in developing coun-tries can pay high dividends.
Unlocking global opportunities begins withthe efforts of developing countries to improvetheir investment climates. Deployed well, in-vestment policies and policies to unleash com-petition can accelerate economic growth andreduce poverty. This report offers a generalframework and lessons, but each country hasto formulate its own development strategy.Nonetheless, the international community,working together, can help through develop-ment assistance, voluntary collaboration, andwell-conceived international agreements. Forthese efforts to have greatest effect, they haveto tackle the most pressing investment andcompetition problems—and that is the chal-lenge ahead.
gep_fm.qxd 12/5/02 4:17 PM Page xix

Abbreviations and Data Notes
xxi
ADB Asian Development Bank
ASCM Agreement on Subsidies and Countervailing Measures
BITs Bilateral Investment Treaties
EPZ Export processing zone
EU European Union
FDI Foreign direct investment
FSAP Financial Sector Assessment Program
GATS General Agreement on Trade in Services
GPA Government Procurement Agreement
HIV/AIDS Human immunodeficiency virus/acquired immune deficiency syndrome
ICC International Chamber of Commerce
ICN International Competition Network
ICSID International Center for Settlement of Investment Disputes
IMF International Monetary Fund
ITO International Trade Organization
LDC Least developed countries
M&A Mergers and acquisitions
MAI Multilateral Agreement on Investment
MERCUSOR Latin America Southern Cone trade bloc (Argentina, Brazil, Paraguay, andUruguay)
MFN Most favored nation
MNCs Multinational corporations
NAFTA North American Free Trade Agreement
NGO Nongovernmental organization
OAS Organization of American States
OECD Organisation for Economic Co-operation and Development
ROSC Reports on the Observance of Standards and Codes
SOEs State-owned enterprises
gep_fm.qxd 12/5/02 4:17 PM Page xxi

TNCs Transnational corporations
TRIMs Trade-Related Investment Measures
TRIPS Trade-Related Aspects of Intellectual Property Rights
U.S. BEA U.S. Bureau of Economic Analysis
UNCITRAL United Nations Commission on International Trade Law
UNCTAD United Nations Conference for Trade and Development
UNDP United Nations Development Programme
USAID U.S. Agency for International Development
WTO World Trade Organization
G L O B A L E C O N O M I C P R O S P E C T S 2 0 0 3
xxii
Data notesThe “classification of economies” tables atthe end of this volume classify economies byincome, region, export category, and indebt-edness. Unless otherwise indicated, the term
“developing countries” as used in this vol-ume covers all low- and middle-income coun-tries, including countries with transitioneconomies.
gep_fm.qxd 12/5/02 4:17 PM Page xxii

Developments in early 2002 showed acyclical rebound—Macroeconomic stimulus, a rebound from arecord trough in the high-tech sectors anda bottoming-out of inventory cycles, broughtlarge parts of the global economy onto a re-covery path at the end of 2001. Lower interestrates helped keep consumers’ demand fordurable goods strong. Together with fiscal eas-ing, that demand provided support for therebound in the United States and, to a lesserextent, in some East Asian and Europeancountries. High-tech markets—in which tech-nologies quickly become obsolete—returnedto strong growth by creating replacements forold products. Inventory selloffs ceased, therebycontributing to an acceleration of gross do-mestic product (GDP) growth in early 2002.
The driving forces behind the initial phaseof the recovery were strong, but short-lived, asbusiness confidence remained weak. Inventoryand high-tech cycles typically are short, andboth appear to have peaked toward the middleof 2002. The effects of fiscal stimulus andmonetary easing can also, under current cir-cumstances, dissipate quickly.
—but uncertainty in financial markets hassapped momentum In the second phase of a typical recovery, theupturn spreads to other sectors and otherregions, and the driving force shifts from in-ventory dynamics to accumulation of fixedinvestment. In the current upswing, however,
the second phase is in jeopardy because of ten-sions in financial markets, which reflect accu-mulated financial imbalances and significantuncertainties. These pressures have made therecovery in 2002 less uniform, and they arelikely to moderate growth in 2003.
In Japan, deflation and high and rapidlygrowing government debt have placed severelimits on both monetary and fiscal stimuli.Combined with the fragility of the bankingsector, which is burdened by bad loans anddiminishing capital caused by lower equityvalues, financial uncertainty prevents thespread of recovery from export sectors tothose that produce for the domestic market.The accounting scandals in the United Stateshave undermined the trust in reporting sys-tems. Investors, who have come to rely oncontinuously rising equity prices, now find itdifficult to assess the profitability of firms.That difficulty sharply pushed up risk premi-ums in equity markets. European financial in-stitutions were forced to adjust their balancesheets in the wake of large-scale defaults,notably by Argentina and several majorU.S. firms, which probably played a role insuppressing a nascent recovery in Europeaneconomies. In Europe and elsewhere, telecom-munication sectors still suffer from overin-vestment and high debt burdens, making aspeedy recovery of capital spending in thosesectors unlikely.
Uncertainty is keeping investors cautious,if not skittish, throughout the world. While
1
1The International Economy andProspects for Developing Countries
1
gep_ch01.qxd 12/5/02 4:15 PM Page 1

investors in high-income countries take theirlosses and replenish their reserves, they limittheir exposure to developing countries andconcentrate their assets in investment-gradeborrowing countries.1 Capital flows into largeparts of Latin America dropped sharply, re-flecting the aftermath of Argentina’s defaultand the vicious combination of global uncer-tainty, domestic problems in some large coun-tries, and intra-regional contagion. The reversalof capital flows—with the accompanying risein spreads and depreciation of currencies—when combined with vulnerable balance-sheet characteristics triggered a dangerousworsening of debt dynamics in some LatinAmerican countries. In such an environment,average per capita income in Latin Americahas fallen in 2002 for the second year insuccession.
The rebound in 2002 was less uniformthan anticipated—Rapid recovery in the beginning of 2002,driven in part by sharp increases in the U.S.government’s expenditure in the aftermath ofterrorist attacks, has resulted in upward revi-sions of 2002 growth for the United States,East Asia, and Japan, relative to forecastsprepared in February (table 1.1). At the otherextreme, growth in Latin America has beenlowered by 1.6 percentage points for theyear. This decrease reflects not only the crisisin Argentina, but also the major contrac-tions of GDP in Uruguay and the RepúblicaBolivariana de Venezuela, plus slow growthin Brazil, Chile, and Mexico. Those eventsmade the 2001–02 period the worst for theregion since the debt crisis of the early 1980s.Consistent with higher-than-anticipatedglobal growth, non-oil commodity prices in2002 have risen more than anticipated.Nonetheless, the present rebound in com-modity prices is modest from an historicalperspective, thus highlighting the continuingdownward pressures on prices tied to struc-tural factors. Higher commodity prices havesupported modestly improved performance inSub-Saharan Africa.
—and the outlook for 2003 is for tepid growth Reflecting financial uncertainty and the dis-appointing recovery of business confidence,projected growth for 2003 has been markeddown for almost all developing regions, be-cause a robust rebound in industrial coun-try growth—driven by strong advances ininvestment—has become less likely. In linewith these revisions, inflation, interest rates,and non-oil commodity prices are also likelyto be lower. The sole exception to this patternis the Middle East and North Africa region,where oil exporters have benefited from highoil prices during 2002. Several of these coun-tries are seeing increased government expendi-ture, financed by rapidly mounting surplusesof oil revenues.
Investment cycles in developing countriesare more volatile than in rich countriesWith the sharp fall in global investment in2001 and the uncertainty surrounding a re-bound in capital expenditure, investmentbehavior has become a key element of theoutlook. A closer look at investment cycles indeveloping countries suggests the followingconclusions:
• Investment behavior in low- and middle-income countries is a determinant ofoverall volatility that is even moreimportant than it is in high-incomecountries.
• Those developing countries with astronger policy environment exhibitlower volatility in investment.
• Although in rich countries domesticfixed investment tends to drive foreigncapital inflows, in middle-income coun-tries the opposite tends to occur (that is,capital inflows typically drive domesticinvestment).
These conclusions imply that the middle-income countries are especially vulnerable tothe current jitters in financial markets. Suchcountries are exposed to sudden reversals in
G L O B A L E C O N O M I C P R O S P E C T S 2 0 0 3
2
gep_ch01.qxd 12/5/02 4:15 PM Page 2

T H E I N T E R N A T I O N A L E C O N O M Y A N D P R O S P E C T S F O R D E V E L O P I N G C O U N T R I E S
3
Table 1.1 Global conditions affecting growth in developing countries and world GDP growth(percentage change from previous year, except interest rates and oil price)
Global DevelopmentCurrent estimate Current forecasts Finance 2002 forecasts
2000 2001 2002 2003 2004 2002 2003
Global conditionsWorld trade (volume) 13.1 �0.5 2.9 7.0 8.0 1.8 8.3
Inflation (consumer prices)G-7 OECD countriesa,b 1.9 1.7 0.9 1.2 1.5 0.9 1.6United States 3.4 2.8 1.5 2.1 2.3 1.5 2.4
Commodity prices (nominal $)Commodity prices, except oil ($) �1.3 �9.1 5.0 5.8 4.4 1.3 7.3Oil price ($, weighted average), $/bbl 28.2 24.4 25.0 23.0 20.0 20.0 21.0Oil price (% change) 56.2 �13.7 2.7 �8.0 �13.0 �17.9 5.0Manufactures export unit value ($)c �2.1 �1.4 0.5 3.0 2.2 �0.5 3.6
Interest ratesLIBOR, 6 months (US$, percent) 6.6 3.6 1.8 1.5 3.1 2.3 4.0EURIBOR, 6 months (euro, percent) 4.5 4.2 3.4 3.2 3.8 3.0 4.0
GDP (growth)d
World 3.8 1.1 1.7 2.5 3.1 1.3 3.6Memo item: World GDP (ppp)e 4.5 2.1 2.8 3.4 4.0 2.4 4.3
High-income countries 3.5 0.7 1.5 2.1 2.7 0.9 3.3OECD countriesf 3.4 0.8 1.4 2.1 2.6 0.8 3.1
United States 3.8 0.3 2.3 2.6 3.1 1.3 3.7Japan 2.1 �0.3 0.0 0.8 1.3 �1.5 1.7Euro Area 3.7 1.5 0.8 1.8 2.6 1.2 3.3
Non-OECD countries 6.8 �0.7 2.3 3.7 5.3 2.7 5.3
Developing countries 5.2 2.9 2.8 3.9 4.7 3.1 4.9East Asia and Pacificf 7.0 5.5 6.3 6.1 6.4 5.6 7.1Europe and Central Asia 6.6 2.3 3.6 3.4 3.6 3.2 4.3
Transition countries 6.4 4.6 3.5 3.3 3.5 3.4 4.0Latin America and the Caribbean 3.7 0.4 �1.1 1.8 3.7 0.5 3.8
Excluding Argentina 4.5 1.2 0.7 1.9 3.6 2.1 4.3Middle East and North Africa 4.2 3.2 2.5 3.5 3.7 2.7 3.3
Oil exporters 3.6 2.4 2.4 3.7 3.6 2.2 2.8Diversified economies 3.7 4.3 2.2 2.7 3.6 3.1 4.4
South Asia 4.8 4.4 4.6 5.4 5.8 4.9 5.3Sub-Saharan Africa 3.2 2.9 2.5 3.2 3.8 2.6 3.6
Memorandum items
Developing countriesExcluding the transition countries 5.0 2.6 2.7 4.0 4.9 3.1 5.1Excluding China and India 4.6 1.7 1.5 2.8 3.8 2.0 4.1
Note: OECD � Organization for Economic Co-operation and Development, bbl � barrel, EURIBOR � European interbank offered rate, LIBOR � Londoninterbank offered rate, ppp � purchasing power parity.a. Canada, France, Germany, Italy, Japan, the United Kingdom, and the United States.b. In local currency, aggregated using 1995 GDP weights.c. Unit value index of manufactures exports from the G-5 countries to developing countries, expressed in U.S. dollars.d. GDP in 1995 constant dollars: 1995 prices and market exchange rates.e. GDP measured at 1995 purchasing power parity (international dollar) weights.f. Republic of Korea income classification changed from middle to high income (July 2002). Both forecasts were adjusted for this revision.Source: World Bank, November 2002 and Global Development Finance 2002 projections of February 2002.
gep_ch01.qxd 12/5/02 4:15 PM Page 3

capital flows, which can dampen investmentsharply and can undermine growth momen-tum. Countries with strong policy environ-ments are more likely to avoid or smoothlyabsorb potential external financial shocks.
In the long term, faster growth can be achieved in most developing regionsMarket reforms and trade liberalization dur-ing the 1990s have opened opportunities foraccelerating technological advances through-out the developing world for the next 15 years.An exception is emerging East Asia, wheresome moderation of technological progressis anticipated, reflecting in part the extra-ordinarily rapid catching-up that occurred dur-ing the 1980s and 1990s. The acceleration ofgrowth in many of the other regions is likelyto coincide with increasing savings and invest-ment rates. Demographic transitions are anti-cipated to boost saving rates in developingcountries, while reducing them in high-incomecountries.
On balance, the declining availability ofsavings in the aging populations of high-incomecountries and the increased savings in thedeveloping world—set against investmentpatterns needed to accommodate potentialgrowth—imply that more and more develop-ing countries will move toward surplus on thecurrent account and that the recent shift fromdebt accumulation to debt reduction is likelyto continue. As long as domestic credit mar-kets continue to mature and public savingsdo not deteriorate, domestic savings can beexpected to rise, and the required reduction indebt levels will not conflict with the requiredinvestment.
A recovery constrained by major risks
During the summer of 2002, investor riskperceptions increased and market senti-
ment deteriorated across large parts of theworld’s economy, thereby jeopardizing theglobal recovery that had started in the fourth
quarter of 2001. Accumulated financial im-balances that had built up during the 1990semerged as a critical factor that clouded theeconomic outlook. In the United States, thebursting of the equity bubble and cumulatedprivate sector debt kept investors cautious andresulted in a continuous flight to quality,which moved the yield on government bondsto a 40-year low while hampering the recoveryin private investment. In Japan, banking prob-lems and the lack of scope for monetary eas-ing and fiscal stimulus limited the spilloverfrom an export-driven recovery to a reboundin domestic investment. In Europe, weaknesswas concentrated in the highly indebtedtelecommunications sector and in financialsectors that had to absorb sharp devaluationsof their assets.
Bankruptcies and reductions in investmentduring the global downturn of 2001 and thesubsequent first phase of recovery in early2002 had not reduced corporate debt nor re-stored profitability sufficiently. In a number ofcases, the downturn has generated new imbal-ances. Throughout the world, fiscal balancesdeteriorated and balance sheets of financialinstitutions weakened. Continued tension infinancial markets made the recovery less uni-form in 2002—as well as probably less robustin 2003—than would have been the caseunder more normal circumstances. Vulnerabil-ity to adverse shocks has increased, and eventhe potential for a “double-dip” recession sce-nario in the industrial countries cannot—atthis juncture—be entirely ruled out.
Three distinct phases characterize recentdevelopments. The first phase portrays thedriving forces behind the initial phase of therecovery that started in late 2001, a recoverythat was more robust in the United States andEast Asia. These forces range from the end ofinventory adjustment, monetary easing, andfiscal stimulus to a technical rebound in thehigh-tech industrial sectors. This picture nor-mally would be characterized as a favorableenvironment for developing countries. Thatenvironment includes low inflation and inter-est rates, plus a significant recovery in global
G L O B A L E C O N O M I C P R O S P E C T S 2 0 0 3
4
gep_ch01.qxd 12/5/02 4:15 PM Page 4

trade and commodity prices, albeit a recoveryfrom low levels. During the second phase, arecovery typically broadens to other regionsand other sectors. Therefore, a recovery ofprofits and strong growth in fixed investmentbecomes the driving force that sustains or evenaccelerates growth. In the absence of suchbroadening and deepening, driving forces thatunderpin the initial phase would suddenlyappear to become short lived, which is thesituation today. Finally in the third phase—typically the shift from “recovery” to eco-nomic expansion—implications of the set ofopposing forces (cyclical rebound and finan-cial turbulence) for the medium-term globaloutlook (2003–04) are analyzed. The lack ofuniformity in growth performance during2002, following an almost synchronized slow-ing of growth across regions in 2001, is par-ticularly notable. The growth projections for2003 are more uniform across regions, butare distinctly weaker than would have beenanticipated in a strong, synchronized globalrecovery.
The first phase of the global recovery was driven by policy stimulus—In the wake of the terrorist attacks in Septem-ber 2001, forceful monetary easing in theUnited States—and to a lesser extent inEurope—helped prevent a deepening of theglobal downturn. U.S. consumers benefitedfrom historically low interest rates to boosttheir purchases of durable goods. Combinedwith double-digit growth in governmentspending—mainly driven by security, defense,and reconstruction efforts—the stimulus wassufficient to turn U.S. GDP growth positive, to2.7 percent (annualized), in the fourth quarterof 2001. One quarter later, Japan, which suf-fered steep output declines for three quartersin succession, and Europe, having experiencedonly a modest fall in GDP, broke away fromnegative growth rates as well.
The importance of U.S. domestic demandin this recovery is striking. During the firsthalf of 2002, GDP advanced at a 3 percent
annual rate, despite a drag of nearly 1.5 per-centage points stemming from a deteriorationof net exports. In contrast, output in Japan in-creased by 2.5 percent, of which foreign tradecontributed 1.8 percentage points, while in theEuro Area, GDP growth of 1.6 percent wassupported by almost 1 percentage point frompositive net exports contributions.
—inventory dynamics—Inventory dynamics played a pivotal role inthe recovery, thus complementing macro-economic stimulus efforts. The same reductionin the inventory stock that led to a negativecontribution of stock building to GDP growthin 2001 implied a positive contribution ofstock building to GDP growth in 2002. Oncethe lower level of desired inventories wasachieved, stock building shifted from sharplynegative to close to zero. The slowing of inven-tory liquidation significantly shifted the con-tribution to GDP growth from the second halfof 2001 to the first half of 2002: that shiftadded 1.2 percentage points to the accelera-tion of GDP growth in both Japan and theEuro Area, and a full 2.2 percentage points inthe United States (figure 1.1).
—a high-tech rebound—Recovery in global high-tech markets was anequally powerful stimulant. After demand forsemiconductors and related equipment plum-meted during 2001, markets were anticipatedto rebound sharply, but the scope of recoveryexceeded expectations. There are severalnatural limits to declines at rates of up to50 percent. The nature of the product—thetechnology of which becomes obsoletequickly—warrants a periodic return to highgrowth, as old products are replaced by newones and as the introduction of advancedtechnologies generates new and growing mar-kets. Defense- and security-related spending inthe United States also played a role in bolster-ing demand (U.S. manufacturing orders forcomputers and communications equipmentratcheted to annual rates of 40 and 90 per-cent, respectively, in early 2002). As the
T H E I N T E R N A T I O N A L E C O N O M Y A N D P R O S P E C T S F O R D E V E L O P I N G C O U N T R I E S
5
gep_ch01.qxd 12/5/02 4:15 PM Page 5

G L O B A L E C O N O M I C P R O S P E C T S 2 0 0 3
6
�3
�4
�5
�6
�2
�1
0
1
2
3
4
5
Q22002
Q32001
Q42001
Q12002
Q22002
Q32001
Q42001
Q12002
Q22002
Q12002
Q42001
Q32001
United States
Japan
Euro Area
Source: U.S. Department of Commerce; Japan Economic Statistics and Research Institute (ESRI) and Eurostat.
Figure 1.1 The recovery was initiated in a typical fashion(growth in percent)
GDP growth
Stock contribution
�20
�15
�10
�5
0
5
10
15
20
Jan.2000
May2000
Sep.2000
Jan.2001
May2001
Sep.2001
Jan.2002
Sep.2002
May2002
Note: 3m/3m saar refers to 3-month/3-month seasonallyadjusted annualized rate.Source: Datastream.
Figure 1.2 A brief rebound in industrialcountries was underway
Manufacturing production
(percent change, 3m/3m saar)
EU-15
Japan
United States�50
�25
0
25
50
75
100
125
�20
�10
0
10
20
30
40
50
Jan.2000
Jul.2000
Jan.2001
Jul.2001
Jan.2002
Jul.2002
Figure 1.3 Rebound in industrialcountries boosted production in EastAsia
Semiconductor dollar sales and industrialproduction*
(percent change, 3m/3m saar)
Note: Through July 2002. *Republic of Korea, Malaysia,Singapore, and Taiwan, China.Source: Semiconductor Industry Association (SIA) andnational sources through Datastream, World Bank staffestimates.
Semiconductor sales(left axis)
Industrial production(right axis)
rebound intensified, a strong boost was givento manufacturing output in industrial coun-tries, and especially to production and exportsfrom East Asia (figures 1.2 and 1.3).
Macroeconomic stimuli, inventory dynam-ics, and a powerful turnaround in high-techmarkets in the industrial countries set the stage
for a broader global recovery through thetraditional channels of international transmis-sion. With world trade increasing, commodityprices firming, and interest rates—fostered bylow inflation—standing at historically low
gep_ch01.qxd 12/5/02 4:15 PM Page 6
levels, developing countries faced a broadlyfavorable environment during the early part of2002.
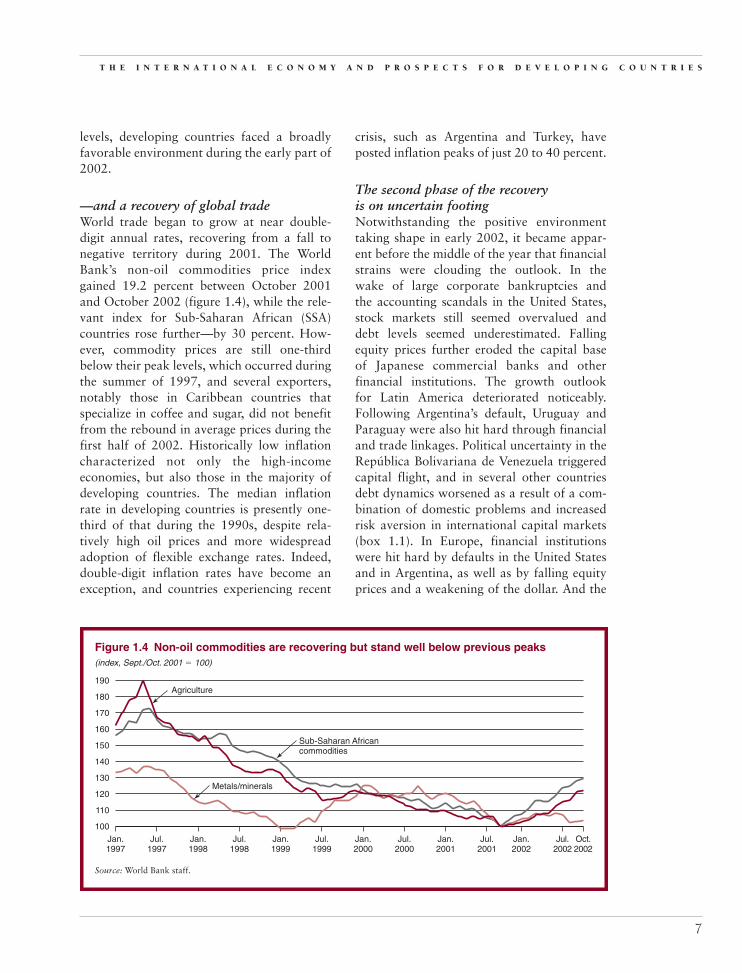
—and a recovery of global tradeWorld trade began to grow at near double-digit annual rates, recovering from a fall tonegative territory during 2001. The WorldBank’s non-oil commodities price indexgained 19.2 percent between October 2001and October 2002 (figure 1.4), while the rele-vant index for Sub-Saharan African (SSA)countries rose further—by 30 percent. How-ever, commodity prices are still one-thirdbelow their peak levels, which occurred duringthe summer of 1997, and several exporters,notably those in Caribbean countries thatspecialize in coffee and sugar, did not benefitfrom the rebound in average prices during thefirst half of 2002. Historically low inflationcharacterized not only the high-incomeeconomies, but also those in the majority ofdeveloping countries. The median inflationrate in developing countries is presently one-third of that during the 1990s, despite rela-tively high oil prices and more widespreadadoption of flexible exchange rates. Indeed,double-digit inflation rates have become anexception, and countries experiencing recent
crisis, such as Argentina and Turkey, haveposted inflation peaks of just 20 to 40 percent.
The second phase of the recovery is on uncertain footingNotwithstanding the positive environmenttaking shape in early 2002, it became appar-ent before the middle of the year that financialstrains were clouding the outlook. In thewake of large corporate bankruptcies andthe accounting scandals in the United States,stock markets still seemed overvalued anddebt levels seemed underestimated. Fallingequity prices further eroded the capital baseof Japanese commercial banks and otherfinancial institutions. The growth outlookfor Latin America deteriorated noticeably.Following Argentina’s default, Uruguay andParaguay were also hit hard through financialand trade linkages. Political uncertainty in theRepública Bolivariana de Venezuela triggeredcapital flight, and in several other countriesdebt dynamics worsened as a result of a com-bination of domestic problems and increasedrisk aversion in international capital markets(box 1.1). In Europe, financial institutionswere hit hard by defaults in the United Statesand in Argentina, as well as by falling equityprices and a weakening of the dollar. And the
T H E I N T E R N A T I O N A L E C O N O M Y A N D P R O S P E C T S F O R D E V E L O P I N G C O U N T R I E S
7
Source: World Bank staff.
Jan.2002
Jul.2001
Jan.2001
Oct.2002
Jul.2000
Jan.2000
Jul.2002
Jul.1999
Jan.1999
Jul.1998
Jan.1998
Jul.1997
Jan.1997
100
110
120
130
140
150
160
170
180
190
Figure 1.4 Non-oil commodities are recovering but stand well below previous peaks(index, Sept./Oct. 2001 � 100)
Sub-Saharan Africancommodities
Metals/minerals
Agriculture
gep_ch01.qxd 12/5/02 4:15 PM Page 7
G L O B A L E C O N O M I C P R O S P E C T S 2 0 0 3
8
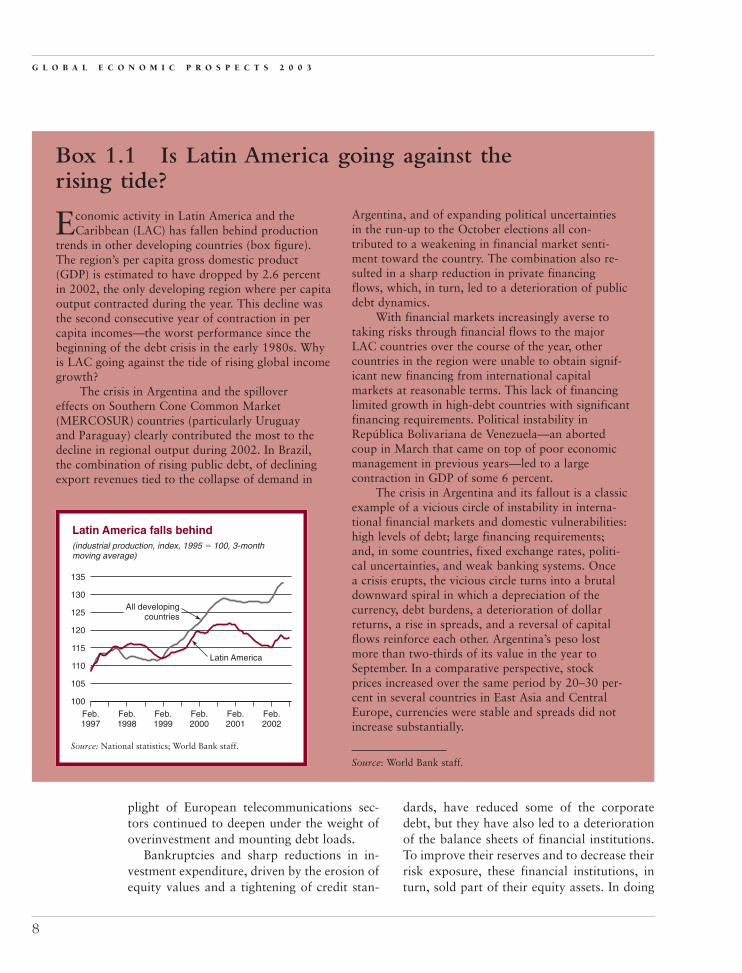
Economic activity in Latin America and theCaribbean (LAC) has fallen behind production
trends in other developing countries (box figure).The region’s per capita gross domestic product(GDP) is estimated to have dropped by 2.6 percentin 2002, the only developing region where per capitaoutput contracted during the year. This decline wasthe second consecutive year of contraction in percapita incomes—the worst performance since thebeginning of the debt crisis in the early 1980s. Whyis LAC going against the tide of rising global incomegrowth?
The crisis in Argentina and the spillovereffects on Southern Cone Common Market(MERCOSUR) countries (particularly Uruguayand Paraguay) clearly contributed the most to thedecline in regional output during 2002. In Brazil,the combination of rising public debt, of decliningexport revenues tied to the collapse of demand in
Box 1.1 Is Latin America going against therising tide?
Argentina, and of expanding political uncertaintiesin the run-up to the October elections all con-tributed to a weakening in financial market senti-ment toward the country. The combination also re-sulted in a sharp reduction in private financingflows, which, in turn, led to a deterioration of publicdebt dynamics.
With financial markets increasingly averse totaking risks through financial flows to the majorLAC countries over the course of the year, othercountries in the region were unable to obtain signif-icant new financing from international capitalmarkets at reasonable terms. This lack of financinglimited growth in high-debt countries with significantfinancing requirements. Political instability inRepública Bolivariana de Venezuela—an abortedcoup in March that came on top of poor economicmanagement in previous years—led to a largecontraction in GDP of some 6 percent.
The crisis in Argentina and its fallout is a classicexample of a vicious circle of instability in interna-tional financial markets and domestic vulnerabilities:high levels of debt; large financing requirements;and, in some countries, fixed exchange rates, politi-cal uncertainties, and weak banking systems. Oncea crisis erupts, the vicious circle turns into a brutaldownward spiral in which a depreciation of thecurrency, debt burdens, a deterioration of dollarreturns, a rise in spreads, and a reversal of capitalflows reinforce each other. Argentina’s peso lostmore than two-thirds of its value in the year toSeptember. In a comparative perspective, stockprices increased over the same period by 20–30 per-cent in several countries in East Asia and CentralEurope, currencies were stable and spreads did notincrease substantially.
Source: World Bank staff.
Feb.1997
Feb.1998
Feb.1999
Feb.2000
Feb.2001
Feb.2002
Source: National statistics; World Bank staff.
100
105
110
115
120
125
130
135
Latin America
All developingcountries
Latin America falls behind(industrial production, index, 1995 � 100, 3-monthmoving average)
plight of European telecommunications sec-tors continued to deepen under the weight ofoverinvestment and mounting debt loads.
Bankruptcies and sharp reductions in in-vestment expenditure, driven by the erosion ofequity values and a tightening of credit stan-
dards, have reduced some of the corporatedebt, but they have also led to a deteriorationof the balance sheets of financial institutions.To improve their reserves and to decrease theirrisk exposure, these financial institutions, inturn, sold part of their equity assets. In doing
gep_ch01.qxd 12/5/02 4:15 PM Page 8
T H E I N T E R N A T I O N A L E C O N O M Y A N D P R O S P E C T S F O R D E V E L O P I N G C O U N T R I E S
9
so, they further fueled the fall in stock pricesand amplified new imbalances. Similarly,the drop in capital flows has increased debtproblems in several vulnerable middle-incomecountries.
Another example of new or deterioratingimbalances is the public sector deficit acrossthe industrial countries. The U.S. general gov-ernment deficit deteriorated from a surplusposition of 2.3 percent of GDP in calendaryear 2000 to a deficit of 2.5 percent in 2002,with 2.5 percentage points of that shift attrib-uted to structural deterioration. In turn, theUnited States has not taken advantage of therecession to narrow its deficit on current ac-count. Despite increases in the household sav-ings rate and declines in the private investmentrate, the current account deficit widened toa watershed mark of 5 percent of GDP as ofthe second quarter of 2002.
In the Euro Area as well, fiscal deficits havedeteriorated from a 0.9 percent surplus to a likelevel of deficit, though this deterioration re-flects mainly the work of automatic stabilizers.Unlike the U.S. fiscal deficit, it is not a struc-tural deterioration. France, Germany, Italy,and Portugal are now approaching the currentlimits of a 3 percent of GDP deficit, limitsthat were imposed by the European MonetaryUnion Growth and Stability Pact. The originalplan to eliminate deficits by 2004 has beenabandoned and replaced by an agreement toreduce structural deficits by at least 0.5 per-centage points per annum over the comingyears. Japanese fiscal deficits remain extra-ordinarily high, at levels above 7 percent ofGDP. And East Asian emerging economies, onaverage, continue to run relatively high deficitlevels—above 4 percent of GDP—contrastedwith a deficit of 1 percent before the 1997 crisis.In other parts of the developing world, primarysurpluses are increasing, but improvement ofthe overall deficit remains difficult to achieve,given the burden of debt service.
Deteriorated government deficits, com-bined with low nominal interest rates, haveleft little room for further fiscal stimulus ormonetary easing, although some lowering of
interest rates seems still likely, especially inthe Euro Area. The limited scope for macro-economic policy makes the risks surroundingthe recovery even more severe. Policy solutionsin the industrial world may best be focusedon eliminating bad debts and restoring in-vestor’s sentiment by strengthening institu-tional oversight.
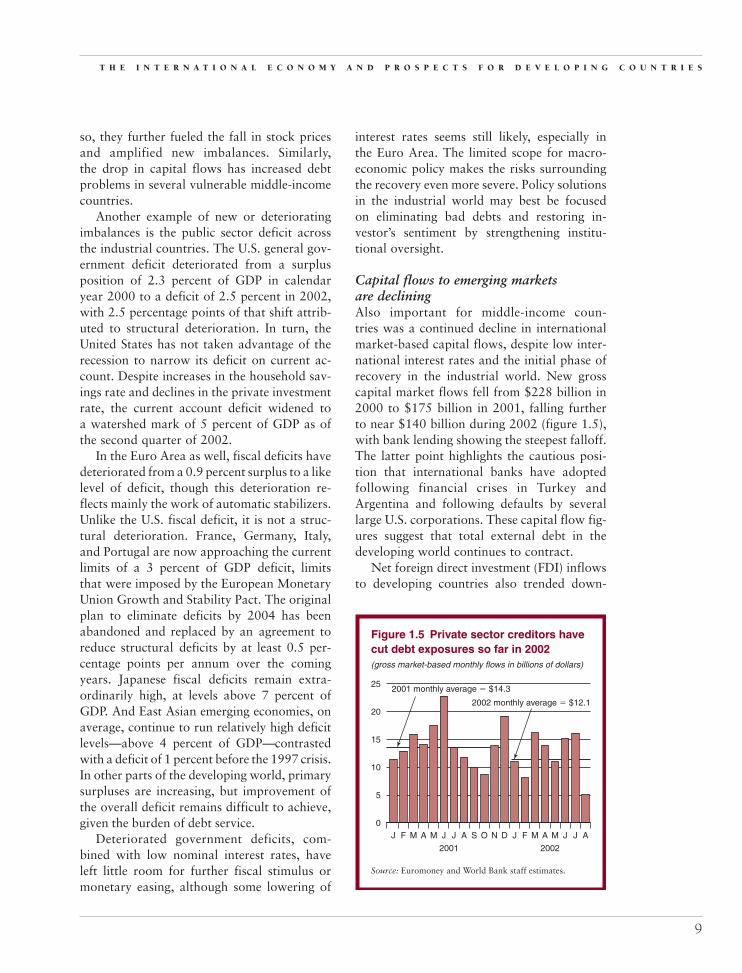
Capital flows to emerging markets are decliningAlso important for middle-income coun-tries was a continued decline in internationalmarket-based capital flows, despite low inter-national interest rates and the initial phase ofrecovery in the industrial world. New grosscapital market flows fell from $228 billion in2000 to $175 billion in 2001, falling furtherto near $140 billion during 2002 (figure 1.5),with bank lending showing the steepest falloff.The latter point highlights the cautious posi-tion that international banks have adoptedfollowing financial crises in Turkey andArgentina and following defaults by severallarge U.S. corporations. These capital flow fig-ures suggest that total external debt in thedeveloping world continues to contract.
Net foreign direct investment (FDI) inflowsto developing countries also trended down-
Source: Euromoney and World Bank staff estimates.
AJJMAMFJ
2001 2002
DNOSAJJMAMFJ
25
20
15
10
5
0
2001 monthly average � $14.3
2002 monthly average � $12.1
Figure 1.5 Private sector creditors havecut debt exposures so far in 2002(gross market-based monthly flows in billions of dollars)
gep_ch01.qxd 12/5/02 4:15 PM Page 9
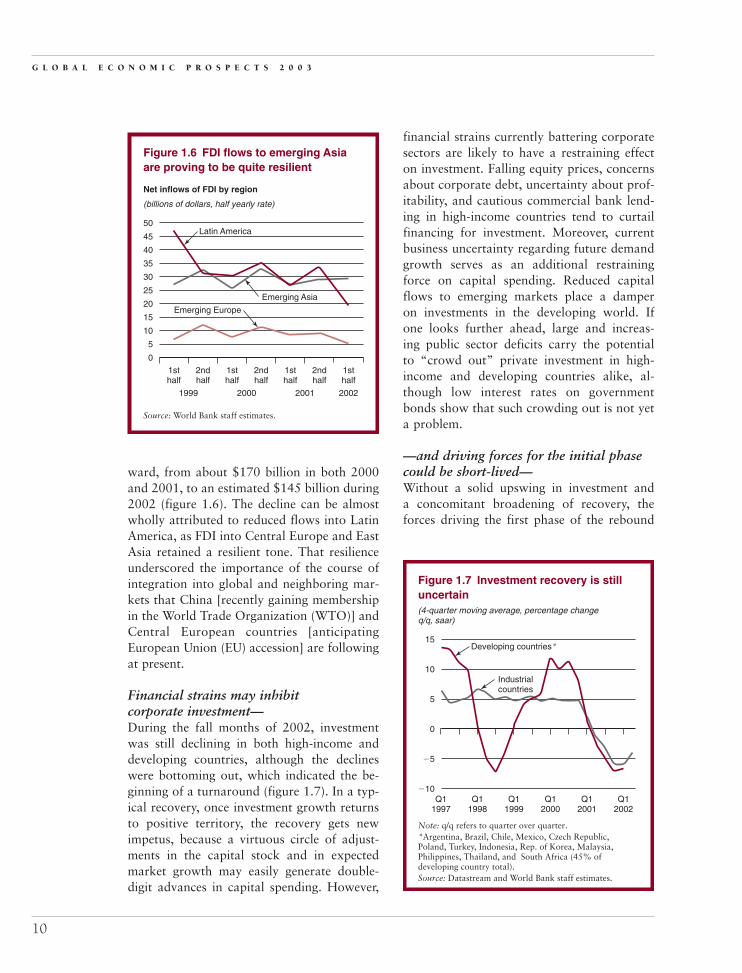
ward, from about $170 billion in both 2000and 2001, to an estimated $145 billion during2002 (figure 1.6). The decline can be almostwholly attributed to reduced flows into LatinAmerica, as FDI into Central Europe and EastAsia retained a resilient tone. That resilienceunderscored the importance of the course ofintegration into global and neighboring mar-kets that China [recently gaining membershipin the World Trade Organization (WTO)] andCentral European countries [anticipatingEuropean Union (EU) accession] are followingat present.
Financial strains may inhibit corporate investment—During the fall months of 2002, investmentwas still declining in both high-income anddeveloping countries, although the declineswere bottoming out, which indicated the be-ginning of a turnaround (figure 1.7). In a typ-ical recovery, once investment growth returnsto positive territory, the recovery gets newimpetus, because a virtuous circle of adjust-ments in the capital stock and in expectedmarket growth may easily generate double-digit advances in capital spending. However,
financial strains currently battering corporatesectors are likely to have a restraining effecton investment. Falling equity prices, concernsabout corporate debt, uncertainty about prof-itability, and cautious commercial bank lend-ing in high-income countries tend to curtailfinancing for investment. Moreover, currentbusiness uncertainty regarding future demandgrowth serves as an additional restrainingforce on capital spending. Reduced capitalflows to emerging markets place a damperon investments in the developing world. Ifone looks further ahead, large and increas-ing public sector deficits carry the potentialto “crowd out” private investment in high-income and developing countries alike, al-though low interest rates on governmentbonds show that such crowding out is not yeta problem.
—and driving forces for the initial phasecould be short-lived—Without a solid upswing in investment anda concomitant broadening of recovery, theforces driving the first phase of the rebound
G L O B A L E C O N O M I C P R O S P E C T S 2 0 0 3
10
Q11997
Q11998
Q11999
Q12000
Q12001
Q12002
Note: q/q refers to quarter over quarter. *Argentina, Brazil, Chile, Mexico, Czech Republic,Poland, Turkey, Indonesia, Rep. of Korea, Malaysia,Philippines, Thailand, and South Africa (45% ofdeveloping country total).Source: Datastream and World Bank staff estimates.
0
5
10
15
�10
�5
Figure 1.7 Investment recovery is stilluncertain(4-quarter moving average, percentage changeq/q, saar)
Developing countries*
Industrialcountries
Source: World Bank staff estimates.
0
10
5
20
15
30
25
35
45
40
50
1sthalf
2ndhalf
1999
1sthalf
2ndhalf
1sthalf
2ndhalf
1sthalf
2000 2001 2002
Figure 1.6 FDI flows to emerging Asiaare proving to be quite resilient
Net inflows of FDI by region
(billions of dollars, half yearly rate)
Emerging Europe
Latin America
Emerging Asia
gep_ch01.qxd 12/5/02 4:15 PM Page 10

could well become short-lived. Widening pub-lic sector shortfalls limit the range of optionsfor fiscal policy. As France, Germany, andItaly approach Maastricht limits; as the U.S.deficit widens; and as Japan remains encum-bered by continuing massive fiscal imbalance,opportunities for further fiscal stimulus in theindustrial world have indeed become quitescarce. Moreover, it appears that several otherdriving forces for the initial recovery couldquickly run out of momentum while theirstimulative properties dissipate. Official inter-est rates now standing at historically lowlevels (particularly in Japan and the UnitedStates) leave little prominent role for furthermonetary easing. And the inventory andhigh-tech cycles—typically of short duration—probably reached peak levels by mid-2002.
Japanese output growth is now largelygrounded in export growth, although con-sumers have begun to spend at more rapidrates—despite softening labor market condi-tions. Japan’s strong export performancestands at risk and could fade quickly shouldforeign demand conditions worsen, should theyen resume its appreciation against the dollar,or both. In the United States, considerable un-certainty is attached to the outlook for con-sumer spending. Following robust purchasesof durable goods during the third quarter—particularly automotive sales that were in-duced by zero interest incentives—questionsarise concerning the tenor of growth into thefinal quarter of the year. Incentives cannot con-tinue indefinitely, and massive equity-basedwealth losses of the past two years could playa larger role in households’ consumption deci-sions. Though low interest rates have spurredmortgage refinancings and “cash outs,” whichare anticipated to place some $100 billion to$200 billion of additional liquidity into thehands of consumers during 2002, this trendcould prove limited if the recovery falters seri-ously. U.S. business remains cautious in invest-ing or rehiring, in part because of the cloudedoutlook for growth in final demand. And inthe Euro Area, especially in Germany, domes-tic demand is lackluster, and near-term growth
appears to be dependent on (and exposed to)global demand and financial conditions.Growth was disappointing in the first half of2002, and expectations for only a sluggishadvance in output during the second half of theyear have now become more widespread.
—implying a much less supportiveexternal environment for developingcountriesAgainst this background—particularly thelack of a rebound in fixed investment acrossindustrial countries and the intensification offinancial uncertainties—the environment fordeveloping countries is much less favorable.International interest rates may remain low,but borrowing costs have risen in step with in-creases in interest rate spreads. Trade volumesand commodity prices may be on the rise, butthey are still at low levels, and momentum isweakening. Metal prices started to declineagain in the middle of 2002, adding to thedoubts about the strength of the global recov-ery. The further rise in agricultural prices wasmainly due to specific supply disruptions—ascivil strife in Côte d’Ivoire jeopardized cocoaproduction and as droughts in Australia,Canada, and the United States boosted wheatprices—and was not a sign of rising demand.Inflation remains low, but the danger ofoutright deflation has emerged in parts ofdeveloping and industrial East Asia—China,Hong Kong (China), Singapore, Taiwan(China), and Japan. Stable and low inflation isa prerequisite for solid growth and creates afavorable environment for effective monetarypolicy. However, in several cases, a sharp dropin inflation has increased real interest ratesand has worsened debt problems. Althoughdeflation limits the options for monetary pol-icy, it tends to depress investment and demandfor durable goods.
With market emphasis on financial strainsand risk perceptions, it is important not tolose sight of several brighter spots in thedeveloping world. Market reforms, includinga diminution of trade barriers and an open-ing up to foreign competition achieved in
T H E I N T E R N A T I O N A L E C O N O M Y A N D P R O S P E C T S F O R D E V E L O P I N G C O U N T R I E S
11
gep_ch01.qxd 12/5/02 4:15 PM Page 11

many countries during the 1990s, are note-worthy. These changes have contributed tofaster growth in trade and in welfare gains, andthe process continues across many countries.
China and several Central European countriesare examples of successful reforming econo-mies that are preparing for even further inte-gration into foreign markets. This integration
G L O B A L E C O N O M I C P R O S P E C T S 2 0 0 3
12
The recent global downturn has depressed exportgrowth across the developing world, leading to
a contraction in aggregate volume from the thirdquarter of 2001 through the first quarter of 2002.However, several countries—notably China, theCzech Republic, Hungary, and Poland—have beenable to record impressive export volume growth(box figure). They have done so by increasing theirmarket share, which has allowed them to partiallyoffset the dampening effect of the global downturn.This increase in market share, in turn, reflects acontinuing pattern of their intensifying integrationinto the global economy and of attendant inflowsof FDI.
Greater integration with world markets hasbeen achieved by China, for example, through itsrecently gained membership (December 2001) inthe WTO, after years of negotiations and efforts tocomply with WTO rules and standards. The threeCentral European countries have raised their trade
Box 1.2 Integration pays off where policies are supportive
integration with global markets largely through theEU accession process, association agreements, andlower trade barriers, which will culminate with fullmembership in the EU, which appears now on trackfor 2004.
Reduction of trade barriers is but one factorthat has made these countries successful and ableto take advantage of trade opportunities. Macrostability, rapid institutional reforms toward liberal-ization of domestic markets, good or adequatelevels of education, and competitive wages (relativeto productivity growth) all contribute to thesuccess.
These four countries have benefited fromstrong and sustained inflows of FDI from Westerninvestors that have been building productioncapacity and transferring management skills andtechnical know-how, in addition to financing, suchthat these countries can gain additional marketshare as integration deepens. FDI inflows help ex-pand production capacity and raise productivity(that is, they help to improve the recipient country’scompetitiveness). All four countries have postedhigh FDI inflows according to various measures.For example, using the ratio of the economy’s shareof world FDI inflows to the economy’s share ofworld GDP, China, the Czech Republic, Hungary,and Poland all posted ratios of above 1 (or the worldaverage) for 1998–2000—of 1.3, 2.7, 1.2, and 1.5,respectively. As a share of gross fixed capital forma-tion, FDI inflows to these countries have also beenhigh, particularly in China, where FDI inflows aver-aged 13 percent of gross fixed capital formation dur-ing 1990–99. In the Czech Republic, Hungary, andPoland, FDI inflows averaged 25, 19, and 16 per-cent, respectively, as a share of gross fixed capitalformation during 1997–99.
Source: World Bank staff.
40
�10
0
Jan.2000
Jul.2000
Jan.2001
Jul.2001
Jan.2002
Jul.2002
30
20
10
Note: y/y refers to year over year.Source: Datastream and World Bank staff estimates.
Several developing countriesshow solid export performance(volumes, 3-month moving average, percent y/y)
Other developing countries World
China
Eastern Europe
gep_ch01.qxd 12/5/02 4:15 PM Page 12

T H E I N T E R N A T I O N A L E C O N O M Y A N D P R O S P E C T S F O R D E V E L O P I N G C O U N T R I E S
13
not only pays off in the long run, but also hasassisted these countries in absorbing or evenavoiding short-term shocks and fluctuations,by promoting business confidence and by facil-itating export-oriented FDI. Perhaps moreimportant, through relatively large inflows ofFDI, these countries have become less vulner-able to turmoil in international financial mar-kets (box 1.2).
The medium-term outlook calls for modest growth in the global economy—third phaseThe baseline forecast reflects the interactionof strong opposing forces: the stimulativepolicies and the intrinsic recovery in stockbuilding and high-tech production that workto accelerate global growth on the one hand,and the financial strains—high and rising debtlevels, falling equity prices, and uncertaintyabout profitability—on the other hand. Thesedriving and restraining forces affect the out-look in three ways:
• Global growth in 2002, the initial yearof the forecast, shows little resemblanceto the uniform recovery that one wouldnormally expect after an almost synchro-nous downturn in 2001. Instead, it dis-plays quite diverse patterns of activityacross industrial as well as developingcountries.
• Growth in 2003–04 is anticipated to bemoderate. World GDP reflects a combi-nation of a more gradual recovery inLatin America, an emergence of modestgrowth in Japan, and a generally sub-dued rebound in other parts of the globaleconomy. The average outturn does notfollow the typically strong patterns ofrecovery and expansion that is concurrentacross regions and reinforced by accom-modating macro policies.
• Downside risks to the baseline forecastare substantial. The global recoveryappears vulnerable to additional shocks.(These points are discussed after wereview the external environment andoutlook for developing countries.)
The external environment is mixedThe driving forces may be found in expecta-tions for growth of global trade volumes:2.9 percent in 2002 and an average of 7.5 per-cent in the following two years (figure 1.8 andtable 1.2). The restraining forces make a sub-stantial rise in capital flows unlikely over themedium term. The modestly firming trends innon-oil commodities prices—5 percent in 2002and averaging 5.1 percent in the followingyears—reflect the subdued recovery. The 5 per-cent gains in commodity prices remain farbelow historical patterns during booms. In-creases in real commodity prices are expected
�21998 1999 2000 2001 2002 2003 2004
2
0
4
6
8
10
12
14
Source: IMF, OECD, World Bank, and World Bank projections.
Figure 1.8 World trade rebounds along with GDP, 1998–2004(percentage change)
World trade
Forecast
World GDP
gep_ch01.qxd 12/5/02 4:15 PM Page 13
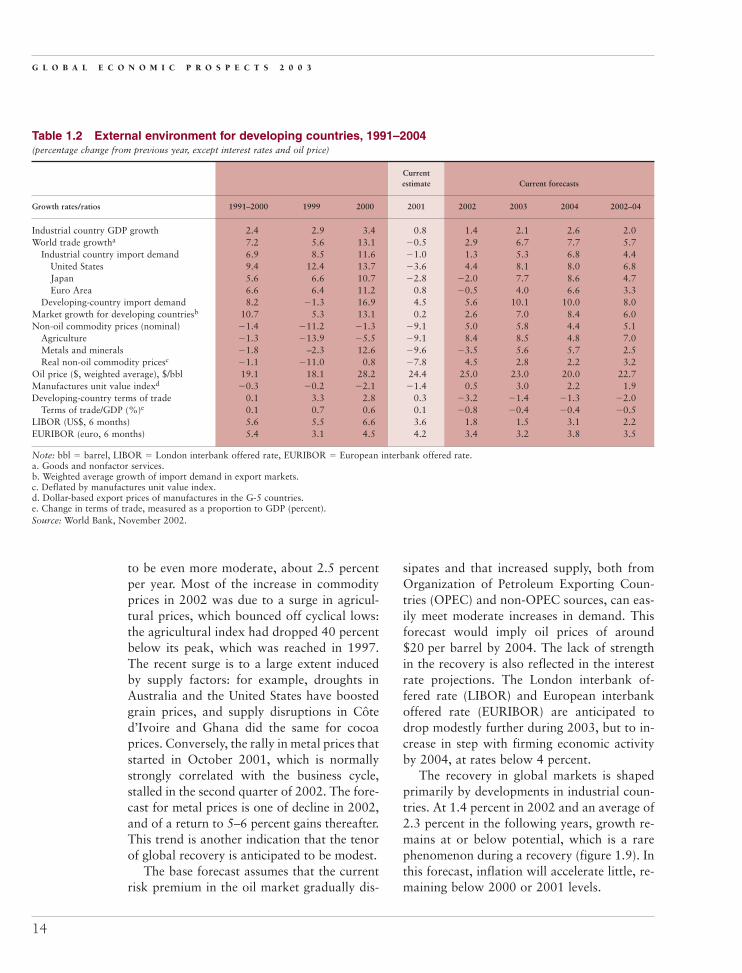
to be even more moderate, about 2.5 percentper year. Most of the increase in commodityprices in 2002 was due to a surge in agricul-tural prices, which bounced off cyclical lows:the agricultural index had dropped 40 percentbelow its peak, which was reached in 1997.The recent surge is to a large extent inducedby supply factors: for example, droughts inAustralia and the United States have boostedgrain prices, and supply disruptions in Côted’Ivoire and Ghana did the same for cocoaprices. Conversely, the rally in metal prices thatstarted in October 2001, which is normallystrongly correlated with the business cycle,stalled in the second quarter of 2002. The fore-cast for metal prices is one of decline in 2002,and of a return to 5–6 percent gains thereafter.This trend is another indication that the tenorof global recovery is anticipated to be modest.
The base forecast assumes that the currentrisk premium in the oil market gradually dis-
sipates and that increased supply, both fromOrganization of Petroleum Exporting Coun-tries (OPEC) and non-OPEC sources, can eas-ily meet moderate increases in demand. Thisforecast would imply oil prices of around$20 per barrel by 2004. The lack of strengthin the recovery is also reflected in the interestrate projections. The London interbank of-fered rate (LIBOR) and European interbankoffered rate (EURIBOR) are anticipated todrop modestly further during 2003, but to in-crease in step with firming economic activityby 2004, at rates below 4 percent.
The recovery in global markets is shapedprimarily by developments in industrial coun-tries. At 1.4 percent in 2002 and an average of2.3 percent in the following years, growth re-mains at or below potential, which is a rarephenomenon during a recovery (figure 1.9). Inthis forecast, inflation will accelerate little, re-maining below 2000 or 2001 levels.
G L O B A L E C O N O M I C P R O S P E C T S 2 0 0 3
14
Table 1.2 External environment for developing countries, 1991–2004 (percentage change from previous year, except interest rates and oil price)
Currentestimate Current forecasts
Growth rates/ratios 1991–2000 1999 2000 2001 2002 2003 2004 2002–04
Industrial country GDP growth 2.4 2.9 3.4 0.8 1.4 2.1 2.6 2.0World trade growtha 7.2 5.6 13.1 �0.5 2.9 6.7 7.7 5.7
Industrial country import demand 6.9 8.5 11.6 �1.0 1.3 5.3 6.8 4.4United States 9.4 12.4 13.7 �3.6 4.4 8.1 8.0 6.8Japan 5.6 6.6 10.7 �2.8 �2.0 7.7 8.6 4.7Euro Area 6.6 6.4 11.2 0.8 �0.5 4.0 6.6 3.3
Developing-country import demand 8.2 �1.3 16.9 4.5 5.6 10.1 10.0 8.0Market growth for developing countriesb 10.7 5.3 13.1 0.2 2.6 7.0 8.4 6.0Non-oil commodity prices (nominal) �1.4 �11.2 �1.3 �9.1 5.0 5.8 4.4 5.1
Agriculture �1.3 �13.9 �5.5 �9.1 8.4 8.5 4.8 7.0Metals and minerals �1.8 –2.3 12.6 �9.6 �3.5 5.6 5.7 2.5Real non-oil commodity pricesc �1.1 �11.0 0.8 �7.8 4.5 2.8 2.2 3.2
Oil price ($, weighted average), $/bbl 19.1 18.1 28.2 24.4 25.0 23.0 20.0 22.7Manufactures unit value indexd �0.3 �0.2 �2.1 �1.4 0.5 3.0 2.2 1.9Developing-country terms of trade 0.1 3.3 2.8 0.3 �3.2 �1.4 �1.3 �2.0
Terms of trade/GDP (%)e 0.1 0.7 0.6 0.1 �0.8 �0.4 �0.4 �0.5LIBOR (US$, 6 months) 5.6 5.5 6.6 3.6 1.8 1.5 3.1 2.2EURIBOR (euro, 6 months) 5.4 3.1 4.5 4.2 3.4 3.2 3.8 3.5
Note: bbl � barrel, LIBOR � London interbank offered rate, EURIBOR � European interbank offered rate. a. Goods and nonfactor services.b. Weighted average growth of import demand in export markets.c. Deflated by manufactures unit value index.d. Dollar-based export prices of manufactures in the G-5 countries.e. Change in terms of trade, measured as a proportion to GDP (percent).Source: World Bank, November 2002.
gep_ch01.qxd 12/5/02 4:15 PM Page 14

An outlook for moderate growth acrossdeveloping regions—What does this environment imply for outputgrowth in the developing countries? In 2002,a strong recovery in East Asia coincides with adisappointing performance in Latin America,where GDP declined by 1.1 percent (excludingArgentina, where GDP plummeted by nearly
12 percent, and growth in the region slowedfrom 1.2 percent in 2001 to 0.7 percent in2002). The region’s per capita income fell2.6 percent after a drop of 1.2 percent in 2001,which was the worst performance across twoyears since the debt crisis in the early 1980s(figure 1.10). Oil exporters, particularly inthe Middle East and North Africa (MENA),
T H E I N T E R N A T I O N A L E C O N O M Y A N D P R O S P E C T S F O R D E V E L O P I N G C O U N T R I E S
15
0
1
2
3
4
5
6
1998 1999 2000 2001 2002 2003 2004
Source: World Bank data and projections.
Figure 1.9 2002 marks the start of a moderate recovery(GDP growth rate in percent)
Forecast
World GDP
Industrial countries
Developing countries
East Asiaand Pacific
South Asia LatinAmerica and
the Caribbean
EasternEurope andCentral Asia
Middle Eastand North
Africa
Sub-SaharanAfrica
7
�2
�1
0
1
2
3
4
5
6
Source: World Bank projections.
Figure 1.10 LAC and MENA are not experiencing the recovery(developing countries GDP growth, percent change)
2004
2003
2001
2002
gep_ch01.qxd 12/5/02 4:15 PM Page 15

follow an independent growth pattern, which,to some extent, is the same for developingcountries that are rapidly integrating into for-eign markets (for example, Central Europeancountries, China, and Mexico), where exportswere recently able to outperform world tradegrowth as a whole (see box 1.2).
Average growth in 2002 for developingcountries is anticipated to be 2.8 percent,0.3 percentage points lower than was expectedin the February 2002 forecast and 0.8 per-centage points lower than was projected in theDecember 2001 forecast. Even with the bene-
fit of hindsight, it is quite difficult to disentan-gle the set of recent shocks and their effects ondeveloping countries. Yet the downward revi-sions do not contradict the assessment madein the fall of 2001 that adverse effects stem-ming from the terrorist attacks of September2001 would not be limited to the UnitedStates, but would spread to developing coun-tries as well (box 1.3).
Sharply different growth patterns are likelyto characterize economic activity across coun-tries and regions in the short run, as jitteryfinancial markets affect the vulnerable and
G L O B A L E C O N O M I C P R O S P E C T S 2 0 0 3
16
Shortly after the terrorist attacks of September 11,2001, the World Bank concluded that the eco-
nomic effects would be most severe in the UnitedStates but would be significant in developing coun-tries. The main transmission mechanisms werethought to be:
• Tourism revenues would decline, especially in SouthAsia, the Middle East, and the Caribbean.
• Increased risk perceptions in international marketswould make oil prices more volatile, foreign capitalless readily available, and transportation more costly.
• There would be delayed recovery in the United States,where immediately after the attacks air traffic wasconstrained, equity prices had declined sharply, andconsumer confidence had plummeted. That delaywould also hamper the recovery in world trade, com-modity prices, and financial flows.
Of the developing world, Latin America wasthought to be the hardest hit because of its proximityto the United States, its dependence on tourism rev-enues and commodity prices, and its vulnerabilityto financial shocks. Countries in Sub-Saharan Africawere also vulnerable because they have limitedoptions to absorb adverse shocks.
Even with the hindsight of a year, it still remainsquite difficult to assess the independent effect of 9/11on the global economic environment. Not only arethe counterfactuals unknown but new shocks, suchas the financial crisis in Argentina or the emergence
Box 1.3 The terrorist attacks of September 11, 2001had an economic effect
of accounting scandals in the United States, compli-cate the picture.
The fiscal stimulus and rapid monetary easingin the United States probably prevented a seriousdelay in the U.S. recovery and in world trade growth.Non-oil commodity price increases have slightly out-performed forecasts made in the fall of 2001. How-ever, the steep decline in tourism revenues and theincrease in risk perceptions did materialize, and theoutlook for developing countries has further deterio-rated, especially for Latin America. This observationsuggests that 9/11 did exert strong influence in shap-ing ensuing economic trends in developing countries,albeit reinforced by other factors.
Following continuous and robust growth overthe past decade, global tourism arrivals declinedby 0.6 percent in 2001, tied in large measure to theeffect of the terrorist attacks. The most-affecteddeveloping regions were South Asia (down 6 per-cent), Latin America (down 4 percent), and the Mid-dle East (down 3 percent).
Business and consumer confidence across theindustrial centers fell abruptly in the aftermath ofthe attacks. Although the losses evaporated within2 months as the recovery took shape, the tenor ofbusiness and financial market confidence has contin-ued to be exceptionally fragile (box figure). This fac-tor was one underlying the decline of capital marketflows to emerging market recipients in 2002, as wellas the rise in bond markets.
gep_ch01.qxd 12/5/02 4:15 PM Page 16

highly indebted developing countries moreseverely than countries with lower debt ratios.Though the forecasts for 2003—and espe-cially for 2004—display acceleration ofgrowth that tends toward more uniformityacross regions, that acceleration is weakerthan one would expect in a strong, synchro-nized global recovery.2
The forecast for Latin America and theCaribbean (LAC) assumes some rebound inArgentina, where output has fallen some20 percent below 1998 levels, but the reboundis insufficient to return to earlier prevailinglevels within the time horizon of this forecast.Modest growth rates are anticipated for Braziland most other countries of the region. Thatgrowth is grounded in a recovery in globaltrade and an end to the freefall in Argentina,
together with the pursuit of policies geared to-ward reducing financial strains. Mexico andsome Central American and Caribbean coun-tries are in position to benefit most from theexpected upswing in the United States, andMexico’s growth in particular is anticipated toexceed that of most Latin American countries.
—has the strongest growth evident in East Asia—Prospects for developing East Asia and Pacific(EAP) appear more buoyant than those forother regions, as growth is expected to reach6.4 percent by 2004. Continued solid expan-sion in China and recovery in most othercountries—albeit with growth rates that re-main below the robust performance of 2000—underpin this view. Favorable prospects do
T H E I N T E R N A T I O N A L E C O N O M Y A N D P R O S P E C T S F O R D E V E L O P I N G C O U N T R I E S
17
Developing countries’ GDP growth in 2002 hasbeen limited to 2.8 percent—about 0.8 percentagepoint below that expected one year ago (notably,figures that included an assessment of the 9/11 ef-fects). Although not all barriers to stronger growthare linked directly to the terrorist attacks, most of
Box 1.3 (continued)
these developments took form under the influence ofa global environment that was highly unsettled bythe destruction of the New York World TradeCenter.
Source: World Bank staff.
40
45
50
55
60 120
110
100
90
80
70Jan.2001
Jul.2002
Jul.2001
Oct.2002
Apr.2001
Apr.2002
Oct.2001
Jan.2002
Source: Institute for Supply Management and Conference Board, through Datastream.
U.S. confidence plummets(ISM and Conference Board business and consumer sentiment indices)
Consumer confidence
(right axis)ISM index(left axis)
gep_ch01.qxd 12/5/02 4:15 PM Page 17
not imply that risks are negligible, however.East Asia remains vulnerable to oil pricespikes, to uncertain demand conditions in theUnited States, and to the fragile state of theJapanese commercial banking system andgrowth prospects there. Moreover, the dy-namics in high-tech markets remain volatile.Options for domestic stimulus are more lim-ited than in previous years because in mostcountries fiscal deficits have widened and in-terest rates stand at low levels.
In Europe and Central Asia (ECA), growthis expected to remain strong, but it will begrounded in a highly differentiated outlookbetween the Central and Eastern European(CEE) group of countries and the hydrocarbonexporters that dominate growth trends in theCommonwealth of Independent States (CIS—Russian Federation, Kazakhstan, and severalsmaller states). For the former group, outputgrowth is projected to accelerate from 2.3 per-cent in 2002 to 3.1 percent and 4.3 percentin 2003 and 2004, respectively. Activity isexpected to be driven by increased importdemand from the EU and by intensificationof the EU’s accession process. For Turkey(included in this group), assuming that thereis relative political stability and that the newgovernment continues to pursue the current re-form path, recovery is expected to strengthenin 2003. In contrast, growth is anticipated toease in the CIS subregion in the years through2004 (through fiscal and trade linkages to thehydrocarbon exporters in particular), assum-ing a significant medium-term decline in theoil price. CIS GDP is anticipated to deceleratefrom 4.4 percent in 2002 to 3.5 percent and3 percent in 2003 and 2004. These divergenttrends combine to shape the path of growthfor the broader region, from 3.6 percent in2002 to an average of 3.5 percent in the yearsfollowing.
Growth in the Middle East and North Africa(MENA) region is expected to revive in2003–04 to average 3.6 percent, as hydrocar-bon output increases in line with global energydemand, and as accumulated oil-surplus fundsare progressively committed and expended on
infrastructure and other development activities,especially in Algeria, the Islamic Republic ofIran, and Saudi Arabia. Growth among the di-versified exporters should increase to an aver-age of 3.2 percent, as drought conditions easein Morocco and Tunisia and as fiscal deficitsare brought under tighter control and businessconfidence returns in Egypt—as the govern-ment there sets an appropriate interest rate andpushes ahead with policies, such as privatiza-tion, that will increase international investorconfidence. Risks to this outlook are substan-tial, however, with political tensions mountingduring apparent preparations for militaryaction in Iraq. At this juncture, the baselinedoes not explore these potential developments,but rather focuses on the country-specific andregion-specific economic fundamentals, as wellas global factors that contribute to shape theoutlook.
—and South AsiaA forecast of consistent growth in the SouthAsia region (SAR) of well above 5 percentover 2003–04 comes after a significant cycli-cal downturn in 2001, when manufacturingoutput in India and Pakistan stopped growingand when GDP growth mainly reflected con-tinued expansion in the service sectors. Themain challenge for the subcontinent remainsfiscal reforms to curb over-large governmentdeficits and to promote further trade liberal-ization. With almost-balanced current ac-counts and with substantial capital flows intoPakistan, external financial tensions remainlimited at present. But, it is expected that theeffects of accumulated fiscal debt will, at somefuture point become an obstacle to achievingthe acceleration in growth required for sub-stantial alleviation of poverty levels.
Growth in Sub-Saharan Africa (SSA) re-mains restrained by unfavorable domestic con-ditions, ranging from civil strife, to droughts,to macroeconomic imbalances, and to the AIDSepidemic. Elements of the external environ-ment should, however, provide some supportfor a modest acceleration of growth over thenext years. Despite a relatively sluggish pickup
G L O B A L E C O N O M I C P R O S P E C T S 2 0 0 3
18
gep_ch01.qxd 12/5/02 4:15 PM Page 18

in world GDP growth in 2003–04, a robustrecovery is anticipated for African trade vol-umes, ratcheting from growth of 3 percent in2001 toward 6 percent by 2004. That recov-ery should be accompanied by generallyfirmer non-oil commodity prices (exceptionsare cocoa and gold, where prices have surgedto unsustainable levels). The resulting terms oftrade gains should support relatively buoyantexternal performances by African non-oil ex-porters. For oil exporters of the region, theprice of crude is expected to weaken in themedium term. Even so, oil sectors will remainprofitable, and production and export vol-umes are anticipated to rise—from Nigeriaand other producers in the Gulf of Guinea, aswell as from Angola’s offshore sector.
In the domestic sphere, agricultural pro-duction will benefit from a return to morenormal weather patterns in southern Africa,thus contributing to a recovery of domesticoutput and expenditure. On balance, GDPgrowth for the region is expected to rise from2.5 percent in 2002 to 3.2 percent in 2003 and3.8 by 2004. The overall acceleration reflectsgains by non-oil exporters, which will morethan offset modest retrenchment by oil pro-ducers. The current projection for the regionrepresents a slight deterioration of prospectscompared with the spring 2002 forecast,which is consistent with the overall down-grading of expectations for world output andtrade growth. Nevertheless, though perfor-mance will continue to lag behind other devel-oping regions, per capita incomes are set toresume positive growth following several yearsof stagnation.
Risks to the base case are substantial The world recovery is clouded by substantialuncertainties in the immediate to near term.These uncertainties carry with them implica-tions for medium-term developments in globalgrowth and financial flows. Among criticalfactors in the outlook are (a) continued finan-cial turbulence in high-income countries thatcould jeopardize a rebound in investment;(b) a reversal in capital flows to emerging
markets, thereby heightening tensions in sev-eral vulnerable middle-income countries; and(c) the risk of higher oil prices, which are as-sociated with prospective developments in theMiddle East.
The base case presents a moderate butsteady recovery in investment; it effectivelyrules out financial crises in middle-incomecountries and foresees a gradual decline in oilprices. If downside risks materialize, adverseoutturns in these domains could easily occurat the same time or could, in sequence, rein-force cumulative effects on the economy. Togauge the sensitivity of economic recovery tothese risks, we have traced the possible effectson the economic outlook of these elements.The results underscore the set of tensions em-bedded in the base-case forecast and can illu-minate the magnitude of potential downsiderisk to the projections—with particular focuson the implications for developing countries.3
Global recovery could be delayed until 2004Table 1.3 outlines the global effects of a low-case scenario in which the risks highlightedabove occur essentially at the same time, buteach of the adverse shocks is fairly short lived.The scenario reflects the joint effects of atemporary relapse to negative growth in theindustrial country’s investment cycle, of short-lived financial disruptions in several middle-income countries, and of a momentary spiketo $45 per barrel (bbl) in world oil prices. Thescenario suggests that, rather than an acceler-ation of global growth in 2003 to 2.5 percentas in the base case, a continuation of sluggishoutput advance in a range of 1.9 percent couldcharacterize the year. Contrasted with base-case forecasts, cumulative differences over2003–04 in world trade growth, OECD infla-tion, and interest rates are fairly substantial.The latter element reflects a strong monetarypolicy response to the financial and real dis-turbances of the scenario. OECD outputgrowth is dampened by 1 percentage point,and for developing countries, it is dampenedby 0.8 point over the period (figure 1.11).
T H E I N T E R N A T I O N A L E C O N O M Y A N D P R O S P E C T S F O R D E V E L O P I N G C O U N T R I E S
19
gep_ch01.qxd 12/5/02 4:15 PM Page 19

Among industrial countries, growth pro-files in the United States and Japan are moreadversely affected. This is linked to the relapseof fixed investment spending during 2003,with less room for monetary easing than existsin the Euro Area. Among developing regions,Latin America will feel the initial brunt ofdiminished capital inflow during 2003 (growth
falling substantially below baseline), but itwill rebound with some vigor as conditionsequilibrate in 2004. East Asia—with stronglinks to export markets in all three industrialcenters—will also suffer a sharp falloff ingrowth, but less so than Latin America.
Initially, inflation increases slightly in reac-tion to the rise in oil price. However, when oilprices start falling again and the effect oflower growth becomes noticeable, inflationwill drop in high-income countries, therebytriggering substantial monetary easing com-pared with the baseline. In developing coun-tries, inflation will remain on average aboveits base-case level, as higher oil prices are com-plemented by devaluation of several curren-cies in reaction to financial tensions.
Table 1.4 breaks out for 2003 the contri-butions of the individual risk scenarios (out-lined below) to the overall low-case simula-tion. A relapse of investment in the industrialcountries carries the largest downside poten-tial to the global outlook, which affects outputgrowth, world trade, and interest rates mostacutely. Developing-country growth is moreaffected under the restraint of capital flowscenario, but is equally diminished by devel-opments under the G-7 investment scenarioand by higher oil prices. The latter scenario
G L O B A L E C O N O M I C P R O S P E C T S 2 0 0 3
20
Table 1.3 Global effects in a low-case scenario, 2003–04
2003 2004 2003–04
Scenario Diff. (base) Scenario Diff. (base) Cum. diff.
GDP growth (%)World 1.9 �0.6 2.7 �0.4 �1.0
Industrial countries (OECD) 1.5 �0.6 2.2 �0.4 �1.0Developing countries 3.0 �0.9 4.8 0.1 �0.8
Consumer price index inflation (%)Industrial countries 2.2 0.1 1.2 �0.6 �0.5Developing countries (median) 5.0 0.6 4.4 0.0 0.6
Short-term interest rates (%)Industrial countries 2.9 �0.3 3.3 �0.8 �1.1
Trade volumes (%)OECD imports 5.5 �1.3 7.5 �0.4 �1.7Developing-country exports 9.3 �1.0 9.2 �0.3 �1.3
Source: World Bank, November 2002.
�2.0
�1.5
�1.0
�0.5
0.0
Source: World Bank.
�1.7
�1.1
�0.5
�1.0
�0.8
Figure 1.11 Low case: world trade andother indicators will be much lower thanthe baseline(cumulative differences, 2003–04; low-case scenarioversus base-case scenario, percent)
Developing-countrygrowth
OECDgrowth
OECDinflation
Interestrates
Worldtrade
gep_ch01.qxd 12/5/02 4:15 PM Page 20

prospectively could hamper a fuller easing ofmonetary policy across the industrial centers,with growth suffering commensurately.
Financial market turbulence in high-income countries could trigger a relapse in the investment cycle—Though investment growth momentum is nowbuilding in selected sectors and countries, thepotential for relapse looms large as imbal-ances and uncertainties remain acute through-out the industrial world. The low-case sce-nario assumes that the growth of real businessinvestment in industrial countries drops tonegative territory (�0.7 percent) during 2003,which would be 3.5 percentage points ofgrowth below the baseline path. Spilloversinto 2004 carry cumulative growth differencesin capital spending to 6.5 percentage points(figure 1.12).
If one examines the scenario environmentamong the industrial countries, cumulativeinflation over 2003–04 is reduced by 0.5 per-cent. At the same time, the profile of short-term interest rates reflects reductions that aremore than the improvement in inflation per-formance, which represents a substantialeasing of monetary policy in the wake of de-velopments. The rate of unemployment risesby 0.4 percentage points in OECD countries.Among prominent growth effects, industrialcountry output gains are dampened by
0.4 percent in 2003 and by a further 0.3 per-cent during 2004, as multiplier effects placepressure on household consumption. Withthe compression of imports, adverse growtheffects in the major industrial countries aretransmitted to smaller advanced economies,while weakened demand for commoditiesplaces downward pressure on nonenergyprices, thus affecting developing countries’terms of trade adversely. On balance, GDPgrowth in developing countries will declineby 0.3 percentage points relative to the basefigures during 2003–04.
T H E I N T E R N A T I O N A L E C O N O M Y A N D P R O S P E C T S F O R D E V E L O P I N G C O U N T R I E S
21
Table 1.4 Low case: contributions to global effects in 2003
Total Diff. (base) Investment Capital flows Oil prices
GDP growthWorld 1.9 –0.6 –0.3 –0.1 –0.2
Industrial countries (OECD) 1.5 –0.6 –0.3 –0.1 –0.2Developing countries 3.0 –0.9 –0.2 –0.5 –0.2
Consumer price index inflation (%)Industrial countries 2.2 0.1 –0.1 0.0 0.2Developing countries (median) 5.0 0.6 –0.1 0.1 0.6
Short-term interest rates 2.9 –0.3 –0.3 –0.1 0.1
World trade 5.8 –1.3 –0.9 –0.1 –0.3OECD imports 5.5 –1.3 –1.0 0.0 –0.3Developing exports 9.3 –1.0 –0.6 –0.2 –0.2
Source: World Bank, November 2002.
Q4 2000
Q22001
Q42001
Q22002
Q42002
Q22003
Q42003
Q22004
Q42004
Source: National statistics; World Bank projections.
�10
0
�5
5
Figure 1.12 G-7 investment falls sharply(base-case scenario and low-case scenarios, volumegrowth, percent saar)
Base-casescenario
Low-casescenario
gep_ch01.qxd 12/5/02 4:16 PM Page 21

—while financial tensions pose difficultiesfor emerging markets—Under a scenario of substantially lower in-flows of private capital into countries withweak or declining credit ratings and with largefinancing requirements, interest rates rise, ex-change rates depreciate, or both, which raisesthe cost of servicing debt and results in diffi-culties in meeting debt payments for both thepublic and private sectors. To understand thepossible implications of such development, weperformed a simulation in which capital flowsto selected emerging market countries wereassumed to drop by 15 percent below thebaseline forecast in 2003, while spreads on in-ternational debt would increase substantially.
With these assumptions, the Latin Americaregion will suffer an average falloff in outputgrowth of 1.9 percentage points comparedwith the baseline in 2003. Rebound in re-sponse to eventual equilibration in exchangeand interest rates, as well as to falling riskspreads, should be grounded in stronger ex-ports, and output growth rises some 0.9 per-centage point above the base in 2004. Thecumulative fall in regional growth amountsto 1.1 percentage points during 2003–04. Thisfall is a reflection of the strong dependenceof Latin America on capital inflows, whereasreversals in capital flows tend to have far-reaching consequences for domestic economiesin that region (figure 1.13). Central Europe isanother region that is affected by the reversalin international capital flows, although thegreater diversity within the region makes theoverall effect smaller than for Latin America.
—and higher oil prices could temporarily(yet moderately) dampen recoveryCrude oil prices have risen to more than$29/bbl because of expectations of a supplydisruption in Iraq and of increasingly tightermarket fundamental conditions. Crude oilstocks fell sharply in the third quarter of 2002,particularly in the United States. The drop wasdue to high runs of refined products, a declinein Iraqi crude exports, and continued restraintby OPEC to limit exports in support of higher
prices. A so-called war premium on prices hasbeen estimated at up to $8–$9/bbl. The basecase assumes that the oil market normalizeswith further increases in non-OPEC supply,with a modest rise in OPEC quota, and witha dissipating of the war premium. These as-sumptions might turn out to be too optimistic.
With continued tensions in the Middle Eastand with the possibility that, for example,some 2 million barrels per day (mb/d) of Iraqioil exports would be temporarily lost to themarket, oil prices might rise well above$30/bbl—partly because of low stocks andtight market conditions—and might peak at$45/bbl during the height of the disruption.However, it is likely that any loss in supplywill eventually be replaced by other OPECproducers. They currently have about 5 mil-lion barrels per day (mb/d) of spare capacity—of which Saudi Arabia alone has some 3mb/d.Or supply will otherwise be replenished. Pricescould fall relatively quickly below $20/bbl by2004 before OPEC begins to restrain output asworld demand increases, as the organizationattempts to bring prices back into its targetprice band of $22–$28/bbl (figure 1.14).
G L O B A L E C O N O M I C P R O S P E C T S 2 0 0 3
22
Q11994
Q11995
Q11996
Q11997
Q11998
Q11999
Q12000
Q12001
Q12002
*Net capital flows defined as CAD—addition toreserves-IMF funds.Source: Datastream and World Bank staff estimates.
0
1
2
3
4
5
6
7
�20
�15
�10
�5
5
0
10
15
20
25
Figure 1.13 Investment growth and netcapital flows* into Latin America arestrongly correlated(4-quarter movingaverage, percent GDP)
Investment
Net capital flows*as percent of GDP
(4-quarter movingaverage, percent saar)
gep_ch01.qxd 12/5/02 4:16 PM Page 22

On a cumulative basis, a $2.50/bbl increasein oil price above baseline levels (but with dy-namics as outlined above) will yield a moder-ate fall in global growth of 0.1 percent during2003–04. Effects during 2003 will be some-what more pronounced, however: a drop inworld output of 0.2 percentage points. Infla-tion and interest rates in the industrial coun-tries will be boosted modestly, by some0.2 and 0.1 percentage points, respectively.
Investment cycles in developingcountries
For developing countries, the risk of anuntimely interruption to the recovery in
global investment comes after a period of sharpswings in investment in the past five years.During the East Asian crisis, investment fell atan annual rate of 30 percent, three times thefall in output (figure 1.15). Crises in Argentinaand Turkey dominated recent developments inLatin America and Central Europe, respec-tively, with regional investment declining atannual rates of 15–20 percent (figures 1.16 and1.17). The dynamics of investment are muchmore forceful than that of output.4
This section looks at three importantpatterns:
• The volatility of investment, relative tothe volatility of output, and compar-
isons of developing with high-incomecountries.
• The effects of improvements in the in-vestment climate on the volatility ofinvestment and output.
• The role of capital flows that influence theinvestment cycle in developing countries.
T H E I N T E R N A T I O N A L E C O N O M Y A N D P R O S P E C T S F O R D E V E L O P I N G C O U N T R I E S
23
18.0
22.5
27.0
31.5
36.0
Q42000
Q22001
Q42001
Q22002
Q42002
Q22003
Q42003
Q22004
Q42004
Source: World Bank data; World Bank projections.
Figure 1.14 Oil prices spike(base-case and low-case scenarios; oil price $/bbl)
Base-casescenario
Low-casescenario
Q11997
Q11998
Q11999
Q12000
Q12001
Q12002
Note: Indonesia, Rep. of Korea, Malaysia, Philippines,and Thailand.Source: Datastream and World Bank staff estimates.
(4-month moving average, percentage change q/q, saar)
Figure 1.15 Investment is more volatilethan GDP in East Asia
�30
�40
�10
�20
0
10
20
30Investment
GDP
Q11997
Q11998
Q11999
Q12000
Q12001
Q12002
Note: Argentina, Brazil, Chile, and Mexico.Source: Datastream and World Bank staff estimates.
Figure 1.16 Investment is more volatilethan GDP in Latin America(4-month moving average, percentage change q/q, saar)
GDP
Investment
�10
�15
0
�5
5
10
15
20
gep_ch01.qxd 12/5/02 4:16 PM Page 23

Investment cycles are more pronounced in lower-income countries than in higher-income countriesThe volatility of investment growth relative tothe volatility of output growth is twice as largein low-income countries as in high-incomeeconomies—and volatility has increased overtime (table 1.5). An understanding of the in-vestment cycle is pivotal to the explanationof overall cyclical behavior in developingcountries.
A similar picture emerges if one examines adifferent measure of the cyclical component ofinvestment, namely the percentage deviationfrom trend.5 Figure 1.18 displays the meanand standard deviation of that measure
for some 160 countries over the 1990–2000period.6 The volatility of the cyclical compo-nents of investment declines steeply withhigher income per capita.
Explanations for the high volatility of in-vestment in low- and middle-income countrieswill vary from large external shocks relative tothe size of the country to a poor investmentclimate. Properly functioning domestic finan-cial institutions may smooth cycles by allow-ing additional savings to be channeled toinvestors during downturns.
Poor countries, on average, tend to be rela-tively small economies. Thus, the GDP of anaverage low-income country during the 1990swas $25.6 billion, barely 2.5 percent of theaverage high-income country. Baxter andCrucini (1993) and Crucini (1997) argue that,as a result, external shocks are relatively largein proportion to GDP, which explains reason-ably well the patterns observed in figure 1.18.For example, international capital flows caneasily be much larger from the standpoint ofa small country, and reversals in capital flowscan have a relatively large effect. The decisionby a French multinational to invest $100 mil-lion in Senegal instead of at home would re-duce France’s investment spending in 2000 by
G L O B A L E C O N O M I C P R O S P E C T S 2 0 0 3
24
Q11997
Q11998
Q11999
Q12000
Q12001
Q12002
Note: Czech Republic, Poland, and Turkey.Source: Datastream and World Bank staff estimates.
�30
�15
0
15
30
45
Figure 1.17 Central Europe and Turkeyexperience greater volatility ininvestment than in GDP(4-month moving average, percentage change q/q, saar)
GDP
Investment
Table 1.5 Relative volatility of investmentis high in developing countries
1971–80 1981–90 1991–2000
Low income 4.6 5.2 7.6Middle income 4.9 3.6 4.5High-income OECD 2.9 3.2 3.5
Note: This table presents unweighted averages of country-specific standard deviations of investment growth as a ratioto the unweighted average of standard deviations of GDPgrowth.Source: World Bank.
0
0.05
0.10
0.15
0.20
High incomeOECD
High incomenon-OECD
Middleincome
Lowincome
Note: Investment volatility is defined as the standarddeviation of the deviation from (HP filtered) trend.Source: World Bank staff estimates.
Figure 1.18 Investment volatility declineswith income(mean and standard deviation of volatility of investment)
MeanStandard deviation
gep_ch01.qxd 12/5/02 4:16 PM Page 24

just 0.04 percent, but it would raise Senegal’sinvestment by 11.5 percent. The effects onthe two economies of such a decision wouldbe disproportionate. Similarly, idiosyncraticshocks—economic, weather-related, or thereflection of civil strife—have a relatively largeeffect on smaller countries. Low levels of de-velopment and small size will tend to implyless diversification in the output and exportmix but stronger dependence on commodityprices, so that poor countries’ terms of tradewill tend to be more volatile than those ofOECD countries.
Improvements in the investment climatecan reduce volatilityThe quality of the investment climate, exten-sively discussed in the following chapters ofthis report, appears to be highly correlated withinvestment volatility. If one examines theinvestment climate, several candidates areavailable to proxy for this environment, all ofwhich correlate highly with one another. Fig-ure 1.19 is based on the quality of governanceindicators compiled by Kaufmann, Kraay,and Zoido-Lobatón (2002), which have theadvantage of comprehensiveness. Six sub-indexes attempt to capture various dimensionsof policy and institutional quality. An un-weighted average of all six is identified inthe figure as “All.” Meanwhile, two of thesubcomponents seem especially pertinent tomeasuring the investment climate: “regulatoryburden,” which reflects the incidence of marketfriendly policies, and “rule of law,” which mea-sures respect for society’s rules. “Regulation”consists of the first of these, while “Regulationand Law” is an average of the two. All threeindexes show a similar pattern of decliningvolatility as the policy environment improves,suggesting the finding is robust.
One concern about the evidence presentedin figure 1.19 is that all three indexes correlatevery highly with income.7 However, in regres-sions that explain volatility with both incomeand governance as explanatory variables, thecoefficient for governance tends to be moresignificant than is the coefficient for income.
The independent effect of governance onvolatility can be shown in a different way.Figure 1.20 repeats the analysis, but it correctsfor the possible influence of income by first re-gressing the governance index on income andthen examining the relationship between thevolatility of investment cycles and the residuals
T H E I N T E R N A T I O N A L E C O N O M Y A N D P R O S P E C T S F O R D E V E L O P I N G C O U N T R I E S
25
Source: World Bank staff estimates using governanceindicators developed by Kaufmann, Kraay, andZoido-Lobatón (2000).
Figure 1.19 A better investment climatereduces volatility of investment cycles(standard deviation of cyclical component of investment)
0.0
0.1
0.2
0.3
0.4
4th quartile3rd quartile2nd quartile1st quartile
Bad GoodGovernance
Regulation
All Regulation and law
Source: World Bank staff estimates using governanceindicators developed by Kaufmann, Kraay, andZoido-Lobatón (2000).
4thquartile
3rdquartile
2ndquartile
1stquartile
0.00
0.05
0.10
0.15
0.20
0.25
Figure 1.20 Impact of policy climate oninvestment volatility after correcting forincome remains strong(standard deviation of cyclical component of investment)
Bad GoodGovernance
gep_ch01.qxd 12/5/02 4:16 PM Page 25

from this regression (that is, in relation to thatpart of the governance indicator that is notcorrelated with income). Investment volatil-ity continues to fall with a better investmentclimate.
International net capital inflows are pro-cyclical, both in developing and high-income countries—Because investment cycles are more pro-nounced than output cycles, investment as ashare of GDP tends to rise during a boom andto decline during a downturn. For countries atall income levels, financing of the increase inthe investment ratio during a boom comesfrom both domestic and foreign sources. Dur-ing an upturn, domestic savings rates normallybuild, while current accounts deteriorate(table 1.6). In other words, foreign investorsturn away during downturns, while domesticconsumers reduce their savings and increasetheir consumption as a share of income.Clearly, procyclical capital flows do not pre-vent consumers from absorbing shocks bysmoothing consumption over time (box 1.4).
—but capital flows tend to triggerdomestic cycles in middle-incomecountriesBoth “push” and “pull” factors are respon-sible for the procyclical nature of capitalinflows. In a downturn, demand for invest-ment financing is reduced as firms postponeinvestment plans and reduce capital stocks(the pull factor). At the same time, financialinvestors look for less risky or risk-free invest-ments and show little appetite to invest incountries and sectors that suffer from declin-ing growth and profit rates (the push factor).For developing countries, the push factorshave often been emphasized as a major chal-lenge. Sharp increases in external finance fre-quently preceded severe crises (such as inMexico, East Asia, and Turkey), which weretriggered by sudden reversals of these flows.The dynamics of net capital inflows and thechanges of official reserves over the cycle doindeed indicate that the push factor is moreimportant for middle-income countries, whilethe pull factor dominates in high-incomecountries. Net foreign capital inflows actuallylead the domestic investment cycle in middle-income countries, while they lag the cycle inhigh-income countries. For example, one-year-lagged capital inflows are correlated with in-vestment by 0.27 in middle-income countries,compared with a correlation of only 0.08 forhigh-income countries. In middle-incomecountries, one-year-lagged capital inflows areas strongly correlated with the domestic in-vestment cycle as they are with contempora-neous capital inflows (table 1.7). In high-income countries, a one-year lead in capitalinflows is, by contrast, as strongly correlated
G L O B A L E C O N O M I C P R O S P E C T S 2 0 0 3
26
Table 1.6 Upturns can be financed abroadand domestically
Correlation of cyclical High investment components Low Middle incomewith changes in … income income OECD
Current account (as % of GDP) �0.21 �0.39 �0.43
Domestic savings (as % of GDP) 0.16 0.16 0.45
Note: The table shows unweighted averages of correlationcoefficients of variables in individual countries.Source: World Bank.
Table 1.7 Capital inflows lead investment in middle-income countries: correlation betweeninvestment ratios and (past or future) capital flows
2-year lag 1-year lag No lag or lead 1-year lead 2-year lead
Net capital inflowsLow income �0.09 0.09 0.21 0.07 �0.01Middle income 0.13 0.27 0.35 0.10 �0.11High income (OECD) �0.20 0.08 0.32 0.35 0.25
Source: World Bank staff estimates.
gep_ch01.qxd 12/5/02 4:16 PM Page 26

with the domestic investment cycle as withcontemporaneous capital inflows.
The picture of capital inflows being a pushfactor for middle-income countries is strength-ened when one considers the behavior of
official reserves. Some of the foreign capitalinflow that precedes a domestic investmentboom in middle-income countries is temporar-ily accumulated as foreign reserves, while cap-ital outflows that precede a domestic bust are
T H E I N T E R N A T I O N A L E C O N O M Y A N D P R O S P E C T S F O R D E V E L O P I N G C O U N T R I E S
27
In all country groupings, the savings rate is posi-tively (or the consumption rate is negatively) corre-
lated with GDP growth in the short run (see boxfigure). The correlation is relatively weak fordeveloping countries, but that weakness is mainlybecause GDP is an inaccurate measure of income inthe presence of terms-of-trade shocks. Real growthof gross national income (GNI), which includesterms-of-trade gains and losses, is much morevolatile than growth of real GDP in developingcountries. In industrial, high-income countries, theterms of trade have a much smaller effect (see boxtable). The correlation between the savings rate andreal growth of GNI is decisively more similar acrosscountries.
The strong evidence of consumption smoothingin low- and middle-income countries is remarkable,because the conditions in such countries for absorb-
Box 1.4 Consumption in low- and middle-incomecountries is smoothed over the business cycle
ing fluctuations in income are less favorable than inhigh-income countries. First, domestic credit marketstend to function less smoothly, and access to interna-tional capital markets is more difficult than in high-income countries. Second, as far as fluctuations inincome are caused by terms-of-trade shocks, thesmoothing of consumption over time is less attractivethan in the case of volume shocks, which prevail inhigh-income countries. If, for example, import pricesfall, the decline in price amounts to a rise in income,which could trigger an increase in the savings rate.However, a temporary price fall implies a futureprice rise, making future spending of current savingsless attractive. In the case of a temporary rise in thevolume of income, it is more appealing to save nowand spend later, when income is back at a lowerlevel.
Despite these impediments, developing countries’consumption is being smoothed over the businesscycle, providing relief for consumers and supportingdomestic financing of procyclical investment ratios.
Source: World Bank staff.
Relative and increasing vulnerability of low-, middle-, and high-income countries toterms-of-trade shocks
Source: World Bank staff estimates.
�0.6
�0.5
�0.4
�0.3
�0.2
�0.1
0
GDP growth
High incomeOECD
High incomenon-OECD
Middleincome
Lowincome
Consumption smoothing is strongest inhigh-income countries(correlation of change in average propensity to consumeand GDP growth)
Income growth
1971–80 1981–90 1991–2000
Low income 2.1 2.2 2.8Middle income 1.9 1.8 2.2High income (non-OECD) 2.8 1.5 1.5
High income (OECD) 1.4 1.3 1.3
Note: Standard deviation of national income growth/standarddeviation of GDP growth.Source: World Bank data.
gep_ch01.qxd 12/5/02 4:16 PM Page 27

temporarily absorbed by reductions in officialforeign exchange reserves.
In low-income countries, capital inflowsare also procyclical, but the correlation withthe domestic cycle is less significant. Theweaker correlation reflects the specific charac-ter of these flows—official aid and FDI are lesscyclical—and also the dependence of thosecountries on commodity prices. Part of the fi-nancing for investment booms comes not fromforeign borrowing, but from increased exportrevenues as a result of terms-of-trade gains.Similarly, investment busts are not necessarilydriven by a reversal of capital flows, but theycan originate from terms-of-trade losses.
On the basis of these relationships, it ap-pears that cycles are still a prominent featureof macroeconomic developments, which iseven more important in developing countriesthan in industrial countries, and cycles weremore pronounced during the 1990s than dur-ing earlier decades. Investment swings arefinanced both domestically and abroad, whichmakes current account deficits and capitalinflows strongly procyclical. A major differ-ence between developing countries and high-income countries is that middle-incomecountries are more exposed to independentreversals in capital flows, while capital flowsare more accommodating in high-incomecountries, and the cyclical dynamics in low-income countries are to a significant extentinfluenced by terms-of-trade shocks andidiosyncratic disturbances.
Growth and poverty to 2015:coming changes in savings andinvestment patterns
After an impressive wave of market re-forms and increased openness in develop-
ing countries during the 1990s—both ofwhich prompted acceleration of technologicalprogress and brought about a more stablemacroeconomic environment—long-term eco-nomic growth prospects for developing coun-tries are relatively optimistic. If the projectionscome to pass, growth patterns could lead to a
significant reduction of poverty. Thus, the mil-lennium development goal of halving povertyby 2015 could be reached on a global level,although growth will be insufficient to achievepoverty targets in all regions. At the sametime, financial imbalances and volatility ininternational capital flows continue to jeopar-dize uninterrupted growth. Vulnerable coun-tries will benefit from further debt reductionin their pursuit of sustained high growth.
The acceleration of growth in developingcountries is expected to coincide with in-creases in investment ratios. Saving rates arealso expected to increase, driven particularlyby a declining proportion of youths and bythe need for adults to save for retirement. Op-posite movements are expected in industrialcountries, where aging is bound to reducesavings rates and where a sharp decline inpopulation growth will suppress investmentratios.
The long-term forecast suggests that, on bal-ance, net inward capital flows toward develop-ing countries could well decline, though grossflows will continue to play an important role inenhancing growth potential. These changes inglobal savings and investment behavior raisequestions about the critical role of financialintegration and the need for improvements ininternational financial intermediation.
Long-run per capita growth is expected to accelerate—Developing-country growth, on a per capitabasis, is projected to more than double duringthe 10-year period from 2005 to 2015 whencompared with the performance of the 1990s(table 1.8). This projection reflects substan-tially improved growth prospects for Europeand Central Asia—leaving behind sharp con-tractions that characterized the transition tomarket economies during the 1990s—and forSub-Saharan Africa. For Africa, the scenario ispredicated as a continuation of broad trendstoward better governance and economic poli-cies, of progress toward resolving conflicts anddiversification away from agriculture, and ofexport dependence on primary commodities.
G L O B A L E C O N O M I C P R O S P E C T S 2 0 0 3
28
gep_ch01.qxd 12/5/02 4:16 PM Page 28
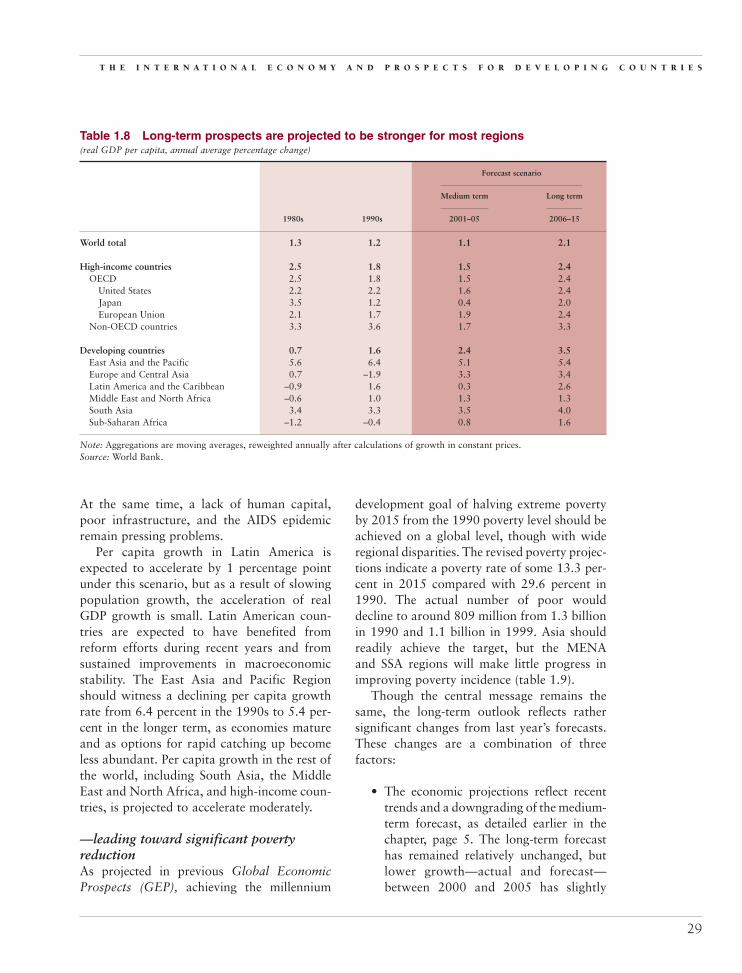
At the same time, a lack of human capital,poor infrastructure, and the AIDS epidemicremain pressing problems.
Per capita growth in Latin America isexpected to accelerate by 1 percentage pointunder this scenario, but as a result of slowingpopulation growth, the acceleration of realGDP growth is small. Latin American coun-tries are expected to have benefited fromreform efforts during recent years and fromsustained improvements in macroeconomicstability. The East Asia and Pacific Regionshould witness a declining per capita growthrate from 6.4 percent in the 1990s to 5.4 per-cent in the longer term, as economies matureand as options for rapid catching up becomeless abundant. Per capita growth in the rest ofthe world, including South Asia, the MiddleEast and North Africa, and high-income coun-tries, is projected to accelerate moderately.
—leading toward significant povertyreductionAs projected in previous Global EconomicProspects (GEP), achieving the millennium
development goal of halving extreme povertyby 2015 from the 1990 poverty level should beachieved on a global level, though with wideregional disparities. The revised poverty projec-tions indicate a poverty rate of some 13.3 per-cent in 2015 compared with 29.6 percent in1990. The actual number of poor woulddecline to around 809 million from 1.3 billionin 1990 and 1.1 billion in 1999. Asia shouldreadily achieve the target, but the MENAand SSA regions will make little progress inimproving poverty incidence (table 1.9).
Though the central message remains thesame, the long-term outlook reflects rathersignificant changes from last year’s forecasts.These changes are a combination of threefactors:
• The economic projections reflect recenttrends and a downgrading of the medium-term forecast, as detailed earlier in thechapter, page 5. The long-term forecasthas remained relatively unchanged, butlower growth—actual and forecast—between 2000 and 2005 has slightly
T H E I N T E R N A T I O N A L E C O N O M Y A N D P R O S P E C T S F O R D E V E L O P I N G C O U N T R I E S
29
Table 1.8 Long-term prospects are projected to be stronger for most regions (real GDP per capita, annual average percentage change)
Forecast scenario
Medium term Long term
1980s 1990s 2001–05 2006–15
World total 1.3 1.2 1.1 2.1
High-income countries 2.5 1.8 1.5 2.4OECD 2.5 1.8 1.5 2.4
United States 2.2 2.2 1.6 2.4Japan 3.5 1.2 0.4 2.0European Union 2.1 1.7 1.9 2.4
Non-OECD countries 3.3 3.6 1.7 3.3
Developing countries 0.7 1.6 2.4 3.5East Asia and the Pacific 5.6 6.4 5.1 5.4Europe and Central Asia 0.7 –1.9 3.3 3.4Latin America and the Caribbean –0.9 1.6 0.3 2.6Middle East and North Africa –0.6 1.0 1.3 1.3South Asia 3.4 3.3 3.5 4.0Sub-Saharan Africa –1.2 –0.4 0.8 1.6
Note: Aggregations are moving averages, reweighted annually after calculations of growth in constant prices.Source: World Bank.
gep_ch01.qxd 12/5/02 4:16 PM Page 29
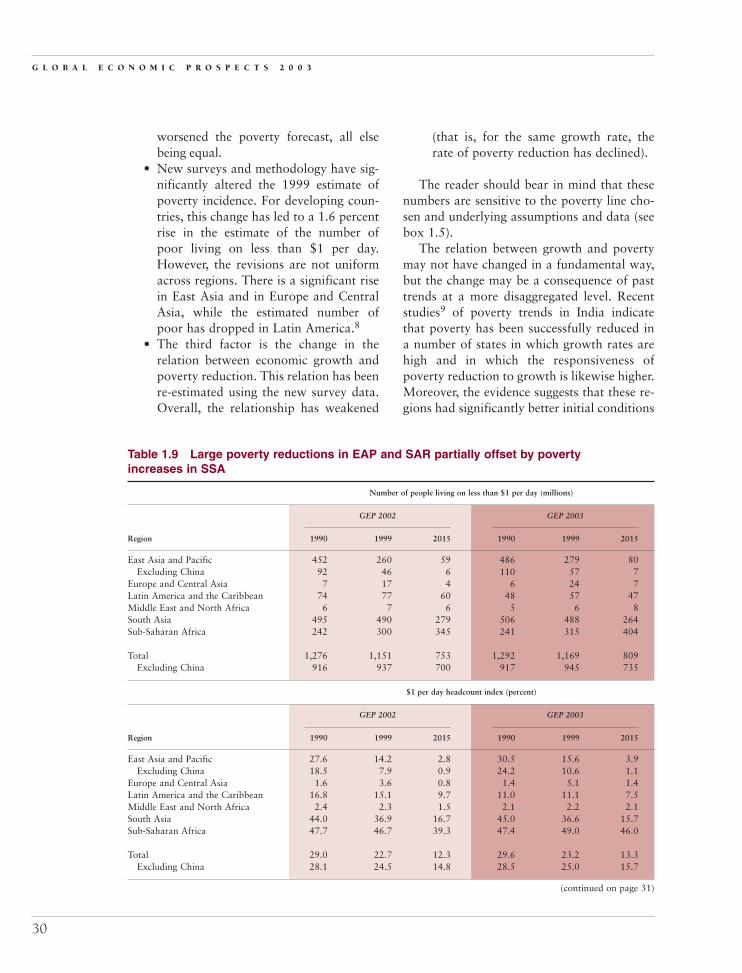
worsened the poverty forecast, all elsebeing equal.
• New surveys and methodology have sig-nificantly altered the 1999 estimate ofpoverty incidence. For developing coun-tries, this change has led to a 1.6 percentrise in the estimate of the number ofpoor living on less than $1 per day.However, the revisions are not uniformacross regions. There is a significant risein East Asia and in Europe and CentralAsia, while the estimated number ofpoor has dropped in Latin America.8
• The third factor is the change in therelation between economic growth andpoverty reduction. This relation has beenre-estimated using the new survey data.Overall, the relationship has weakened
(that is, for the same growth rate, therate of poverty reduction has declined).
The reader should bear in mind that thesenumbers are sensitive to the poverty line cho-sen and underlying assumptions and data (seebox 1.5).
The relation between growth and povertymay not have changed in a fundamental way,but the change may be a consequence of pasttrends at a more disaggregated level. Recentstudies9 of poverty trends in India indicatethat poverty has been successfully reduced ina number of states in which growth rates arehigh and in which the responsiveness ofpoverty reduction to growth is likewise higher.Moreover, the evidence suggests that these re-gions had significantly better initial conditions
G L O B A L E C O N O M I C P R O S P E C T S 2 0 0 3
30
Table 1.9 Large poverty reductions in EAP and SAR partially offset by poverty increases in SSA
Number of people living on less than $1 per day (millions)
GEP 2002 GEP 2003
Region 1990 1999 2015 1990 1999 2015
East Asia and Pacific 452 260 59 486 279 80Excluding China 92 46 6 110 57 7
Europe and Central Asia 7 17 4 6 24 7Latin America and the Caribbean 74 77 60 48 57 47Middle East and North Africa 6 7 6 5 6 8South Asia 495 490 279 506 488 264Sub-Saharan Africa 242 300 345 241 315 404
Total 1,276 1,151 753 1,292 1,169 809Excluding China 916 937 700 917 945 735
$1 per day headcount index (percent)
GEP 2002 GEP 2003
Region 1990 1999 2015 1990 1999 2015
East Asia and Pacific 27.6 14.2 2.8 30.5 15.6 3.9Excluding China 18.5 7.9 0.9 24.2 10.6 1.1
Europe and Central Asia 1.6 3.6 0.8 1.4 5.1 1.4Latin America and the Caribbean 16.8 15.1 9.7 11.0 11.1 7.5Middle East and North Africa 2.4 2.3 1.5 2.1 2.2 2.1South Asia 44.0 36.9 16.7 45.0 36.6 15.7Sub-Saharan Africa 47.7 46.7 39.3 47.4 49.0 46.0
Total 29.0 22.7 12.3 29.6 23.2 13.3Excluding China 28.1 24.5 14.8 28.5 25.0 15.7
(continued on page 31)
gep_ch01.qxd 12/5/02 4:16 PM Page 30

T H E I N T E R N A T I O N A L E C O N O M Y A N D P R O S P E C T S F O R D E V E L O P I N G C O U N T R I E S
31
Arecent study (Bhalla 2002) concludes that theWorld Bank has overestimated the number of
poor in developing countries, and that the millen-nium development goal of halving extreme povertyby 2015 (from its 1990 level) was already achievedin 2000. The study estimates that the percentageof poor in developing countries in 2000 was only13.1 percent and that the World Bank’s estimate is10 percentage points higher (see table 1.9). Threedifferences between the Bhalla estimates and theWorld Bank’s explain Bhalla’s different conclusion.These differences include the choice of the poverty
Box 1.5 Is the World Bank overestimating global poverty?
line, his use of secondary data sources rather thanprimary surveys, and consumption adjustments.These differences highlight the complexity in count-ing the number of poor and are described here. Amore complete critique of the Bhalla study can befound in a separate paper (Ravallion 2002).
The World Bank has chosen to use $1 per dayand $2 per day poverty lines for global estimations,roughly spanning the range of national poverty linesin developing countries. Bhalla uses $1.50 per day.Because the cost of purchasing 2,200 calories differsfrom country to country, each country estimates its
Table 1.9 (continued)
Number of people living on less than $2 per day (millions)
GEP 2002 GEP 2003
Region 1990 1999 2015 1990 1999 2015
East Asia and Pacific 1,084 849 284 1,114 897 339Excluding China 285 236 93 295 269 120
Europe and Central Asia 44 91 42 31 97 45Latin America and the Caribbean 167 168 146 121 132 117Middle East and North Africa 59 87 65 50 68 62South Asia 976 1,098 1,098 1,010 1,128 1,139Sub-Saharan Africa 388 484 597 386 480 618
Total 2,718 2,777 2,232 2,712 2,802 2,320Excluding China 1,919 2,164 2,041 1,892 2,173 2,101
$2 per day headcount index (percent)
GEP 2002 GEP 2003
Region 1990 1999 2015 1990 1999 2015
East Asia and Pacific 66.1 46.2 13.5 69.7 50.1 16.6Excluding China 57.3 40.4 13.3 64.9 50.2 18.4
Europe and Central Asia 9.6 19.3 8.7 6.8 20.3 9.3Latin America and the Caribbean 38.1 33.1 23.4 27.6 26.0 18.9Middle East and North Africa 24.8 29.9 16.7 21.0 23.3 16.0South Asia 86.8 82.6 65.5 89.8 84.8 68.0Sub-Saharan Africa 76.4 75.3 68.0 76.0 74.7 70.4
Total 61.7 54.7 36.3 62.1 55.6 38.1Excluding China 58.8 56.5 41.0 58.7 57.5 44.7
Note: The GEP 2002 figures include the Republic of Korea, which has been reclassified into the high-income group. Source: World Bank staff estimates.
gep_ch01.qxd 12/5/02 4:16 PM Page 31

than did states with lower growth rates. Thisevidence implies that progress in the futurewill be harder to achieve with the same na-tional growth rate. Poverty-reducing policieswill, therefore, have to focus on raising the
initial conditions in the laggard states andshould not rely exclusively on raising the na-tional growth rate.
The number of poor in last year’s reportwas projected to be 753 million in 2015,
G L O B A L E C O N O M I C P R O S P E C T S 2 0 0 3
32
own national poverty line. This approach also re-flects the fact that the nature of poverty varies signif-icantly across and within countries. Moreover,poverty has many dimensions: inadequate consump-tion of essential commodities, as well as low life ex-pectancy, high child mortality, and low school enroll-ment rates, among other attributes related to thequality of life. Poverty is also a relative and subjec-tive concept. What is deemed a necessity in somecountries (for example, indoor plumbing in richcountries) may be a luxury in others. In Latin Amer-ica, the regional estimate for the percentage of peo-ple living in extreme poverty is 17.8 percent in 1998(Wodon and others 2002), compared with 11.1 per-cent in 1999 using the $1 per day poverty line. Theformer is based on national poverty lines and is froma regional perspective. This higher number—ar-guably a more accurate reflection of the incidence ofpoverty from a social point of view—is more rele-vant in determining policies for reducing poverty.However, for purposes of global comparisons, theWorld Bank has tried to select a level of real con-sumption that best measures the same level of con-sumption across countries so it can make aggregatejudgments independent of where the poor live.
Unlike the Bhalla study—which relies on aggre-gate secondary data sources—the World Bank’spoverty estimates rely exclusively on primary datafrom comprehensive household surveys. Since the1980s, the World Bank and developing-country gov-ernments have been actively involved in undertakingnational household surveys to get an accurate pictureof the distribution of consumption across individu-als. To date, more than 300 comprehensive surveyshave been collated and used to estimate the numberof poor. Currently, the surveys cover more than90 countries, with surveys available for various yearsfor most counties. The surveys used all have nationalcoverage. They include consumption from own-production—a key feature in many developing
Box 1.5 (continued)
countries—and the calculations are properlyweighted to reflect survey design and differences inhousehold size. Consumption is deemed to be thepreferred measure to income, but income is usedwhen consumption is not available.
Finally, Bhalla’s study makes consumptionadjustments, which may not be warranted and couldlead to a biased poverty estimate. The headcountindex (that is, the percentage of the population livingat or below the poverty line) is calculated using anestimate of the per capita consumption level relativeto the poverty line. There can be significant discrep-ancies between the survey-based mean consumptionand the mean consumption as measured by the na-tional accounts. Part of this discrepancy is explainedby the way consumption is estimated in the nationalaccounts (which typically includes consumption ofnon-household private agents such as nonprofitorganizations). Other discrepancies can arise frommeasurement error (for example, misreporting ofconsumption in surveys). Adjustments for these dis-crepancies can lead to different estimates of poverty.If, for example, the misreporting is biased towardhigh incomes—that is, if only rich households under-report consumption in the surveys—and if an up-ward adjustment is applied to all households (includ-ing the poorest), then the number of poor will clearlybe underestimated (see Ravallion 2002). The WorldBank’s poverty estimates rely on the survey-basedconsumption levels.
Transparency in the methodology and data usedto assess the level of poverty is critical in this debateregarding how to count the number of poor. Theability of different researchers to easily assess andcompare results will lead to improved estimates andto a better understanding of the nature of povertyand policies that accelerate poverty reduction.
Source: World Bank staff.
gep_ch01.qxd 12/5/02 4:16 PM Page 32

T H E I N T E R N A T I O N A L E C O N O M Y A N D P R O S P E C T S F O R D E V E L O P I N G C O U N T R I E S
33
or a headcount rate of 12.3 percent. The cur-rent forecast shows the number of poor willdecline to only 809 million by 2015, or aheadcount rate of 13.3 percent. This changerepresents a 7.4 percent increase when com-pared with last year’s figure. The percentageincrease can be decomposed into two factors.The higher initial level of the number of poorin 1999 would lead to an increase of 2.3 per-cent in the 2015 forecast, all else being equal.The remaining 5.1 percent of the increase inthe forecast is attributed to a weakening of therelation between growth and poverty.
Population, savings, and investment are factors underlying the long-termforecastSome developing regions will need to see areversal in performance of underlying growthfactors—particularly in productivity and insavings and investment—from the last decade.That reversal should show either changes topolicies or persistence with ongoing reforms.Assessing the factors underlying the long-term forecast—population and labor supply,technological progress, and savings andinvestment—will elucidate some of the under-lying dynamics in the long-term growth fore-cast and its policy implications.
Population growth will ease in all regions—In virtually all countries, growth of theworking-age population is slated to declineover the next 15-year period, thereby affect-ing labor supply and thus contributing less toGDP growth in the long run (figure 1.21).High-income countries and those in Europeand Central Asia are likely to see an absolutedrop in the working-age population by 2015.Developing regions will see a slower pace ofdecline, although East Asia is expected to seeits growth rate halved to 0.7 percent per yearby the end of the period.10 A slower growthrate in the labor force means that achievingthe same rate of per capita growth will requirean acceleration of investment, a higher level ofproductivity, or a combination of both.
—but technological progress shouldaccelerateThe role of total factor productivity (TFP)growth in determining growth rates has beenthe subject of significant research over the pastdecade (see box 1.6), but there is a growingconsensus that technological advances andefficiency improvements are pivotal determi-nants of growth patterns. If one looks for-ward, many countries are expected to reap the
Note: HIY refers to high-income countries; SSA refers to Sub-Saharan Africa; EAP refers to East Asia and Pacific; SAS refers toSouth Asia; ECA refers to Eastern Europe and Central Asia; MNA refers to Middle East and North Africa; LAC refers to LatinAmerica and the Caribbean.Source: World Bank staff demographic projections.
Figure 1.21 Growth of working-age population decelerates(annual growth of population for ages 15 to 65)
�1.01998 2000 2002 2004 2006 2008 2010 2012 2014
�0.5
0.0
0.5
1.0
1.5
2.0
2.5
3.0
3.5
4.0 MNA
SSA SASLAC
EAP
ECA
HIY
gep_ch01.qxd 12/5/02 4:16 PM Page 33

G L O B A L E C O N O M I C P R O S P E C T S 2 0 0 3
34
Agrowing consensus in the economic literature isthat TFP accounts for the bulk of cross-country
differences in the level of income and the rate ofGDP growth (Easterly and Levine 2001).11 WhetherTFP or capital and labor accounted for the bulk ofincome differences among countries has been anissue of dispute since seminal articles by Denison(1972) and Jorgenson and Griliches (1967, 1972).The debate sharpened in the 1990s when a numberof comparative growth studies found that the successof the East Asian Tigers was driven mostly by in-creases in capital and labor rather than by increasesin TFP (Young 1992, 1995; Collins and Bosworth1996). Because capital is subject to diminishing re-turns, such studies implied that the high rates ofgrowth achieved in East Asia were not sustainable(Krugman 1994).
More recently, the weight of evidence appearsto be moving toward the conclusion that TFP is themain driver of growth. The East Asian studies havebeen criticized for not accounting for the role thattechnological progress plays in encouraging greatercapital accumulation (Hulten 2000; Barro and Sala-i-Martin 1992).12 Nelson and Pack (1999) emphasizethat learning, technology absorption, and forceful en-trepreneurship were critical to the success of large in-vestments in physical and human capital. Klenow andRodríquez-Clare (1997) estimate that TFP made animportant contribution to growth in all of the EastAsian “miracle” economies, except Singapore. East-erly and Levine (2001) summarize studies that showTFP accounts for more than 40 percent of outputgrowth in most of the industrial countries, 30 percentor more in most Latin American countries, and awide range (from �5 percent to 30 percent) in EastAsia (box figure). Some writers attempt to refine esti-mates of the contribution of TFP to growth by incor-porating some measurement of the quality of in-puts—for example, adjusting data on labor input forthe degree of education or training (see Easterly andLevine 2001 and Parente and Prescott 2000 for recentcontributions). In general, efforts have not been suc-cessful in greatly reducing the amount of growth orincome differences that are accounted for by TFP.
The evidence that growth in TFP is the maindriver of economic growth is essentially an optimistic
Box 1.6 Technological progress is an importantdeterminant of growth
sign for developing countries, because constraints ondomestic resources and access to external financingseverely limit a country’s ability to raise growth ratesby increasing the volume or improving the qualityof physical and human capital. To the extent thatdifferences in TFP growth will reflect differences intechnology, then developing countries (which arewell below the technological frontier) can potentiallyachieve high “catch-up” rates of growth by import-ing technology. Parente and Prescott (1994) see themain source of cross-country productivity differencesas stemming from policy-induced barriers to adopt-ing advanced technology. TFP growth also reflectsother aspects of economic efficiency that areamenable to change through improving policies. Forexample, policies that increase competition may raiseTFP by improving the allocation of labor and capitaland by increasing the ability of the economy to re-spond to changes in the economic environment(Easterly and Levine 2001; Solow 2001; Hulten2000).
Critiques of using this accounting approachinclude the fact that it typically relies on variousrestrictive assumptions (for example, constantreturns to scale and competitive markets) that maynot hold in reality (although models that incorporate
Source: Easterly and Levine (2001).
TFP is a major contributor to growth(percent)
�10
0
10
20
30
40
50
60
Taiw
an (C
hina
)
Kore
a, R
ep. o
f
Sing
apor
e
Hon
g Ko
ng (C
hina
)
Vene
zuel
a, R
.B. d
e
Mex
ico
Chi
le
Braz
il
Arge
ntin
a
Uni
ted
Stat
es
Uni
ted
King
dom
Japa
n
Italy
Ger
man
y
Fran
ce
gep_ch01.qxd 12/5/02 4:16 PM Page 34

T H E I N T E R N A T I O N A L E C O N O M Y A N D P R O S P E C T S F O R D E V E L O P I N G C O U N T R I E S
35
benefit of reforms undertaken during the past10 years. These benefits will likely show up asan acceleration of technological progress (fig-ures 1.22 and 1.23). Among industrial coun-tries, those countries in Europe will see accel-erating benefits from the single currency plusgreater capital and labor mobility. Japan,though still burdened with significant prob-lems in its financial sector, is witnessing
changes in its service sectors, which will havelong-term payoffs. Both Europe and Japan,although lagging somewhat behind the UnitedStates, have the opportunity to reap gains fromimproved use of information technologies.
The East Asia region has been the leaderamong developing regions in terms of acceler-ating productivity over the past two decades.It has built on compositional shifts (fromagriculture to manufacturing and services),
market imperfections also confront difficult econo-metric problems; see Brock and Durlauf 2001).Often, key parameters, such as the share of capital inoutput, are assumed to be based on limited empiricalwork (Senhadji 2000). Solow (2001) notes that thegrowth-accounting framework assumes that theeconomy is moving along the potential output fron-tier. In developing countries, the volatility of thebusiness cycle means that actual output may be con-siderably different from potential at any point intime. Thus, growth-accounting estimates using timeseries data may be biased by differences betweenpotential and actual output levels at the beginningand end points, even if a considerable time period is
Box 1.6 (continued)
covered. Finally, growth accounting generally doesnot reflect either improvements in the quality ofgoods or the introduction of new products, whichare also important for welfare (Hulten 2000). Thosecriticisms underscore the substantial methodologicaland measurement difficulties involved in quantify-ing the contribution of inputs and productivity togrowth rates. Nevertheless, as Hulten (2000) stresses,this approach has provided a simple and internallyconsistent intellectual framework that has been usedto gain vital insights into the process of economicgrowth.
Source: World Bank staff.
SSASASMNALACECAEAPHIY
HIY � high-income countries.Source: World Bank staff estimates.
Figure 1.22 Productivity has not beenthe dominant source of growth inregions(average percent per annum 1990–2000)
0
�4
�2
8
6
4
2
Labor
Capital
Productivity
SSASASMNALACECAEAPHIY
HIY � high-income countries.Source: World Bank staff estimates.
Figure 1.23 Productivity is expected tobe more significant in the longer term(average percent per annum 2005–15)
0
�4
�2
8
6
4
2
Labor
Capital
Productivity
gep_ch01.qxd 12/5/02 4:16 PM Page 35

educational improvements, and productivity-enhancing policies (for example, increasingopenness). The region will continue to benefitfrom good policies and compositional shifts.After all, the largest country in the region,China, still has more than 60 percent of itswork force in agriculture. However, as the gapwith technologically more advanced countriescloses, the opportunities for extreme advancesin productivity diminish.
Europe and Central Asia is benefiting fromthe substantial reforms of the 1990s, accom-panied by large FDI flows. Moreover, many ofthe accession countries will accelerate the re-form process in preparation for joining the EUearly in the forecast period.
In Latin America, progress has been visibleregionwide. As has been positively demon-strated by Chile and Mexico, openness andstability are key elements in providing sustain-able growth. A recent study of Latin Americangrowth over the past three decades concludesthat structural reforms and stabilization poli-cies accounted for a large contribution to theoverall acceleration in the rate of growth inthe 1990s compared with the “lost decade” ofthe 1980s.13 These trends are expected to con-tinue in the next decade, with increasing in-vestments in infrastructure and education andwith greater openness to trade underpinningsolid productivity growth. The key downsiderisk includes the vulnerability of the region toexternal shocks, particularly given its sizableexternal debt burden, and the effects that thisdebt could have on the stability of the domes-tic financial sector.
Sub-Saharan Africa has benefited from sim-ilar policy reforms and stabilization. FDI hasbeen increasing, and the resolution of somelong-term civil conflicts should provide amore enabling environment for sustainedgrowth. South Asia and the Middle East andNorth Africa regions have maintained some ofthe highest trade barriers in the world. Thesebarriers will slowly be removed under the im-petus of multilateral and regional trade agree-ments, with ensuing efficiency gains.
Figures 1.22 and 1.23 summarize the de-composition of the various sources of GDPgrowth into three broad components: thelabor supply, capital accumulation and pro-ductivity for the historical period 1990–2000,and the long-term projection for 2005–15.The decomposition profiles projected for theperiod 2005–15 are rather similar to the1990–2000 period, with the significant excep-tion of the contribution from technologicalprogress. As argued on page 38, we have pro-jected that most regions will see an accelera-tion of technological progress, which willdrive the improvements in GDP growth. Thatprogress will trigger further capital accumula-tion to accommodate and to further enhancegrowth prospects—hence the need for pro-viding an enabling investment environment.Capital accumulation implies an investmentprofile—discussed in more detail below—linked, of course, to behavioral assumptionsregarding savings during the coming decade.
Convergence of investment ratios is likelyto continueAfter a distinct divergence of investment ratiosacross regions during the past decades, someconvergence is expected during comingdecades, though disparities will remain signifi-cant. Investment rates in the developing EastAsia and the Pacific region gradually increasedfrom 15 percent of GDP during the 1960s toalmost 30 percent during the 1980s (fig-ure 1.24a). This increase coincided with rapidgrowth of the economies in the region, majorsectoral shifts as a result of diversification,and regional and global integration, which allrequired expansion or replacement of capitalstocks. During the first half of the 1990s, theaverage investment rate jumped further to35 percent, of which a substantial part wasused for real estate development when foreigncapital streamed in. In 1997, investors realizedthat their collective behavior was based onoverly optimistic expectations. The resultingfinancial crisis sharply lowered investmentrates back to levels near 25 percent.
G L O B A L E C O N O M I C P R O S P E C T S 2 0 0 3
36
gep_ch01.qxd 12/5/02 4:16 PM Page 36

T H E I N T E R N A T I O N A L E C O N O M Y A N D P R O S P E C T S F O R D E V E L O P I N G C O U N T R I E S
37
The investment rate in South Asia was ex-tremely low until the mid-1970s, but then itstarted to rise. To a large extent, that rise is areflection of the green revolution and industri-alization programs in India. Although not asstrong by far as in East Asia, the average ratecontinued to increase during the 1980s and1990s, and the current level is now close toOECD levels of around 22–23 percent. Thatlevel is well above rates in Latin America andSub-Saharan Africa.
Structural developments in the latter tworegions (LAC and SSA) were quite differentfrom the Asian experience. A gradual rise ininvestment rates during the 1970s, which waspartly financed abroad, suddenly turned intoa sharp decline when the debt crisis hit in theearly 1980s. Investment rates dropped around5 percentage points. Macroeconomic imbal-ances and hyperinflation in Latin America, aswell as sharp terms-of-trade losses in Africa,led to extremely low growth during the 1980s.In this environment, investment rates contin-ued to fluctuate around historical lows. Dur-ing the 1990s, investment rates showed onlya slight recovery, although the compositionshifted significantly away from public to pri-vate investment, following major structural
changes and privatization programs. One rea-son for the lack of a strong rebound in invest-ment was the continued low domestic savingsrate in both regions (figure 1.24b). Even withlow investment rates, the current accountshowed large deficits during the 1990s.
Future investment trends will be influencedby expected GDP growth, by real domesticinterest rates, and by expected domestic ratesof return to capital compared with the averageglobal rate of return. If one assumes a stablerisk environment, the last effect should tendto benefit developing countries, where ratesof return are higher than in rich counties.Table 1.10 summarizes the changes in invest-ment behavior between the average of the1997–2001 period and the final year (2015)of the baseline scenario. On average, the high-income countries will see a drop in the invest-ment rate of about 2.9 percentage points (rel-ative to GDP). This figure is derived largelyfrom lower projected GDP growth rates andthus changes in the optimal capital to outputratio. The average investment rate in develop-ing countries increases slightly by 0.2 percent-age points, with higher investment rates inmany regions offset by lower investment inEast Asia. The latter region is still suffering
Source: World Bank staff estimates.
Figure 1.24 Major structural shifts in investment and savings behavior have occurred
a. Investment-to-GDP ratio
(current dollar-weighted average)
0
5
10
15
20
25
30
35
East Asiaand Pacific
Sub-SaharanAfrica
LatinAmerica and
the Caribbean
SouthAsia
b. Savings-to-GDP ratio
(current dollar-weighted average)
0
5
10
15
20
25
30
35
Sub-SaharanAfrica
SouthAsia
LatinAmerica and
the Caribbean
East Asiaand Pacific
1970s 1970s1990s
1990s
1980s
1980s
1960s 1960s
gep_ch01.qxd 12/5/02 4:16 PM Page 37

from past overinvestment, particularly insome sectors, and will adjust its investmentneeds to a slight deceleration in growth. Mostof the other developing regions will see accel-eration in investment in anticipation of highergrowth. Investment in those regions will alsoprovide relatively higher returns than in themore mature economies.
Future changes in investment rates do notnecessarily lead to corresponding changes incurrent accounts. Despite capital mobility,investment rates tend not to correlate withcurrent account deficits in the long run, theso-called Feldstein-Horioka puzzle (1980).Also in the coming 15-year period, the savingsrate is expected to increase in those countriesthat are anticipated to enjoy an acceleration ofgrowth, partly because of rapidly changingdemographics.
Changing demographics will raise savings in developing countries and will lower savings in industrialcountriesGlobal population dynamics are evolvingfairly rapidly at the beginning of the new mil-
lennium. Rich countries are seeing an exten-sion of life spans and a rapid decline inbirthrates, leading to a sharply aging popula-tion. Developing countries are witnessing arelatively sharp drop in the percentage ofyouths as well as modest increases in thenumber of elderly. Recent economic evidencesuggests that these trends could have signifi-cant implications on national saving rates—lowering them in rich countries because ofaging, but raising them in developing coun-tries as workers save for future retirement.Lower birthrates also lead to a reduction inresource demand for the young.
The demographic transition with respect tothe proportion of youths is largely over in thehigh-income countries (figure 1.25). The over-all average was 27.4 youths per 100 workers14
in 2000 and is expected to drop to 24.4 by2015. Developing regions are likely to witnessmuch greater changes. First of all, the propor-tion of youths is starting from a significantlyhigher base, with the dependency ratio aver-aging 51.0, which is nearly double the high-income average. The ratio is expected to dropto 40.7 by 2015, twice the percentage of the
G L O B A L E C O N O M I C P R O S P E C T S 2 0 0 3
38
Table 1.10 Savings fall in high-income countries, but increase in most other regions(as a percentage of GDP)
1997–2001 2015
Capital CapitalSavings Investment inflows Savings Investment inflows
(S) (I) (KA) (S) (I) (KA)
Total 22.4 22.5 0.1 20.5 20.5 0.0High income 22.0 21.9 �0.1 18.6 19.0 0.4Low and middle income 24.2 24.7 0.5 26.0 24.9 �1.1European Union 20.8 20.4 �0.4 17.5 17.4 �0.1Japan 29.8 27.5 �2.2 26.0 25.4 �0.6United States 17.5 19.5 2.0 14.5 16.3 1.9Rest of high income 30.8 26.1 �4.7 24.9 23.2 �1.7East Asia and Pacific 36.9 33.9 �3.0 35.0 29.3 �5.8South Asia 21.3 22.2 0.9 23.7 23.5 �0.2Middle East and North Africa 26.2 21.4 �4.8 23.1 22.2 �0.9Sub-Saharan Africa 13.9 17.6 3.7 19.0 20.1 1.1Europe and Central Asia 21.9 22.6 0.7 22.0 27.1 5.1Latin America and the Caribbean 17.9 21.7 3.7 20.5 20.6 0.0
Note: The columns (S), (I), and (KA) represent, respectively, the national saving rate, the national investment rate, and the capitalaccount, all as a share of GDP. The values for 2015 are simulated values from the global general equilibrium model (maintainedby the Development Economics Prospects Group). The values for the 1997–2001 period represent the average observed valuesfrom the World Bank’s statistical databases. For the high-income countries, these values are the 1997–99 or 1997–2000 averages,depending on data availability. For the totals, the averages cover only the years 1997–99.Source: World Bank model simulations.
gep_ch01.qxd 12/5/02 4:16 PM Page 38

T H E I N T E R N A T I O N A L E C O N O M Y A N D P R O S P E C T S F O R D E V E L O P I N G C O U N T R I E S
39
fall expected in industrial countries. This anti-cipated decline is the consequence of two fac-tors: a boom in births over the past twodecades, leading to a rapid rise in the working-age population, and, more recently, decliningbirthrates, which are caused by a combinationof economic growth and family-planningprograms.
The elderly dependency ratio, defined asnumber of members of the population whoare older than 65 per 100 workers, is rising inalmost every region (figure 1.26). The transi-tion is occurring rapidly in industrial countriesas the Baby Boom generation ages and aslife expectancy improves, but there will onlybe modest changes in developing countriesthrough 2015 because relatively more recentimprovements in health and life expectancywill affect elderly demographics only furtherin the future.15 The elderly dependency ratioaverage in 2000 for industrial countries was21.2 per 100 workers. It is expected to rise to26.9 by 2015, surpassing the youth depen-dency ratio. Japan will witness the most dra-matic increase, from 25.1 to 39.8. This change
alone could have major macroeconomic impli-cations for Japan and have consequences forthe rest of the world, because Japan has longhad large excess savings that have been recy-cled abroad. Outside the industrial countries,the average elderly dependency ratio is notexpected to change significantly. The averagewas 8.9 in 2000, increasing to only 9.6 in2015.
Several recent studies of private savingsbehavior have linked the private savings rateto a number of different factors: demograph-ics, income levels and growth, interest and in-flation rates, and degree of financial interme-diation.16 The results discussed next focus ononly three channels affecting savings: the rateof per capita GDP growth, the youth depen-dency ratio, and the elderly dependency ratio.Other channels may prove to be equally im-portant, however, such as improved financialintermediation and a stable macroeconomicenvironment. Combining these three effectssuggests that global savings may decline byaround 1 percentage point over the longerterm, a figure that takes into account a
Figure 1.25 Youth dependency ratio willfall everywhere except Japan (number of youths, age 15 and under, per 100working-age population)
0
10
20
30
40
50
60
70
80
90
LMY
HIY
TOT
LAC
ECA
SSA
MN
A
SAR
EAP
RH
Y
USAJPN
E_U
RHY � rest of high income; TOT � global average;HIY � high-income average; LMY � low- and middle-income average.Note: Working-age population is defined as those peoplebetween the ages of 15 to 65.Source: World Bank staff.
2015
2000
2015
2000
0
10
20
30
40
50
(number of elderly, age over 60, per 100 working-agepopulation)
LMY
HIY
TOT
LAC
ECA
SSA
MN
A
SAR
EAP
RH
Y
USAJPN
E_U
RHY � rest of high income; TOT � global average;HIY � high-income average; LMY � low- and middle-income average.Note: Working-age population is defined as those peoplebetween the ages of 15 to 65.Source: World Bank staff.
2015
2000
Figure 1.26 Elderly dependency ratioswill rise in some regions
2015
2000
gep_ch01.qxd 12/5/02 4:16 PM Page 39

2.7 percentage point decline in high-incomecountries and a 3.7 percentage point rise indeveloping countries.
With relatively large swings in domesticsavings rates, the scenario suggests a rathersignificant change in net capital flows. In1997, the base year of model simulations,industrial countries were exporting around$67 billion in net investment to low- andmiddle-income countries, some 1.1 percent oflow- and middle-income countries’ GDP. EastAsia was the only developing region that wasa net exporter of capital in the base year.17 By2015, under these savings and investment as-sumptions, low- and middle-income countrieswould be significant net exporters (some1.1 percent of their GDP), while industrialcountries would be net importers. Among in-dustrial countries, Europe would be in ap-proximate investment-to-savings balance, butthe United States could continue to be a sig-nificant net importer of capital. The UnitedStates would actually see little change in itscapital account surplus from the base year (asa share of GDP), though it would experiencea reversal from its present high level. Japan’scapital account deficit would diminish sharplywith a rapidly increasing elderly populationleading to a decrease in savings.18
The actual magnitude of these changesin savings and investment rates remainsspeculative—even though they are grounded inempirically validated economic theory withina consistent accounting framework—becausesome of the underlying behavioral relationscould change the savings rates, the investmentrates, or both to some extent and could havea noticeable effect on the balance (that is, thecapital account). Nevertheless, there is littledoubt regarding the broad changes in thepattern in these projections. A clear trendemerges of further reduction in developingcountries’ foreign debt. East Asia could con-tinue to show significant surpluses on the cur-rent account, while Latin America could con-verge toward a balanced current account. Thelatter would be the result of, and represent arise in, the savings rate and a relatively stable
investment ratio. Those figures would reflectno change in overall growth compared withthe 1990s because declining populationgrowth will counteract the acceleration in percapita growth.19 These trends in savings andinvestment rates will require adjustments torelieve the strains on budget and other vari-ables. Open capital and goods markets wouldfacilitate the potential strains from demo-graphic transition.
Major policy challenges are likely to emergeWhile there is evidence in support of the eco-nomic growth projection in this long-run sce-nario, the degree of uncertainty regarding theprojections is high. There is recognition thatthese trends will require good policies, be-cause many developing countries are still sub-ject to major shocks.
These scenarios raise important long-termpolicy issues. First, the changing savings andinvestment patterns will have consequencesfor net capital flows. Several developing coun-tries that in past decades have relied on netcapital inflows will find it harder to do so inthe coming 15 years. Indeed, the recent shiftfrom debt accumulation to debt reduction inmany of these countries is likely to heralda new long-term trend of further declinesin debt. If the expected increase in privatedomestic savings is accompanied by furthermaturing of domestic credit markets and isnot thwarted by deterioration of public sav-ings, then debt reduction will not conflict withthe investment patterns needed to underpingrowth.
Underlying large swings in net capital flowsare even larger movements of gross capitalflows, because FDI expands into growingmarkets in developing countries and becausefinancial agents in developing countries seekto diversify their portfolios in rich countries.These capital movements will require furtherinternational financial integration. Becausethe history of financial integration has notbeen entirely felicitous—and at times has beendamaging to growth and poverty reduction—
G L O B A L E C O N O M I C P R O S P E C T S 2 0 0 3
40
gep_ch01.qxd 12/5/02 4:16 PM Page 40

T H E I N T E R N A T I O N A L E C O N O M Y A N D P R O S P E C T S F O R D E V E L O P I N G C O U N T R I E S
41
the international community and developingcountries have had to search for mechanismsto provide for greater stability in integration.
Developing countries can further facilitatepotential growth by improving their invest-ment climates. A sound policy environmentwill trigger investment flows and, more im-portant, will ensure that these flows go intointernationally competitive activities. A soundinvestment climate in developing countriescan also attract FDI, which is a form of less-volatile capital inflow.
Notes1. Examples of investment-grade borrowing coun-
tries are Chile, China, the Republic of Korea,Malaysia, Mexico, Thailand, and several CentralEuropean countries.
2. See Appendix 1, “Regional Economic Prospects,”for detail on recent developments, policy, and prospectsfor developing regions.
3. Simulation used the world model by OxfordEconomic Forecasting Inc.
4. Investment is the most cyclical component ofGDP and is the key driving force underlying the emer-gence of turning points in the economy. The flow ofinvestment expenditures is volatile because investment,unlike consumption, represents the desired change ofa stock. As the capital stock tends to move with incomeand consumption, the change in the stock showssharper fluctuations than the change in income. Fur-thermore, a downturn in investment is inherently tem-porary and bears the seeds of subsequent recovery.Once the lower desired capital stock has been achieved,the flow of investment stops falling and starts increas-ing again to keep the capital stock stable at the newlevel.
5. The trends are computed with Hendrick-Prescottfilters.
6. To reduce the potential risk of bad data contam-inating the results, we have excluded outliers (invest-ment volatility more than three standard deviationsabove the mean).
7. The correlation coefficient exceeds 0.75.8. The large drop in the poverty incidence in Latin
America comes from new surveys and from revisions toconsumption levels. The surveys predate the recent tur-moil in the region, particularly in Argentina, where theincidence of poverty has increased substantially afterthree years of recession. The large recent rise in povertyin Argentina reflects the national poverty line. The riseusing the World Bank’s $1 per day or $2 per day may
have a lower magnitude because average per capita in-come in Argentina ($12,100 in purchasing power par-ity terms in 2001, and $7,750 in 1995 terms) is muchhigher than the $2 per day level.
9. See, for example Datt and Ravallion (2002). 10. The growth rates are weighted by labor value
added, which may bias the regional estimates down-ward if high-wage countries have slower growth rates.Among other things, this method would affect a worldtotal because industrial countries have significantlyhigher wages than developing countries.
11. TFP is not the same as technical progress, butinstead includes all contributions to growth that arenot captured by data on capital and labor. However,the integration of more efficient technologies into pro-duction can raise the level of TFP.
12. Technically, only the fraction of capital accu-mulation that arises from the underlying propensity toinvest at a constant rate of TFP growth should beviewed as capital’s independent contribution to outputgrowth. Hulten (2000) found that correcting for theinduced capital accumulation caused by higher TFPalmost doubled estimates of the contribution of TFPto growth for the United States.
13. See Loayza, Fajnzylber, and Calderón (2002).14. We will use the term “workers” as shorthand
for the working population between ages 15 and 65.15. With the significant exception of SSA, where
AIDS has dramatically reversed life expectancy, and toa lesser extent ECA, where health systems deterioratedduring the transition toward market economies.
16. See, for example, Loayza, Fajnzylber, andCalderón (2002) and Masson, Bayoumi, and Samiei(1998).
17. Model simulations start in the base year 1997,and net capital flows for that year are derived from theGlobal Trade Analysis Project (GTAP), release 5.0,database. Note that the GTAP data, though based onofficial statistics, are adjusted to ensure global ac-counting consistency (that is, the sum of the capitalaccount across all regions is identically equal to zero).The world capital account has had a significant andincreasing residual over the past few years. The valuesin the first three columns of table 1.10 (that is, theaverage savings to investment ratios for the period1997–2001) are largely consistent with the initial 1997base levels from the GTAP dataset. The only regionwhere the sign of the capital account balance differs be-tween 1997 and the 1997–2001 average is the MENA,which is subject to considerable volatility because ofthe price of oil, the region’s main export.
For all other regions, the sign of the observed earlyperiod capital account balance is consistent with the1997 base year, though the magnitude may differ. Thedifference in magnitude is easily magnified because the
gep_ch01.qxd 12/5/02 4:16 PM Page 41

capital account balance is a residual item. Thus, evenif there is little volatility in the savings and investmentcomponents individually, there could be significantlymore variation in the capital account balance.
Finally, as already highlighted in the table note, thecapital account imbalance at the global level has beenlarge of late—and is increasing. In the model simu-lations, the base data are adjusted to remove theglobal imbalance, and the model itself ensures globalaccounting consistency in each year of any simulation.(The model could track perfectly the observed savingand investment ratios for each country except one. Orthere would have to be a residual country in the modelthat would absorb any adjustments to ensure globalaccounting consistency.) Even if the global capitalaccount imbalance is small as a share of global GDP,squeezing out the $100 billion to 200 billion residualerror is bound to have significant effects on the capitalaccount of individual countries, even a large one suchas the United States. If the U.S. imbalance is $400 bil-lion and the entire adjustment is forced on it, the U.S.capital account imbalance could change by as much as50 percent.
18. Note that this concept is flow based. All indus-trial countries have significant assets in other industrialcountries as well as in developing countries. Onewould anticipate, as in the case of Japan, that as thepopulation ages, the retired elderly will draw downtheir accumulated savings, including those funds in-vested abroad.
19. Table 1.10 compares the observed investmentratios over the 1997–2001 period with the end-of-period investment ratio generated by the model. Thestarting point of the model, 1997, has an investmentratio of 20.5 for Latin America. Thus, the scenario isforecasting virtually no change in the ratio.
ReferencesBarro, Robert, and Xavier Sala-i-Martin. 1992. “Con-
vergence.” Journal of Political Economy 100(2):223–51.
Baxter, Marianne, and Mario J. Crucini. 1993.“Explaining Saving—Investment Correlations.”American Economic Review 83(3): 416–36.
Bhalla, Surjit. 2002. Imagine There’s No Country:Poverty, Inequality, and Growth in the Era ofGlobalization. Washington, D.C.: Institute forInternational Economics.
Brock, William A., and Steven N. Durlauf. 2001.“Growth Empirics and Reality.” The World BankEconomic Review 15(2): 229–72.
Collins, Susan M., and Barry P. Bosworth. 1996. “Eco-nomic Growth in East Asia: Accumulation versus
Assimilation.” Brookings Papers on EconomicActivity 2: 135–91.
Crucini, Mario J. 1997. “Country Size and EconomicFluctuations.” Review of International Econom-ics 5(2): 204–20.
Datt, Gaurav, and Martin Ravallion. 2002. “Is India’sEconomic Growth Leaving the Poor Behind?”Journal of Economic Perspectives 16(3): 89–108.
Denison, Edward F. 1972. “Some Major Issues inProductivity Analysis: An Examination of theEstimates by Jorgenson and Griliches.” Survey ofCurrent Business 49(5, part II): 1–27.
Easterly, William, and Ross Levine. 2001. “It’s NotFactor Accumulation: Stylized Facts and GrowthModels.” The World Bank Economic Review 15:177–219.
Feldstein, Martin, and Charles Horioka. 1980.“Domestic Savings and International CapitalFlows.” Economic Journal 90(358): 314–29.
Hulten, Charles R. 2000. “Total Factor Productivity: AShort Biography.” National Bureau of EconomicResearch (NBER) Working Paper no. 7471. Boston.
Jorgenson, Dale W., and Zvi Griliches. 1967. “TheExplanation of Productivity Change.” Review ofEconomic Studies 34(3): 249–83.
———. 1972. “Issues in Growth Accounting: A Replyto Edward F. Denison.” Survey of Current Busi-ness 52(5, part II): 65–94.
Kaufmann, Daniel, Aart Kraay, and Pablo Zoido–Lobatón. 2002. “Governance Matters II: Up-dated Indicators for 2000–01.” Working Paper no.2772. World Bank, Washington, D.C. February.
Klenow, Peter, and Andrés Rodríguez-Clare. 1997.“Economic Growth: A Review Essay.” Journal ofMonetary Economics 40(3): 597–617.
Krugman, Paul. 1994 “The Myth of Asia’s Miracle.”Foreign Affairs 73(6): 62–77 (November/December).
Loayza, Norman, Pablo Fajnzylber, and CésarCalderón. 2002. “Economic Growth in LatinAmerica and the Caribbean: Stylized Facts,Explanations, and Forecasts.” World Bank,Washington, D.C. June. Processed.
Masson, Paul R., Tamim Bayoumi, and HosseinSamiei. 1998. “International Evidence on theDeterminants of Private Saving.” World BankEconomic Review 12(3): 483–501.
Nelson, Richard R., and Howard Pack. 1999. “TheAsian Miracle and Modern Growth Theory.”Economic Journal 109(July): 416–36.
Parente, Stephen L., and Edward C. Prescott. 1994.“Barriers to Technology Adoption, Learning-by-Doing, and Economic Growth.” Journal of Polit-ical Economy 102(2): 298–321.
G L O B A L E C O N O M I C P R O S P E C T S 2 0 0 3
42
gep_ch01.qxd 12/5/02 4:16 PM Page 42

———. 2000. Barriers to Riches. Cambridge, Mass.:MIT Press.
Ravallion, Martin. 2002. “Have We Already Met theMillennium Development Goal for Poverty?”World Bank, Washington, D.C. Processed.
Senhadji, Abdelhak. 2000. “Sources of EconomicGrowth: An Extensive Growth AccountingExercise.” International Monetary Fund StaffPapers 47, no. 1. Washington, D.C.
Solow, Robert. 2001. “Applying Growth Theoryacross Countries.” The World Bank EconomicReview 15(2): 283–88.
Wodon, Quentin, Rodrigo Castro-Fernandez, KihoonLee, Gladys Lopez-Acevedo, Corinne Siaens,
Carlos Sobrado, and Jean-Philippe Tre. 2002.“Poverty in Latin America: Trends (1986–1998)and Determinants.” World Bank, Washington,D.C. February. Processed.
Young, Alwyn. 1992. “A Tale of Two Cities: FactorAccumulation and Technical Change in HongKong and Singapore.” In O. J. Blanchard andS. Fisher, eds., NBER Macroeconomics Annual1992. Cambridge, Mass.: MIT Press, pp. 13–53.
———. 1995. “The Tyranny of Numbers: Confrontingthe Statistical Realities of the East Asian Experi-ence.” Quarterly Journal of Economics 110(3):641–80.
T H E I N T E R N A T I O N A L E C O N O M Y A N D P R O S P E C T S F O R D E V E L O P I N G C O U N T R I E S
43
gep_ch01.qxd 12/5/02 4:16 PM Page 43

The organization of global business israpidly changing in ways that affectthe competitive opportunities open to
developing countries. A principal feature ofbusiness organization is the steady expansionof multinational corporations and their relatedtrade and investment activities. Multinationalcompanies, including many based in otherdeveloping countries, are altering the compet-itive landscape by providing for developingcountries a new source of entry into markets.Moreover, by taking advantage of falling com-munication and transport costs, multination-als have learned to manage different stagesof production in multiple, distant locations,thereby creating opportunities for developingcountries to produce during those stages ofproduction—often labor-intensive stages—that correspond to their comparative advan-tage. But tapping into this potential sourceof competition is not automatic, and not allcountries have benefited. Moreover, someobservers have openly worried that the re-cent surge in global mergers among leadingmultinationals might be dampening competi-tion and creating obstacles for developingcountries.
This chapter reviews four recent trends inthe organization of global business that affectdeveloping countries’ ability to harness for-eign investment for greater competition:changes in global business concentration, therise in service sector foreign direct investment(FDI), the growth of global production
networks, and the growing importance ofstrong investment climates for the allocationof foreign investment.
Developing countries have benefited from the boom in global trade andinvestment—Cross-border trade and direct investment haveexpanded rapidly over the past three decades.Global exports of goods and services increasedfrom 14 percent of output in the early 1970s to23 percent by the late 1990s, while global FDIflows have more than doubled relative to grossdomestic product (GDP). The surge in FDIflows, with a large boost from cross-bordermergers and acquisitions (M&A), acceleratedin the late 1990s. FDI rose from $331 billionin 1995 to $1.3 trillion in 2000 before fallingto an estimated $725 billion in 2001. Despitethe sharp increase in M&A, the share of globaleconomic activity accounted for by the top50 companies does not appear to have risensignificantly during the 1990s. The top 50 com-panies accounted for 0.8 percent of worldGDP, and their aggregate profits amounted to3.3 percent of global savings in 2000.
—the rise in service sector FDI—A second change in global business organiza-tion creates an opportunity for developingcountries to expand productivity-enhancingcompetition. Foreign investment in services—financial, wholesaling and retailing, realestate, and business services—is accelerating.
45
1Changes in Global BusinessOrganization
2
gep_ch02.qxd 12/5/02 2:53 PM Page 45

Today, services account for more than halfof the FDI stock in most major industrialcountries. The rise in service sector FDI helpsdeveloping countries to introduce new tech-nology, to boost competition in services, andto increase the availability and quality of ser-vices. Because many services are essential in-puts to production, with multiple linkages tovirtually every dynamic part of the economy,increasing their efficiency directly boostseconomy-wide productivity. However, manycountries still maintain impediments to thisnew source of competition and technologyand, as a result, are at risk of being leftbehind.
—and the growth of cross-borderproduction networks—Technological progress in transport, commu-nications, and data processing—coupled withpolicy reforms—has fueled the growth ofcross-border production networks, in whichmultinational corporations break down theproduction of final goods into stages thatvary in the intensity of capital, skilled labor,unskilled labor, and other requirements, andmultinationals produce each stage where itcan be done at lower cost. In part, productionthrough networks is accomplished by greateroutsourcing of production, as multinationalsbecome less vertically integrated. In part,networks are established through foreignsubsidiaries.
Developing countries’ increased participa-tion in production networks is seen in therapid growth in their exports of parts andcomponents, as well as in their increasingimportance in intra-firm trade by multination-als. Participation in networks has generatedsubstantial gains for developing countriesthrough improving access to technology, thusincreasing the demand and supply of skilledlabor, as well as providing the opportunity formoving up the value chain to produce moresophisticated products. However, productionfor networks is highly concentrated in coun-tries with strong policy regimes, skilled work-forces, and adequate infrastructure.
—but a strong investment climate iscriticalThe policy and institutional framework is animportant determinant of whether countrieshave participated in the rise in FDI. Duringthe 1990s, countries with strong investmentclimates captured an increasing share of rapidlyexpanding global FDI flows. The removal ofrestrictions on private investment in services(particularly infrastructure services) has in-creased private investment and has improvedthe quality of services available to firms in de-veloping countries. The lowering of trade bar-riers and reduction in restrictions on FDI hasfacilitated developing countries’ participationin cross-border production networks. Externalfactors also play a role in determining access toFDI. For example, the recent deterioration ofthe global business environment has led to areduction in investment in high-risk projects,and foreign investment in infrastructure hasdropped all over the world. Still, those coun-tries with macroeconomic stability, sound gov-ernance, and healthy institutions will attract anincreasing share of available funds.
The surge in trade and FDI
Trade and FDI have grown rapidly sincethe 1970s—Cross-border trade and direct investment haveexpanded rapidly over the past few decades.Global exports of goods and services increasedby 5.5 percent per year in real terms from1978 to 2001, rising from just over 14 percentof output in the 1970s to almost 25 percentof output in 2001. High-income countriesaccount for the bulk of world trade and hencethe largest increment to trade flows. Develop-ing countries’ exports rose by just under 6 per-cent per year in real terms from 1978 to 2001,and their aggregate exports-to-GDP ratio in-creased by more than half over this period(figure 2.1).
Global FDI flows have also expandedrapidly. The surge in FDI flows acceleratedin the late 1990s, rising from $331 billion in
G L O B A L E C O N O M I C P R O S P E C T S 2 0 0 3
46
gep_ch02.qxd 12/5/02 2:53 PM Page 46

1995 to $1.3 trillion in 2000 before falling toan estimated $725 billion in 2001 (UNCTAD2002a). All income groups experienced a
sharp rise in the average ratio of FDI to invest-ment during the 1990s (figure 2.2), with thelargest increase in the industrial countries dur-ing the last years of the decade. Low-incomecountries have seen a five-fold rise in FDI rela-tive to investment, to almost the same ratio asin lower-middle-income countries. FDI flowsto developing countries equal about $160 bil-lion, while domestic investment in developingcountries equals about $1.5 trillion.
The rise in trade and FDI has played animportant role in boosting the productivity offirms in developing countries. In part, devel-oping countries may become more productivebecause trade improves the allocation of re-sources and because multinational subsidiariesmay be more productive than domestic firms.In addition, domestic firms may increase theirproductivity through participation in tradeand contacts with local subsidiaries of foreignfirms, although the extent and channels are amatter of considerable debate in the economic
C H A N G E S I N G L O B A L B U S I N E S S O R G A N I Z A T I O N
47
0
5
10
15
20
25
30
35
1970
1972
1974
1976
1978
1980
1982
1984
1986
1988
1990
1992
1994
1996
1998
2000
Figure 2.1 Exports-to-GDP ratios have increased since the 1970s(percent)
Source: World Bank data.
Developing countries
High-income countries
Figure 2.2 All regions have benefited from rising FDI flows(FDI-to-investment ratios, 1990–2000, in percent)
Note: Each set of bars represents the period 1990–2000; each bar represents one year during that period. The data on FDI includeboth greenfield and M&A transactions, whereas national income account data on investment represent only new investments. “Top10 developing country recipients” refers to the 10 developing countries that received the largest inflows of FDI.Source: World Bank data.
0Top 10 developingcountry recipients
Low-incomecountries
Lower-middle-incomecountries
Upper-middle-incomecountries
High-incomecountries
5
10
15
20
25
30
35
40
gep_ch02.qxd 12/5/02 2:53 PM Page 47

literature. Much empirical work has focusedon the potential for technological spilloversthrough importing, exporting, and FDI (seechapter 3 for a full discussion). On balance,the evidence for technological spilloversthrough imports is strong, while the evidencethat exporting promotes technology diffusionis less robust. Evidence for the existence oftechnology spillovers from FDI is mixed.Many industry-level studies (for example,Blomström 1986) have documented a positivecorrelation between FDI inflows and produc-tivity, although the causal direction is unclear.Some firm-level studies have failed to find evi-dence of technological spillovers in developingcountries. The effect of FDI will depend, inpart, on the form that FDI takes. FDI directedto heavily protected industries or attracted byvery costly incentives may have a low, or evennegative, effect on growth and productivity.But FDI used to integrate domestic sub-sidiaries in production networks could havesubstantial spillover effects (Moran 2001).
—but not all countries have participatedequally in the rise in FDIAmong industrial countries, the top five recip-ients of net FDI flows accounted for 74 per-cent of total FDI. However, a few of thesmaller countries (for example, Ireland andDenmark) have the highest ratio of FDI toGDP. The same pattern can be seen in devel-oping countries, where the top 12 recipientscaptured 80 percent of total FDI flows, butsome smaller countries had FDI-to-GDP ratiosthat were several times the average ratio. Fig-ure 2.3 compares each developing country’sshare of total FDI with its ratio of FDI toGDP (the countries are ordered by the shareof total FDI). Almost half of the 12 largestrecipients of FDI (at the far right of the distri-bution in figure 2.3) have FDI-to-GDP ratiosthat are lower than the average. According toa more comprehensive measure developed bythe United Nations Conference on Trade andDevelopment (UNCTAD), FDI to developingcountries is mildly concentrated: only 30 out of
G L O B A L E C O N O M I C P R O S P E C T S 2 0 0 3
48
0
Most FDI Least FDI
5
10
15
20
25
(percent share of total FDI) (FDI as a share of GDP)
0
5
15
10
20
25
35
40
30
45
Note: Countries sorted by share of total FDI, 1999.Source: World Bank data.
Figure 2.3 FDI is concentrated in large countries, but many small countries receive largeamounts relative to GDP
Chi
naAr
gent
ina
Kore
a, R
ep. o
fPo
land
Thai
land
Vene
zuel
a, R
.B. d
eIn
dia
Kaza
khst
anVi
etna
mTr
inid
ad a
nd T
obag
o
Boliv
ia
Azer
baija
nC
ote
d’lv
oire
Nic
arag
uaH
ondu
ras
Leso
tho
Cam
bodi
a
Equa
toria
l Gui
nea
Swaz
iland
Lao
PDR
Seyc
helle
s
St. V
ince
nt a
nd
the
Gre
nadi
nes
Eritr
eaTa
jikis
tan
Dom
inic
aC
ongo
, Rep
. of
Beliz
e
Some countries with a small share of totalFDI have high FDI-to-GDP ratios (right axis)Top 10 receive almost
80% of total FDIflows (left axis)
gep_ch02.qxd 12/5/02 2:53 PM Page 48
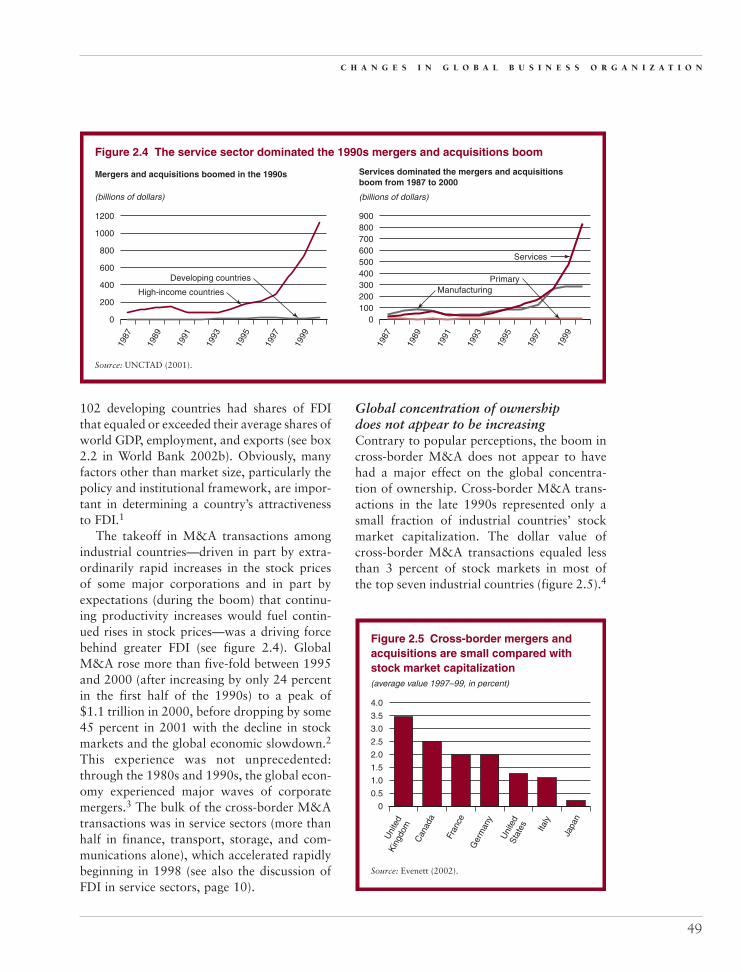
102 developing countries had shares of FDIthat equaled or exceeded their average shares ofworld GDP, employment, and exports (see box2.2 in World Bank 2002b). Obviously, manyfactors other than market size, particularly thepolicy and institutional framework, are impor-tant in determining a country’s attractivenessto FDI.1
The takeoff in M&A transactions amongindustrial countries—driven in part by extra-ordinarily rapid increases in the stock pricesof some major corporations and in part byexpectations (during the boom) that continu-ing productivity increases would fuel contin-ued rises in stock prices—was a driving forcebehind greater FDI (see figure 2.4). GlobalM&A rose more than five-fold between 1995and 2000 (after increasing by only 24 percentin the first half of the 1990s) to a peak of$1.1 trillion in 2000, before dropping by some45 percent in 2001 with the decline in stockmarkets and the global economic slowdown.2
This experience was not unprecedented:through the 1980s and 1990s, the global econ-omy experienced major waves of corporatemergers.3 The bulk of the cross-border M&Atransactions was in service sectors (more thanhalf in finance, transport, storage, and com-munications alone), which accelerated rapidlybeginning in 1998 (see also the discussion ofFDI in service sectors, page 10).
Global concentration of ownership does not appear to be increasingContrary to popular perceptions, the boom incross-border M&A does not appear to havehad a major effect on the global concentra-tion of ownership. Cross-border M&A trans-actions in the late 1990s represented only asmall fraction of industrial countries’ stockmarket capitalization. The dollar value ofcross-border M&A transactions equaled lessthan 3 percent of stock markets in most ofthe top seven industrial countries (figure 2.5).4
C H A N G E S I N G L O B A L B U S I N E S S O R G A N I Z A T I O N
49
900800700600500400300200100
0
Manufacturing
Services dominated the mergers and acquisitionsboom from 1987 to 2000
(billions of dollars)
1200
1000
800
600
400
200
1987
1989
1991
1993
1995
1997
1999
0
Source: UNCTAD (2001).
1987
1989
1991
1993
1995
1997
1999
Mergers and acquisitions boomed in the 1990s
(billions of dollars)
Figure 2.4 The service sector dominated the 1990s mergers and acquisitions boom
High-income countries
Developing countries
Services
Primary
0
0.5
1.0
1.5
2.0
2.5
3.0
3.5
4.0
Italy
Uni
ted
Stat
es
Ger
man
y
Fran
ce
Can
ada
Uni
ted
King
dom
Source: Evenett (2002).
Figure 2.5 Cross-border mergers andacquisitions are small compared withstock market capitalization(average value 1997–99, in percent)
Japa
n
gep_ch02.qxd 12/5/02 2:53 PM Page 49

Of course, the M&A boom coincided with thesharp rise in stock market valuations in thelate 1990s, particularly in the United States.Thus it is useful to keep in mind that both thenumerator and the denominator in figure 2.5are rising rapidly.
A related concern is whether the concentra-tion of global economic activity, either in indi-vidual sectors or in total, has increased forreasons other than cross-border M&A. Forsocial and political reasons, high concentra-tion in an economy may be a matter of con-cern. For example, 5.5 million corporationsare in the United States, with the largest 100companies accounting for about 11 percentof employment and payroll.5 The fabric ofthe U.S. economic (and socio-political) land-scape would surely be different if there wereno small enterprises, no start-ups, and noalternative places (beyond a few mammothcorporations) where someone with a new en-trepreneurial idea might go to obtain financialsupport and institutional encouragement.Similar concerns would hold for a high level ofconcentration in the global economy. Theremay be an extra element of concern for devel-oping countries in this regard. Few of thelargest companies in the global economy areheadquartered in and identified with a devel-oping economy.6 A global economy that isdominated by a relative handful of giant com-panies (if that were the case), which are head-quartered in a relatively few industrial coun-tries, may raise even greater socio-politicalconcerns in developing countries that feel thatthey can exert little effective control over theseenterprises.
Although the measurement issues involvedare enormous, it does not appear that globalconcentration is high or has been rising signif-icantly during the 1990s.7 White (2001, 2002)reports declining or stable aggregate concen-tration in the U.S. economy from the 1980sthrough the late 1990s, depending on whetheremployment, payroll, or profit data are used(figure 2.6).8 Note that this measure of aggre-gate concentration does not provide an indica-tor of market power in individual markets,
because each firm may participate in multiplemarkets.9
Concentration at the global level appearsto remain low, although one confronts enor-mous data problems and difficult tradeoffs inmaking such estimates. In 2001, total employ-ment by the largest 50 global companies (asidentified by Forbes) accounted for 0.3 percentof the world labor force, or 1.6 percent ofemployment in Organisation for EconomicCo-operation and Development (OECD)countries. Those companies’ profits amountedto 0.8 percent of world GDP and 3.3 percentof world gross domestic savings.10 Although itis difficult to say what level of concentrationshould be viewed as a cause for concern, atleast these aggregate data do not reflect a dom-ination of the global or OECD economies by asmall number of firms.
Global concentration does not appear tohave risen significantly during the 1990s. Theshare of the top 50 companies (as measured byForbes) in the world labor force and in OECDemployment has fallen slightly since 1994 (fig-ure 2.7).11 The declining share of the largecompanies’ employment levels is consistentwith the trend for the United States reportedby White (2001, 2002). Despite the mergerwave of the 1990s, very large companies have
G L O B A L E C O N O M I C P R O S P E C T S 2 0 0 3
50
10
0
1985
1986
1987
1988
1989
1990
1991
1992
1993
1994
1995
1996
1997
1998
1999
2000
20
30
40
50
60
70
80
Source: White (2001).
Figure 2.6 U.S. aggregate concentrationhas held steady
Share of top 500 companies of U.S. private sector
Payroll
Profits
Employment
(percent)
gep_ch02.qxd 12/5/02 2:53 PM Page 50
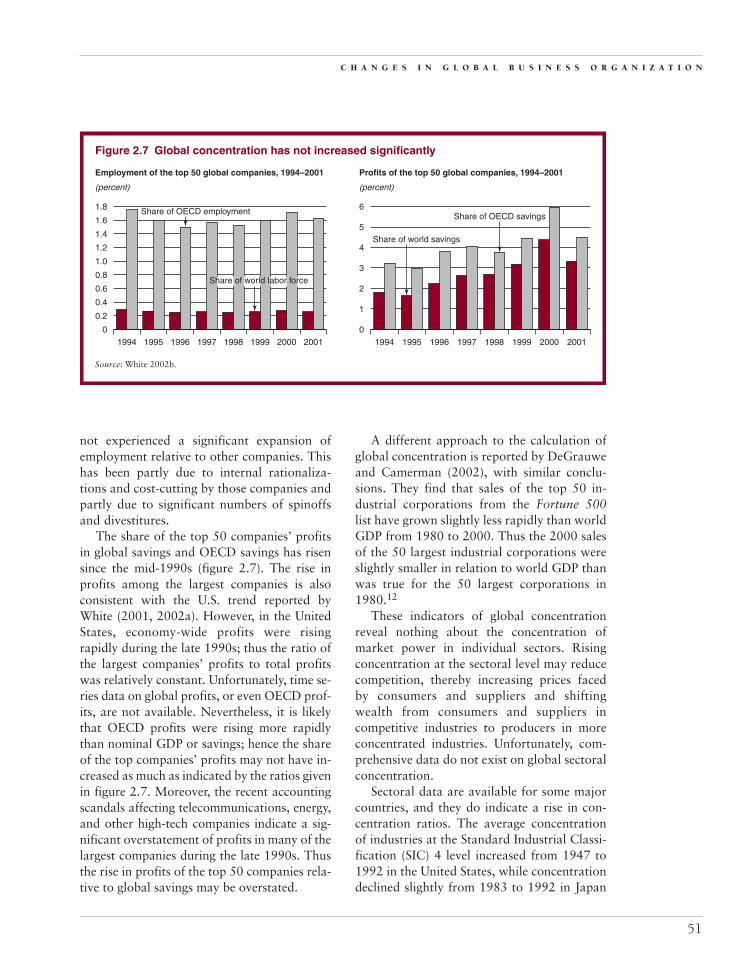
not experienced a significant expansion ofemployment relative to other companies. Thishas been partly due to internal rationaliza-tions and cost-cutting by those companies andpartly due to significant numbers of spinoffsand divestitures.
The share of the top 50 companies’ profitsin global savings and OECD savings has risensince the mid-1990s (figure 2.7). The rise inprofits among the largest companies is alsoconsistent with the U.S. trend reported byWhite (2001, 2002a). However, in the UnitedStates, economy-wide profits were risingrapidly during the late 1990s; thus the ratio ofthe largest companies’ profits to total profitswas relatively constant. Unfortunately, time se-ries data on global profits, or even OECD prof-its, are not available. Nevertheless, it is likelythat OECD profits were rising more rapidlythan nominal GDP or savings; hence the shareof the top companies’ profits may not have in-creased as much as indicated by the ratios givenin figure 2.7. Moreover, the recent accountingscandals affecting telecommunications, energy,and other high-tech companies indicate a sig-nificant overstatement of profits in many of thelargest companies during the late 1990s. Thusthe rise in profits of the top 50 companies rela-tive to global savings may be overstated.
A different approach to the calculation ofglobal concentration is reported by DeGrauweand Camerman (2002), with similar conclu-sions. They find that sales of the top 50 in-dustrial corporations from the Fortune 500list have grown slightly less rapidly than worldGDP from 1980 to 2000. Thus the 2000 salesof the 50 largest industrial corporations wereslightly smaller in relation to world GDP thanwas true for the 50 largest corporations in1980.12
These indicators of global concentrationreveal nothing about the concentration ofmarket power in individual sectors. Risingconcentration at the sectoral level may reducecompetition, thereby increasing prices facedby consumers and suppliers and shiftingwealth from consumers and suppliers incompetitive industries to producers in moreconcentrated industries. Unfortunately, com-prehensive data do not exist on global sectoralconcentration.
Sectoral data are available for some majorcountries, and they do indicate a rise in con-centration ratios. The average concentrationof industries at the Standard Industrial Classi-fication (SIC) 4 level increased from 1947 to1992 in the United States, while concentrationdeclined slightly from 1983 to 1992 in Japan
C H A N G E S I N G L O B A L B U S I N E S S O R G A N I Z A T I O N
51
01994 1995 1996 1997 1998 1999 2000 2001
0.2
0.4
0.6
0.8
1.0
1.2
1.4
1.6
1.8
Source: White 2002b.
Share of world labor force
Share of OECD employment
Employment of the top 50 global companies, 1994–2001
(percent)
Figure 2.7 Global concentration has not increased significantly
1994 1995 1996 1997 1998 1999 2000 2001
Share of world savings
Share of OECD savings
Profits of the top 50 global companies, 1994–2001
(percent)
0
1
2
3
4
5
6
gep_ch02.qxd 12/5/02 2:53 PM Page 51

before increasing sharply in 1992–98.13
However, sectoral concentration ratios at thecountry level provide little information on thecompetitiveness of markets, because most ofthose companies face competition from im-ports. Indeed, the rapid rise in world tradeover the past two decades, coupled with theemergence of developing-country exporters,indicates that competitive pressures may haveincreased in many industries.14
Despite the difficulties in measuring globalsectoral concentration ratios and in determin-ing the implications for competition, anticom-petitive practices have clearly affected someindustries. The 1990s saw the uncovering of alarge number of international cartels, in whichfirms from more than one country madeexplicit agreements to fix prices, divide up mar-kets, or rig bids for contracts (see chapter 4).
The rise in service sector FDI
FDI flows into services have overtakenthose in manufacturing—Service sector FDI has grown rapidly over thepast few decades, and services are now thedominant sector for foreign investment.15
The stock of FDI in services was only aboutone-fifth of the total in the 1950s (UnitedNations 1989), but by the mid-1970s theshare of services in the stock of outward FDIof major industrial countries ranged mostlybetween 30 and 40 percent.16 By 1990, thisshare rose to between 45 and 60 percent, andover the past decade, FDI in services has con-tinued to rise more rapidly than FDI in man-ufacturing in both developing and industrialcountries (table 2.1). By the end of the 1990s,services accounted for more than half of thestock of inward FDI in most major industrialcountries (figure 2.8). Despite the rapidincrease in service sector FDI, the global ratioof FDI to value added in services remains lessthan half the ratio of FDI to value added inmanufacturing, thus indicating the potentialfor further increases in service sector FDI.The dominance of service sector FDI under-
lines the importance of an effective regulatoryregime, because designing and enforcing anappropriate regulatory framework is moredifficult in many service sectors (such asnatural monopolies in infrastructure) than inmanufacturing.
G L O B A L E C O N O M I C P R O S P E C T S 2 0 0 3
52
Table 2.1 FDI inward stocks in servicesand manufacturing, 1988–99(growth rate and shares in dollars)
Growth rate,1988–99 Share,
(percent change 1999per year) (percent)
World:Total FDI 12.3Manufacturing 12.2 41.6Services 13.8 50.3
Industrial countries:Total FDI 9.9Manufacturing 9.1 36.4Services 11.6 55.5
Developing countries:Total FDI 21.5Manufacturing 19.6 54.5Services 28.2 37.3
Note: Second column data for France are from 1998, andsecond column data for Japan are from 1994.Source: UNCTAD (2001).
France
(percent)
Germany Italy Japan UnitedKingdom
UnitedStates
Source: OECD (2001) and OECD online database.
Figure 2.8 Share of FDI in the servicesector increased in major industrialcountries
0
10
20
30
40
50
60
70
80
90
1988
1999
gep_ch02.qxd 12/5/02 2:53 PM Page 52

—reflecting the rising role of services inthe global economy—FDI in services has increased relative to man-ufacturing, in part because of the growingimportance of the service sector in economicactivity. By the late 1990s, the service sectorhad increased from half of global output in theearly 1970s to 64 percent. Income growth hasbeen the driving force behind the rise in ser-vices: cross-country comparisons show thatthe richest countries have the greatest shareof services. Services account for 70 percent ofoutput in industrial countries, 55 percentin middle-income countries, and 44 percent inlow-income countries. The correlation coeffi-cient between income level and the share ofservices is 0.6. The relationship betweenhigher income and a greater share of servicesin part reflects consumer demand, becauseluxuries such as travel and entertainmentoften have a large services component. Also,higher incomes permit an allocation of moreresources toward protecting assets (insuranceand legal services), richer and complex soci-eties require more resources devoted to educa-tion and advisory services, and technologicaladvances associated with higher income widenthe scope for the protection of health. Finally,the higher labor intensity of services and risingreal wages have increased the nominal valueof services relative to manufacturing.
—technological changes that haveincreased the demand and supply of services—Technological progress has tended to increasethe demand for services connected with theproduction of goods and to facilitate the sepa-ration of goods production from services pro-duction.17 The larger scale of production, thegreater technological sophistication of goods,and the increased trade in goods and manage-ment of enterprises across large distances haveall contributed to the greater demand for ser-vices. The importance of management, market-ing, distribution, and after-sale maintenancehas risen relative to the value of manufacturedproducts. Many information-and-knowledge-
intensive services—research and development(R&D), engineering, design, computing anddata processing, inventory management, qual-ity control, design, accounting, legal services,personnel services, and so on—have become acritical part of the production process in themanufacturing sector. With modern manufac-turing production and distribution becomingincreasingly dependent on the processing anddissemination of information, the demand forthose producer services is rising rapidly.
Moreover, the growing sophistication andvariety of services, coupled with specializationemerging from economies of scale, have ledmanufacturing firms to rely more on out-sourcing than on in-house departments toprovide the services necessary for production.The immediate consequence is a statisticaleffect: the size of the service sector rises whenservices that were previously classified asmanufacturing output are suddenly countedas services. Typical examples of these types ofservices are accounting, computer services(data processing and software), warehousing,public relations, information technology, andmanagement information systems.
Technological progress has greatly reducedthe cost of some services, thus increasing thescope of services that are feasible to supply(for example, mobile telephones, complexfinancial transactions such as derivatives, anda host of other services facilitated throughadvanced data processing). Technologicalprogress has also generated new means ofdelivering services (for example, the dissemi-nation of research over the Internet). Thisprocess is similar to what occurred during theindustrial revolution, when technologicalprogress and income growth greatly increasedthe importance of manufactures when com-pared with the primary sector.
Both the reduced cost of some services andthe increased scope of services have increasedthe tradability of services, a trend that has,in part, been exploited through increased FDI.For example, software can be produced inlow-cost locations such as India and solddirectly to firms and consumers in the United
C H A N G E S I N G L O B A L B U S I N E S S O R G A N I Z A T I O N
53
gep_ch02.qxd 12/5/02 2:53 PM Page 53

States over the Internet. Many multinationalshave established centers in developing coun-tries, where wages are low, to handle contactswith consumers in industrial countries. Forexample, call centers in the Caribbean managephone calls to multinationals from U.S. clients(this is an example of participation of servicefirms in production networks; see page 13 foran elaboration of this concept in manufactur-ing). In some cases, the rising tradability ofservices may have reduced FDI by enablingfirms to provide services at a distance ratherthan establishing a subsidiary. However, ingeneral, increased tradability has created newopportunities for multinationals’ subsidiariesto export services to home markets and, insome cases, to operate as international hubsto supply services to firms in other countries.Because industrial countries are the lead con-sumers of tradable services, developing coun-tries have benefited from the establishmentof subsidiaries to service the richer markets.Technological advances that increase servicestradability have also imparted an advantagein service delivery to multinationals relative todomestic firms, thus enabling the former toovercome the natural advantages of proximityand knowledge of the market (Sauvant andMallampally 1996).
Income growth and technological progresshave boosted the provision of services throughvarious forms of cross-border relationshipsin several sectors: (a) management and fran-chise contracts in hotels, restaurants, and carrentals (in which performance requirementscan often be adequately codified, local man-agerial input is desirable, and the synergisticadvantages of global reservations and referralsystems can be obtained without the risks andcosts involved in an equity stake); (b) jointventures in some business services, in recre-ational activities, in some accounting and legalservices, and in civil engineering in turnkeyprojects (in which individual customizationand specialized knowledge of local practicesare required); and (c) services in which a localpartner is required for marketing and dist-ribution (Dunning 1981). Firms that tend to
provide services through subsidiaries, ratherthan other kinds of relationships, include(a) financial institutions, in which much ofproprietary knowledge is tacit, is expensive toproduce, and is complex and idiosyncratic;(b) firms that require control over productionto maximize efficiency and to protect thequality of the end product (and thus customergoodwill) for trademarks (for example, inadvertising, market research, construction,business consulting, consumer-oriented ser-vices, and goods-related personal services suchas motor vehicle maintenance and repair); and(c) trade-related service affiliates set up bynon-service multinationals to obtain inputsfor domestic activities or to supply markets.
—and policy changes that encourage the private provision of servicesThe removal of restrictions on FDI and regula-tory reforms that have improved competitionin service sectors have contributed to the rise inservice sector FDI. Until recently, many coun-tries (including many industrial countries) pro-hibited foreign investment in sectors such astransport, communications, banking, finance,utilities, and media. Since the mid-1980s,governments in both industrial and develop-ing countries have been gradually opening upthose service sectors to foreign investment.18
Multinationals can enhance the efficiencyof services industries in developing countriesby providing services that developing-countrysuppliers cannot provide, as well as by intensi-fying competition. In particular, providingproducer services (for example, managerialservices, engineering, finance, and marketing)that are often subject to economies of scale andthat have a much higher cost from a distancecan generate important benefits to developing-country firms. Availability of producer servicesmay be an important reason to form industrialcomplexes and may explain a significant shareof the differences in economic performanceamong regions. Producer services are likely tobe provided through FDI (rather, for example,than through training unaffiliated firms)because they involve knowledge-based assets
G L O B A L E C O N O M I C P R O S P E C T S 2 0 0 3
54
gep_ch02.qxd 12/5/02 2:53 PM Page 54

that are easily copied if firms lose controlover the knowledge (Markusen, Rutherford,and Tarr 2000). FDI has surged in developingcountries’ banking sectors, in many cases re-ducing the costs of financial intermediation,increasing the scope of financial services avail-able to local firms, and transferring skills toworkers in developing countries.19
Global production networks
The globalization of production hashelped fuel the growth in global tradeRapid growth in trade and in FDI flows hasreflected, in part, the expansion of productionnetworks.20 The production of many finalgoods, which formerly took place in one loca-tion, has been broken down into discrete steps,with each step moved to locations where itcan be performed at the lowest cost (Venables1999; Kimura 2001). Thus a significant por-tion of international trade and FDI has shiftedfrom the exchange and production of finalconsumer goods to the exchange and produc-tion of parts and components. This global-ization of producing individual goods hasprogressed to the point that it can become dif-ficult to identify the nationality of some prod-ucts. For example, the World Trade Organiza-tion (WTO [1998]) gives figures for the shareof value added in producing a U.S. automobile,with countries grouped by category of pro-duction. The United States accounts for only37 percent of value added (figure 2.9).
There is considerable evidence that theshare of global trade accounted for by net-works is increasing, although the resultsvary among countries and studies. Baldone,Sdogati, and Tajoli (2002) estimate that theshare of intermediate products in total tradewithin the European Union (EU) rose onlyslightly in the 1990s, from 17 percent in 1990to 19 percent in 1999.21 One measure of inter-national outsourcing—the ratio of imported tototal intermediate inputs in manufacturing—doubled in the United States from 1974 to1993 and increased in Canada and the
United Kingdom, although it fell in Japan(figure 2.10). Using input-output tables,Hummels, Rappaport, and Yi (1997) calculatethat the fraction of the total value of tradeaccounted for by inputs that are bothimported and then embodied in exports rosein France, the United Kingdom, and theUnited States from 1970 to 1990, while drop-ping slightly in Japan.22 Data from the U.N.Comtrade database show that exports ofparts and components—a proxy for participa-tion in global networks—increased by almost2 percentage points faster than exports oftotal manufactured goods from 1981 to 2000(table 2.2).23
The rise in the share of trade accounted forby global networks in part reflects the increas-ing importance in global production of goods
C H A N G E S I N G L O B A L B U S I N E S S O R G A N I Z A T I O N
55
Source: WTO (1998).
Figure 2.9 U.S. cars are produced inmany countries(percent share in value added)
0
10
20
30
40
Kore
a, R
ep. o
f
Japa
n
Ger
man
yTa
iwan
(Chi
na)
and
Sing
apor
eU
nite
dKi
ngdo
mIre
land
and
Barb
ados
Uni
ted
Stat
es
Table 2.2 Growth of exports of parts andcomponents, 1981–2000(average annual percentage change in dollars)
1981–90 1990–2000
Manufactured exports 10.6 7.2Parts and components exports 12.1 9.6Memo item: Share of parts
and components 13.2 18.5
Source: U.N. Comtrade database.
gep_ch02.qxd 12/5/02 2:53 PM Page 55
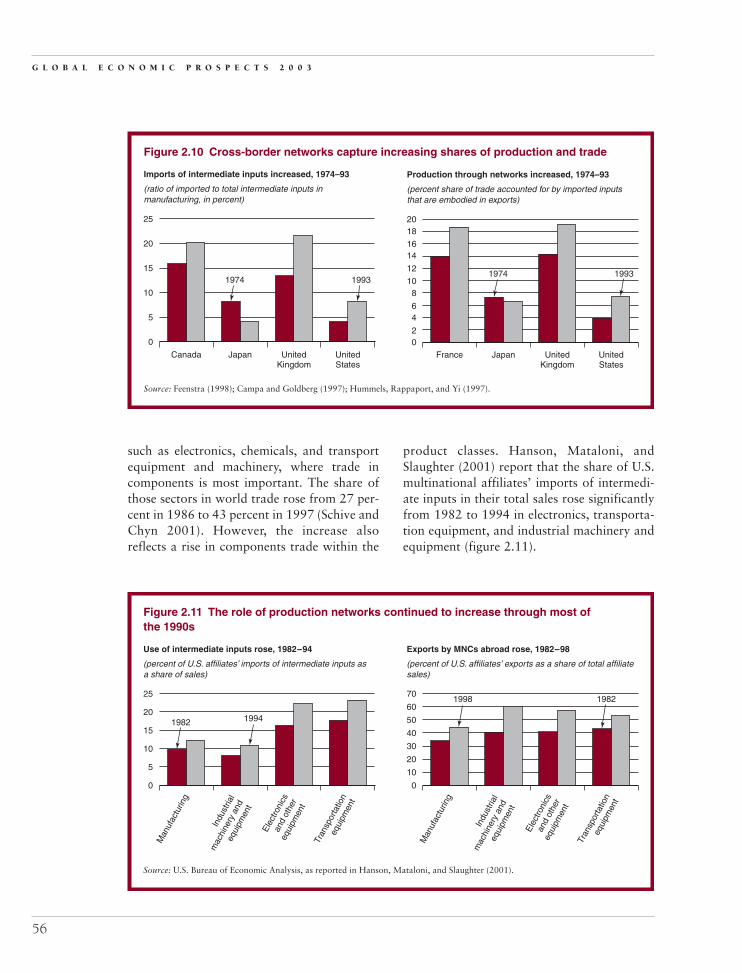
such as electronics, chemicals, and transportequipment and machinery, where trade incomponents is most important. The share ofthose sectors in world trade rose from 27 per-cent in 1986 to 43 percent in 1997 (Schive andChyn 2001). However, the increase alsoreflects a rise in components trade within the
product classes. Hanson, Mataloni, andSlaughter (2001) report that the share of U.S.multinational affiliates’ imports of intermedi-ate inputs in their total sales rose significantlyfrom 1982 to 1994 in electronics, transporta-tion equipment, and industrial machinery andequipment (figure 2.11).
G L O B A L E C O N O M I C P R O S P E C T S 2 0 0 3
56
Source: Feenstra (1998); Campa and Goldberg (1997); Hummels, Rappaport, and Yi (1997).
Imports of intermediate inputs increased, 1974–93
(ratio of imported to total intermediate inputs inmanufacturing, in percent)
Figure 2.10 Cross-border networks capture increasing shares of production and trade
0
5
10
15
20
25
UnitedStates
UnitedKingdom
JapanCanada
1974
Production through networks increased, 1974–93
(percent share of trade accounted for by imported inputsthat are embodied in exports)
02
46
810
12
1416
1820
UnitedStates
UnitedKingdom
Japan
1974
France
19931993
0
5
10
15
20
25
Source: U.S. Bureau of Economic Analysis, as reported in Hanson, Mataloni, and Slaughter (2001).
Figure 2.11 The role of production networks continued to increase through most ofthe 1990s
Use of intermediate inputs rose, 1982–94
(percent of U.S. affiliates’ imports of intermediate inputs asa share of sales)
Exports by MNCs abroad rose, 1982–98
(percent of U.S. affiliates’ exports as a share of total affiliatesales)
0
10
20
30
40
50
60
70
Tran
spor
tatio
neq
uipm
ent
Elec
troni
csan
d ot
her
equi
pmen
t
Indu
stria
l
mac
hine
ry a
ndeq
uipm
ent
Man
ufac
turin
g
Tran
spor
tatio
neq
uipm
ent
Elec
troni
csan
d ot
her
equi
pmen
t
Indu
stria
l
mac
hine
ry a
ndeq
uipm
ent
Man
ufac
turin
g
1982 1994
19821998
gep_ch02.qxd 12/5/02 2:53 PM Page 56

The establishment of global networks hasbeen facilitated by technology—Technological progress in transport, commu-nications, and data processing has fueledincreased FDI flows and the establishmentof cross-border production networks. A nearly70 percent decline in sea freight unit costsbetween the early 1980s and the mid-1990s(in part caused by a rise in the share of cargocarried in containers; see World Bank 1997)24
and an increased reliance on air shipments,plus the growth of express services (such asovernight and two-day delivery)25 have facili-tated the shipment of components for pro-cessing in different locations. The low cost oflong-distance telephone rates, the develop-ment of fax machines, and, most recently, theadvent of the Internet have made it easier formultinationals to closely coordinate produc-tion at dispersed locations. Those changeshave also greatly reduced the costs of findingand evaluating potential suppliers for morearm’s-length transactions (Grossman andHelpman 2002). Finally, an increased abilityto process and analyze vast amounts of datahas facilitated the management of globalnetworks. Electronic data interchange (EDI)
systems greatly reduce the costs of procure-ment and improve the coordination of pro-duction across dispersed factories by automat-ing the processing of routine transactions(Chen 1996).
—policy improvements—Improvements in economic policies, notablythe decline in barriers to trade, have also con-tributed to forming cross-border productionnetworks. Successive rounds of multilateralnegotiations reduced average tariffs on manu-factured products in industrial countries from10 percent in 1980 to 5 percent by 1998. Theaverage tariff rate in developing countries fellfrom between 25 and 30 percent in the early1980s to 13 percent by 1998 (figure 2.12).Even relatively low tariff rates can have asignificant role in deterring the formationof cross-border networks, because goods oftenpass through borders several times in thecourse of production (Navaretti, Haaland,and Venables 2000), and the gross marginsof manufacturing companies are often lowerthan 5 percent.26 Hanson, Mataloni, andSlaughter (2002) find that tariffs are an im-portant determinant of the size of intermediate
C H A N G E S I N G L O B A L B U S I N E S S O R G A N I Z A T I O N
57
0
35
30
25
20
15
10
5
1980 1984
Note: Unweighted average of ad valorem, applied, or MFN rates, whichever data are available for a longer period.Source: U.N. Comtrade database.
Figure 2.12 Tariff rates fell in the last two decades
Average tariff rates, 1980–98
(percent)
1988 1990 1992 1994 1996 1998
Industrial countries
Developing countries
0
6
5
4
3
2
1
1988–90 1991–93 1995–97 1998–2001
Industrial countries’ tariffs on parts and components,1988–2001
(average tariff on imports from industrial countries,in percent)
gep_ch02.qxd 12/5/02 2:53 PM Page 57
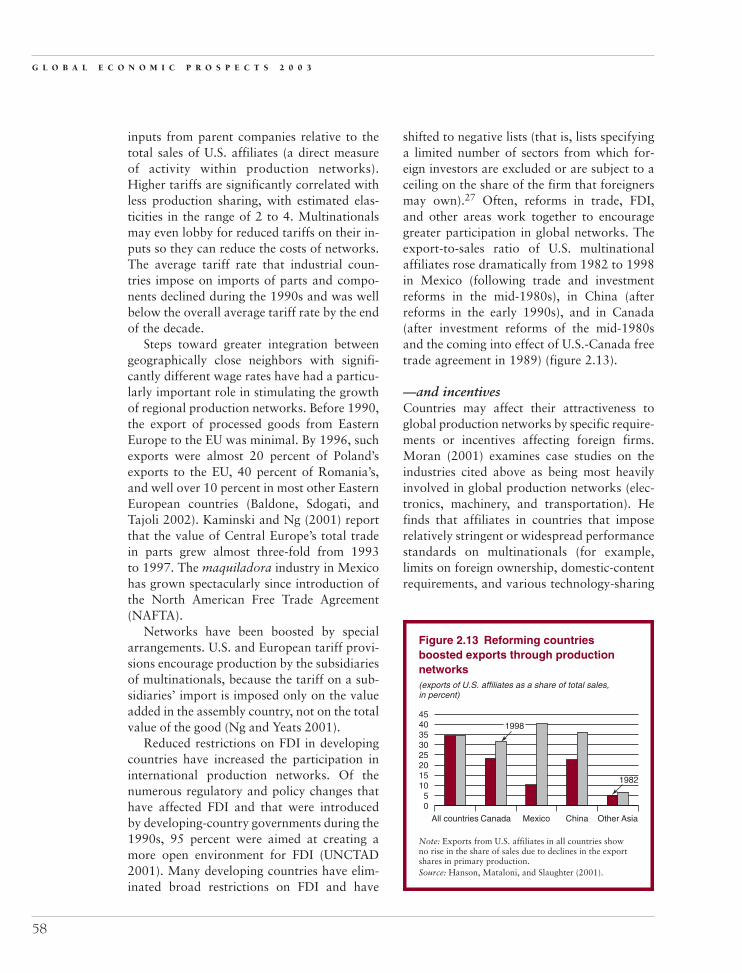
inputs from parent companies relative to thetotal sales of U.S. affiliates (a direct measureof activity within production networks).Higher tariffs are significantly correlated withless production sharing, with estimated elas-ticities in the range of 2 to 4. Multinationalsmay even lobby for reduced tariffs on their in-puts so they can reduce the costs of networks.The average tariff rate that industrial coun-tries impose on imports of parts and compo-nents declined during the 1990s and was wellbelow the overall average tariff rate by the endof the decade.
Steps toward greater integration betweengeographically close neighbors with signifi-cantly different wage rates have had a particu-larly important role in stimulating the growthof regional production networks. Before 1990,the export of processed goods from EasternEurope to the EU was minimal. By 1996, suchexports were almost 20 percent of Poland’sexports to the EU, 40 percent of Romania’s,and well over 10 percent in most other EasternEuropean countries (Baldone, Sdogati, andTajoli 2002). Kaminski and Ng (2001) reportthat the value of Central Europe’s total tradein parts grew almost three-fold from 1993to 1997. The maquiladora industry in Mexicohas grown spectacularly since introduction ofthe North American Free Trade Agreement(NAFTA).
Networks have been boosted by specialarrangements. U.S. and European tariff provi-sions encourage production by the subsidiariesof multinationals, because the tariff on a sub-sidiaries’ import is imposed only on the valueadded in the assembly country, not on the totalvalue of the good (Ng and Yeats 2001).
Reduced restrictions on FDI in developingcountries have increased the participation ininternational production networks. Of thenumerous regulatory and policy changes thathave affected FDI and that were introducedby developing-country governments during the1990s, 95 percent were aimed at creating amore open environment for FDI (UNCTAD2001). Many developing countries have elim-inated broad restrictions on FDI and have
shifted to negative lists (that is, lists specifyinga limited number of sectors from which for-eign investors are excluded or are subject to aceiling on the share of the firm that foreignersmay own).27 Often, reforms in trade, FDI,and other areas work together to encouragegreater participation in global networks. Theexport-to-sales ratio of U.S. multinationalaffiliates rose dramatically from 1982 to 1998in Mexico (following trade and investmentreforms in the mid-1980s), in China (afterreforms in the early 1990s), and in Canada(after investment reforms of the mid-1980sand the coming into effect of U.S.-Canada freetrade agreement in 1989) (figure 2.13).
—and incentivesCountries may affect their attractiveness toglobal production networks by specific require-ments or incentives affecting foreign firms.Moran (2001) examines case studies on theindustries cited above as being most heavilyinvolved in global production networks (elec-tronics, machinery, and transportation). Hefinds that affiliates in countries that imposerelatively stringent or widespread performancestandards on multinationals (for example,limits on foreign ownership, domestic-contentrequirements, and various technology-sharing
G L O B A L E C O N O M I C P R O S P E C T S 2 0 0 3
58
05
101520253035
4540
Other AsiaChinaMexicoCanadaAll countries
Note: Exports from U.S. affiliates in all countries showno rise in the share of sales due to declines in the exportshares in primary production.Source: Hanson, Mataloni, and Slaughter (2001).
Figure 2.13 Reforming countriesboosted exports through productionnetworks(exports of U.S. affiliates as a share of total sales,in percent)
1982
1998
gep_ch02.qxd 12/5/02 2:53 PM Page 58

mandates) are much less productive, use oldertechnology, and take longer to introduce newprocesses and products than affiliates in coun-tries that do not impose such requirements.Thus, FDI to countries with strict require-ments is more likely to be directed at localmarkets, because participation in networksoften requires the latest technology.
Global networks can be structured in many waysGlobal networks are achieved through a rangeof ownership structures, from conductingarm’s-length transactions (for example, tradein standardized parts sold in organized mar-kets) to establishing a subsidiary for produc-ing components that are custom-made for
particular products (Arndt 2001). A spectrumof choices exists, and each involves someform of relationship between supplier andpurchaser.28 The major advantage that multi-nationals have over local firms is typically tech-nology, and protecting that advantage is a keyconsideration in determining the structure of aglobal network (Ethier and Markusen 1996).29
Because it can be difficult to maintain controlover technology in arm’s-length arrangements,FDI is often the preferred choice (Hoon andHo 2001).30 This preference is reflected in therise in the share of intra-firm trade in multina-tionals’ exports, at least as far as developingcountries are concerned (box 2.1).
There are disadvantages, however, to es-tablishing a network through FDI. Securing
C H A N G E S I N G L O B A L B U S I N E S S O R G A N I Z A T I O N
59
The boom in FDI flows during the 1990s wasassociated with only a small rise in the share of
intra-firm trade in U.S. exports during the 1990s (seebox figure 1).31 By contrast, the share of intra-firmexports in Japanese trade almost doubled during thisperiod. The failure of U.S. outward FDI flows (thestock of which nearly tripled in the 1990s) to resultin a sharper increase in the share of intra-firm tradeprobably reflects the dominance of M&A trans-
Box 2.1 Intra-firm trade increases worldwide
JapanUnited States0
5
10
15
20
25
30
35
40
Intra-firm trade has increased(percent share of intra-firm exports in total exports)
Source: OECD (2001).
1990
1999
105
2015
3025
4035
5045
1977 1983 1993 19990
Manufactures Services
Intra-firm trade in services is becomingmore important(percent share of intra-firm exports in total U.S. MNCexports)
Source: OECD (2001).
actions rather than greenfield investments. Thetransfers of ownership involved in such transactionswould not necessarily have a significant effect ontrade flows. If one looks at longer time series, thereis some evidence that intra-firm trade has becomemore important for U.S. multinationals, particularlyin services (box figure 2).
gep_ch02.qxd 12/5/02 2:53 PM Page 59

G L O B A L E C O N O M I C P R O S P E C T S 2 0 0 3
60
Intra-firm trade includes production that isshared among locations in global networks, as wellas trade in finished products for marketing and dis-tribution in foreign countries. There is some evidencethat production through networks has become moreimportant over time. The share of exports of inter-mediate goods to overseas manufacturing affiliates intotal Japanese exports rose from 20 percent in 1994to 29 percent in 1999. Products intended for furtherprocessing increased from 57 percent of U.S. multi-nationals’ exports to foreign-owned affiliates in 1989to 68 percent in 1999 (Mataloni and Yorgason 2002).Trade among foreign affiliates of U.S. multinationalshas also expanded, which probably indicates that net-works have become more complex over time. Theshare of intra-firm exports of foreign subsidiariesaccounted for by exports to other subsidiaries (ratherthan to the parent company) rose from 53 percent in1983 to 66 percent in 1999 (box figure 3). This riseis almost totally due to an increase in foreign affiliatetrade among developing countries, from 30 percentof U.S. multinationals’ intra-firm trade in 1983 to51 percent in 1999. Production networks appear tobe less important in intra-firm trade among industrialcountries, given their more similar labor costs. Forexample, 90 percent of intra-firm exports fromforeign multinationals to U.S. affiliates are finishedgoods for direct distribution to the U.S. market. Thepicture that emerges is that total intra-firm exports
by U.S. multinationals have increased only slightlymore rapidly than have total U.S. exports. However,a growing share of this trade is devoted to productionnetworks, which increasingly involve developingcountries.
Box 2.1 (continued)
0
10
20
30
40
50
60
70
Source: OECD (2001).
Developingcountries
Industrialcountries
Allcountries
Trade among U.S. affiliates is rising inthe developing world(percent share of intra-firm exports in total U.S. MNCexports)
1983
1993
1999
intermediate inputs through contracts withlocal firms often entails lower administrativecosts than establishing a subsidiary. The multi-national is free to specialize in providing tech-nology, marketing, and distribution services,while a local partner may be better situatedto handle the personnel and regulatory issuesinvolved in establishing a company. Moreover,some multinationals outsource a substantialshare of manufacturing, because contractmanufacturers may be better placed thanmultinationals to absorb the risk from rapidproduct obsolescence (Ernst 2002). Contractmanufacturers that produce components forwell-known multinationals grew rapidly dur-
ing the 1990s and now account for 20–30 per-cent of total electronics production.
Developing countries have increased their participation in global networksDeveloping countries have been increasinglyinvolved in the international networks thatmanage the production and trade of interme-diate goods. Differences in wage levels have ledfirms to locate in developing countries thoseportions of the production chain that are in-tensive in manual labor, while locating at homethe technically skilled labor (such as that in-volved in R&D, management, and marketing)
gep_ch02.qxd 12/5/02 2:53 PM Page 60

Access to networks among developingcountries is highly concentratedDeveloping countries’ participation in globalnetworks is highly concentrated, particularlyin East Asia. The top five developing-countryexporters of parts and components (China,Mexico, Republic of Korea, Malaysia, andThailand) accounted for 78 percent of devel-oping countries’ exports of parts and compo-nents, and the next five largest developingcountries accounted for about 14 percent (fig-ure 2.16). Developing countries outside the top10 made up only about 8 percent. By contrast,
C H A N G E S I N G L O B A L B U S I N E S S O R G A N I Z A T I O N
61
Developing countriesHigh-income countries
0
5
10
15
20
25
1981–90
1990–2000
Source: U.N. Comtrade and World Bank.
Figure 2.14 Parts and componentsexports grew rapidly, 1981–2000(percent per annum)
Source: U.N. Comtrade and World Bank.
Figure 2.15 Developing countries’ share of global parts and component exports rosebetween 1981 and 2000
Other developingcountries
1
Developing East Asia3
High-income countries96
Percent share of parts and components trade, 1981
Other developingcountries
14
Developing East Asia7
High-income countries79
Percent share of parts and components trade, 2000
(Hanson, Mataloni, and Slaughter 2001;Filipe, Fontoura, and Saucier 2002). Multina-tionals operating in developing countries aremore likely to be part of a network (as opposedto supplying the host market) than are multi-nationals in industrial countries. The share ofU.S. affiliate production that is sold back tothe United States is more than twice as highfor developing countries as it is for industrialcountries (Shatz and Venables 2000).
Data on parts and components exports,which are a proxy for participation in net-works, confirm the growing participation ofdeveloping countries.32 Their exports of partsand components increased by almost 18 per-cent per year in the 1980s and by 22.5 percentin the 1990s (in U.S. dollar terms), almostthree times more rapidly than such exportsof high-income countries in the latter period(figure 2.14). As a result, the share of develop-ing countries in global parts and componentsexports increased from 4 percent in 1981 to21 percent in 2000 (figure 2.15). By contrast,the share of developing countries in exportsof world manufactures rose much moreslowly, from 16 percent in 1981 to 22 percentin 2000, while developing countries’ share oftotal trade fell slightly (largely caused by thefall in commodity prices).
gep_ch02.qxd 12/5/02 2:53 PM Page 61

the top 10 countries accounted for 63 percentof developing countries’ total exports and75 percent of their manufactured exports.Thus trade of parts and components is muchmore concentrated than total or manufac-tures trade. All top 10 countries (except Brazil)either are from East Asia or are participatingin regional arrangements—with the UnitedStates or the EU—that provide for low tradebarriers and long-term arrangements to in-crease trade integration. By contrast, countriesthat have limited ties to major industrial coun-try markets, that lack adequate infrastructure(particularly transport facilities) or a suffi-ciently educated work force, that are subjectto high risks as a result of poor governance orweak institutions, or that have pursued poli-cies that erode incentives for private sectorinvestment have minimal participation inglobal networks. South Asia, Sub-SaharanAfrica, and the Middle East and North Africatogether account for only 2 percent of devel-oping countries’ parts and componentsexports (and two-thirds of that amount isfrom South Africa and India), compared with11 percent of developing countries’ total man-ufactured exports.
Networks help improve the allocation of resourcesGlobal production networks break the pro-duction of a given final good into a set of con-stituent activities that vary in the intensity ofcapital, skilled labor, unskilled labor, andother production requirements. Instead ofmaking entire products, developing countriescan be involved in just those stages of products(for example, labor-intensive stages) that bestsuit their mix of endowments. This approachenables developing countries to shift moreresources to activities in which they have acomparative advantage, particularly the fast-growing segments that require large laborinputs in one or more stages of the manufac-turing chain. Developing countries’ participa-tion in global networks has enabled thosecountries to increase their share of the world’sfastest-growing export products (transistorsand semiconductors, computers, and computerand office machine parts) from 2.4 percent in1980 (about the same as the share of thoseproducts in global exports) to 16.3 percent by1998 (almost 7 percentage points higher thanthe share of such products in global exports)(table 2.3).
Participating in networks may help dampenthe effect of adverse shocks. Multinationalsmay have an interest in maintaining the oper-ations of firms with which they have close ties,either in the form of investment or long-termcontracting relationships. Some authors haveargued that intra-firm trade is less respon-sive to changes in relative prices than is tradebetween firms, because multinationals will beconcerned with the effect of their production
G L O B A L E C O N O M I C P R O S P E C T S 2 0 0 3
62
Oth
er d
evel
opin
gco
untri
es
Tota
l, ne
xt fi
ve
Thai
land
Mal
aysi
a
Kore
a, R
ep. o
f
Mex
ico
Chi
na
Source: U.N. Comtrade and World Bank.
Figure 2.16 Developing countries’ partsand component exports are highlyconcentrated, 2000(percent share of total)
0
5
10
15
20
25
30
Table 2.3 Export activity for productgroups with the fastest growth in worldexports, 1980–98(percent)
1980 1998
Share in world exports 2.6 9.7Share in developing-country
exports 2.4 16.3
Source: UNCTAD (2002).
gep_ch02.qxd 12/5/02 2:53 PM Page 62

decisions on the survival of foreign affiliates(Cho 1990; Helleiner 1978).33 Thus multi-nationals may lend funds to subsidiaries suf-fering temporary shocks or may provide thebacking necessary for them to access creditmarkets.
Long-term contracts that have been enteredthrough networks may help firms survivesevere shocks. For example, exports from thePhilippines maintained double-digit growthrates in 1998, while other countries in theregion saw outright declines in exports be-cause of the crisis. This performance was prin-cipally due to the high growth in electronicsexports (while exports of consumer goodslanguished), and almost all of the Philippines’electronic exports come from affiliates ofmultinationals. The arrangements in placemeant that a substantial share of thePhilippines’ production was booked well inadvance (typically one year), which helped thecountry maintain output growth during thedownturn in demand (World Bank 1999).
Networks may boost access totechnology—Participating in global networks may improvedeveloping countries’ access to technology.Multinationals typically possess knowledgeassets such as patents, proprietary technology,trademarks, and so forth that can be deployedin plants outside the parent country (seeDunning 1981). Blomström and Kokko (1998)describe how multinationals typically haveproprietary technology that enables them tocompete against local firms, which presumablyhave superior knowledge of local markets andbusiness practices. Approximately 90 percentof the world’s R&D is carried out in five coun-tries (the United States, the United Kingdom,France, Germany, and Japan) that are amongthe largest source countries for world FDIflows (Keller 2001).
—which may be an important source ofgrowth potentialAccess to technology is particularly importantfor developing countries, which tend to import
a large share of technical advances. Using in-ternational patent data, Eaton and Kortum(1999) find that even the major industrialcountries (the United States, Japan, Germany,the United Kingdom, and France) generallyadopt from one-half to three-fourths of theirinnovations from abroad, and that the UnitedStates is the only country that derives most ofits growth from its own innovations (see alsoKeller 2001). Because developing countriesspend a lot less than industrial countries onbasic research, they are even more dependenton foreign sources of technology. Thus thepotential for increasing access to technologyas a result of participation in trade and FDImay be great (Keller 2002).
In part, benefits from the transfer of tech-nology are directly captured by the local firmor subsidiary participating in a network.Technology is transferred from the parent toa subsidiary, or a local exporter may purchasetechnology as a condition of participatingin a network. One piece of microeconomicevidence consistent with rising intra-firmknowledge transfer is the rising share ofmultinationals’ R&D performed by foreignaffiliates. The U.S. Bureau of EconomicAnalysis (BEA) reports that, in 1982, affiliatesof U.S. multinationals performed 6.4 percentof worldwide R&D for these firms. By 1994,that share had nearly doubled, to 11.5 per-cent. This form of technology transfer mayincrease domestic productivity, but the benefitis fully reflected in market prices: the localsubsidiary or independent firm pays for thetechnology through profit repatriation orexpenditures on technology. In addition, localfirms may absorb technology from networksin ways that are not entirely reflected inmarket transactions (referred to as spillovers;see discussion in chapter 3). Rodriguez-Clare(1996) illustrates how multinational spilloversfrom participation in global production net-works may work: affiliates increase a hostcountry’s access to specialized varieties ofintermediate inputs, the improved knowledgeof which raises the productivity of domesticproducers.
C H A N G E S I N G L O B A L B U S I N E S S O R G A N I Z A T I O N
63
gep_ch02.qxd 12/5/02 2:53 PM Page 63

Networks may help increase the supplyand demand for skilled laborNetworks help improve access to technology,which tends to stimulate demand for more-skilled workers relative to less-skilled workers.Increased capital available through FDI mayalso increase the demand for skilled workers(see the survey in Hamermesh 1993). Feenstraand Hanson (1996) show that the transfer oftechnology and capital accumulation associ-ated with global networks can raise thedemand for more-skilled labor in both indus-trial and developing countries, and Feenstraand Hanson (1997) estimate that FDI intoMexico’s maquiladoras has contributed to ris-ing demand for skilled labor. Slaughter (2002)finds a robust and positive correlation be-tween skill upgrading and the presence of U.S.foreign affiliates. This correlation is more thantwice as large for the subsample of developingcountries when compared with the subsampleof industrial countries.
Participation in global production net-works may raise the supply of skilled laborin developing countries. One channel can bethe short-term activities by which individualfirms interact with host-country labor marketsthrough on-the-job training or support forlocal educational institutions. Multinationalsmight directly affect labor supplies, becausetheir transferred knowledge might boost theskills of their employees (and, with labormobility, the skills of the employees of domes-tic firms as well). They might indirectly affectlabor supplies (for example, by influencing theeducational infrastructure of host countries interms of curriculum choices and vocationaltraining). As Hanson (2001) reports, Intelrecently chose to establish a large assemblyand testing facility in Costa Rica, in partthanks to Costa Rica’s agreement to expandhigh school training in electronics and English(see also Moran 2001). Also, to the extent thatFDI inflows and trade increase the supply ofattractive employment opportunities, theymay inhibit the emigration of more-educatedworkers to industrial countries. For example,the 1990s boom in Ireland, caused in large part
by inward FDI, resulted in a surge in laborsupply driven largely by the reverse migrationof young Irish people back to Ireland.
If the presence of multinationals raises thedemand for skilled labor more than the supply,then wage rates for skilled labor may increaserelative to those for unskilled labor. Thischange implies a widening of income inequal-ity in countries with a large pool of unskilledlabor. However, multinationals’ demand forlabor is likely to raise the level of income of allworkers, regardless of the effect on relativewages. Several studies have found that multi-nationals pay higher wages than do domesti-cally owned establishments, even when con-trolling for a wide range of observable workeror plant characteristics such as industry,region, and overall size. The magnitudes in-volved are significant. Doms and Jensen(1998) document that for U.S. manufacturingplants in 1987, wages in foreign affiliates ex-ceeded wages in domestically owned firms bya range of 5 to 15 percent, with larger differ-entials being enjoyed by production workersthan by nonproduction workers.34 The pre-mium could be accounted for by higherworker productivity as a result of multination-als’ superior technology or capital. It couldalso be a result of other factors, such as higherworker productivity caused by unobserv-able worker qualities, or of multinationalsbeing more profitable and therefore more ableto share more rents with workers. Whateverthe case, the bottom line is that global pro-duction networks are likely to present high-wage opportunities for both more-skilled andless-skilled workers.
The benefits from networks can contributeto growth and structural transformationImproved allocation of resources, access totechnology, and increases in skilled labor can,in principle, make important contributionsto raising productivity and to facilitating thetransition from primary commodities to pro-ducing products with higher value added andgreater potential for growth. However, the ex-tent of benefits from participation in networks
G L O B A L E C O N O M I C P R O S P E C T S 2 0 0 3
64
gep_ch02.qxd 12/5/02 2:53 PM Page 64

is an empirical question. Local firms may notcapture the benefit from the transfer of tech-nology and increased productivity throughnetworks if multinationals have a wide choiceof production locations and a monopsonistposition in the purchase of supplies. In thissituation, competition among suppliers maydrive prices down, and the benefits of localfirms’ productivity improvements will accrueto the multinational.35
Some observers have argued that the bene-fits from network participation have been lim-ited for most countries, with the importantexception of a few of the most successful EastAsian countries (see UNCTAD 2002b). Risingmanufactured exports through networks maynot be accompanied by increased value addedin manufactures, and network participationmay simply mean the continued use of un-skilled labor in low value added activitiesrather than the development of the manufac-turing sector. For the 20 developing countrieswith the largest exports of parts and compo-nents (a proxy for network participation), theaverage share of GDP devoted to manufac-tures has shown no increase over the past20 years (table 2.4).36 However, average man-ufacturing value added (at constant prices)has increased by more than 5 percent per yearin these countries, a very respectable perfor-mance over a 20-year period, and 2.5 per-centage points more rapidly than the averageof developing countries with limited or no
participation in networks.37 The failure ofmanufacturing value added to rise as a shareof GDP reflects the rapid rise in services as in-come rises, particularly in these fast-growingeconomies. That network participants didachieve significant structural change is indi-cated by the rapid fall in the share of agricul-tural value added in GDP, from 17 percent in1980 to 10 percent in 2000. These data do notdemonstrate that network participation was amajor cause of growth and structural changein these economies, but they do indicate thatparticipation in networks has been consistentwith such progress.
Sectoral studies indicate that networks haveenabled countries to move from low-value torelatively high-value activities. For example,the global apparel industry contains many ex-amples of industrial upgrading by developingcountries.38 Several countries have shiftedfrom assembling apparel from imported in-puts (which requires only low-wage labor) tofilling orders from global buyers. This latterrole requires the ability to make samples; topurchase or manufacture the needed inputs forgarments; to meet international standards interms of price, quality, and delivery; and to as-sume responsibility for packing and shippingthe finished items. A few East Asian countriesmade this transition in the 1970s, then beganto set up their own international productionnetworks in the 1980s using low-wagecountries in Asia and elsewhere. Since then,several countries (for example, India, Mexico,Romania, Turkey, and Vietnam) have devel-oped expertise in managing apparel produc-tion chains. Their role is likely to expandgreatly as the apparel quotas under the Multi-fibre Arrangement are phased out in 2005.
Global production networks have been acentral feature in the development and upgrad-ing of Asia’s large, dynamic electronics sec-tor. While the East Asian newly industrializingeconomies—Hong Kong (China), Korea,Singapore, and Taiwan (China)—were the firstparticipants, the major Southeast Asian coun-tries of Indonesia, Malaysia, the Philippines,and Thailand have taken places directly below
C H A N G E S I N G L O B A L B U S I N E S S O R G A N I Z A T I O N
65
Table 2.4 Rapid growth and structuralchange experienced by networkparticipants
1980 2000
Share of manufacturing valueadded in GDP 22.8 23.2
Share of agriculture valueadded in GDP 17.3 10.3
Memo item: average annualgrowth rate of manufacturingvalue added, 1980–2000 5.3
Note: Data represent the 20 developing economies (includingTaiwan [China]) with largest exports of parts and components.Source: World Bank staff.
gep_ch02.qxd 12/5/02 2:53 PM Page 65

them in the production chain, including work-ing in design and setting up their own produc-tion networks. More recently, China has beenevolving from a provider of low-wage, assem-bly operations to the leading producer of elect-ronics across a wide range of industries(Borrus, Ernst, and Haggard 2000). Finally,exporters of fresh vegetables in Kenya andZimbabwe have benefited from their relation-ship with U.K. supermarkets, first throughassistance in meeting production standards,and more recently in taking on higher valueadded activities within the production chain.These activities have included packaging andapplying barcodes; investing in state-of-the-artmethods for cold storage; adopting just-in-time management techniques (including infor-mation technology) to reduce the time betweenharvesting, packing, and delivery; and expand-ing to joint ventures with freight forwarders togain more control over the distribution process(Dolan and Humphrey 2000).
Of course, participating in networks hasnot always been accompanied by progress tohigher value added activities. Survey evidenceindicates that East Asian firms participatingin networks have experienced an increasedpropensity to innovate as they draw on for-eign expertise (as well as increased exportgrowth), compared with firms in the same sec-tors that did not participate in networks(World Bank 2002a). However, networkedfirms did not show faster growth in employ-ment or value added, on average, than non-networked firms. The World Bank (2002a)also found that few East Asian firms were ableto move up the value chain through participa-tion in networks. However, these observationsare consistent with countries benefiting fromnetwork participation through spillovers andproduction by multinational subsidiaries.
Good policies attract FDI
The quality of the policy regime is animportant determinant of the allocation
of FDI flows among developing countries.Macroeconomic stability, corruption, rule of
law, and effectiveness of the regulatory regimehave been shown to be significant determinantsof the location of foreign investment, after con-trolling for other variables (Stein and Daude2002). For example, figure 2.17 shows that aranking of countries according to the rule oflaw (see Kaufman, Kraay, and Zoido-Lobaton2000) is significantly related to the level of FDIinflows, after controlling for size, income,openness to trade, inflation, and educationalattainment. By this measure, increasing the ruleof law by one standard deviation (for example,from the level of Bangladesh to that of Turkey,or from the level of Turkey to that of Chile)would raise FDI inflows by 40 percent.
Time series analysis underlines the impor-tance of governance and institutional qualityfor the allocation of FDI. Countries with betterinvestment climates—as indicated by the levelof corruption, voice (political openness), ruleof law, quality of the regulatory regime, gov-ernment effectiveness, and political stability—tended to receive an increasing share of totalFDI over the 1990s (figure 2.18).39 The impor-tance of each dimension of the investmentclimate used in figure 2.18 varies considerably.Countries that have strong rankings for regu-latory quality, government effectiveness, orpolitical instability consistently received morethan half of all the FDI to developing coun-tries, with little change in their share of FDI
G L O B A L E C O N O M I C P R O S P E C T S 2 0 0 3
66
Figure 2.17 Strong rule of law attractsforeign investors(FDI)
�1.5 �0.5 0.5 1 1.5�1 0
0
Rule of law
�3
�2
�1
2
1
3
y � 0.3996x � 0.0117(t � 1.90)
Note: Partial correlation for developing countriescontrolling for size, income, openness, inflation, education.Source: World Bank staff.
gep_ch02.qxd 12/5/02 2:53 PM Page 66

by the late 1990s when compared with earlierin the decade. In contrast, the extent of politi-cal openness has not been strongly associatedwith the share of FDI received. And althoughcountries with relatively poor rankings for ruleof law and anticorruption received substantial
shares of FDI, the shares tended to decline inthe latter half of the 1990s. For example, coun-tries with below average anticorruption effortsreceived 70 percent of developing-country FDIin 1994, but only 50 percent in 2000, whilethose with above-average ratings doubled their
C H A N G E S I N G L O B A L B U S I N E S S O R G A N I Z A T I O N
67
0
25
50
75
100
Anticorruption Voice
Rule of law Regulatory quality
0
25
50
75
100
Above averageBelow average
Government effectiveness
Weakest
Source: World Bank staff.
(percent annual shares of total FDI to developing countries)
25
50
75
100
1990
1995
2000
1990
1995
2000
1990
1995
2000
Above averageBelow averageWeakest
1990
1995
2000
1990
1995
2000
1990
1995
2000
Above averageBelow averageWeakest
1990
1995
2000
1990
1995
2000
1990
1995
2000
Above averageBelow averageWeakest
1990
1995
2000
1990
1995
2000
1990
1995
2000
Above averageBelow averageWeakest
1990
1995
2000
1990
1995
2000
1990
1995
2000
Above averageBelow averageWeakest
1990
1995
2000
1990
1995
2000
1990
1995
2000
0
25
50
75
100
0
25
0
50
75
100
0
25
50
75
100
Political stability
Figure 2.18 Foreign investors have been shifting away from weaker investment climatelocations
gep_ch02.qxd 12/5/02 2:53 PM Page 67

share from 20 percent to just over 40 percent.If one holds other determinants of FDI alloca-tion (including market size, openness, inflation,and education) constant, corruption is signifi-cantly related to the share of FDI in the late1990s, but not in the early 1990s.
Why should the share of FDI going tocountries with better investment climates haveincreased during the 1990s? Remember thattotal FDI flows to developing countries in-creased very rapidly during this period. Onepossibility is that countries with high levelsof corruption or weak rule of law had otherattractions (such as high tariff barriers or in-centives programs) that made them desirablelocations for investment in particular sectors,while they remained relatively undesirablelocations for FDI in general. Countries thatoffered such attractions for FDI were unlikelyto share equally in the FDI boom during the1990s, which generally responded to the liber-alization of economic policies and improve-ments in macroeconomic stability in severalcountries. That is, countries with poor gover-nance may have attracted a substantialamount of FDI during the 1990s because ofcostly incentives. However, they would beunlikely to attract increasing amounts of FDIunless they were able to continually raise in-
centives. Another hypothesis is that investorsbecame more concerned about risk in reactionto the crises of the late 1990s, and that coun-tries with weak governance were viewed asrelatively risky. Indeed, risk premiums on junkbonds and on emerging market debt jumpedsharply toward the end of 1998, indicatinga shift toward increasing risk in the globalenvironment.
The boom in private infrastructure invest-ment during the 1990s highlights the impor-tance of a policy for attracting foreign invest-ment. Private infrastructure investment indeveloping countries surged during the 1990s,rising from $14 billion in 1990 to a peak of$117 billion in 1997, before easing to $89 bil-lion by the end of the decade (figure 2.19).40
Foreign investors were involved in some80 percent of recorded private infrastructuretransactions from 1990 to 1998, althoughforeigners accounted for only about 30 per-cent of the dollar value of total private infra-structure financing (Sader 2000). The boomin private infrastructure investment respondedto improvements in the investment climate inseveral of the largest developing countries.Privatization programs opened infrastructuresectors to private investment, and total priva-tization proceeds in infrastructure jumped
G L O B A L E C O N O M I C P R O S P E C T S 2 0 0 3
68
Note: MENA is Middle East and North Africa, ECA is Europe and Central Asia, SSA is Sub-Saharan Africa, EAP is East Asia andPacific, SAS is South Asia, and LAC is Latin America and the Caribbean.Source: World Bank staff.
Figure 2.19 Private infrastructure investment surged in the 1990s
By region
(billions of dollars)
0
40
60
80
20
140
120
100
1990 1991 1992 1993 1994 1995 1996 1997 1998 1999 2000
By sector
(billions of dollars)
0
40
60
80
20
140
120
100
1990 1991 1992 1993 1994 1995 1996 1997 1998 1999 2000
Transport
Gas & electric
Water
Telecoms
SSASASECA
MENA
EAPLAC
gep_ch02.qxd 12/5/02 2:53 PM Page 68

from $10 billion in 1990 to $40 billion in1998, before falling off sharply to $12 billionin 1999 (World Bank 2001). More generally,efforts in several countries to open theireconomies to trade and investment and toestablish more stable macroeconomic environ-ments encouraged the surge in infrastructureinvestment.
The decrease in foreign investment in infra-structure projects among developing countriessince 1997 largely reflects a reduced demandfor infrastructure services, owing to the crisesin East Asia, Russia, Brazil, and Argentina.For example, in East Asia and the Pacific, pri-vate infrastructure investment collapsed froma peak of $38 billion in 1997 to an average ofless than $15 billion per year from 1998 to2000. In Latin America, private infrastructureinvestment in 1999–2000 was halved fromthe 1998 peak of $71 billion. The drop-offaffected all sectors, with peak-to-trough de-clines of 63 percent in gas and electricity,57 percent in transport, and 24 percent intelecommunications.
Although comprehensive data are unavail-able, foreign investment in developing-countryinfrastructure projects has likely continuedto decline in the past two years. The overalldeterioration in the international economicenvironment has driven a sharp decline in com-mercial bank lending to developing countries(net long-term lending from the banks fell toa negative $32 billion in 2001), and funds forproject finance have dried up. Also, the key in-vestors in infrastructure sectors, utilities (in theEurope and United States), equipment manu-facturers, and specialized venture capitalistshave seen their profits collapse, and in somecases the firms have gone bankrupt. Most ofthose firms are under pressure to recapitalizeand are reluctant to devote their limited re-sources to high-risk ventures in developingcountries. Finally, the scandals involving en-ergy deregulation and the spectacular losses ofprivatized telecommunications firms may havereduced support for the deregulation of servicesectors, a key step toward providing infra-structure services by the private sector.
Notes1. A country’s location may have an important role
in attracting FDI flows. For example, Caribbean coun-tries benefit from their proximity to the United States.
2. Data are from UNCTAD 2001. The data oncross-border M&A already introduced are not compa-rable to the data on FDI. For example, M&A is re-ported on a transactions basis, while actual paymentsthat are reported as FDI may be spread over severalyears. Also, the local financing share will be reported aspart of an M&A transaction but will not be reportedas FDI. Thus it is not useful to compare the magnitudeof M&A flows with FDI.
3. Documentation and discussion of those mergerwaves can be found in Golbe and White (1988, 1993),Black (2000), Holmström and Kaplan (2001), White(2001), and Pryor (2001a).
4. Analysis based on Evenett (2002).5. These data are from White (2001, 2002). The
number of corporations refers to 2000. The share ofthe top 100 refers to 1999.
6. In the Fortune list of the largest 500 global com-panies in 2000 (as measured by revenues), 12 wereheadquartered in China (including Hong Kong); 11 inKorea; 3 in Brazil; 2 each in Mexico, Russia, and SouthAfrica; and 1 each in India, Malaysia, and the RepúblicaBolivariana de Venezuela. The remaining companieswere headquartered in Japan, North America, orWestern Europe.
7. Choosing the appropriate indicator of concen-tration is difficult. Value added is clearly the superiorall-around measure of aggregate concentration, but itis not regularly reported by companies in their publicfinancial statements or in government data. Account-ing profits will depend on depreciation and amortiza-tion rates that vary across firms, and on corporateincome tax rules that vary by country. Data on saleswill significantly distort the relative importance of re-tail firms (with large ratios of sales to value added) ver-sus manufacturing firms. Measuring concentration interms of assets would imply double counting for finan-cial intermediaries. Moreover, reported asset valueswould depend on alternative accounting treatments forM&A; changes over time in accounting and tax treat-ment of asset depreciation, amortization, and write-offs; and changes in the treatment of expensing versuswrite-off for various categories of costs. To avoid theseinconsistencies and definitional problems, we use em-ployment data to analyze global concentration, but wealso look at indicators that are based on profits.
8. White (2001) also reports a rise in aggregateconcentration in manufacturing alone from the 1940sto the 1980s, and then a decline in the 1990s, basedon value added measures; a decline in economy-wideaggregate concentration in the 1970s, as shown by
C H A N G E S I N G L O B A L B U S I N E S S O R G A N I Z A T I O N
69
gep_ch02.qxd 12/5/02 2:53 PM Page 69

employment and profit data; and a decline in aggregateconcentration from the 1950s through the 1980s,based on assets. Somewhat similar conclusions arereached by Pryor (2001b).
9. The only antitrust concern that might be raisedwould be that of multimarket contacts among thelargest companies. For discussions of the potential andactual influence of multimarket contacts, see Feinberg(1985), Rhoades and Heggestad (1985), Bernheim andWhinston (1990), and Evans and Kessides (1994).
10. The Forbes “Super 50” list is based on a com-posite calculation of sales, profits, employment, andmarket value.
11. The time series analysis is based on the Forbeslist, which provides comparable data from 1994 to2001. The Fortune 500 list was not used because itincluded several government-owned businesses. In par-ticular, it extended in the latter years to a few state-owned Chinese companies, thereby distorting thecomparison with the mid-1990s.
12. As stated above, calculations of aggregate con-centration should not be based on sales data because ofthe wide range of ratios of sales to value added foundin different corporations. But this calculation is basedon changes over time, and presumably differences inthe growth rates of sales and value added are not asdisparate as the levels.
13. World Bank computations are based on datafrom the U.S. Bureau of Census and the Japan Ministryof International Trade and Industry.
14. Even if data were available, global trends in thenumber of companies in major oligopolistic industrieswould provide only limited information concerningchanges in the degree of competition. On the one hand,declining numbers of firms may be consistent with ris-ing competition, as lower transportation and commu-nication costs enable formerly regional firms to enterglobal markets. On the other hand, little change in thenumber of firms may be consistent with reduced com-petition (for example, resulting from strategic allianceswith the goal of coordinating prices or sharing outmarkets) (OECD 2001).
15. Services are products that are to a large extentintangible, nonstorable, and nontransportable. Intangi-bility implies that the quality of services is uncertainbecause of their high and variable human content and“one-off” nature of production. Therefore, servicesgenerally require proximity and close interactionbetween the producer and the consumer to ensure asatisfactory level of quality. Nonstorability and non-transportability imply that services must be producedand consumed at the same time and at the same loca-tion. However, some services can be embodied in goodsor stored and transmitted through electronic means.Services include such economic activities as wholesale
and retail trade; travel; transportation; storage andwarehousing; telecommunications; banking, finance,and insurance; entertainment; real estate; accountingand auditing; data processing; research and develop-ment; law; health; education; public relations; personalassistance (such as auto and house repair, haircutting,and laundry); and public administration.
16. See UNCTAD (1992), table I.3, p. 18. ForGermany and Japan, the initial year is 1976.
17. Services are becoming increasingly interlinkedwith goods, especially in high-tech products in whichthe use of hardware requires various software andmaintenance service contracts.
18. Williamson and Mahar (1998) detail movestoward liberalization of banking sectors.
19. The importance of foreign bank participation indeveloping countries has been discussed by severalauthors (see Roldos 2002).
20. See World Bank (1997) for a discussion of theglobalization of production and the developingcountries.
21. The share declined from 1996 to 1999 because ofthe abolition of tariffs under the EU’s Association Agree-ments, which resulted in companies switching from EUto Eastern European firms for intermediate inputs.
22. This is a narrow definition of the share of tradeconducted through networks; it excludes importedinputs that are processed and sold as a final good inthe domestic market.
23. Hummels, Ishii, and Yi (2001) attributed one-third of the growth in world trade over the past25 years to trade in parts and components, rather thantrade in final goods.
24. Containerized shipment allows for better track-ing of cargo, more efficient and reliable port services,and greater ease of switching to land transport.
25. The volume of cargo shipped by airlinesincreased by 6 percent per year from 1978 to 1998,and the share of revenue from international cargo intotal air shipments rose from about 40 percent to wellover half (Air Transport Association 1999).
26. Deardorff (1998) points out that tariffs caneither deter or stimulate participation in global net-works, depending on where they are imposed andwhether they are on final or intermediate goods.
27. The easing of restrictions on FDI flows indeveloping countries has been discussed in variouseditions of Global Development Finance.
28. Chen (1996) lists alternative forms of prod-uction relationships, including wholly owned affili-ates, joint ventures, foreign minority holdings, fading-out agreements, licensing, franchising, managementcontracts, turnkey ventures, contractual joint ventures,and subcontracting. See also Grosse (1996) for analternative categorization.
G L O B A L E C O N O M I C P R O S P E C T S 2 0 0 3
70
gep_ch02.qxd 12/5/02 2:53 PM Page 70

29. FDI requires some advantage by the multina-tional over home production to compensate for domes-tic firms’ superior knowledge of local markets, con-sumer preferences, and business practices (Blomströmand Sjöholm 1998).
30. The example is given of a Singaporean com-pany in which some technology was transferred to alocal subcontractor, but critical components wereunlikely to be outsourced.
31. One concern is whether these data are distortedbecause multinationals may not report “true” prices ofgoods traded among affiliates, but they will insteadincrease the price (and therefore profits) of goods fromlow-tax locations and will reduce the price of goodsfrom high-tax locations. There is some evidence thatU.S. firms have followed this practice; however, theoverall patterns of prices are similar to the pricing ofgoods traded between firms (Clausing 2001). Thusthese data may provide a reasonably accurate pictureof trends in intra-firm trade.
32. These data refer to product categories identifiedas parts and components in the Standard InternationalTrade Classification (SITC) Revised 2 system. Thistrade is a proxy for, but is not identical to, productionthrough networks. On the one hand, such trade mayalso reflect the export of relatively undifferentiatedinputs to arm’s-length purchasers. Conversely, manygoods that are parts to consumer products are notidentified as such in the SITC system. On balance, thedata probably understate the extent of trade throughnetworks (see Kaminski and Ng 2001).
33. However, Rangan and Lawrence (1999) argue,on the one hand, that the costs of search and assess-ment of reliability involved in choosing suppliers andoutlets will mean that even arm’s-length relationshipscan be relatively insensitive to changes in relative pricesin the short term. On the other hand, multinationalsface smaller search and assessment costs because ofgreater international experience, so they are morelikely to switch production rapidly in response to rela-tive exchange rate changes. They provide some empir-ical support for this view.
34. For additional U.S. evidence, see Howenstineand Zeile (1994). Griffith (1999) presents similarevidence for the United Kingdom; Globerman, Ries,and Vertinsky (1994), for Canada; Aitken, Harrison,and Lipsey (1996), for Mexico and the RepúblicaBolivariana de Venezuela; and Te Velde and Morrissey(2001), for five African countries.
35. Conceivably, all sectors may be perfectly com-petitive, and the benefits of increased productivity willaccrue to consumers.
36. This calculation excludes a few network partic-ipants that lack adequate time series data on manufac-turing value added.
37. Excluding Korea, Malaysia, and Taiwan(China) from this set reduces the group’s averagegrowth rate of manufacturing value added to 4.3 per-cent per year, still much higher than other developingcountries.
38. General information on apparel is mainlydrawn from Gereffi (1999) and the apparel chaptersin Gereffi and Korzeniewicz (1994) and Gereffi andKaplinsky (2001).
39. The countries are classified into three cate-gories: the worst group (more than half a standarddeviation from the average), below average (half a stan-dard deviation or less from the average), or aboveaverage.
40. Technological innovation also helped boostinvestment in infrastructure over the 1990s. For exam-ple, flows to the telecommunications sector rose withthe dramatic reductions in the price of long-distanceservice.
ReferencesAir Transport Association. 1999. “Aviation Economic
Impact.” http://www.air-transport.org/public/industry.
Aitken, Brian, Ann Harrison, and Robert E. Lipsey.1996. “Wages and Foreign Ownership: A Com-parative Study of Mexico, Venezuela, and theUnited States.” Journal of International Econom-ics 40(May): 345–71.
Arndt, Sven W. 2001. “Production Networks in an Eco-nomically Integrated Region.” ASEAN EconomicBulletin, Singapore, 18(1): 24–34.
Baldone, S., F. Sdogati, and L. Tajoli. 2002. “Interna-tional Fragmentation of Production, Trade Flows,and Growth.” 53rd Conference. Paris. March14–17.
Bernheim, B. Douglas, and Michael D. Whinston.1990. “Multimarket Contact and CollusiveBehavior,” Rand Journal of Economics21(Spring): 1–25.
Black, Bernard S. 2000. “The First InternationalMerger Wave (and the Fifth and Last U.S.Wave).” University of Miami Law Review 54:799–818.
Blomström, Magnus. 1986. “Foreign Investment andProductive Efficiency: The Case of Mexico.”Journal of Industrial Economics 35(1): 97–110.
Blomström, Magnus, and Ari Kokko. 1998. “Multina-tional Corporations and Spillovers.” Journal ofEconomic Surveys 12(2): 1–31.
Blomström, Magnus, and Fredrik Sjöholm. 1998.“Technology, Transfer, and Spillovers: Does LocalParticipation with Multinationals Matter?”
C H A N G E S I N G L O B A L B U S I N E S S O R G A N I Z A T I O N
71
gep_ch02.qxd 12/5/02 2:53 PM Page 71

Centre for Economic Policy Research. DiscussionPaper Series no. 2048(December): 1–16. London.
Borrus, Michael, Dieter Ernst, and Stephan Haggard,eds. 2000. International Production Networks inAsia. London: Routledge.
Campa, J., and L. Goldberg. 1997. “The Evolving Ex-ternal Orientation of Manufacturing Industries:Evidence from Four Countries.” National Bureauof Economic Research (NBER) Working Paperno. 5919. Cambridge, Mass.
Chen, Edward K. Y. 1996. “Transnational Corpora-tions and Technology Transfer to DevelopingCountries.” In Transnational Corporations andWorld Development. London: Routledge (onbehalf of the UNCTAD Division on TransnationalCorporations and Investment), InternationalThompson Business Press.
Cho, Kang Rae. 1990. “The Role of Product-SpecificFactors in Intra-Firm Trade of U.S. ManufacturingMultinational Corporations.” Journal of Interna-tional Business Studies 21(2): 319–30.
Clausing, Kimberly A. 2001. “The Behavior of Intra-Firm Trade Prices in the U.S. International PriceData.” Bureau of Labor Statistics Working Paperno. 333. Office of Prices and Living Conditions,Washington, D.C. January.
Deardorff, Alan V. 1998. “Fragmentation in SimpleTrade Models.” School of Public Policy. ResearchSeminar on International Economics. DiscussionPaper no. 422. University of Michigan, Ann Arbor.
DeGrauwe, Paul, and Filip Camerman. 2002. “HowBig Are the Big Multinational Companies?”United Nations Conference on Trade and Devel-opment. Geneva. Processed.
Dolan, Catherine, and John Humphrey. 2000. “Gover-nance and Trade in Fresh Vegetables: The Impactof U.K. Supermarkets on the African HorticultureIndustry.” Journal of Development Studies 37(2):147–75 (December).
Doms, Mark E., and J. Bradford Jensen. 1998. “Com-paring Wages, Skills, and Productivity BetweenDomestically and Foreign-Owned ManufacturingEstablishments in the United States.” In RobertBaldwin, Robert Lipsey, and J. David Richardson,eds., Geography and Ownership as Bases forEconomic Accounting. Chicago: University ofChicago Press, pp. 235–55.
Dunning, John H. 1981. International Production andthe Multinational Enterprise. London: George,Allen, and Unwin.
Eaton, Jonathan, and Samuel Kortum. 1999. “Interna-tional Technology Diffusion: Theory and Mea-surement.” International Economic Review 40(3):537–70.
Ernst, Dieter. 2002. Global Production Networks inEast Asia’s Electronics Industry and UpgradingPerspectives in Malaysia. Honolulu: East-WestCenter. Processed.
Ethier, Wilfred J., and James R. Markusen. 1996. “Multi-national Firms, Technology Diffusion, and Trade.”Journal of International Economics 41: 1–28.
Evans, William N., and Ioannis N. Kessides. 1994.“Living by the ‘Golden Rule’: Multi-MarketContact in the U.S. Airline Industry.” QuarterlyJournal of Economics 109(May): 341–66.
Evenett, Simon J. 2002. The Cross-Border Mergersand Acquisitions Wave of the Late 1990s. Bern,Switzerland: World Trade Institute. Processed.
Feenstra, Robert C. 1998. “Integration of Trade andDisintegration of Production in the GlobalEconomy.” Journal of Economic Perspectives12(4): 31–50.
Feenstra, Robert C., and Gordon H. Hanson. 1996.“Foreign Investment, Outsourcing, and RelativeWages.” In Robert C. Feenstra, Gene M. Grossman,and Douglas A. Irwin, eds., Political Economy ofTrade Policy: Essays in Honor of Jagdish Bhagwati.Cambridge, Mass.: MIT Press, pp. 89–127.
———. 1997. “Productivity Measurement and theImpact of Trade and Technology on Wages: Esti-mates for the U.S., 1972–1990.” National Bureauof Economic Research (NBER) Working Paperno. 6052. Cambridge, Mass.
Feinberg, Robert. 1985. “Sales-at-Risk: A Test ofMutual Forbearance Theory of ConglomerateBehavior.” Journal of Business 58(April): 225–41.
Filipe, Joao Paulo, Maria Paula Fontoura, and PhilippeSaucier. 2002. “U.S. Intra-Firm Trade: Sectoral,Country, and Location Determinants in the 90s.”International Atlantic Economic Conference.Paris. March 13–17.
Gereffi, Gary. 1999. “International Trade and Indus-trial Upgrading in the Apparel CommodityChain.” Journal of International Economics48(1): 37–70 (June).
Gereffi, Gary, and Raphael Kaplinsky, eds. 2001. TheValue of Value Chains: Spreading the Gains fromGlobalisation. Special issue of the IDS Bulletin32(3).
Gereffi, Gary, and Miguel Korzeniewicz, eds. 1994.Commodity Chains and Global Capitalism.Westport, Conn.: Praeger.
Globerman, Steven, John C. Ries, and Ilan Vertinsky.1994. “The Economic Performance of ForeignAffiliates in Canada.” Canadian Journal of Eco-nomics 27(1): 143–56.
Golbe, Devra L., and Lawrence J. White. 1988. “ATime Series Analysis of Mergers and Acquisitions
G L O B A L E C O N O M I C P R O S P E C T S 2 0 0 3
72
gep_ch02.qxd 12/5/02 2:53 PM Page 72

in the U.S. Economy.” In Alan J. Auerbach, ed.,Corporate Takeovers: Causes and Consequences.Chicago: University of Chicago Press, pp. 265–302.
———. 1993. “Catch a Wave: The Time Series Behav-ior of Mergers.” Review of Economics and Statis-tics 75(August): 493–99.
Griffith, Rachel. 1999. “Using the ARD EstablishmentLevel Data to Look at Foreign Ownership andProductivity in the U.K.” Economic Journal109(June): F416–F442.
Grosse, Robert. 1996. “International TechnologyTransfer in Services.” Journal of InternationalBusiness Studies Fourth Quarter: 781–800.
Grossman, Gene M., and Elhanan Helpman. 2002.“Outsourcing in a Global Economy.” NationalBureau of Economic Research (NBER) WorkingPaper 8728. Cambridge, Mass. January.
Hamermesh, Daniel S. 1993. Labor Demand. Princeton,N.J.: Princeton University Press.
Hanson, Gordon H. 1996. “Localization Economies,Vertical Organization, and Trade.” AmericanEconomic Review 86(5): 1266–78 (December).
———. 2001. “Should Countries Promote ForeignDirect Investment?” United Nations Conferenceon Trade and Development G24 Discussion PaperSeries No. 9. Geneva.
Hanson, Gordon H., Raymond J. Mataloni Jr., andMatthew J. Slaughter. 2001. “Expansion Strate-gies of U.S. Multinational Firms.” In Dani Rodrikand Susan Collins, eds., Brookings Trade Forum2001. Washington, D.C.: Brookings Institution,pp. 245–94.
———. 2002. “What Drives Production SharingWithin Multinational Firms?” Processed.
Helleiner, Gerald K. 1978. “Transnational Corpora-tions and Trade Structure: The Role of Intra-FirmTrade.” In Herbert Giersch, ed., On the Econom-ics of Intra-Industry Trade. Tubingen, Germany:J.C.B. Mohr, Paul Siebeck, pp. 159–81.
Holmström, Bengt, and Steven N. Kaplan. 2001. “Cor-porate Governance and Merger Activity in theUnited States: Making Sense of the 1980s and1990s.” Journal of Economic Perspectives15(Spring): 121–44.
Hoon, Hian Teck, and Kong Weng Ho. 2001. “Arm’s-Length Transactions versus Affiliates: A Study ofTwo Electronic Component Firms in Singapore.”In Leonard K. Cheng and Henryk Kierzkowski,eds., Global Production and Trade in East Asia.Boston, Dordrecht, and London: Kluwer Acade-mic Publishers.
Howenstine, Ned G., and William J. Zeile. 1994.“Characteristics of Foreign-Owned U.S. Manu-
facturing Establishments.” Survey of CurrentBusiness 74(1): 34–59 (January).
Hummels, D., J. Ishii, and K.-M. Yi. 2001. “TheNature and Growth of Vertical Specialization inWorld Trade.” Journal of International Econom-ics 54: 75–96.
Hummels, D., D. Rappaport, and K.-M. Yi. 1997.“Vertical Specialization and the Changing Natureof World Trade.” Federal Reserve Bank of NewYork Economic Policy Review (June): 79–99.
Kaminski, Bartlomiej, and Francis Ng. 2001. “Tradeand Production Fragmentation: Central EuropeanEconomies in EU Networks of Production andMarketing.” World Bank Policy Research Work-ing Paper no. 2611. Washington, D.C.
Kaufman, Daniel, Art Kraay, and Pablo Zoido-Lobaton. 2000. “Governance Matters, fromMeasurement to Action.” Finance and Develop-ment 37(2): (June).
Keller, Wolfgang. 2001. “The Geography andChannels of Diffusion at the World’s TechnologyFrontier.” National Bureau of Economic Research(NBER) Working Paper 8150. Cambridge, Mass.March.
———. 2002. “International Technology Diffusion.”University of Texas, Austin. Processed.
Kimura, Fukunari. 2001. “Fragmentation, Internaliza-tion, and Interfirm Linkages: Evidence from theMicro Data of Japanese Manufacturing Firms. InLeonard K. Cheng, and Henryk Kierzkowski,eds., Global Production and Trade in East Asia.Boston, Dordrecht, and London: Kluwer Acade-mic Publishers.
Markusen, James, and Anthony Venables. 1998.“Multinational Firms and the New TradeTheory.” Journal of International Economics 46:183–203.
Markusen, James, Thomas F. Rutherford, and DavidTarr. 2000. “Foreign Direct Investment inServices and the Domestic Market for Exper-tise.” National Bureau of Economic Research(NBER) Working Paper no. 7700. Cambridge,Mass. May.
Mataloni, Raymond J., and Daniel R. Yorgason. 2002.“Operations of U.S. Multinational Companies:Preliminary Results from the 1999 BenchmarkSurvey.” Survey of Current Business. Washington,D.C.: U.S. Department of Commerce. March.
Moran, Theodore. 2001. Parental Supervision: TheNew Paradigm for Foreign Direct Investmentand Development. Washington, D.C.: Institute forInternational Economics. August.
Navaretti, Giorgio Barba, Jan I. Haaland, and AnthonyVenables. 2000. Multinational Corporations and
C H A N G E S I N G L O B A L B U S I N E S S O R G A N I Z A T I O N
73
gep_ch02.qxd 12/5/02 2:53 PM Page 73

G L O B A L E C O N O M I C P R O S P E C T S 2 0 0 3
Global Production Networks: The Implicationsfor Trade Policy. Report prepared for the Euro-pean Commission Directorate General for Trade.London: Centre for Economic Policy Research.
Ng, Francis, and Alexander Yeats. 2001. “ProductionSharing in East Asia: Who Does What for Whomand Why?” In Leonard K. Cheng, and HenrykKierzkowski, eds., Global Production and Tradein East Asia. Boston, Dordrecht, and London:Kluwer Academic Publishers.
OECD (Organisation for Economic Co-operation andDevelopment). 2001. New Patterns of IndustrialGlobalisation: Cross-Border Mergers and Acqui-sitions and Strategic Alliances. Paris.
Pryor, Frederick L. 2001a. “Dimensions of the World-wide Merger Wave.” Journal of Economic Issues35(4): 825–40.
———. 2001b. “Will Most of Us Be Working forGiant Enterprises by 2028?” Journal of EconomicBehavior and Organization 44(April): 363–82.
Rangan, Subramanian, and Robert Z. Lawrence.1999. “Search and Deliberation in InternationalExchange: Learning from Multinational Tradeabout Lags, Distance Effects, and Home Bias.”National Bureau of Economic Research (NBER)Working Paper 7012. Cambridge, Mass.
Rhoades, Stephen A., and Arnold Heggestad. 1985.“Multimarket Interdependence and Performancein Banking: Two Tests.” Antitrust Bulletin 30:975–95.
Rodriguez-Clare, Andres. 1996. “Multinationals,Linkages, and Economic Development.” AmericanEconomic Review 86(4): 852–73 (September).
Roldos, Jorge. 2002. “FDI in Emerging MarketBanking Systems.” International Monetary Fund,Washington, D.C. Processed.
Sader, Frank. 2000. “Attracting Foreign Direct Invest-ment Into Infrastructure: Why Is It so Difficult?”Foreign Investment Advisory Service OccasionalPaper no. 12. World Bank, Washington, D.C.
Sauvant, Karl P., and Padma Mallampally. 1996.“Transnational Corporations in Services.” InTransnational Corporations and World Develop-ment. Geneva: Routledge (on behalf of the UNC-TAD Division on Transnational Corporations andInvestment), International Thompson BusinessPress.
Schive, Chi, and Regina Yeu-Shyang Chyn. 2001.“Taiwan’s High-Tech Industries.” In Leonard K.Cheng, and Henryk Kierzkowski, eds., Global Pro-duction and Trade in East Asia. Boston, Dordrecht,and London: Kluwer Academic Publishers.
Shatz, Howard, and Anthony J. Venables. 2000. “TheGeography of International Investment.” WorldBank Research Paper. Washington, D.C.
Slaughter, Matthew. 2002. U.S. Trade and InvestmentPolicy and the Growth of Information Technol-ogy. Washington, D.C.: Emergency Committeefor American Trade.
Stein, E., and C. Daude. 2002. Institutions, Integra-tion, and the Location of Foreign Direct Invest-ment. Washington, D.C.: Inter-American Devel-opment Bank Research Department. Processed.
Te Velde, Dirk Willem, and Oliver Morrissey. 2001.“Foreign Ownership and Wages: Evidence fromFive African Countries.” Centre for Research inEconomic Development and International TradeDiscussion Paper. University of Nottingham,United Kingdom.
UNCTAD (United Nations Conference on Trade andDevelopment). 1992. World Investment Report.New York.
———. 2001. World Investment Report. New York.———. 2002a. “FDI Downturn in 2001 Touches
Almost All Regions.” January 21. Press Release.———. 2002b. Trade and Development Reports.
Geneva.United Nations. 1989. Foreign Direct Investment and
Transnational Corporations in Services. NewYork, p. 8.
Venables, Anthony. 1999. “Fragmentation and Multi-national Production.” European Economic Re-view 43(5): 935–45.
White, Lawrence J. 2001. “What’s Been Happeningto Aggregate Concentration? (And Should WeCare?)” Working Paper no. EC-02-03. Stern Schoolof Business, New York University. December 3.
———. 2002a. “Trends in Aggregate Concentration inthe United States.” Journal of Economic Perspec-tives 16(Summer).
———. 2002b. “Trends in Global Aggregate Concen-tration.” Background paper for Global Econom-ics Prospects 2002. Processed.
Williamson, John, and Molly Mahar. 1998. “A Surveyof Financial Liberalization.” Princeton Essays inInternational Finance no. 211. Princeton Univer-sity, Princeton, N.J.
World Bank. 1997. Global Economic Prospects. Wash-ington, D.C.
———. 1999. Philippines: The Challenge of EconomicRecovery. East Asia and Pacific Regional Office.Washington, D.C.
———. 2001. Global Development Finance 2001.Washington, D.C.
———. 2002a. East Asia’s Future Economy.Washington, D.C.
———. 2002b. Global Development Finance 2002.Washington, D.C.
WTO (World Trade Organization). 1998. AnnualReport. The World Trade Organization. Geneva.
74
gep_ch02.qxd 12/5/02 2:53 PM Page 74

Globalization makes it increasinglyimportant to get the “investmentclimate” right—Expanding global service and production net-works can accelerate growth in developingcountries that successfully harness competitionto encourage efficient investment. Efficient in-vestment does not simply mean more invest-ment. In fact, recent research demonstratessurprisingly little short-run correlation be-tween investment levels and growth (Easterly1999). Instead, investment and its productivityare inextricably linked to domestic policiesthat, taken together, broadly make up the localinvestment climate.
Sound enabling policies—including goodgovernance, institutions, and property rights—can help attract more private investment, bothdomestic and foreign. Policies that promotecompetition and entrepreneurship increase theefficiency of that investment. Complementarypublic investment, meanwhile, further con-tributes to overall productivity growth. Takentogether, sound policies in these three areascontribute to a positive investment climate,which is essential to accelerating growth andreducing poverty (Stern 2001).
—including having an enabling policyframework—A stable macroeconomic environment is essen-tial for a country to realize its investmentpotential. Good public governance—includingtransparent rules, low corruption, and re-
spected property rights—encourages invest-ment and promotes economic growth. Manycountries try to use specific investment poli-cies, such as tax incentives, to attract invest-ment or to channel it in particular directions.Such schemes are often poorly designed, inad-equately implemented, and costly, and maylargely benefit investors who would have in-vested anyway.
—and promoting competition that willincrease the productivity of privateinvestmentIn many countries, policy and private barrierseither have discouraged private investment orhave channeled it into less-productive activi-ties that reduce economic growth. Promotinga positive investment climate, however, doesnot imply a laissez-faire approach to the econ-omy. Rather, it requires active governmentefforts to reduce barriers that stifle entrepre-neurship and competition. Four policy barri-ers to competition are especially common:barriers to trade, restrictions on foreigninvestments, administrative barriers to entryand exit, and monopoly positions granted tostate-owned enterprises (SOEs) and newlyprivatized firms. While privatization has usu-ally improved the performance of divestedfirms, shortcomings abound in subsequentindustrial performance. Those shortcomingsmay be associated with regulations thatreduce competition and grant exclusivity be-fore sale of the enterprise. In addition, private
77
1Domestic Policies to UnlockGlobal Opportunities
3
gep_ch03.qxd 12/5/02 2:48 PM Page 77

barriers to competition—including price-fixing and other collusive practices—can in-duce resource misallocation. After establishingan adequate macro policy framework, coun-tries that lower both policy barriers and pri-vate barriers to competition can usually mini-mize investment distortions. They can also seemore capital inflows, more rapid growth intrade, and superior overall performance.
Public investment plays a critical rolein increasing productivityThe level and composition of public invest-ment has changed over the past two decades.The wave of privatizations has reduced thelevel and scope of public investment throughstate enterprises, and many sectors oncethought to be natural monopolies can nowbe exposed to competition. Public resourcesformerly used to subsidize loss-making SOEscan potentially be used where the private sec-tor is unlikely to invest enough: education,rural roads, and expanded access to under-served areas in many networks. While alwaysa challenge, investment in effective infrastruc-ture and human capital projects has an espe-cially high return.
Investment climate and investmentpolicies
While foreign direct investment (FDI)flows to developing countries receive
much attention and have special characteris-tics that can benefit recipients, most invest-ment in these economies remains domestic inorigin (figure 3.1).1 This fact highlights theimportance of policies likely to affect the leveland productivity of all investment, not justforeign. Since the mid-1980s, the share attrib-utable to public investment has remainedfairly constant, while private domestic invest-ment has declined slightly as FDI has grown.
Governance, corruption, and propertyrights matter—One critical dimension of the domestic policyenvironment is whether the governmentoperates with transparency, credibility, andstability. Good governance—including inde-pendent agencies, mechanisms for citizens tomonitor public behavior, and rules that con-strain corruption—is essential to development(World Bank 2002b). Barro (1991) finds a pos-itive relationship between growth and mea-sures of political stability for 98 countries from
G L O B A L E C O N O M I C P R O S P E C T S 2 0 0 3
78
01975 1978 1981 1984 1987 1990 1993 1996 1999
5
10
15
20
25
30
Note: GDP is gross domestic product. These are the annual averages for 111 developing countries. Private investment is calculatedas the difference between gross fixed capital formation and the sum of public investment and FDI. Public investment data measuretotal public investment, including SOEs.Source: World Bank and International Monetary Fund data, and Everhart and Sumlinski (2001).
Figure 3.1 Domestic capital is the largest source of investment in developing countries(gross fixed capital formation, percent of GDP)
FDI
Private investment
Public investment
gep_ch03.qxd 12/5/02 2:48 PM Page 78

1960 to 1985. For example, as discussed inchapter 2, countries with stronger rule of lawsee more FDI (figure 2.17).
Transparency is among the most importantcomponents of the domestic enabling environ-ment. Transparency relates to both the actionstaken by authorities and the broader businessenvironment of the host country. A nontrans-parent business environment increases thecost of information, diverts corporate energiestoward rent-seeking activities, and can be con-ducive to corruption. Case studies suggest thatcompanies may, for example, be willing toinvest in countries with legal and regulatoryframeworks that would not otherwise beconsidered “investor friendly,” provided theinvestors can obtain a reasonable degree ofclarity about the environment in which theywill be operating. Conversely, extremelyopaque business conditions can deter virtu-ally all private investment, regardless of theextent of the incentives.
While these factors affect all participants inthe host country’s business sector, they arearguably more discouraging to outsiders whoare not privy to locally available informationand who have other choices about where toinvest. As with earlier relations, causality canrun both ways, because FDI may contribute tocreating a more transparent environment.There are cases in which a foreign corpo-rate presence encouraged more open govern-ment practices, raised corporate transparency,and energized the fight against corruption.More generally, by observing commonlyagreed standards such as those in the Conven-tion on Combating Bribery of Foreign PublicOfficials, implemented by the Organisationfor Economic Co-operation and Develop-ment (OECD), multinational firms can con-tribute to raising standards for corporatesocial responsibility in host countries.
Corruption can deter foreign investors byincreasing transaction costs and by raisinguncertainty regarding the enforcement ofcontracts, the predictability of operatingcosts, and the likelihood of obtaining needed
licenses and permits. Recent empirical re-search confirms that measures of corruptionare significantly and negatively related toFDI inflows (Smarzynska and Wei 2000; Wei2000). Lipsey (1999) observes a strong nega-tive correlation between corruption and thelocation choice of U.S. affiliates across Asiancountries.2 Hausmann and Fernandez-Arias(2000) find positive, albeit weak, evidencethat FDI as a share of gross domestic product(GDP) increases with institutional quality.3
Corruption and poor governance often gohand in hand with lack of investor protectionsand with poorly functioning institutions,thereby deterring competition and investment.No investor—domestic or foreign—is likelyto risk assets if there is a high probability thatthose assets will be arbitrarily seized. Securityof private property helps ameliorate asymmet-ric information between investors and the gov-ernment and reduces investor uncertainties,thus reducing risk premiums and the overallcost of doing business. Empirical literatureprovides unambiguous support for this basicpoint, finding that the institutions protectingproperty rights are among the most criticalfor growth (Knack and Keefer 1995), thatproductivity and economic growth will im-prove when governments impartially protectand define property rights (Claugue andothers 1999), and that countries withoutadequate property rights are likely to growmore slowly (Zak 2001). Moreover, historicalevidence from industrial countries suggeststhat when investors face the threat of assetexpropriation, they are likely to charge muchhigher prices to recoup investments quickly—if they choose to invest at all (Keefer 1996;Wallsten 2001c).
—but policies to channel privateinvestment warrant caution—Building a strong and stable investment cli-mate is neither easy nor quick. Governmentsmay hope to jump-start the process or to com-pensate for a poor investment climate throughtargeted policies intended to draw investors
D O M E S T I C P O L I C I E S T O U N L O C K G L O B A L O P P O R T U N I T I E S
79
gep_ch03.qxd 12/5/02 2:48 PM Page 79

(usually foreign). Similarly, governments maycompete for foreign investment in highervalue added industries as a way of moving upthe technology hierarchy of international tradeand production. The lure of targeted policiesis clear: incentives can be legislated quickly,and investment that occurs after the incentivesare in place can be touted as a success. Whileactual success stories exist, they tend to be theexception rather than the rule because a com-bination of design flaws and implementationfailures could limit the hoped-for response.Moreover, such schemes can be expensive,with the risk that costs will outweigh anybenefits, that incentives will merely transfermoney to private investors who would haveinvested anyway, and that incentives can leadto a “race to the bottom” as developing coun-
tries each try to give the biggest incentives toinvestors. In this section, we will considerthree common policies: tax incentives to en-courage FDI, subsidies to promote industrial“clusters,” and measures to encourage indus-trial development through export processingzones (EPZs).
Tax incentives for FDI. Given the perceivedbenefits of FDI, many countries have explicitpolicies to attract it. One recent study esti-mated that 116 countries take a proactiveapproach to FDI and offer incentives to for-eign investors (Moran 1998). Figure 3.2 illus-trates the variety and frequency of fiscal andfinancial incentives for FDI that developingcountries offer. Typically, these policies focuson attracting particular types of investment—
G L O B A L E C O N O M I C P R O S P E C T S 2 0 0 3
80
Note: VAT is value added tax. Data on fiscal and financial incentives were compiled for 71 developing and 20 OECD countries. Themost common incentives (used in at least 18 percent of developing countries) are shown in the chart.Source: Bora (2002).
Figure 3.2 Incentives for FDI are varied and numerous
Number of countries
0 10 20 30 40 50
Capital goods import duties exempted
Tax exemption/holiday
Investment/reinvestment allowance
Lower tax rate
VAT exemption for capital goods
Accelerated depreciation
Raw material import duties exempted
VAT exemption for raw materials
Duty drawback
Export income treated preferentially
Loss write-off
Reduction in local, municipal taxes/duties
VAT exemption on exported inputs
Subsidized loans
OECD countries
Developing countries
gep_ch03.qxd 12/5/02 2:48 PM Page 80

or changing investors’ conduct—rather thanon improving the general investment climate.Incentives designed to lure FDI can take theform of up-front subsidies that are designed tohelp multinationals defray some of their fixedcosts (financial incentives), tax holidays (fiscalincentives), and other grants. The main goal ofsuch policies is to alter either the magnitude orthe location of inward FDI.
There are three main categories of FDIincentives: fiscal—policies that are designedto reduce the tax burden of a firm (includingloss writeoffs and accelerated depreciation);financial—direct contributions to the firmfrom the government (including direct capi-tal subsidies or subsidized loans); and othersthat do not fall easily into either category. Incontrast to the industrial world, where the in-centives offered are usually financial, the over-whelming majority of developing-countryincentives are fiscal (see figure 3.2). In a recentstudy that included 71 developing countries,Bora (2002) concludes that fiscal incentives arethe most popular, accounting for 19 of the 29most frequently used incentives. Furthermore,the five most common incentives are all fiscal.
Despite the popularity of FDI incentives indeveloping countries, the evidence of theireffectiveness remains ambiguous. The UnitedNations Conference on Trade and Develop-ment (UNCTAD 1996) reports that incentivescan have an effect on attracting FDI at themargin, especially when one considers the typeof incentive and the type of project. Con-versely, Caves (1996) and Villela and Barreix(2002) conclude that incentives are generallyineffective once the role of fundamental deter-minants of FDI is taken into account. Further-more, in a recent review of the literature on taxincentives and FDI, Morisset and Pirnia (2000)conclude that such instruments rarely make upfor deficiencies in a host country’s overall eco-nomic environment, and they fail to generatethe desired externalities. Overall, recent evi-dence provides little support for those whobelieve that incentives will bring in extra FDI.
To some extent, the ambivalent perspec-tives may reflect differences in views regarding
what is meant by an incentive. It is importantto distinguish between the fiscal and financialincentives (which are usually firm specific)and the more general policies that promotebusiness activity. Evidence is uncontested thatgeneral policies matter a lot in attracting in-vestment. In a recent empirical analysis of theeffect of U.S. state-level policies on the loca-tion of manufacturing investment, Holmes(1998) found that the manufacturing share ofemployment in states with a pro-business reg-ulatory environment is one-third greater thanthat in a bordering state without that environ-ment. Policies that encourage the adoptionand adaptation of know-how—and other gen-eral incentives that apply across the board—are important and help foster a sound enabl-ing environment. Examples include effectiveenforcement of contracts, absence of red tape,adequate infrastructure, and efficient trainingand education programs.
Under special circumstances, targeted FDIincentives may have positive effects. Manygovernment officials seem to think that suchincentives work, as illustrated by statementsfrom a number of representatives in the Work-ing Group on Trade and Investment of theWorld Trade Organization (WTO [1998]).Several studies find that fiscal incentives doaffect location decisions, especially for export-oriented FDI, although incentives seem to playa secondary role (see Devereux and Griffith1998; Guisinger and others 1985; Hines1996). However, fiscal incentives appearunimportant for FDI that is geared primarilytoward the domestic market; instead, such FDIappears more sensitive to the extent to whichit will benefit from import protection. Thus, amore nuanced view of the efficacy of incen-tives may be in order. Although useful for at-tracting certain types of FDI, incentives do notseem to work when applied at an economy-wide level (see Hoekman and Saggi 2000).
Moreover, even when targeted, FDI incen-tives may impose excessive costs on govern-ments, especially when fiscal incentives areprovided through special tax provisions.Because benefits (a new manufacturing plant,
D O M E S T I C P O L I C I E S T O U N L O C K G L O B A L O P P O R T U N I T I E S
81
gep_ch03.qxd 12/5/02 2:48 PM Page 81

jobs created) are visible, whereas costs are hid-den (tax revenues are forgone), governmentsmay offer too much. Also, the existence of ex-cessive FDI incentives is not just a developing-country phenomenon—in fact, such incentivesare far larger in industrial countries. For exam-ple, in 1996, Mercedes-Benz received a sub-sidy of $300 million, which amounts to asubsidy of $200,000 per employee, from theU.S. state of Alabama for establishing an autoplant (Moran 1998). Similarly, following reuni-fication, Germany paid a subsidy of $6.8 bil-lion to Dow Chemical, which amounts to anastounding $3.4 million per employee (Moran1998).
Additional concerns about the use of in-centives emerge from their effect on the dis-tribution of rents between governments,host-country firms, and large multinationals.Developing countries may be tempted to offerinvestment incentives to multinationals inpart because of an expectation of technologyspillovers to local firms. Yet, investment in-centives to multinationals can put local firmsat a competitive disadvantage, at least initially.The net effect is hard to estimate: perhapsincentives impose a short-run cost on localfirms, which may gain from foreign invest-ment in the long run.
A selective use of investment incentivescan have strategic consequences among for-eign firms, especially when multinationals arepervasive in markets with a high level of con-centration. For example, an exporting foreignfirm from a developing country (or a local hostfirm) may find itself at a disadvantage with re-spect to another foreign firm that experiencesa decline in costs resulting from an investmentsubsidy. Thus, incentives can alter the distrib-ution of rents among multinationals.
Finally, the use of investment incentives bydeveloping countries poses a possible interna-tional coordination problem in two respects.First, as noted earlier, the possibility of exces-sive incentive “competition” among develop-ing countries may increase the likelihood thatthe “winning” country will have given awayfar more than it receives. This area allows
some scope for international action to preventsuboptimal outcomes (see chapter 4). Second,there is the possibility that incentives offeredby high-income countries will end up retain-ing or attracting FDI that would be moreefficiently used in developing countries(Hoekman and Saggi 2000). For example,labor unions and local interest groups mayoppose plant closures by offering excessiveincentives for firms to remain. Similar motiva-tions underlie the use of trade policy instru-ments such as antidumping. It is important,therefore, to distinguish between the loca-tional competition that may enhance efficiencyand the use of investment and trade policies(such as antidumping) that alter the incentivesfor outward FDI. The latter policies are inher-ently inefficient because they protect industriesthat are no longer competitive, and they in-duce various related distortions that are welldocumented in the literature (Finger 1993).
Clusters. In the past decade or so, the conceptof industrial clusters has received a great dealof attention (see, for example, Porter 1990).While there is no standard definition of a clus-ter, it is usually characterized as a regionalagglomeration of firms in related industries(along with complementary infrastructure andsupport services such as business, financial,and legal) that all work together in a virtu-ous cycle to attract new firms and to helpexisting ones grow. California’s Silicon Valleytypifies the high-technology cluster, with itsconcentration of high-tech firms, premieruniversities that actively interact with localbusinesses, and venture capitalists. Cluster-ing, however, occurs in many other industriesas well and is quite widespread (Ellisonand Glaeser 1997; Krugman 1991, 1998). Inthe United States, evidence of knowledgespillovers within regions (Jaffe 1989; Jaffe,Trachtenberg, and Henderson 1993) and verysmall areas (Wallsten 2001b) is consistentwith the idea that similar firms may benefitfrom proximity with one another.
Although the policy interest may be rela-tively new, clusters have been recognized for a
G L O B A L E C O N O M I C P R O S P E C T S 2 0 0 3
82
gep_ch03.qxd 12/5/02 2:48 PM Page 82

long time. In 1920, Alfred Marshall (as citedin Davenport 1935) hypothesized three rea-sons for the existence of clusters: the benefitsfrom a pooled labor supply, access to special-ized resources, and information flows amongmarket participants. Today, these main bene-fits are still associated with clusters. In a suc-cessful cluster, these factors generate positivefeedback loops because the concentration ofpeople and firms will attract more people andfirms (Arthur 1994; Krugman 1991).
With these potential benefits, it seems nat-ural that policymakers would want to startclusters close to home. Unfortunately, there islittle evidence that active efforts to create clus-ters tend to be successful. This result is in partrelated to the difficulty that governmentseverywhere have in “picking winners.” With-out any clear market signals about what activ-ities or clusters might be viable, governmentshave a fairly poor track record. Bergman andFeser (2001) argue that “in less developedregions a policy decision to concentrate re-sources on key industries, instead of more gen-eral infrastructure needs or other strategiesthat would serve best a broad array of indus-tries, brings with it significant risks againstwhich the gains remain unverified.” In indus-trial countries, research suggests that effortsto promote cluster development throughscience parks and public venture capital tendto be unsuccessful (Braun and McHone 1992;Felsenstein 1994; Wallsten 2001d).
Of course, this cautionary conclusion doesnot mean that emerging clusters should beignored. Indeed, it may be that governmentscan draw on the problems such clusters facewhen prioritizing where to undertake reforms.In other words, cluster promotion may bemore successful when directed toward areas inwhich significant activity is already ongoing,as well as areas where additional efforts on themargin by government may be the catalystneeded for further expansion. This type ofselective intervention may underlie the successstories that do exist, such as Hsinchu SciencePark in Taiwan, China (Saxenian and Hsu2000).
In sum, while much evidence shows thatclusters of firms are beneficial and occur nat-urally over time, there is little understandingof how to create them from scratch and noexperience to suggest that governments haveany expertise in selecting activities where clus-ters might flourish. Bigger payoffs are likelyto come from interventions to improve thebroader business environment. If governmentsare obliged to provide incentives to stimulatecluster development, they may do better byencouraging expansion of existing clusters,rather than by trying to pick winners andending up simply transferring resources to theprivate sector without generating any positiveexternalities.
Export Processing Zones. EPZs have becomea prominent feature of many developing andtransition economies, increasing from 175 in53 countries in 1987 to 500 in 73 countriesby 1995 (Kreye and others 1987 and OECD1996, both cited in Schrank 2001). Alongwith this increased prevalence, it is notsurprising that EPZs now account for fairlyhigh shares of total employment in manycountries—for example, as much as 6 percentin the Dominican Republic (de Ferranti andothers 2002). Despite EPZs’ ubiquity in thedeveloping world, there is little agreement onwhether EPZs are an effective developmenttool. While some view EPZs as the first stepdown a virtuous path of liberalizing domesticmarkets (Rodrik 1999), others believe that, bycreating a special “property right” of value tothose who participate, EPZs represent an es-cape valve that curtails broader reform effortsand that hampers overall liberalization anddevelopment.
The immediate benefit of EPZs to the hosteconomy lies in job creation, greater foreignexchange earnings, and, possibly, higher realwages. In many instances, workers seem toperceive EPZ employment as an attractiveopportunity. For example, Brown (2001, citedin de Ferranti and others 2002) finds thatmen and women employed in Mexico’smaquila (manufacturing EPZ) sector earn 31
D O M E S T I C P O L I C I E S T O U N L O C K G L O B A L O P P O R T U N I T I E S
83
gep_ch03.qxd 12/5/02 2:48 PM Page 83

and 38 percent more, respectively, than theirpeers in non-EPZ sectors. Similarly, in a sur-vey described by Sargent and Matthews(1999, cited in de Ferranti and others 2002),73 percent of Mexican maquila workers in-terviewed reported their current job to be atleast as good as their previous employment.Furthermore, worker welfare in EPZs is alsoimproved through employer practices ofproviding worker benefits (such as medicalinsurance), stable work schedules, and week-ends off. Moran (2002) evaluates worker con-ditions in EPZs in a number of countries andconcludes that there is “extensive evidencethat wages and working conditions in foreign-owned or foreign-controlled factories com-pare favorably with those of alternative occu-pations.” Moran (2002) further notes that thedemand for jobs is high and that workerstend to return to existing jobs following aholiday. English and de Wulf (2002) creditEPZs with creating more job opportunitiesfor women in Bangladesh, with reducing fe-male poverty in the Dominican Republic, andwith raising wages for EPZ workers abovewages for workers in the rest of the economy.
Beyond the direct effect of EPZs on jobcreation, a comprehensive evaluation of themshould look at two additional criteria. First,do EPZs actually encourage firms to export(or to increase exports), rather than causingfirms that already export to relocate into theEPZ so they can take advantage of financialincentives? Second, do EPZs produce spillovereffects by drawing local manufacturers intothe world markets, thereby indirectly bring-ing reform and enhanced competitiveness to agreater segment of the nation’s producers?Schrank (2001) compares EPZs in theDominican Republic and in the Republic ofKorea, arguing that market size is a majordeterminant of EPZ success. Despite the goodperformance within the Dominican Republic’sEPZ sector, few benefits appear to spill overinto the rest of the economy. Korean EPZs,however, are increasingly integrated with localsuppliers, thereby helping to transform muchof the economy into world-level competitors.
Schrank suggests that smaller countries maybe unable to “transform feeble manufactur-ers into world market-oriented firms” and areless likely to draw themselves onto a “large-country growth trajectory.”
Research does show that, in some in-stances, EPZs can be successful and can actas a catalyst for the rest of the economy (forexample, Jayanthakumaran and Weiss 1997;Johansson and Nilsson 1997). Moran (2002)argues that EPZs will have only a limitedeffect unless they are supported by efforts tointegrate them more fully into existing com-mercial and industrial hubs and unless theyare located near existing or potential poolsof better-educated labor. In particular, thisargument implies that government efforts touse EPZs to encourage development of“backward” regions that are far from existingindustrial centers (where the infrastructure islimited and skilled labor is scarce) are unlikelyto be successful. The more successful EPZexperiments that Moran considers are inCosta Rica, the Dominican Republic, and thePhilippines. Those examples show how EPZshave facilitated a shift in foreign investmentaway from lowest-skill operations that arelimited to export enclaves toward higher-skilloperations that are better linked to the rest ofthe economy and that provide both employ-ment opportunities for higher productivity(and higher wages) and better worker con-ditions. Without such complementary efforts,EPZs risk becoming another entrenchedinterest that simply maintains trade barriersand delays broader market reforms.
Another view of EPZs focuses on their roleas “transition property rights.” It highlightstheir function in helping the country steadilyimprove its investment climate. That is, EPZsmay act as a catalyst for the host economy, thussparking a sequence of beneficial changes in theeconomy. The experience of Mexico is highlyillustrative in this case: the transition beganwith establishing maquilas in a 2-mile borderzone, which was next expanded to 12 miles,then to entire states, and eventually to the wholecountry. In this case, EPZs were able to help
G L O B A L E C O N O M I C P R O S P E C T S 2 0 0 3
84
gep_ch03.qxd 12/5/02 2:48 PM Page 84

improve the investment climate by acting asa bridge between the old and the new systems.
—and incentives cannot offset a poorpolicy environmentGovernments may hope to make up for anunfriendly investment environment throughincentive mechanisms. But while there areclearly examples in which targeted interven-tions (such as fiscal incentives, EPZs, or sup-port for clusters) may indeed lead to higherinvestment levels—and the jobs and relatedspillovers that go along with such levels—thereis unfortunately little evidence that such initia-tives can be systematically successful. Instead,the impression is that these interventions workbest when they work in support of broader re-form packages, either to catalyze support foremerging opportunities (such as clusters) or tocreate an initial constituency for reform thatcan be progressively expanded (such as EPZs).But more broadly, as Wells and others (2001)note, “Incentives will generally neither makeup for serious deficiencies in the investmentenvironment nor generate the desired long-runstrategies.” To encourage productive invest-ment and benefit from globalization, govern-ments must tackle the challenges of promotingcompetition and entrepreneurship and of un-dertaking complementarily productive publicinvestment in areas such as education. We nowturn to these issues.
Promoting efficient privateinvestment: harnessingcompetition
While a stable macro environment andgood governance are important to at-
tracting investment, policies that promote con-testable markets and that protect againstabuses of market power are required to ensurethat new investment is both productive andefficient. Of particular importance in this re-gard are investment and competition policies,which are important elements of the invest-ment climate and also are basic pillars of theeconomy’s micro foundations that can have
large effects on productivity and welfare. In-dustries generally function better when theyoperate in a competitive environment, andricher and faster-growing countries tend tohave more competition and fewer barriers toentry. Changes in technology, global businessorganization, and regulation have created newopportunities for competition in areas thathad formerly been seen as natural monopolies(infrastructure) or that were considered neces-sary to preserve domestic sovereignty (services,real estate, and the financial sector). Countriesthat do not change their investment policiesand do not exercise well the powers and re-sponsibilities of the state—such as regulatingprivatized industries, providing education, orenforcing conditions of competition—willforgo poverty-reducing growth opportunities.
At the broadest level, competition and easeof entry are both positively correlated witheconomic growth (figure 3.3). A host of policyand private barriers in developing countrieswork to restrict competition. Restrictions ontrade and FDI rob an economy not only ofpotential sources of investment, but also ofone incentive for firms to improve productiv-ity. While causality goes both ways, both tradeand FDI are correlated with higher produc-tivity of firms in an economy. But potentialcompetition does not come solely from inter-actions with the global economy. Many devel-oping countries still protect incumbent firms—whether state-owned or private—by givingthem monopoly power even when there is lit-tle rationale for doing so. While such actionsmay protect particular firms, they almost al-ways impose net costs on everyone else in thecountry. Finally, other private barriers—suchas collusion, price-fixing, and cartels—blockcompetition and reduce welfare. This sectionof the chapter reviews some of these barriersto competition, and details how they can harmdeveloping countries’ economies.
Policy barriers to competition are a dragon productive investmentBarriers to competition stemming from gov-ernment policies can emerge either through
D O M E S T I C P O L I C I E S T O U N L O C K G L O B A L O P P O R T U N I T I E S
85
gep_ch03.qxd 12/5/02 2:48 PM Page 85

direct channels (such as when governmentscreate state monopolies) or through indirectchannels (such as when policy choices made inpursuit of other objectives end up limitingcompetition). In this section, we will focus onfour channels through which competition isaffected by policy choices:
• Import competition• FDI competition• Administrative barriers• State monopolies and private barriers to
competition.
Import competition can enhanceproductivityThe important role that trade plays in pro-moting productive investment and growthhas long been recognized. Using different mea-sures of openness to trade, including bothits relative size (as measured by import andexport shares) and its degree of distortion(as measured by average tariff rates and
dispersion), research strongly suggests thatgreater openness is associated with highergrowth in both industrial and developingnations. Sachs and Warner (1995) find thatopenness is a highly significant determinant ofgrowth and, combined with property rights,may even represent sufficient conditions forgrowth in poor economies. Kang and Sawada(2000) find a similar effect of openness ongrowth. They argue that, combined with finan-cial development, openness increases growthrates in developing economies by decreasingthe cost of human capital investment. Maloney(2001) offers regional support for the aboveresult, citing evidence that Latin Americaneconomies that are more open and that possessa more developed knowledge infrastructurewill grow faster. Consistent with this result,Cuadros, Orts, and Alguacil (2001) find thatopenness positively affects Latin Americangrowth and trade through increasing FDI.4
Such aggregate results fail to answer thequestion of exactly how increased openness
G L O B A L E C O N O M I C P R O S P E C T S 2 0 0 3
86
Note: “Competition” is the average response in each country to the question “In most industries, competition in the local markets is(1 � limited and price-cutting is rare, 7 � intense and market leadership changes over time).” “Entry” is the average response to thequestion“Entry of new competitors (1 � almost never occurs in the local market, 7 � is common in the local market).” Althoughcompetition and entry rankings suffer from methodological problems related in part to averaging of responses across respondents(see, for example, Lall 2001; Recanatini, Wallsten, and Xu 2000), those rankings can, nevertheless, provide a useful starting pointfor more rigorous investigations. One important question that these figures cannot answer is that of causality: do entry andcompetition make countries richer, do richer countries have more competition, or does something else altogether drive both growthand competition? What does emerge clearly is that poorer and more slowly growing countries seem to have less entry andcompetition.Source: World Economic Forum (2002); World Bank SIMA indicators.
0
4
2
3 3.5 4 4.5 5
Competition
5.5 6 6.5 7
�2
�4
�6
6
8
10
12
14
0
4
2
3.5 4 4.5 5
Entry
5.5 6 6.5
�2
�4
�6
6
8
10
12
14
Figure 3.3 Competition and ease of entry are associated with higher growth(GDP growth rate, percent) (GDP growth rate, percent)
gep_ch03.qxd 12/5/02 2:48 PM Page 86

(however measured) is translated into fastergrowth. One approach emphasizes the learn-ing and productivity gains that occur as do-mestic firms confront more competitive worldmarket conditions, become more efficient,and begin exporting. Another more compell-ing approach emphasizes the rise in importpropensities that often comes with tradeliberalization. Increased imports place domes-tic firms under direct competitive pressuresand indirectly induce technological innovationor cost-cutting restructuring that further en-hances competitiveness and productivity.
Research finds that price–cost margins(markups above cost) tend to fall with importcompetition, though the direction of causalityis not clear, and that foreign competition tendsto improve manufacturers’ efficiency (Tybout2001). Hoekman, Kee, and Olarreaga (2001)found that import competition (defined as theratio of import volume to domestic consump-tion in an industry) reduces industry markup.The effect of import competition is particularlypowerful when a few oligopolists dominate
markets. In figure 3.4, markups are lowest(measured on the vertical scale) when importcompetition is highest and when there are morefirms (the front corner), and markups are high-est when import competition is low and whenthe market is more oligopolistic (back corner).
Import competition pressures domesticfirms to be more productive. A recent study ofBrazilian manufacturing firms, for example,finds that foreign competition induces quick,marked improvements in domestic productiv-ity and, over time, forces inefficient firms toshut down (Muendler 2002). Cross-countrydata are consistent with these findings, sug-gesting that higher tariff rates (which makeimports more costly and thus less competi-tive), are correlated with lower productivity(figure 3.5).
In addition to the direct competition af-forded by greater openness to imports, highertrade prevalence can create spillover opportu-nities through which domestic firms can gainaccess to (improved) technology without pay-ing full cost. In general, imports from industrial
D O M E S T I C P O L I C I E S T O U N L O C K G L O B A L O P P O R T U N I T I E S
87
Figure 3.4 Competition from imports checks markups in concentrated markets
Note: Import penetration is defined as the ratio of import volume to the domestic output of an industry.Source: Hoekman, Kee, and Olarreaga (2001).
0 12% 25% 33% 50% 66% 75% 80% 83%10
86
43
21
0.600
0.800
1.000
1.200
1.400
1.600
1.800
2.000
Markup
Imports/domestic consumption
Num
ber o
f firm
s
gep_ch03.qxd 12/5/02 2:48 PM Page 87

countries are positively related to technologydiffusion and productivity growth (Eaton andKortum 1996; Lumenga Neso, Olarreaga, andSchiff 2001). Sjöholm (1996) finds a positiverelationship between bilateral import sharesand patent citations for Sweden.5 And Coeand Helpman (1995) find that industrialcountries that receive a larger share of importsfrom countries with a high level of researchand development (R&D) expenditures will ex-perience faster productivity growth.6 Despiteagreement that imports are an importantchannel for technology diffusion, studies reachsomewhat different conclusions on the condi-tions under which such diffusion is most likelyto occur. Coe, Helpman, and Hoffmaister(1997) extend the results of Coe and Helpman(1995) to developing countries and find thatdeveloping countries’ total factor productivityis positively related to their openness to tradewith the industrial countries. Furthermore,productivity in developing countries increasesas imports’ share of GDP increases.
Some research finds that manufacturingproductivity in developing countries dependson the complexity of imported machines(Navaretti and Soloaga 2001). Choudhri andHakura (1999) show that imports are signifi-cantly related to productivity growth only in
manufacturing sectors in which productivityincreased moderately. Imports did not seem toaffect productivity in sectors with low or highproductivity growth. Using industry-leveldata, Keller (2000) finds that imports mayboost technology diffusion if countries receivea relatively high share of total imports from ahigh-technology trading partner. Hakura andJaumotte (1999) find that the share of importsfrom industrial countries has a positive effecton total factor productivity. Finally, Xu andWang (2000) find that the share of importsof capital goods from high-technology coun-tries is significantly related to productivityincreases.
Competitive effects of FDI dependon policy—FDI can be a potential vehicle for increas-ing competition. Multinational corporations(MNCs) tend to be more efficient and produc-tive than smaller, purely domestic firms. WhileMNCs’ entry into the domestic market canput competitive pressures on local producers,the mere presence of MNCs does not neces-sarily increase competition. Because they oftenpossess significant intangible assets (brandnames, technology, managerial skills, and soforth), MNCs often supply different marketsdirectly (through domestic production activi-ties) rather than through exports. Such assetsmay permit MNCs to wield considerable mar-ket power. Openness to trade, low barriersto exit and entry, and other regulatory condi-tions can in turn help limit the capacity ofMNCs to abuse market power in the domesticmarket.
While the relationship between competi-tion and FDI remains complex, over time thecompetition-increasing association has becomemore prominent. Historically, FDI was oftenattracted to regions that were protected byhigh tariffs, as firms calculated that it waseasier to set up a subsidiary than to pay thetariffs required to serve the market throughexports. Such tariff-jumping investment wasalso motivated by the opportunity to servicethe domestic market behind the tariff barriers
G L O B A L E C O N O M I C P R O S P E C T S 2 0 0 3
88
0
5
10
15
20
25
30
35
40
Kore
a, R
ep. o
f
Mal
aysi
a
Thai
land
Philip
pine
s
Chi
na
Indi
a
Source: World Bank staff, based on survey of more than5,000 firms.
Figure 3.5 High tariffs are correlated withlower productivity
Average productivity
Average tariff rate
(percent)
gep_ch03.qxd 12/5/02 2:48 PM Page 88
while shielded from competition from abroad.This type of FDI has a long history: in thepost–World War II period, many developingcountries encouraged both domestic and for-eign firms to invest in high-priority industrialsectors by imposing high tariffs, quantitativerestrictions, and other nontariff barriers,along with providing various additional incen-tives (Caves 1996).
Investment induced in such a way, however,is unlikely to be efficient and, therefore, is lesscapable of providing a basis for sustainedgrowth. First, the empirical evidence suggeststhat tariff-jumping FDI is “likely to be tran-sient, lasting as long as the artificial policy-induced incentives” (Balasubramanyam 2001).Second, it can harm welfare by increasing con-sumer prices. In an era of much higher tariffsthan generally exist today, Lall and Streeten(1977) found that more than one-third of the90 foreign investments they studied actuallyreduced national income. This reduction wasmainly from excessive tariff protection that
allowed high-cost firms to produce for thelocal market at very high prices, even thoughthey could have imported much more cheaply.An even higher share of domestic projects thatthey reviewed had negative value added.Encarnation and Wells (1986) found that25–45 percent of 50 projects studied (depend-ing on analytical assumptions) reduced natio-nal income; again the main culprit was highprotection.
—and benefits are higher when tradebarriers are lowerOne clear implication is that if countries areopen to foreign investment, trade barriers canand should be kept low. Such openness to in-ternational competition will keep MNCs fromusing high protective tariffs to exert marketpower domestically and will discourage themfrom joining domestic vested interests that arelobbying for policies that perpetuate costlyrent-seeking activities. The cost of not doingso can be enormous, as illustrated in box 3.1.
D O M E S T I C P O L I C I E S T O U N L O C K G L O B A L O P P O R T U N I T I E S
89
Trade and tax policy often interact in ways thatmagnify their competition-restricting effects.
Newfarmer (2001) illustrates the importance ofpolicy in determining the net contribution of multi-national corporations (and domestic firms) by usingthe example of Argentina in the 1980s. In an effortto encourage settlement of Tierra del Fuego, thesouthernmost tip of the country (partly in responseto territorial disputes with Chile), the governmentset up a special production zone for assemblingelectronic products with generous tariff protectionand tax subsidies. Firms were encouraged toassemble many types of electronic goods for resaleto the highly protected Argentine market atenormous markups. As a result, televisions inArgentina routinely exceeded international pricesby 150–400 percent. The regime protection and
Box 3.1 Trade restrictions shield MNCs fromcompetitive forces at enormous cost: the caseof Argentina
subsidies were so lucrative that foreign (and somedomestic) firms bought finished products in Japan;shipped them to Panama, where they were brokendown; and then shipped them to Tierra del Fuegofor subsequent reassembly and resale in the main-land of Argentina. By 1990, estimates of the costto the (then-bankrupt) Argentine treasury rangedfrom 0.5 to 1 percent of gross domestic product.The winners in this scheme were the producingcompanies and a few thousand workers in Tierradel Fuego; the losers were Argentine consumers andbusinesses that had to pay high prices, thousands ofworkers who would have otherwise gotten jobs inmore internationally competitive new activities onthe mainland, and the Argentine poor, who, amongothers, had to pay the tax of high inflation to closethe fiscal accounts.
gep_ch03.qxd 12/5/02 2:48 PM Page 89

G L O B A L E C O N O M I C P R O S P E C T S 2 0 0 3
90
Entry costs HighLowLess
More
Note: Partial correlations control for market size, human capital, and macroeconomic stability. The entry cost measure used in thefigure refers to the costs of obtaining the necessary permits and licenses and other procedures required to set up a new establishment.See Djankov and others (2002).Source: World Bank staff.
Figure 3.6 High entry costs inhibit FDI inflows(FDI)
In recent years, the incentives for tariff-jumping FDI have declined. Barriers to tradehave come down considerably. As the impor-tance of production networks has risen, for-eign investors have found barriers to entry andless-competitive environments less appealing.In more recent studies, foreign investment isdeterred by high taxes or nontariff barrierson imported inputs and is attracted to more-open economies. In reviewing cross-countryregressions on the determinants of FDI,Charkrabarti (2001) argues that, after marketsize, openness to trade has been the most reli-able indicator of the attractiveness of a loca-tion for FDI (see Kolstad and Tøndel 2002).As figure 3.6 illustrates, there is now a signif-icant negative relationship between high entrycosts7 and the attractiveness of a market toforeign investors (controlling for other factorssuch as market size, macroeconomic stability,and human capital).
MNCs can have an indirect effect on com-petition by affecting ownership and marketstructure. For example, with a blend of deeperfinancial pockets, marketing skill, and supe-rior product or process technology, MNCsmay drive a significant number of domesticcompetitors out of business. To the extent that
this outcome is based on advantages associatedwith greater efficiency, and if the resultingmarket structure remains reasonably compe-titive, these effects are generally positive. Fur-thermore, MNCs could spark the entry ofproductive suppliers, encourage greater inno-vation, increase the variety of available prod-ucts, and drive down prices. However, if adomestic firm’s exit is driven more by the mar-ket power of the MNC and if the exit resultsin greater market concentration, then the long-run result may be less competition.
The case study literature provides both pos-itive and negative examples. After reviewingthe evidence, UNCTAD (1997) concludes thatalthough there is substantial evidence that theentry of MNCs yields new products and im-provements in existing products, there is nosystematic evidence on whether it ultimatelyreduces consumer prices. The overall effectshould not be judged at one moment in time. Inthe short run, some less-efficient producers willlikely be driven out of the market, while overtime, more productive entrants will emerge.There is evidence that domestic suppliers toMNCs enjoy higher productivity, both in levelsand growth (see Blalock 2001; Smarzynska2002). Thus, the net effect of FDI on competi-
gep_ch03.qxd 12/5/02 2:48 PM Page 90
tion, per se, depends on the level of interna-tional competition in the industry and on theability of domestic firms to increase their pro-ductivity in response to increased competition.
Perhaps because the channels throughwhich FDI affects competition will vary de-pending on the institutional environment—tariff structure, market size, competitionpolicy—the empirical findings about theeffect of FDI on growth are also mixed. FDIshould contribute positively to growth, be-cause it can bring capital, technology, skilledmanagement, and technical staffs, plus busi-ness practices that are usually more modern.Indeed, several econometric studies haveshown that, controlling for other factors, FDIflows are positively associated with economicgrowth (for example, see UNCTAD 1998 andWorld Bank 2001 for all developing coun-tries; Van Ryckeghem 1994 for Latin America;and Chunlai 1997 for China).
However, the direction of causation is notclear: does FDI cause more rapid growthbecause of its associated characteristics, or isFDI simply attracted to more rapidly expand-ing markets to exploit growth opportunities?The answer is probably both. Theory does notprovide a simple answer because the institu-tional settings and endowments are quitevaried and complex (see Cooper 2001). Oneproblem, for example, is that those elementsin the investment climate that are conduciveto FDI are also conducive to more domesticinvestment and to greater growth in pro-ductivity. Many of the methodological cri-tiques that Rodriguez and Rodrik (1999) andCooper (2001) apply to cross-sectional studiesof trade openness and growth also apply tothe somewhat less abundant literature on therelationship between FDI and growth.
Administrative barriers are usually highin developing countries—Entrepreneurship is an important contributorto economic growth and welfare improve-ments in transition and developing countries.For example, new firms created 10 millionnew jobs in Vietnam in the first seven years
of reform and “have usually been the fastest-growing segment in transition countries”(McMillan and Woodruff 2002). The scale ofentry that occurs when reforms promote com-petition can be impressive. Deng Xiaopingexpressed his surprise that “all sorts of en-terprises boomed in the countryside, as if astrange army appeared suddenly fromnowhere” less than a decade after the first re-forms in China in 1978 (Zhou 1996 as quotedin McMillan and Woodruff 2002). Key topromoting entrepreneurship and to improv-ing productivity is an environment that facili-tates entry and exit of firms (see, for example,Lansbury and Mayes 1996). Through thisprocess, poorly performing firms leave themarket and dynamic new ones enter. Unfor-tunately, many developing and transitiongovernments fail to recognize that firmbirths and deaths are an inevitable corollaryof entrepreneurial risk-taking. Instead, thosegovernments erect a maze of administrativeobstacles to starting, operating, and closingfirms.
A growing body of literature documentsthe difficulty that entrepreneurs face in estab-lishing firms in developing countries (for ex-ample, Djankov and others 2002; Emery andothers 2000; Friedman and others 2000).Djankov and others (2002) compiled data onentry regulations in 85 countries and discov-ered enormous variation in the number ofprocedures required to start firms acrosscountries, ranging from a low of 2 in Canadato as many as 21 in the Dominican Republic(with Bolivia and Russia close seconds at 20each). The time required to establish a firmranged from 2 business days in Canada to 152in Madagascar. These procedures can be ex-tremely costly to the economy. The cost of of-ficial procedures (that is, not including bribes)for setting up a new business was 266 percentof per capita income in Bolivia. Djankov andothers (2002) found that stricter regulationof entry is correlated with more corruptionand a larger informal economy. Moreover,“countries with more open access to politicalpower, greater constraints on the executive,
D O M E S T I C P O L I C I E S T O U N L O C K G L O B A L O P P O R T U N I T I E S
91
gep_ch03.qxd 12/5/02 2:48 PM Page 91

and greater political rights have fewer re-quired procedures for entry regulation—evencontrolling for per-capita income—than dothe countries with less representative, less lim-ited, and less free governments” (Djankov andothers 2002). In a study of such obstacles inAfrica, Emery and others (2000) discoveredthat “when added together, this whole mazeof often duplicative, complex, and non-transparent procedures can mean delays of upto two years to get investments approved andoperational.”
Although policymakers and advisers tendto emphasize market entry, exit is importantas well because it releases resources that canbe used in more productive ways. Healthyeconomies have a high “churn rate” of firms,and research demonstrates a strong positivelink between entry and exit (Love 1996).Moreover, as Caves (1996) has pointed out,barriers to exit can be barriers to entry bothby absorbing the scarce resources necessaryto start new enterprises and by making it dif-ficult for new firms to compete. Entry barriers,moreover, can become exit barriers (see fig-ure 3.7). Claessens and Klapper (2002) find asmaller share of firms in bankruptcy proceed-
ings in countries where it takes longer tostart a firm, thus suggesting that keeping new-comers out of the market protects inefficientincumbents.
While exit barriers can be harmful, dealingwith a firm’s exit is not simple. Ideally, bank-ruptcy and insolvency procedures rehabilitateviable but financially distressed firms andliquidate unviable firms. In practice, decidingwhich firms are viable is difficult. Djankov,Hart, and Nenova (2002) note that manycountries have crude insolvency laws thatpush financially distressed companies directlyinto liquidation, while other countries allowcompletely unviable companies to enter reha-bilitation procedures. In the latter case, suchcompanies are often liquidated only after along and expensive period of rehabilitation. Inrecent years, there is a growing movement ininsolvency reforms to introduce rehabilitationprocedures in countries that do not have them,but to allow creditors to replace managementduring the rehabilitation process (Djankov,Hart, and Nenova 2002).
Barriers that limit firms’ operating flexibi-lity exist even when entry and exit is not atstake. Friedman and others (2000) compile
G L O B A L E C O N O M I C P R O S P E C T S 2 0 0 3
92
0 20015010050
Days required to start a new business
8
7
6
4
3
2
1
0
5
Note: Averages for 35 industrial and developing countries, 1990–99. The data panel used for calculation of averages is unbalanced:that is, the entire range of observations (1990–99) was not available for some countries. The measure of days required to start a newbusiness is taken from Djankov and others (2002).Source: Claessens and Klapper (2002).
Figure 3.7 Barriers to entry can become barriers to exit(ratio of bankruptcies to number of firms)
gep_ch03.qxd 12/5/02 2:48 PM Page 92

indices of taxation levels and overregulation(essentially, indices of the business environ-ment) of firms in 69 countries. AlthoughFriedman and others (2000) find no evidencethat higher tax rates drive firms under-ground, “. . . every available measure of over-regulation is significantly correlated with theshare of the unofficial economy and the signof the relationship is unambiguous: moreover-regulation is correlated with a larger un-official economy.” The important result hereis that higher tax rates do not seem to driveaway investors, but the myriad and oftenarbitrary array of obstacles to starting andrunning a business do.
—and have real costsThe administrative obstacles have real costs tothe economy, which means that even poten-tially competitive firms often cannot competebecause any efficiency advantages they mayhave are consumed by the costs of administra-tive hassles. Indian firms, for example, arepotentially competitive in a range of labor-intensive industries; the combination of theirlabor productivity and their wages makesthem low-cost producers at the plant level.The value added per unit of labor cost is lowerin India than in East Asian competitors suchas Malaysia, the Philippines, and Thailand.However, in practice this potential competi-tiveness is often offset by investment climatebottlenecks, resulting in lower Indian exports.Several dimensions are of particular relevance.The regulation of factor markets, particularlyof labor and land, severely restricts the entryand exit of firms. For example, firms withmore than 100 employees have not beenallowed to retrench workers without govern-ment permission. Meanwhile, the lack of cred-itor rights and the severe backlog in judicialcases mean that India has one of the lowestlevels of bankruptcies internationally. TheConfederation of Indian Industry estimatesthat proceedings can easily take more thantwo years, and more than 60 percent of liqui-dation cases before the High Courts have beenin process for more than 10 years. It is easy to
see how such costs could quickly undo otheradvantages that these firms might have whencompeting in world markets.
A telling indicator of whether markets arecompetitive in a country is the productivitydispersion of firms within an industry. In acompetitive market with reasonably free entryand exit, dispersion should be low becauseunproductive firms either become more pro-ductive or leave the market. Higher dispersionindicates that less-efficient producers are notbeing forced to improve their productivity orto exit the market. Firm-level studies in anumber of countries bear this out.8 Subsidiesor strict regulations that impede entry or exitcan ultimately bolster high-cost producers.When such firms remain in the market, moreproductive firms may not have either the ade-quate incentives or the ability to increase pro-ductivity or to grow. However, as competitionincreases, firms face greater incentives to inno-vate and greater penalties for failure to do so.Loss of protection and greater competitionfrom foreign firms can drive inefficient do-mestic producers to better exploit scale eco-nomies, eliminate waste, reduce managerialslack, adopt better technologies, or shut down.As a result, productivity dispersion shouldshrink as productivity levels rise in the face ofgreater competition.
Productivity dispersion—a measure ofinefficiency—tends to be associated with bar-riers to competition, such as the administra-tive barriers to start a business for India,China, the Philippines, Thailand, Malaysia,and Korea (figure 3.8). In Indian textiles, gar-ments, and electronics, the higher performershave value added per worker that is five timesthat of lower performers. The dispersion ofproductivity is lower in four East Asian coun-tries where the World Bank has conductedsimilar surveys. In Thailand and Malaysia,the productivity dispersion ratios are justbelow 3, and in Korea not much more than 2.Thus, more competitive countries in the group(as proxied by weeks to start a business) havelower levels of productivity dispersion than dothe less-competitive countries.
D O M E S T I C P O L I C I E S T O U N L O C K G L O B A L O P P O R T U N I T I E S
93
gep_ch03.qxd 12/5/02 2:48 PM Page 93

These obstacles can deter foreign investors.Morisset and Lumenga Neso (2002) havecompiled data on the permits and proceduresrequired for entry, access to land and infra-structure, and operation in 32 developing
countries. These administrative proceduresvary across countries, with especially severedelays in obtaining land and building permits.They have found evidence that increased ad-ministrative barriers deter foreign investment.
These findings are supported by a WorldBank survey study that finds a similar resultin a larger sample of 69 developing countries:there is a significant negative correlation be-tween the amount of management time spenton obtaining the necessary paperwork andthe levels of FDI (figure 3.9).
Another obstacle to competition is mani-fested in product delivery costs that go be-yond producers’ control and yet can have anenormous effect on their overall competitivepositions. The effect of the quality of trans-portation, as well as the performance of gov-ernment agencies such as customs admin-istration, can more than offset the costadvantage that producers enjoy at the factorygate. Indian textiles provide one such exam-ple. India’s value added per unit of labor costis lower than almost all its East Asian neigh-bors. However, if one takes into account thelonger delays in clearing customs and thehigher shipping costs, Indian textiles are muchless competitive on international markets.
G L O B A L E C O N O M I C P R O S P E C T S 2 0 0 3
94
0
2
4
6
8
10
12
14
Kore
a, R
ep. o
f
Mal
aysi
a
Thai
land
Philip
pine
s
Chi
na
Indi
a
Note: Productivity dispersion serves as a measure ofinefficiency—more productivity dispersion means moreinefficient firms are allowed to stay in business.Source: World Bank staff, based on survey of more than5,000 firms.
Figure 3.8 Barriers to entry and exitallow inefficient firms to stay in themarket(for productivity dispersion, percent; for weeks, number)
Weeks to start business
Productivity dispersion
Note: Partial correlations control for market size, human capital, and macroeconomic stability.Source: World Bank staff.
Figure 3.9 Difficulties in obtaining licenses and permits discourage FDI(FDI)
LessMoreTime managers spend obtaining permits
y � �0.5937x � 0.1851
Less
More
gep_ch03.qxd 12/5/02 2:48 PM Page 94

Furthermore, World Bank surveys report infor-mation on the number of days needed to clearcustoms (see figure 3.10). Here, India scorespoorly relative to Korea and Thailand, with thetime about 50 percent longer in India (andtriple what many OECD countries report).9
But the issue is not only the average time,but also the variances in clearance time. Fig-ure 3.10 shows the longest delay in the pastyear for a typical firm in three sectors in India.Although the average clearance time is 11 days,the longest delays averaged almost 28 days forgarments and 25 days for pharmaceuticals.10
The transportation costs associated withshipping a container of textiles to the UnitedStates from India are more than 20 percenthigher than shipping costs from Thailand and35 percent higher than shipping costs fromChina (figure 3.11). Variations in maritimedistances explain only a small part of the gap.Delays and inefficiencies in the ports accountfor a higher share of the difference in portproductivity. Together, inefficient customs andports can hurt the investment climate and canerode comparative advantage.
SOEs use resources inefficiently—Another way in which states make competi-tion and entrepreneurship difficult is by theirdirect ownership of many firms and industries.By 1990, SOEs consumed nearly 20 percentof gross domestic investment in developing
economies while producing just more than10 percent of GDP (World Bank 1995). Butstate ownership on such a scale was not sus-tainable. Many SOEs required large subsi-dies from cash-strapped governments to stayafloat, thus constraining government spendingon other priorities. For example, it was esti-mated that “diverting SOE operating subsi-dies to basic education . . . would increasecentral government education expenditures by50 percent in Mexico, 74 percent in Tanzania,160 percent in Tunisia, and 550 percent inIndia” (World Bank 1995).
D O M E S T I C P O L I C I E S T O U N L O C K G L O B A L O P P O R T U N I T I E S
95
Source: World Bank staff; figures based on firm survey data.
Figure 3.10 Inefficient customs hurt Indian exports(average number of days to clear customs)
0
2
4
6
8
10
12
ThailandKorea, Rep. ofChinaIndia
(average number of days in India to clear customs)
0
5
10
15
20
25
30
Pharmaceuticals TextilesGarments
Last time
Longest
Source: World Bank staff.
Figure 3.11 Inefficient ports raise India’stransport costs far above competitors’transport costs(percent cost advantage compared with India of shippingtextiles to the United States)
�10
0
10
20
30
40
50
Brazil Korea,Rep. of
China Indonesia Thailand
East coast,U.S.
West coast, U.S. All U.S.
gep_ch03.qxd 12/5/02 2:48 PM Page 95

Driven in part by the high and unsustain-able fiscal costs of state ownership, countriesaround the world embarked on a massiveprivatization wave. Privatization revenues indeveloping and transition countries increasedfrom almost nothing in the early 1980s tomore than $60 billion in 1997, before de-creasing somewhat to $50 billion in 1998(figure 3.12). It was estimated that by 2000,cumulative privatization revenues worldwidehad exceeded $1 trillion (Megginson andNetter 2001). The bulk of privatization indeveloping countries occurred in services, par-ticularly infrastructure.
—and privatization improves firmperformance—Overall, privatization has dramatically im-proved the performance of former SOEs. Stateenterprises were substantially less efficientthan private firms. Shirley and Walsh (2000)reported that most of the extensive literaturefinds private firms superior to state firms.Of 52 empirical studies, 32 found that the per-formance of private and privatized firms is“significantly superior to that of publicfirms,” and 15 studies found “either that thereis no significant relationship between owner-ship and performance, or that the relationshipis ambiguous (different evidence supports
both public and private superiority). Thedominance of studies finding superior pri-vate performance is robust across all sub-categories” (Shirley and Walsh 2000).
Privatization usually improved financialand operating performance in privatized firms(see Megginson and Netter 2001 for a com-prehensive review of the literature). This resultholds in industrial and developing countriesalike (Boubraki and Cosset 1998a, 1998b;Megginson and Netter 2001). The finding isrobust across case studies, cross-sections offirms from different industries within a givencountry, cross-sections of firms from differ-ent countries, and performance of firms be-fore and after privatization (Sheshinski andLopez-Calva 2000). Moreover, other researchsuggests that privatizations tend, overall, toincrease welfare (Galal and others 1994). Inother words, privatization tends not only toimprove the performance of privatized firmsand to benefit investors, but also to make thecountry better off.
—and is more successful when combinedwith competitionSimply pointing out the overwhelming evi-dence demonstrating improvements in pri-vatized firms, however, masks importantdifferences across industries in the challengesand pitfalls of privatization, especially withregard to introducing competition. Some sec-tors, such as manufacturing, generally lackany economic justification for state ownershipfrom the outset. SOEs that have been priva-tized into such competitive markets—whilebeing freed from unprofitable governmentcontrols or social “mandates”—tend to per-form quite strongly. Indeed, studies show thatthe most robust results occur from privatiza-tion in competitive sectors (Kikeri and Nellis2001).
Infrastructure industries present specialchallengesHowever, in infrastructure sectors such astelecommunications, electricity, gas, andtransport, existing SOEs traditionally were
G L O B A L E C O N O M I C P R O S P E C T S 2 0 0 3
96
0
10
20
30
40
50
60
70
Source: World Bank privatization database.
Figure 3.12 Privatization revenuessoared in the 1990s(in nominal billions of dollars)
1984
1988
1989
1990
1991
1992
1993
1994
1995
1996
1997
1998
1999
gep_ch03.qxd 12/5/02 2:48 PM Page 96

considered “natural monopolies.” It wasalmost an article of faith that, in these indus-tries, a single firm could provide services atthe lowest cost. In most of the world outsideof North America, such natural monopoliestranslated into state-owned monopolies fromthe 1920s through the 1980s. But by the late1980s, the combination of technologicalchange, a clearer understanding of the costs ofstate ownership and monopolies, and a wide-spread failure of SOEs in developing countriesto deliver reliable services to consumers innatural monopolies made privatization andcompetition both technically feasible andpolitically desirable. The benefits from thisprocess are clear: studies suggest that privati-zation or contracting out of public services,including many infrastructure services—ifdone right—can yield efficiency gains equiv-alent to 10 to 30 percent of previous cost(Bartone and others 1991; Carnaghan andBracewell-Milnes 1993; Domberger andPiggott 1994). When real competition is notor cannot be introduced, it is more likely thatprivatization will be less effective, and well-run public firms may do as well as privateones (Kwoka 1996). But even in these cir-cumstances, many private projects haveoutperformed public enterprises. Examplesinclude the water sector in Argentina, Côted’Ivoire, and Guinea (Clarke, Menard, andZuluaga 2000; Noll, Shirley, and Cowan2000).
At least two broad difficulties exist in pro-moting competition when privatizing infra-structure utilities. First, not all components ofinfrastructure industries are equally amenableto competition; therefore, privatization mightnot be appropriate for all activities in a sector.For example, relatively low-cost wireless tech-nologies make most elements of telecommuni-cations potentially competitive, whereas gen-eration of electricity is more likely to supportcompetition than is transmission of electricity.The key to successful reform in any sector is,therefore, an adequate reform of marketstructure to maximize the potential for realcompetition. Market structure reform tries to
distinguish—and to varying degrees separate—the true, natural monopoly elements of a sys-tem from the competitive segments. Second,even when competition is feasible, a dominantincumbent in a network industry often hasboth the incentive and the means to thwartcompetition.
With privatization more likely to be suc-cessful in competitive sectors and with infra-structure sectors, in general, less amenableto competition, it is not surprising that expe-riences in infrastructure privatization offermore mixed outcomes. Perhaps not unexpect-edly one key determinant of privatization suc-cess has been the degree of competition intro-duced in the regulatory regime. As Ambrose,Hennemeyer, and Chapon (1990) note,“[S]imply moving a monopoly from the pub-lic to the private sphere will not result in com-petitive behavior.” Another factor affectingsuccess relates to the sequencing of sectorreforms (including privatization) and the cre-ation of the regulatory institutions that arenecessary to achieve the broader objectives,including promoting competition. Policyreforms such as privatization often haveproceeded faster than the necessary support-ing institutions manage (see, for example,Wellenius 1992). This outcome is hardly sur-prising because privatizing a firm, complicatedthough it may be, is a relatively straight-forward and discrete task when comparedwith building a regulatory agency where noneexisted. Nonetheless, varied experiences withprivatization in the infrastructure sector cau-tion developing countries to develop a systemof checks and balances before privatizing sec-tors in which competition has until recentlybeen a foreign phenomenon.
For several reasons, governments may selloff state monopolies and may grant whole orpartial monopoly privileges to new privateincumbents. The government may face sub-stantial pressure to maximize privatizationrevenues, and the first metric by which thesuccess of the sale is likely to be judged is thesales price. Privatizations tend to be contro-versial, and the government may be wary of
D O M E S T I C P O L I C I E S T O U N L O C K G L O B A L O P P O R T U N I T I E S
97
gep_ch03.qxd 12/5/02 2:48 PM Page 97

being accused of giving away the crown jewelsif the sale price is too low. This wariness, plusa need to build support for privatization, maycreate an incentive to generate a high salesprice, even at the expense of future improve-ments in the network. These pressures mayhave been especially intense during the firstprivatizations when there was little evidencethat privatizations could be successful or thatfailing state-owned firms could attract privateinvestors.
Consider the growth rate of networks intelecommunications when investors weregiven “exclusivity”—temporary monopolyrights—compared with when they were not.In a sample of about 20 countries that pri-vatized their telecommunications firms, onestudy found that although private investorswere willing to pay more for an exclusivityperiod (figure 3.13), telecommunications in-vestment was substantially lower in countriesthat gave exclusivity periods than in countriesthat did not (Wallsten 2000). In other words,investors were likely paying for the expectedstream of monopoly profits, not for the rightto invest.
Another reason for granting monopolies isthe mistaken belief that restricting competi-tion can stimulate investment. As Noll (2000)notes, both the firms operating in a competi-
tive environment and the monopolists face thesame cost of capital, and neither will investunless the expected revenues make the invest-ment worthwhile. The monopolist’s marketpower makes it less, not more, likely to un-dertake a given investment because monopolyprofits are typically obtained by providinglower quantities of the good or service athigher prices. A firm with a guaranteed mo-nopoly is also likely to invest less because itdoes not have to worry about more efficientcompetitors stealing market share. Even thethreat of entry—which is typically the situa-tion when reforms are introduced—can beenough to induce the incumbent to invest.
Indeed, in telecommunications, empiricalwork consistently demonstrates that competi-tion, typically in the form of mobile providers(which have much lower fixed costs thanwire line firms) is extremely successful in im-proving telephone penetration (for example,Fink, Mattoo, and Rathindran 2002; Galaland Nauriyal 1995; Li and Xu 2001; Ros1999; Wallsten 2001a, 2001c). Figure 3.14illustrates how the penetration of the mobiletelephone market in Africa is influenced bycompetitive versus monopolistic regimes.
However, introducing competition—evenwhen technically feasible—can be difficult.Incumbent firms can use their considerable
G L O B A L E C O N O M I C P R O S P E C T S 2 0 0 3
98
Source: African Telecommunication Research ProjectDatabase, DECRG, World Bank.
Figure 3.14 More competition meansmore phones(mobile subscribers per 100 inhabitants)
0.0
0.5
1.0
1.5
2.0
1996 1998 2000 2001 1996 1998 2000 2001
2.5
3.0
3.5
4.0
Monopoly markets
Competitive markets
0
500
1,000
1,500
2,000
2,500
3,000
Note: Average price paid in telecom privatizations.Source: World Bank staff.
Figure 3.13 Granting monopoly rightsbrings in revenues(dollars per line)
ExclusivityNo exclusivity
gep_ch03.qxd 12/5/02 2:48 PM Page 98

market power to ensure that competition neversucceeds. Taking full advantage of the compet-itive forces in the global economy requiresintroducing a regulatory framework thatmaximizes competition. Establishing a clearregulatory framework in advance of privatiz-ing companies is key to achieving a competitiveoutcome. Wallsten (2002) studied 200 coun-tries from 1985 to 1999 and has found that,in telecommunications, creating a regulatorycapacity before privatization is significantlyand positively correlated with subsequentperformance (using measures of capacity andinvestment). Moreover, earlier existence of aregulator seemed to increase the price receivedfor privatized telecommunications firms byreducing uncertainty over the future stream ofearnings.11 Regulatory agencies are discussedin more detail on page 27 and page 33.
Private barriers to competition are often difficult to identify and can be perniciousEven if policy barriers to competition are re-moved, private firms—usually in concentratedindustries—can raise barriers to competition.In particular, dominant firms can exercise theirmarket power to prevent entry by competitorsin order to keep prices and profits high. Suchanticompetitive behavior may be especiallyprevalent among newly privatized firms inindustries that are traditionally dominatedby a single firm, such as telecommunications.Another form of private barriers is collusivebehavior—often in the form of cartels—to fixprices and discourage entry.
Early research explored links first betweenconcentration and profitability and then be-tween concentration and prices. The underly-ing hypothesis in this line of research was thatfirms in highly concentrated markets wouldearn higher profits (implying monopoly prof-its) and would be able to charge higher prices.In general, empirical work supported thisview, finding that firms in highly concentratedmarkets were more profitable and chargedhigher prices (for example, Weiss 1989).In addition, Newfarmer and Marsh (1994)
found a statistically significant relationshipbetween concentration and firm profitabilityin Brazilian manufacturing (table 3.1). Similarresults were reported by Connor (1977) forBrazil and Mexico.
Interpreting these results, however, re-quires care. Both concentration and profitscould be high because firms exercise marketpower and block entry, or because better,more efficient firms are more likely to succeed,to capture higher market shares, and to bemore profitable (Bresnahan 1989; Feenyand Rogers 2000). Nonetheless, empiricalresearch—primarily in industrial countries—demonstrated that there is a great deal ofmarket power in some industries and thatanticompetitive conduct can lead to highprice–cost margins (Bresnahan 1989). And, asWeiss (1989) noted, “[I]n smaller lands and/orin nations with less enthusiasm for antitrust[than in industrial countries], the problemmust surely be greater.”
Many believe that markets in general areless competitive in developing countries. Withthe exception of Brazil, China, India, andIndonesia, domestic markets tend to be small,with low human capital, poor infrastructure,volatile economies, and few manufacturedinputs produced domestically. Surprisingly,
D O M E S T I C P O L I C I E S T O U N L O C K G L O B A L O P P O R T U N I T I E S
99
Table 3.1 Profitability on equity,concentration, and market share (percent):Brazil, 1971–78
Four-firm concentration ratio (CR4)a Relative market share (RMS)b
10 30 50 70 9020 12.3 — — — —40 12.9 14.9 — — —60 13.5 14.5 15.5 — —80 14.1 15.1 16.1 17.1 —
100 14.7 16.7 17.7 18.7 19.7
a. CR4 is the ratio of four largest plants to total industrysales, weighted by the four-digit group product group to salesof firm.b. RMS is the ratio of firm’s sales to industry sales, weightedby four-digit product sales of the firm.Source: Newfarmer and Marsh (1994). Figures are based onregression coefficients holding other structural variables (forexample, size, leverage, capital intensity) at their means.
gep_ch03.qxd 12/5/02 2:48 PM Page 99

though, some evidence suggests that manufac-turing sectors, on average, are not less com-petitive than elsewhere. As Tybout (2000)notes, “[B]ecause of institutional barriers,labor market regulations, poorly function-ing financial markets, and limited domesticdemand, the industrial sectors of developingcountries are often described as insulated,inefficient oligopolies. To date, however, thereis little empirical support for this characteriza-tion. Turnover is substantial in developingcountries that have been studied, unexploitedscale economies are modest, and evidence ofwidespread monopoly rents is lacking.”Nonetheless, he notes, “[I]t would be foolishto conclude that market power is a non-issuein developing countries.”
Collusive behavior and domestic cartelslimit competitionA single firm abusing a dominant marketposition is not the only way firms can engagein anticompetitive practices. Vertical restraintsbetween manufacturers or suppliers anddownstream distributors in the form of exclu-sive dealing and geographic market restric-tions can also raise barriers. In addition, firmsthat would be price-takers individually—andunable alone to control any significant part ofthe market—can work together to controlthe market, thus increasing prices and dis-couraging entry. Collusive behavior is notuncommon, and competition authorities indeveloping countries have prosecuted severalcases of price-fixing, as the illustrative list intable 3.2 suggests. In one colorful example ofa bid-rigging conspiracy in the electrical equip-ment industry (high-voltage switchgears),participants used the phases of the moon todetermine which firm’s turn it was to submitthe “low” bid.12
During the past decade, a number of devel-oping and transition market economies haveadopted or strengthened existing competitionlaws (see box 3.2). More than 90 countrieshave such legislation; more than half the lawswere enacted since 1990. Although the coreprovisions of these laws (addressing issues of
horizontal and vertical restraints, of abuse ofdominant market position, and of mergersand acquisitions [M&A]) are similar, theirscope, institutional design, budgets, staffing,and other resources vary widely. Competitionlaws generally complement and buttress otherpolicies, such as policies on deregulation, pri-vatization, and trade and investment liberal-ization, that enhance competition. However,the overzealous application or misapplicationof competition law in the context of weakadministrative capacity can also have seriousnegative consequences. Effectively implement-ing competition law requires an adequatelyfunded agency with well-trained, knowledge-able, and experienced staff members. This isa challenge in industrial countries and evenmore so in the developing world.13 In this re-gard, some developing countries have madenoteworthy progress, but it is still too early toform an overall view of the effectiveness oftheir competition agencies. International in-vestors have raised the issue that the prolifer-ation of competition laws has led to highercosts for M&A transactions—a primary vehi-cle for FDI. And in some cases, the decisionsarrived at by the competition authorities arehighly questionable.
The remedy for anticompetitive conduct offirms necessarily depends on a country’s ca-pabilities. As the first order of business, allcountries are well advised to look for ways toreduce policy barriers to competition. Small-market countries in particular can look totrade to discipline domestic pricing. Govern-ments in countries with weak regulatorycapacity, high levels of corruption, and pooraccountability would be better advised to dothe following: first, limit the powers of a com-petition agency to review of government poli-cies for their competitive consequences and,second, concentrate on improving informationand reporting requirements of firms so thatincreased transparency will attract entry.Trying to establish more comprehensive com-petition authorities in countries without anappropriate legal-economic framework maysimply create another avenue for corruption
G L O B A L E C O N O M I C P R O S P E C T S 2 0 0 3
100
gep_ch03.qxd 12/5/02 2:48 PM Page 100
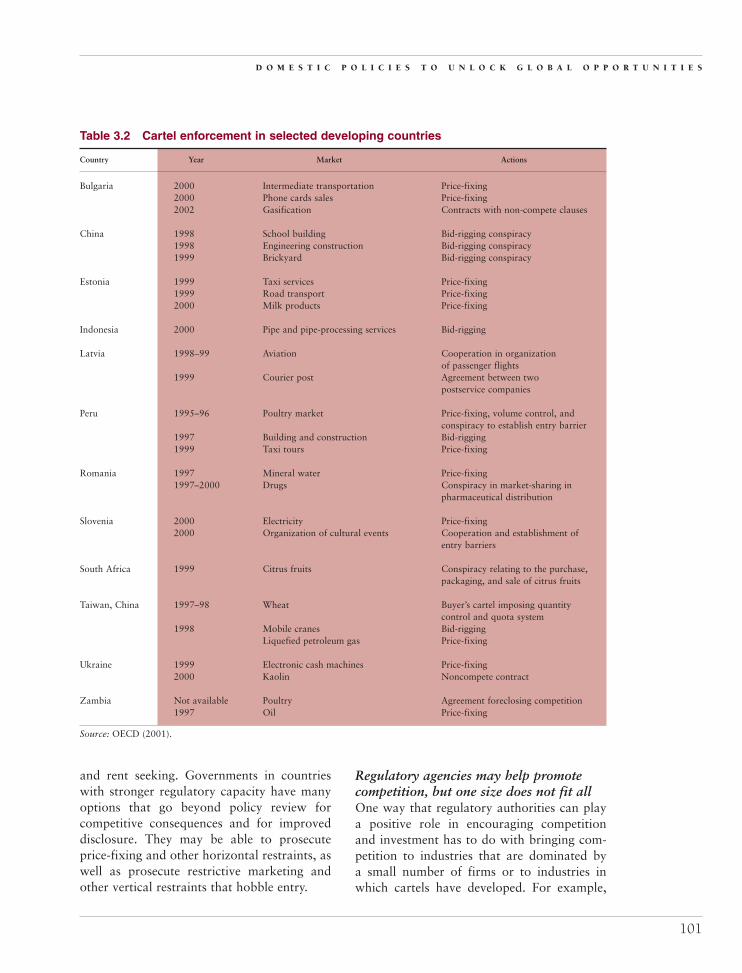
and rent seeking. Governments in countrieswith stronger regulatory capacity have manyoptions that go beyond policy review forcompetitive consequences and for improveddisclosure. They may be able to prosecuteprice-fixing and other horizontal restraints, aswell as prosecute restrictive marketing andother vertical restraints that hobble entry.
Regulatory agencies may help promotecompetition, but one size does not fit allOne way that regulatory authorities can playa positive role in encouraging competitionand investment has to do with bringing com-petition to industries that are dominated bya small number of firms or to industries inwhich cartels have developed. For example,
D O M E S T I C P O L I C I E S T O U N L O C K G L O B A L O P P O R T U N I T I E S
101
Table 3.2 Cartel enforcement in selected developing countries
Country Year Market Actions
Bulgaria 2000 Intermediate transportation Price-fixing2000 Phone cards sales Price-fixing2002 Gasification Contracts with non-compete clauses
China 1998 School building Bid-rigging conspiracy1998 Engineering construction Bid-rigging conspiracy1999 Brickyard Bid-rigging conspiracy
Estonia 1999 Taxi services Price-fixing1999 Road transport Price-fixing2000 Milk products Price-fixing
Indonesia 2000 Pipe and pipe-processing services Bid-rigging
Latvia 1998–99 Aviation Cooperation in organizationof passenger flights
1999 Courier post Agreement between twopostservice companies
Peru 1995–96 Poultry market Price-fixing, volume control, andconspiracy to establish entry barrier
1997 Building and construction Bid-rigging1999 Taxi tours Price-fixing
Romania 1997 Mineral water Price-fixing1997–2000 Drugs Conspiracy in market-sharing in
pharmaceutical distribution
Slovenia 2000 Electricity Price-fixing2000 Organization of cultural events Cooperation and establishment of
entry barriers
South Africa 1999 Citrus fruits Conspiracy relating to the purchase, packaging, and sale of citrus fruits
Taiwan, China 1997–98 Wheat Buyer’s cartel imposing quantitycontrol and quota system
1998 Mobile cranes Bid-riggingLiquefied petroleum gas Price-fixing
Ukraine 1999 Electronic cash machines Price-fixing2000 Kaolin Noncompete contract
Zambia Not available Poultry Agreement foreclosing competition1997 Oil Price-fixing
Source: OECD (2001).
gep_ch03.qxd 12/5/02 2:48 PM Page 101
Galal and Nauriyal (1995) compare the per-formance of the telecommunications sector inseveral countries before and after reforms asthey explore how well countries were able to
balance regulatory objectives: commitment,information asymmetry, and pricing issues. Intheir sample, they find that the country(Chile) that resolved all three issues achieved
G L O B A L E C O N O M I C P R O S P E C T S 2 0 0 3
102
In recent years, many countries have enacted spe-cific legislation to safeguard and encourage com-
petition. Enforcing competition (or antitrust andantimonopoly) laws can increase welfare and canimprove efficiency by combating the negative exter-nalities generated by anticompetitive firm behavior.The focus and objectives of competition agenciesentrusted with this task vary across countries:some, such as Canada, New Zealand, and theUnited States, place the emphasis on consumer wel-fare and economic efficiency, while others, such asBrazil and the European Union (EU) member coun-tries, look to serve the broader “public interest.” Buteven with these differences in scope, the underlyingprinciples are similar.
The conduct provisions of competition lawrelate primarily to the following:
• Horizontal agreements are entered into by firms tofix prices (and agree to similar practices such asbid-rigging; restricting output; and allocating marketshares, geographic markets, or customers). Suchagreements represent an unambiguous welfare loss toconsumers in terms of reduction in price or outputcompetition. Firms that enter into these agreementsare severely prosecuted and, in some countries(Canada and the United States), such conduct istreated as a criminal offense, with CEOs liable forimprisonment. However, such anticompetitive behav-ior is often difficult to investigate because managersgenerally avoid written communication. As a conse-quence, some countries have adopted amnesty orleniency programs for cartel members who are thefirst to “blow the whistle” against other members.Encouraging new entry by removing both privateand policy barriers may be the best policy to combathorizontal agreements because collusive behaviordrops as the number of firms rises.
• Abuse of dominant (AOD) market position (that is,monopolistic practices such as market foreclosure and
Box 3.2 Competition policy and competition lawshare similar objectives across countries
predatory pricing) is more difficult to enforcebecause authorities must focus not on the firm’s sizeor dominance itself (which is not illegal) but ratheron the “abuse” of a dominant position. Competitionagencies must have the expertise to distinguishbetween dominance resulting from superior businesspractices and dominance from erecting anticompeti-tive barriers.
• Vertical restraints between manufacturers, suppliers,and distributors (such as resale price maintenance,exclusive dealing, and geographic market restriction)can be tricky because such measures can improveefficiency just as easily as discourage competition.The emerging consensus is that adverse effects aremore likely to dominate if the participant firms enjoya certain degree of market power. Therefore, verticalrestraints should be evaluated within the context ofAOD market competition laws.
The structural provisions relate primarily to thefollowing:
• Mergers and acquisitions, where the principal con-cerns arise in horizontal transactions, and jointventures compose two structural approaches. Twodifferent views are prevalent. First, when transactionssignificantly reduce firm numbers or increase concen-tration, competition may substantially decrease.Second, transactions may be strongly motivated byefficiency goals, and substantial anticompetitive out-comes are likely only if there are barriers to entry orto new competition. Because most horizontal M&Aactivity will lessen competition but may also increaseefficiency, a cost-benefit approach is often pursued inwhich mergers are exempted or are permitted toproceed on a restructured basis if the efficiency gainsare likely to be greater than the competition losses.
Source: Khemani (2002).
gep_ch03.qxd 12/5/02 2:48 PM Page 102

the greatest improvement, while the country(the Philippines) that did not experienced theworst performance. Countries that resolvedsome issues but not others experienced mixedsuccess. A more recent study of competition,privatization, and regulation hints at the im-portance of effective regulatory institutions(Wallsten 2001a). Like other research (for ex-ample, Petrazzini 1996; Ros 1999), the studyfinds that competition resulting from priva-tization positively affects network growth,but it also concludes that privatization bringsgreater benefits in the presence of an indepen-dent regulator.
Given the potential importance of regula-tory institutions in promoting competition, itmay seem surprising that regulation has beengiven relatively little emphasis in developingcountries. Three factors may have worked todiminish the focus on regulation. First, the pri-vatization wave was picking up strength justas the United States and other industrial coun-tries were engaged in a process of deregula-tion, which often meant removing governmentcontrols to allow the industry to compete orto encourage new entry. Second, privatizationin developing countries often faced competingobjectives because governments want not onlyto maximize revenues from privatizing state-owned firms but also to improve the deliveryof service by firms in the industry. The easiest(and most common) means to increase thefirm’s value for private investors is to includemonopoly rights in service provision, but, un-fortunately, precluding competition is likely toretard investment.
Third, the challenge of building effectiveregulatory agencies is enormous and will notautomatically lead to better outcomes. Theseagencies are costly, require tremendous capac-ity in terms of human resources, and probablywork best in the presence of complementaryorganizations such as competition agencies.Moreover, there is little evidence that, in gen-eral, regulatory agencies in developing coun-tries have been successful. Regulation oftentakes the form of regulating entry, and, asDjankov and others (2002) document, regula-
tion “is generally associated with greater cor-ruption and a larger unofficial economy, butnot with better quality of private or publicgoods. . . . The principal beneficiaries [of reg-ulation] appear to be politicians and bureau-crats themselves.”
This observation does not mean that devel-oping nations are doomed to failure whenbuilding effective regulatory institutions. Italso does not detract from the general pointthat introducing competition in potentiallycompetitive sectors that are dominated by asingle firm requires competent regulation thatboth protects consumers and assures investorsthat their assets will not be expropriated. In-stead, as already discussed, it suggests thatsuch agencies should focus on promoting entry,not regulating it, and that they themselvesshould operate in an especially transparentfashion to gain credibility. This feat is not easyto achieve, and such agencies must find the del-icate balance between accountability and inde-pendence from short-term political pressures.
Public investment in infrastructureand human capital
While the government plays a crucial rolein providing a general framework to
encourage investment and in establishing theconditions that use competition to create effi-ciency, its role as a direct investor is pivotalin shaping investment climate. There is somequestion as to what effect public investmenthas on private investment (see box 3.3). More-over, all governments make public investmentsthat work through several channels: Govern-ments can invest directly in physical andhuman infrastructure provision. In addition,their involvement in less-tangible areas (pro-viding policy stability, setting standards, andestablishing legal and regulatory frameworks)affects opportunities even in areas in whichdirect government involvement is minimal. Inthis section, we will evaluate the scope andrationale for government engagement in theareas of infrastructure and human capitalprovision.
D O M E S T I C P O L I C I E S T O U N L O C K G L O B A L O P P O R T U N I T I E S
103
gep_ch03.qxd 12/5/02 2:48 PM Page 103
G L O B A L E C O N O M I C P R O S P E C T S 2 0 0 3
104
While direct government investment in the econ-omy is necessary, direct expenditures should
be targeted carefully, because resources are scarce. Inparticular, governments should not invest where theprivate sector is willing and able to go. A governmentcan crowd out private investment in two generalways. First, it can invest in areas where the privatereturns are likely to be high. Such investmentsmay tempt politicians because they can then tout“successful” investments on the basis of their highreturns. But such successes are illusory becauseprivate investors would have undertaken the invest-ments anyway, and there is an opportunity cost fromthe suboptimal use of scarce government resources.Second, using high government deficits and borrow-ing to fund public investments can indirectly crowdout private investment by means of macro channelssuch as pushing up interest rates—and thereby raisingborrowing costs—or creating credit constraints forprivate investors. Conversely, some governmentspending can also crowd in investment by attractingadditional private investment that would not other-wise occur. The government may need to buildcertain parts of the infrastructure to attract privateinvestors, to build roads that connect rural areas tomarkets, and to make education universally available.
In any particular country, it is likely that somepublic investment choices will crowd out private in-vestment, while other choices will have the oppositeeffect. It is, therefore, not surprising that the empiri-cal research on which effect dominates is mixed.Aschauer (1989) argues that while public investmentreduces private investment almost one-to-one byencouraging the private sector to take advantage ofpublic capacity instead of building its own, it is alsotrue that public capital (and infrastructure capitalin particular) complements private capital in theproduction of goods and service. Hence, publicinvestment raises the marginal product of privateinvestment so that—despite the direct negativeeffect—the long-term consequence of an increase inpublic investment on private investment is positive.
These results, however, were based exclusivelyon the United States, and a subsequent wave of cross-country tests of the crowd-out or crowd-in hypothe-sis has thus far failed to yield any clear conclusions.
Box 3.3 Does public investment “crowd out” or“crowd in” private investment?
Recent results from the developing world are ambigu-ous and show little consistency. For example, Ahmedand Miller (2000) find general evidence of crowdingout, but note that public infrastructure expenditures,such as spending on transport and communication,seem to crowd in private investment.
Ghura and Goodwin (2000) report a crowd-inresult for a sample of 31 countries, but find morevariation on the regional level: Asian and LatinAmerican countries exhibit crowding out, while Sub-Saharan Africa shows that public and private invest-ment are complements. In a slightly smaller sample,Herrera and Garcia (2000) find crowding out inboth Latin America and East Asia, with the effectmuch stronger for Latin American countries.Everhart and Sumlinski (2001) add SOEs to thedefinition of public investment and, with a sampleof 62 developing countries, find that corruptionexacerbates crowding out. In fact, the effect of thecorruption interaction variable is so significant thatin the long run there may well be no crowding outif no corruption is present.
Finally, Wang (2002), using annual data forEast Asian economies (developing as well as indus-trial), finds evidence of substantial gains from positiveexternalities generated by the public sector, thereforehinting at crowding in. However, he cautions that inthe long run the influence of private production onpublic capital expansion is stronger than the reverse,which might indicate a causal chain in which higherprivate demand leads to greater public investment.
There is thus no consensus within the literatureon whether crowding in or crowding out dominates.Empirical results are often sensitive to sample choiceand vary with regard to individual countries andtime periods. Hence, whether crowding in or crowd-ing out dominates may depend on complex interac-tions between private and public investment. It ispossible that, up to a certain level, higher publicinvestment may encourage private investment andgrowth. However, when undertaken in excess (orwhen existing capacity is used inefficiently), anyadditional increases in the level of public capitalmay crowd out private investment.
Source: World Bank staff.
gep_ch03.qxd 12/5/02 2:48 PM Page 104

D O M E S T I C P O L I C I E S T O U N L O C K G L O B A L O P P O R T U N I T I E S
105
Infrastructure affects opportunities for growthThe quality and availability of infrastructurehas a major effect on investment opportunitiesin the private sector. World Bank (2002) notesthat “improvements in infrastructure servicescan help promote competition in other mar-kets, and there is evidence that infrastructurehas a positive impact on growth and povertyreduction.” In a sample of 100 countries,Easterly and Rebelo (1993) attach an impor-tant role to infrastructure capital—particularlytransportation and communications—in eco-nomic growth. Elements of infrastructure suchas paved roads, telephone density per worker,and adequate generation of electricity havebeen found to have a strong effect on growth(see Easterly and Levine 1997; Canning 1999;and Canning and Bennathan 2000). Even inindustries that have very low requirementsfor energy and transportation services, such asthe software industry, the quality and avail-ability of infrastructure play a key role in se-lecting firm locations because firms rely onsatellite facilities to export their products(Balasubramanyam 2001). In addition to pro-moting economic growth, greater coverage ofinfrastructure services is also a key determi-nant of FDI (Balasubramanyam 2001; Steinand Daude 2001).
Infrastructure is a key determinant of thequality of a nation’s investment climate. Arecent survey study that linked quantitativemeasures of the investment climate to firminvestment and growth experiences demon-strates the potential for improvements in in-frastructure. The study, which is based onmore than 1,000 firms in 10 Indian states,finds that if each state could attain the “bestpractice” in India in terms of regulation andinfrastructure, the national economy couldgrow about 2 percentage points faster (see fig-ure 3.15). The gains would be particularlylarge in the states with weaker investmentclimates (an extra 3.2 percentage points ofgrowth), thus reflecting the fact that the movefrom current to best practice in India wouldbe a large improvement. But even in the states
with stronger climates, there is significantroom for improving the climate in particularareas: moving to the best Indian practicewould add 1.5 percentage points to thegrowth rate for these states. Note that in manyways this is a conservative counterfactualscenario because it would raise states to thelevels of regulation and infrastructure qualitythat are already observed in India. If Indiacould achieve Chinese or Thai levels in variousinvestment climate areas, its potential growthacceleration would be even more dramatic(World Bank 2002a).
The efficiency of infrastructure capacityutilization is just as important as (if not moreimportant than) the capital stock itself.Easterly and Levine (2001) propose that “cre-ating conditions for productive capital accu-mulation is more important than accumula-tion per se and policymakers should focus onencouraging TFP [total factor productivity]growth.” Hulten (1996) notes that those low-and middle-income countries that use infra-structure inefficiently pay a growth penalty inthe form of a much smaller benefit from infra-structure investments. More than 40 percentof the growth differential is due to theefficiency effect, making it the single most
Note: Survey of more than 1,000 firms in 10 Indian states.“Potential” refers to attainment of the “best practice” inIndia in terms of infrastructure and regulation.Source: World Bank staff.
Figure 3.15 Better infrastructure meanshigher growth(annual average GDP growth rate 1992–98, percent)
0Good and bestclimate states
Poor climatestates
All India
1
2
3
4
5
6
7
8
9
Potential
Actual
gep_ch03.qxd 12/5/02 2:48 PM Page 105

G L O B A L E C O N O M I C P R O S P E C T S 2 0 0 3
106
important explanatory variable in differentialgrowth performance. Similarly, Aschauer(2000) attributes an important role to theefficiency variable, although he cannot rejectthe hypothesis of parallel importance of thequantity and effectiveness of public capital atconventional levels. Aschauer (2000) also cal-culates the growth-maximizing level of publiccapital, which is vastly exceeded by the actualsample average of 46 developing countries.Thus, it would seem that the average countryin his sample has overspent on capital expen-ditures, thereby lowering the productivity ofits public investment program.
Investments in human resources arecriticalHuman capital is widely recognized as animportant determinant of development andgrowth. Seminal work by Mankiw, Romer, andWeil (1992) demonstrated a significant im-provement in the explanatory power of theSolow growth model when it included mea-sures of human capital. Similarly, many en-dogenous growth models have benefited fromthe inclusion of an education variable (see,for example, Romer 1990). Barro (1991) found
that for a sample of 98 countries, the growthrate of real per capita GDP during 1960–85was positively related to initial human capital(proxied by 1960 school-enrollment rates).Figure 3.16 illustrates this concept by showinga clear positive relationship between the 1970literacy rate and the growth in GDP per capitabetween 1970 and 2000 for 75 developingcountries.
Easterly and Levine (2001) caution thateconomic growth differences across countriescannot be easily explained by factor (includinghuman capital) accumulation and shouldfocus instead on technology and productivitygrowth. However, the success of dissemina-tion of more advanced technologies in devel-oping economies is largely determined by theabsorptive capacity of the host country. Thatis, to realize the growth potential of newtechnology, the country must possess a highenough stock of human capital to be ableto assimilate the technology. For example,Borensztein, De Gregorio, and Lee (1998)show that the magnitude of the effect of FDIon growth depends on the available stock ofhuman capital in the host country. Within anendogenous growth model, the researchers
Source: World Bank data.
Figure 3.16 Greater literacy is associated with higher growth(1970 literacy rate, in percent)
0
20
40
60
80
100
120
�100 �50 0 50 100
Percent GDP per capita growth rate, 1970–2000
150 200 250
gep_ch03.qxd 12/5/02 2:48 PM Page 106

obtain a positive and highly significant coeffi-cient on the interaction variable between FDIand human capital. The results suggest that“the flow of advanced technology broughtalong by FDI can increase the growth rate ofthe host economy only by interacting withthat country’s absorptive capacity.”
Several other studies have looked at therelationship between FDI and human capital.For example, Coughlin and Segev (1999),Noorbakhsh, Paloni, and Youssef (2001),and Kolstad and Tøndel (2002) show apositive link between FDI inflows and thestock of human capital in the host country.Balasubramanyam (2001) notes that humanresources are a key determinant of FDI.
Countries with the highest levels of bothschooling and FDI grew much faster thancountries with the lowest levels in the pe-riod 1970–89 (figure 3.17). Human capital isalso important as an interaction variable be-tween FDI and domestic private investment.Countries with high levels of human capitalseem to experience crowding in of domesticinvestment by FDI, while countries with less
human capital suffer the opposite effect(Herrera and Garcia 2000). Thus, high levelsof human capital may help increase the overalllevel of investment through a crowd-in mech-anism. Countries with higher human capitalalso have lower fertility rates and higher ratiosof physical investment to GDP. Some evidencesuggests that additional government expen-diture on education induces additional privateexpenditures on education. For instance,Foster and Rosenzweig (1996) show that inIndia higher returns to primary schoolingactually induce increased private investmentin schooling.
Despite the overwhelming consensus thathuman capital is one of the keys to sustainedeconomic growth, finding a robust empiricalrelationship between education and growthhas proven difficult (see Easterly 2001 for areview). One striking example lies in compar-ing East Asia to Sub-Saharan Africa: Between1960 and 1985 East Asia’s per capita GDPgrew more than 4 percentage points quickerthan incomes in Africa, yet Africa’s educa-tional capital growth was actually higher thanAsia’s (Pritchett 1999). However, part of theanswer to this puzzle emerges from the multi-dimensionality of the investment climate:education matters only if people are givenopportunities to use their skills in productiveindustries in a supporting enabling environ-ment. Easterly (2001) contends that econo-mies with low black-market premiums14
on foreign exchange grow faster with higherschooling levels, while economies with highblack-market premiums grow slowly regard-less of the levels of education. That is,“schooling pays off only when governmentactions create incentives for growth ratherthan redistribution.”
Policies to promote competition
While competition and entrepreneurshipare essentially private sector activities,
they require markets that function well. Andit is up to governments to ensure an environ-ment in which markets remain contestable
D O M E S T I C P O L I C I E S T O U N L O C K G L O B A L O P P O R T U N I T I E S
107
Note: The low, medium, and high categories for FDI-to-GDP ratio are below 0.01 percent, 0.01 percent to 0.2percent, and more than 0.2 percent, respectively. For theschooling variable, the low, medium, and high categoriesare below 0.4, 0.4 to 1, and more than 1, respectively.Source: Borensztein, De Gregorio, and Lee (1998).
Figure 3.17 Education raises theproductivity of FDI, which leads to highergrowth(per capita GDP growth rate, in percent)
0
1
1
2
2
3
3
4
4
5
High schooling
Medium schooling
Low schooling
LowMedium
FDI-to-GDP ratio
High
gep_ch03.qxd 12/5/02 2:48 PM Page 107
and entrepreneurship is rewarded, which isnot easy. Entrenched interests are powerful,and it is often hard to determine whetherany particular program is largely in the pub-lic interest or in the interest of a much smal-ler, but more vocal, private constituency. Ingeneral, though, following certain basic prin-ciples can help promote competition andgrowth.
Governments and government agenciesshould operate with transparent rules, shouldminimize corruption, and should respectproperty rights. They should also make it eas-ier to start and run businesses. The maze ofbureaucratic paperwork that is often requiredto start businesses in developing countriesseriously deters entry into many industries.Moreover, such administrative hassles can beespecially pernicious: in some cases they maypunish small, local entrepreneurs who lack theresources to overcome such high hurdles.Having more government agencies that canblock a firm’s path will lead inexorably tomore points at which a firm is required to paybribes to move the process forward.
The government’s role extends beyondsetting up a generally investment-friendly en-vironment. Until the past decade or so, SOEshave had monopolistic positions in many in-dustries throughout the developing world.The recent wave of privatizations not only hasled to large efficiency improvements in thesefirms and their provision of services, but alsohas opened those industries to competition.The greatest improvements in service have oc-curred in industries in which the governmentpromoted competition along with priva-tization and in which it avoided giving theprivatized firm any special monopoly rights.Privatizations are often difficult and contro-versial. However, governments should beaware that while they can usually increase theprice that investors are willing to pay for a pri-vatized firm by giving the firm a monopoly,that same exclusivity usually lowers subse-quent investment. That is, investors will bepaying for the stream of monopoly profits,not for the right to invest more.
Competition and regulatory agencies canbe instrumental in reducing abuses of marketpower and in ensuring that markets remaincontestable. Agencies can work toward thisgeneral vision by focusing on two objectives:protecting consumers while ensuring that theregulatory and market rules are credible toinvestors. These objectives, however, may bedifficult to balance when interests compete forregulatory favor. Moreover, there is the riskthat a new regulatory agency will becomeanother avenue for corruption, especially incountries with very poor investment climates.An agency will be better able to accomplish itsobjectives of correcting market failure whileavoiding government failure if it meets sev-eral criteria. In particular, it must operate ina transparent manner, be accountable, be in-dependent from short-term political pres-sures, have limits on its discretion, and haveadequate capacity to do its job.
The downside associated with failing tomeet these criteria can be severe. For example,investment will be difficult to attract if regula-tory policies can be easily changed to benefitany given politician’s short-term objectives.Likewise, an agency that is not transparentand accountable runs the parallel risks eitherof frightening away investors or of being cap-tured by the industry it is supposed to regulateat the expense of consumers. Without limits toits discretion, meanwhile, an agency may seekto expand its influence into new areas andmay become primarily another obstacle todevelopment and an avenue for rent seeking.Finally, if the agency lacks the capacity to doits job, it will simply be ineffective.
This range of criteria highlights the pointthat—especially in regulatory and competi-tion agencies—one size does not fit all. Theoptimal type of regulatory and competitionagency (if any) depends not only on the con-ditions of the market (for example, to whatextent an individual firm can exercise marketpower to thwart entry), but also on the extentto which the country is likely to be able tocredibly design and run an institution thatmeets these criteria. Larger, more stable
G L O B A L E C O N O M I C P R O S P E C T S 2 0 0 3
108
gep_ch03.qxd 12/5/02 2:48 PM Page 108

countries with effective existing bureaucraciesare more likely to be able to meet all the crite-ria. Other countries may face great difficulties.The resources required to build and ade-quately staff an agency can be quite sizeable,potentially making it unrealistic for a small,poor country. Some have suggested that whenresources and skills are scarce, countries couldwork together to create regional agencies inorder to share the costs and responsibilities.Countries with severe problems of corruptionand with a lack of transparency, meanwhile,may have difficulty convincing consumers andinvestors that a new agency would behave dif-ferently from how the government behaved inthe past. A government intent on overcom-ing this reputation and on encouraging com-petition may make some progress in twoways: increasing the amount of publicly avail-able information on both firms and govern-ment agencies, and taking special steps toensure the transparency of any new initiativeswhile emphasizing the discretionary limits ofthose agencies.
Notes1. Note that these investment categories are not
strictly comparable because the FDI flows are takenfrom balance of payments statistics and include for-eign inflows intended for both new investment andacquisition of existing assets. Meanwhile, the otherinvestment figures are derived from national accountsand refer only to new investment. The “domestic pri-vate” category is calculated as a residual and, there-fore, may not match figures available from othersources.
2. However, his corruption indicator is correlatedwith other explanatory variables so that the coefficienton corruption is not significant once other explanatoryvariables are included in the equation.
3. The rise in FDI is moderated because improve-ments in institutions are also associated with a reduc-tion in FDI as a share of total capital inflows becauseother types of capital inflows are more sensitive toinstitutional quality.
4. Not everyone is persuaded by these cross-country regression results. For example, Rodriguez andRodrik (1999) argue that some indicators of opennessare highly correlated with other indicators of economicperformance—including macroeconomic policy—or
that they imperfectly reflect a country’s trade policyregime. The high correlation of components of theSachs and Warner index with policy and institutionalvariables yields an upward bias in the estimation oftrade restriction effects. Meanwhile, tariff and nontar-iff barriers, the two variables that directly measuretrade openness, have little explanatory power whenconsidered separately in cross-country regressions.
5. Patent citations refer to a requirement in somepatent offices that inventors include in their patentapplication the citations of the patented technologythat they used in developing their invention (seeBranstetter 2000). These citations are used as evidenceof technological spillovers.
6. However, Keller (1998) finds that the role playedby import shares in determining productivity levels islimited. Using the Coe and Helpman (1995) modelwith randomly generated import shares, he also findsa positive relationship between foreign R&D andproductivity.
7. The entry cost measure used in figure 3.6 refersto the costs of obtaining the necessary permits andlicenses and the other procedures required to set up anew establishment. See Djankov and others (2002) forfurther details.
8. See Hallward-Driemeier, Iarossi, and Sokoloff(2002) for a longer discussion; Levinsohn (1993);Haddad and Harrison (1993).
9. Of the various regulatory agencies that are seenas obstacles, customs officials ranked second—onlybehind labor regulators—as a major constraint to doingbusiness in India.
10. Delays are similar for clearing imports throughcustoms. With such uncertainty, firms are likely to needto keep greater inventories of materials on hand, thusincurring significant storage costs and tying upresources that could otherwise be put to more produc-tive use.
11. This will not always be the case, of course. Acountry could easily enact a regulatory regime thatdeters investors and increases the risk premium. Yet,on average, regulatory certainty seemed important toinvestors.
12. See Scherer and Ross (1990), chapters 7 and 8,for a description of this case and others aboutcollusion.
13. Some commentators have suggested that it is amistake to encourage developing and emerging marketeconomies to enact competition laws because the risksof misapplication are high as a result of weak institu-tional capacity. Such laws may also become anotherform of government intervention in markets andmay give rise to corruption. However, such objectionscould also be applied to other policy areas such as taxcollection, bank regulation, and so forth. The main
D O M E S T I C P O L I C I E S T O U N L O C K G L O B A L O P P O R T U N I T I E S
109
gep_ch03.qxd 12/5/02 2:48 PM Page 109

implication instead is that it is important, first, to de-sign a system of checks and balances, including mea-sures for accountability and transparency, and, second,to support institutional building of capacity.
14. The black-market premium here is seen as aproxy for available opportunities for legal and produc-tive employment.
ReferencesAhmed, Habib, and Stephen M. Miller. 2000.
“Crowding-Out and Crowding-In Effects of theComponents of Government Expenditure.” Con-temporary Economic Policy 18(1): 124–33.
Ambrose, William, Paul Hennemeyer, and Jean-PaulChapon. 1990. “Privatizing TelecommunicationsSystems: Business Opportunities in DevelopingCountries.” International Finance CorporationDiscussion Paper. Washington, D.C.
Arthur, Brian. 1994. Increasing Returns and Path De-pendence in the Economy. Ann Arbor: Universityof Michigan Press.
Aschauer, David Alan. 1989. “Does Public CapitalCrowd Out Private Capital?” Journal of Mone-tary Economics 24(2): 171–88.
———. 2000. “Public Capital and Economic Growth:Issues of Quantity, Finance, and Efficiency.” Eco-nomic Development and Cultural Change 48(2):391–406.
Balasubramanyam, V. N. 2001. “Foreign Direct Invest-ment in Developing Countries: Determinantsand Impact.” New Horizons for Foreign DirectInvestment. Paris: Organisation for EconomicCo-operation and Development.
Barro, Robert J. 1991. “Economic Growth in a Cross-Section of Countries.” Quarterly Journal of Eco-nomics 106(2): 407–43.
Bartone, Carl R., Luiz Leite, Thelma Triche, andRoland Schertenleib. 1991. “Private Sector Par-ticipation in Municipal Solid Waste Service:Experiences in Latin America.” Waste Manage-ment and Research 9: 498.
Bergman, Edward M., and Edward J. Feser. 2001.“Industrial and Regional Clusters: Concepts andComparative Applications.” Regional ResearchInstitute, West Virginia University, Morgantown.
Blalock, Garrick. 2001. “Technology From ForeignDirect Investment: Strategic Transfer ThroughSupply Chains.” Haas School of Business Work-ing Paper. Berkeley, Calif.
Bora, Bijit. 2002. “Investment Distortions and theInternational Policy Architecture.” World TradeOrganization Working Paper. Geneva.
Borensztein, E., José De Gregorio, and J. W. Lee. 1998.“How Does Foreign Direct Investment Affect
Economic Growth?” Journal of InternationalEconomics 45(1): 115–35.
Boubraki, Narjess, and Jean-Claude Cosset. 1998a.“The Financial and Operating Peformance ofNewly Privatized Firms: Evidence from Devel-oping Countries.” Journal of Finance 53(3):1081–110.
———. 1998b. “Privatization in Developing Coun-tries: An Analysis of the Performance of NewlyPrivatized Firms.” Public Policy for the PrivateSector. Washington, D.C.: World Bank.
Branstetter, Lee. 2000. “Is Foreign Direct Investment aChannel of Knowledge Spillovers? Evidence fromJapan’s FDI in the United States.” University ofCalifornia–Davis, Economics Department Work-ing Paper. Davis, Calif.
Braun, Bradley, and W. Warren McHone. 1992.“Science Parks as Economic Development Policy:A Case Study Approach.” Economic Develop-ment Quarterly 6(2): 135–47.
Bresnahan, Timothy. 1989. “Empirical Studies ofIndustries with Market Power.” In RichardSchmalensee and Robert Willig, eds., Handbookof Industrial Organization. Amsterdam: ElsevierScience Publishers, pp. 1011–57.
Brown, Cynthia J. 2001. “Gender in Mexico’s MaquilaIndustry.” World Bank, Washington, D.C.Processed.
Canning, David. 1999. “Infrastructure’s Contributionto Aggregate Output.” World Bank Policy Re-search Working Paper. Washington, D.C.
Canning, David, and Esra Bennathan. 2000. “TheSocial Rate of Return on Infrastructure Invest-ments.” World Bank Policy Research WorkingPaper. Washington, D.C.
Carnaghan, Robert, and Barry Bracewell-Milnes.1993. “Testing the Market: Competitive Tender-ing for Government Services in Britain andAbroad.” IEA Research Monograph: London.
Caves, Richard. 1996. Multinational Enterprise andEconomic Analysis. New York: Cambridge Uni-versity Press.
Charkrabarti, Avik. 2001. “The Determinants ofForeign Direct Investment: Sensitivity Analysesof Cross-Country Regressions.” Kyklos 54(1):89–114.
Choudhri, Ehsan, and Dalia S. Hakura. 1999. “Inter-national Trade and Productivity Growth: Explor-ing the Sectoral Effects for Developing Countries.”International Monetary Fund Working PaperSeries. Washington, D.C.
Chunlai, Chen. 1997. “The Location Determinants ofForeign Direct Investment in Developing Coun-tries.” University of Adelaide Working Paper.Adelaide, Australia.
G L O B A L E C O N O M I C P R O S P E C T S 2 0 0 3
110
gep_ch03.qxd 12/5/02 2:48 PM Page 110

Claessens, Stijn, and Leora Klapper. 2002. “Bank-ruptcy Around the World: Explanation for itsRelative Use.” World Bank Policy Research Paper.Washington, D.C.
Clarke, George R. G., Claude Menard, and Ana MariaZuluaga. 2000. “The Welfare Effects of PrivateSector Participation in Guinea’s Urban WaterSupply.” World Bank Policy Research WorkingPaper. Washington, D.C.
Claugue, Christopher, Philip Keefer, Stephen Knack,and Mancur Olson. 1999. “Contract-IntensiveMoney: Contract Enforcement, Property Rights,and Economic Performance.” Journal of Eco-nomic Growth 4: 185–211.
Coe, David T., and Elhanan Helpman. 1995. “Interna-tional R&D Spillovers.” European EconomicReview 39(5): 859–87.
Coe, David T., Elhanan Helpman, and AlexanderW. Hoffmaister. 1997. “North-South R&DSpillovers.” Economic Journal 107(440): 134–49.
Connor, J. 1977. Market Power of Multinationals.New York: Praeger.
Cooper, R. 2001. “Growth and Inequality: The Role ofForeign Trade and Investment.” Paper presentedat ABCDE. Washington, D.C.
Coughlin, Cletus, and Eran Segev. 1999. “ForeignDirect Investment in China: A Spatial Economet-rics Study.” Federal Reserve Bank of St. LouisWorking Paper. St. Louis.
Cuadros, A., V. Orts, and M. T. Alguacil. 2001.“Openness and Growth: Re-examining ForeignDirect Investment, Trade, and Output Linkages inLatin America.” University of NottinghamCREDIT Research Paper. Nottingham, U.K.
Davenport, H. J. 1935. The Economics of Alfred Mar-shall. Ithaca, N.Y.: Cornell University Press.
de Ferranti, David, Guillermo E. Perry, DanielLederman, and William F. Maloney. 2002.From Natural Resources to the KnowledgeEconomy. World Bank, Washington, D.C.
Devereux, Michael P., and Rachel Griffith. 1998.“Taxes and the Location of Production: Evidencefrom a Panel of U.S. Multinationals.” Journal ofPublic Economics 68(3): 335–67.
Djankov, Simeon, Oliver Hart, and Tatiana Nenova.2002. “Efficient Insolvency.” Background Paperfor Doing Business in 2003 report Private SectorAdvisory Services. World Bank, Washington, D.C.
Djankov, Simeon, Rafael La Porta, Florencio Lopez-de-Silanes, and Andrei Shleifer. 2002. “TheRegulation of Entry.” Quarterly Journal ofEconomics 117(1): 1–37.
Domberger, Simon, and John Piggott. 1994. “Privati-zation Policies and Public Enterprise: A Survey.”In Matthew Bishop, John Kay, and Colin P.
Mayer, eds., Privatization and EconomicPerformance. Oxford, U.K.: Oxford UniversityPress.
Easterly, William. 1999. “The Ghost of Financing Gap:Testing the Growth Model Used in the Interna-tional Financial Institutions.” Journal of Devel-opment Economics 60(2): 423–38.
———. 2001. The Elusive Quest for Growth.Cambridge, Mass.: MIT Press.
Easterly, William, and Ross Levine. 1997. “Africa’sGrowth Tragedy: Policies and Ethnic Divisions.”Quarterly Journal of Economics 112(4):1203–50.
———. 2001. “It’s Not Factor Accumulation: StylizedFacts and Growth Models.” World Bank Eco-nomic Review 15(2): 177–219.
Easterly, William, and Sergio Rebelo. 1993. “FiscalPolicy and Economic Growth: An EmpiricalInvestigation.” Journal of Monetary Economics32(3): 417–58.
Eaton, Jonathan, and Samuel Kortum. 1996. “Trade inIdeas: Patenting and Productivity in the OECD.”Journal of International Economics 40(3–4):251–78.
Ellison, Glenn, and Edward L. Glaeser. 1997. “Geo-graphic Concentration in U.S. ManufacturingIndustries: A Dartboard Approach.” Journal ofPolitical Economy 105(5): 889–927.
Emery, James, Melvin T. Spence, Louis T. Wells, andTimothy Buehrer. 2000. “Administrative Barriersto Foreign Investment: Reducing Red Tape inAfrica.” International Finance Corporation Dis-cussion Paper. Washington, D.C.
Encarnation, Dennis, and Louis T. Wells. 1986.“Evaluating Foreign Investment.” In TheodoreMoran, ed., Investing in Development: NewRoles for Private Captial? New Brunswick, NewJersey: Transaction Books.
English, Phillip, and Luc de Wulf. 2002. “ExportDevelopment Policies and Institutions.” In B.Hoekman, A. Mattoo, and P. English, eds., De-velopment, Trade, and the WTO: A Handbook.Washington, D.C., World Bank.
Everhart, Stephen, and Mariusz Sumlinski. 2001.“Trends in Private Investment in DevelopingCountries: Statistics for 1970–2000 and theImpact on Private Investment of Corruptionand the Quality of Public Investment.” Interna-tional Finance Corporation Discussion Paper.Washington, D.C.
Feeny, Simon, and Mark Rogers. 2000. “The Roleof Market Share and Concentration in FirmProfitability: Implications for CompetitionPolicy.” Economic Analysis and Policy 30(2):115–32.
D O M E S T I C P O L I C I E S T O U N L O C K G L O B A L O P P O R T U N I T I E S
111
gep_ch03.qxd 12/5/02 2:48 PM Page 111

Felsenstein, Daniel. 1994. “University-Related ScienceParks: ‘Seedbeds’ or Enclaves of Innovation?”Technovation 14(2): 93–110.
Finger, J. M. 1993. Antidumping. Ann Arbor: Univer-sity of Michigan Press.
Fink, Carsten, Aaditya Mattoo, and RandeepRathindran. 2002. “Liberalizing Basic Telecom-munications: Evidence from Developing Coun-tries.” World Bank Working Paper. Washington,D.C.
Foster, Andrew D., and Mark R. Rosenzweig. 1996.“Technical Change and Human-Capital Returnsand Investments: Evidence from the GreenRevolution.” American Economic Review 86(4):931–53.
Friedman, Eric, Simon Johnson, Daniel Kaufmann,and Pablo Zoido-Lobaton. 2000. “Dodging theGrabbing Hand: The Determinants of UnofficialActivity in 69 Countries.” Journal of Public Eco-nomics 76(3): 459–93.
Galal, Ahmed, and Bharat Nauriyal. 1995. “Regulat-ing Telecommunications in Developing Coun-tries.” World Bank Policy Research WorkingPaper. Washington, D.C.
Galal, Ahmed, Leroy Jones, Tandon Pankaj, and IngoVogelsang. 1994. Welfare Consequences of Sell-ing Public Enterprises: An Empirical Analysis.New York: Oxford University Press.
Ghura, D., and Barry Goodwin. 2000. “Determi-nants of Private Investment: A Cross-RegionalEmpirical Investigation.” Applied Economics32(14): 1819–29.
Guisinger, S., and others. 1985. Investment Incentivesand Performance Requirements. New York:Praeger.
Haddad, Mona, and Harrison, Ann. 1993. “AreThere Positive Spillovers from Direct ForeignInvestment? Evidence from Panel Data forMorocco.” Journal of Development Economics(Netherlands) 42: 51–74.
Hakura, Dalia, and Florence Jaumotte. 1999. “TheRole of Inter- and Intra-Industry Trade inTechnology Diffusion.” International MonetaryFund Working Paper. Washington, D.C.
Hallward-Driemeier, Mary, Guiseppe Iarossi, andKenneth Sokoloff. 2002. “Exports and Manufac-turing Productivity in East Asia: A ComparativeAnalysis with Firm-Level Data,” National Bureauof Economic Research (NBER) Working Paperno. 8894. Cambridge, Mass.
Hausmann, R., and E. Fernandez-Arias. 2000. “TheNew Wave of Capital Inflows: Sea Change of JustAnother Title.” Inter-American DevelopmentBank Working Paper. Washington, D.C.
Herrera, Santiago, and Conrado Garcia. 2000.“Aggregate Investment and Foreign Direct Invest-ment in Latin America and East Asia: Is There aCrowding-Out Effect.” World Bank WorkingPaper. Washington, D.C.
Hines, James R. 1996. “Altered States: Taxes andthe Location of Foreign Direct Investment inAmerica.” American Economic Review 86(5):1076–94.
Hoekman, Bernard, and Kamal Saggi. 2000. “Assess-ing the Case for Extending WTO Disciplines onInvestment-Related Policies.” World Bank Work-ing Paper. Washington, D.C.
Hoekman, Bernard, Hiau Looi Kee, and MarceloOlarreaga. 2001. “Markups, Entry Regulation, andTrade: Does Country Size Matter?” World BankPolicy Research Working Paper. Washington, D.C.
Holmes, Thomas J. 1998. “The Effect of State Policieson the Location of Manufacturing: Evidence fromState Borders.” Journal of Political Economy106(4): 667–705.
Hulten, Charles R. 1996. “Infrastructure Capital andEconomic Growth: How Well You Use It May BeMore Important Than How Much You Have.”National Bureau of Economic Research (NBER)Working Paper. Cambridge, Mass.
Jaffe, Adam. 1989. “Real Effects of AcademicResearch.” American Economic Review 79(5):957–80.
Jaffe, Adam, Manuel Trachtenberg, and RebeccaHenderson. 1993. “Geographic Localization ofKnowledge Spillovers as Evidenced by PatentCitations.” Quarterly Journal of Economics108(3): 577–98.
Jayanthakumaran, K., and John Weiss. 1997. “ExportProcessing Zones in Sri Lanka: A Cost-BenefitAppraisal.” Journal of International Develop-ment 9(5): 727–37.
Johansson, Helena, and Lars Nilsson. 1997. “ExportProcessing Zones as Catalysts.” World Develop-ment 25(12): 2115–28.
Kang, Sung Jin, and Yasuyuki Sawada. 2000. “Finan-cial Repression and External Openness in anEndogenous Growth Model.” Journal of Interna-tional Trade and Economic Development 9(4):427–43.
Keefer, Philip. 1996. “Protection Against a CapriciousState: French Investment and Spanish Railroads,1845–1875.” Journal of Economic History 56(1):170–92.
Keller, Wolfgang. 1998. “Are International R&DSpillovers Trade-Related? Analyzing Spilloversamong Randomly Matched Trade Partners.”European Economic Review 42: 1469–81.
G L O B A L E C O N O M I C P R O S P E C T S 2 0 0 3
112
gep_ch03.qxd 12/5/02 2:48 PM Page 112
———. 2000. “Do Trade Patterns and TechnologyFlows Affect Productivity Growth?” World BankEconomic Review 14(1): 17–48.
Khemani, R. Shyam. 2002. “The Role of CompetitionLaw-Policy.” Unpublished World Bank staffreport.
Kikeri, Sunita, and John Nellis. 2001. “Privatizationin Competitive Sectors: The Record So Far.”Private Sector Advisory Services, World Bank,Washington, D.C.
Knack, Stephen, and Philip Keefer. 1995. “Institutionsand Economic Performance: Cross-Country TestsUsing Alternative Institutional Measures.”Economics and Politics 7(3): 207–27.
Kolstad, Ivar, and Line Tøndel. 2002. “Social De-velopment and Foreign Direct Investments inDeveloping Countries.” Chr. Michelson InstituteReport 11. Bergen, Norway.
Kreye, Otto, Folker Frobel, and Jurgen Heinrichs.1987. “Export Processing Zones in Devel-oping Countries: Results of a New Survey.”Multinational Enterprise Programme WorkingPaper 43. International Labour Organisation,Geneva.
Krugman, Paul. 1991. Geography and Trade.Cambridge, Mass.: MIT Press.
———. 1998. “The Role of Geography in Develop-ment.” Annual World Bank Conference on De-velopment Economics. Washington, D.C.
Kwoka, John E. Jr. 1996. Power Structure: Ownership,Integration, and Competition in the U.S. Elec-tricity Industry. Dordrecht, The Netherlands:Kluwer Academic Publishers.
Lall, Sanjaya. 2001. “Competitiveness Indices andDeveloping Countries: An Economic Evaluationof the Global Competitiveness Report.” WorldDevelopment 29(9): 1501–25.
Lall, Sanjaya, and Paul Streeten. 1977. Foreign Invest-ment, Transnationals, and Developing Countries.Boulder, Colo.: Westview Press.
Lansbury, Melanie, and David Mayes. 1996. “Entry,Exit, Ownership and the Growth of Productivity.”In David Mayes, ed., Sources of ProductivityGrowth. Cambridge, U.K.: Cambridge UniversityPress.
Levinsohn, J. 1993. “Testing the Imports-as-Market-Discipline Hypothesis.” Journal of InternationalEconomics 35(1/2): 1–22.
Li, Wei, and Lixin Colin Xu. 2001. “Liberalization andPerformance in Telecommunications Sectoraround the World.” World Bank Policy ResearchWorking Paper. Washington, D.C.
Lipsey, Robert E. 1999. “The Location and Character-istics of U.S. Affiliates in Asia.” National Bureau
of Economic Research (NBER) Working Paper.Cambridge, Mass.
Love, James H. 1996. “Entry and Exit: A County-LevelAnalysis.” Applied Economics 28(4): 441–51.
Lumenga Neso, Olivier, Marcelo Olarreaga, andMaurice Schiff. 2001. “On Indirect Trade RelatedR&D Spillovers.” World Bank Working Paper.Washington, D.C.
Maloney, W. F. 2001. “Missed Opportunities: Innova-tion and Resource-Based Growth in Latin Amer-ica.” World Bank Working Paper. Washington,D.C.
Mankiw, N. Gregory, David Romer, and David N.Weil. 1992. “A Contribution to the Empirics ofEconomic Growth.” Quarterly Journal of Eco-nomics 107(2): 407–37.
McMillan, John, and Christopher Woodruff. 2002.“The Central Role of Entrepreneurs in TransitionEconomies.” Journal of Economic Perspectives16(3): 153–70.
Megginson, William L., and Jeffrey M. Netter. 2001.“From State to Market: A Survey of EmpiricalStudies on Privatization.” Journal of EconomicLiterature 39(2): 321–89.
Moran, Theodore. 1998. Foreign Direct Investmentand Development. Washington, D.C.: Institutefor International Economics.
———. 2002. Beyond Sweatshops: Foreign DirectInvestment and Globalization in DevelopingCountries. Washington, D.C.: Brookings InstitutePress.
Morisset, Jacques, and Olivier Lumenga Neso. 2002.“Administrative Barriers to Foreign Investmentin Developing Countries.” World Bank PolicyResearch Working Paper. Washington, D.C.
Morisset, Jacques, and Neda Pirnia. 2000. “How TaxPolicy and Incentives Affect Foreign DirectInvestment: A Review.” World Bank PolicyResearch Working Paper. Washington, D.C.
Muendler, Marc-Andreas. 2002. “Trade, Technology,and Productivity: A Study of Brazilian Manufac-turers, 1986–1998.” Dissertation. Berkeley, Calif.
Navaretti, Giorgio Barba, and Isidro Soloaga.“Weightless Machines and Costless Knowledge:An Empirical Analysis of Trade and TechnologyDiffusion.” World Bank Policy Working Paper.Washington, D.C.
Newfarmer, Richard. 2001. “Foreign Direct Invest-ment: Policies and Institutions for Growth.” InNew Horizons for Foreign Direct Investment.Paris: Organisation for Economic Co-operationand Development.
Newfarmer, Richard, and Lawrence Marsh. 1992.“Industrial Structure, Market, and Profitability.”
D O M E S T I C P O L I C I E S T O U N L O C K G L O B A L O P P O R T U N I T I E S
113
gep_ch03.qxd 12/5/02 2:48 PM Page 113
In C. Frischtak and Richard Newfarmer, eds.,Transnational Corporations: Market Structureand Industrial Performance. London: Routledge.
Noll, Roger. 2000. “Telecommunications Reform inDeveloping Countries.” Stanford Institute forEconomic Policy Research (SIEPR) Policy Paper.Stanford, Calif.
Noll, Roger, Mary Shirley, and Simon Cowan. 2000.“Reforming Urban Water Systems in DevelopingCountries.” In Anne Krueger, ed., Economic Pol-icy Reform: The Second Stage. Chicago: Univer-sity of Chicago Press.
Noorbakhsh, Farhad, Alberto Paloni, and Ali Youssef.2001. “Human Capital and FDI Inflows toDeveloping Countries: New Empirical Evidence.”World Development 29(9): 1593–610.
OECD (Organisation for Economic Co-operation andDevelopment). 1996. Trade, Employment, andLabour Standards: A Study of Core Workers’Rights and International Trade. Paris.
———. 2001. “Summary of Cartel Cases Described byInvitees.” Paris: OECD Global Forum on Compe-tition. October 5.
Petrazzini, Ben. 1996. “Competition in Telecoms—Implications for Universal Service and Employ-ment.” Public Policy for the Private Sector:Washington, D.C.: World Bank.
Porter, Michael. 1990. The Competitive Advantage ofNations. New York: Free Press.
Pritchett, Lant. 1999. “The Tyranny of Concepts:Cumulative Depreciated Investment Effort(CUDIE) Is Not the Same as Capital Accumula-tion.” World Bank Policy Research WorkingPaper. Washington, D.C.
Recanatini, Francesca, Scott Wallsten, and Lixin ColinXu. 2000. “Surveying Surveys and QuestioningQuestions: Learning from World Bank Experi-ence.” World Bank Policy Research WorkingPaper Series. Washington, D.C.
Rodriguez, F., and D. Rodrik. 1999. “Trade Policy andEconomic Growth: A Skeptic’s Guide to theCross-National Evidence.” Centre for EconomicPolicy Research Working Paper. London, U.K.
Rodrik, Dani. 1999. The New Global Economy andDeveloping Countries: Making Openness Work.Washington, D.C.: Overseas DevelopmentCouncil.
Romer, Paul. 1990. Endogenous Technological Change.Journal of Political Economy 98(5): 57–102.
Ros, Agustin J. 1999. “Does Ownership or CompetitionMatter? The Effects of TelecommunicationsReform on Network Expansion and Efficiency.”Journal of Regulatory Economics 15(1): 65–92.
Sachs, Jeffrey, and Andrew Warner. 1995. “EconomicConvergence and Economic Policies.” National
Bureau of Economic Research (NBER) WorkingPaper. Cambridge, Mass.
Sargent, John, and Linda Matthews. 1999. “Exploita-tion or Choice? Exploring the Relative Attractive-ness of Employment in Maquiladoras.” Journalof Business Ethics 18: 213–27.
Saxenian, AnnaLee, and Jinn-Yuh Hsu. 2000. “The Sil-icon Valley–Hsinchu Connection: Technical Com-munities and Industrial Upgrading.” University ofCalifornia-Berkeley Working Paper.
Scherer, F. M., and David Ross. 1990. IndustrialMarket Structure and Economic Performance.Boston: Houghton Mifflin.
Schrank, Andrew. 2001. “Export Processing Zones:Free Market Islands or Bridges to StructuralTransformation.” Development Policy Review19(2): 223–42.
Sheshinski, Eytan, and Luiz Felipe Lopez-Calva. 2000.“Privatization and Its Benefits: Theory, Evidence,and Challenges.” Consulting Assistance on Eco-nomic Reform (CAER) II Discussion Paper 35.Cambridge, Mass.: Harvard Institute for Interna-tional Development.
Shirley, Mary M., and Patrick Walsh. 2000. “Publicvs. Private Ownership: The State of the Debate.”World Bank Working Paper. Washington, D.C.
Sjöholm, Fredrik. 1996. “International Transfer ofKnowledge: The Role of International Tradeand Geographic Proximity.” WeltwirtschaftlichesArchiv 132(1): 97–115.
Smarzynska, Beata. 2002. “Does Foreign Direct In-vestment Increase the Productivity of DomesticFirms? In Search of Spillovers through BackwardLinkages.” World Bank Policy Research WorkingPaper. Washington, D.C.
Smarzynska, Beata, and Shang-Jin Wei. 2000. “Cor-ruption and Composition of Foreign DirectInvestment: Firm-Level Evidence.” World BankWorking Paper. Washington, D.C.
Stein, Ernesto, and Christian Daude. 2001. “Institu-tions, Integration, and the Location of ForeignDirect Investment.” New Horizons for ForeignDirect Investment. Paris: Organisation for Eco-nomic Co-operation and Development (OECD).
Stern, Nicholas. 2001. “Investment and Poverty: TheRole of International Financial Institutions.”Economics of Transition 9(2): 259–80.
Tybout, James R. 2000. “Manufacturing Firms inDeveloping Countries: How Well Do They Do,and Why?” Journal of Economic Literature38(1): 11–44.
———. 2001. “Plant and Firm Level Evidence on‘New’ Trade Theories.” National Bureau ofEconomic Research (NBER) Working Paper.Cambridge, Mass.
G L O B A L E C O N O M I C P R O S P E C T S 2 0 0 3
114
gep_ch03.qxd 12/5/02 2:48 PM Page 114
UNCTAD (United Nations Conference on Trade andDevelopment). 1996. “World Investment Report:Investment, Trade, and International PolicyArrangements.” New York.
———. 1997. “World Investment Report: Transna-tional Corporations, Market Structure, and Com-petition Policy.” New York.
———. 1998. “World Investment Report: Trends andDeterminants.” New York.
Van Ryckeghem, Willy. 1995. “Domestic Policy Fac-tors Influencing FDI Inflows in Latin America.” InW. Grabendorff, ed., Foreign Direct Investmentin Developing Countries: The Case of LatinAmerica. Madrid: IRELA.
Villela, Luiz, and Alberto Barreix. 2002. “Taxation andInvestment Promotion.” Background Note forGlobal Economic Prospects 2003. Washington:Inter-American Development Bank.
Wallsten, Scott. 2000. “Telecommunications Privatiza-tion in Developing Countries: The Real Effectsof Exclusivity Periods.” SIEPR Policy Paper.Stanford, Calif.
———. 2001a. “An Econometric Analysis of TelecomCompetition, Privatization, and Regulation inAfrica and Latin America.” Journal of IndustrialEconomics 49(1): 1–20.
———. 2001b. “An Empirical Test of GeographicKnowledge Spillovers Using Geographic Informa-tion Systems and Firm-Level Data.” RegionalScience & Urban Economics 31(5): 571–99.
———. 2001c. “Ringing in the 20th Century: TheEffects of State Monopolies, Private Ownership,and Operating Licenses on Telecommunicationsin Europe, 1892–1914.” World Bank ResearchWorking Paper. Washington, D.C.
———. 2001d. “The Role of Government in RegionalTechnology Development: The Effects of PublicVenture Capital and Science Parks.” SIEPR Work-ing Paper. Stanford, Calif.
———. 2002. “Of Carts and Horses: Regulation andPrivatization in Telecommunications Reforms.”Policy Research Working Paper. Washington, D.C.
Wang, Eric. 2002. “Public Infrastructure and Eco-nomic Growth: A New Approach Applied to East
Asian Economies.” Journal of Policy Modeling24(5): 411–35.
Wei, Shang-Jin. 2000. “How Taxing Is Corruption onInternational Investors?” Review of Economicsand Statistics 82(1): 1–11.
Weiss, Leonard. 1989. Concentration and Price.Cambridge, Mass.: MIT Press.
Wellenius, Björn. 1992. “Telecommunications: WorldBank Experience and Strategy.” World BankDiscussion Paper. Washington, D.C.
Wells, Louis T., Nancy J. Allen, Jacques Morisset, andNeda Pirnia. 2001. “Using Tax Incentives toCompete for Foreign Investment: Are They Worththe Costs?” Foreign Investment Advisory Ser-vice Occasional Paper. World Bank, Washington,D.C.
World Bank. 1995. Bureaucrats in Business: The Eco-nomics and Politics of Government Ownerships.Oxford, U.K.: Oxford University Press.
———. 2001. Global Development Finance 2001:Coalition Building for Effective DevelopmentFinance. Washington, D.C.
———. 2002a. “Improving the Investment Climate inIndia.” Investment Climate Unit Working Paper.Washington, D.C.
———. 2002b. World Development Report 2002:Building Institutions for Markets. Oxford, U.K.:Oxford University Press.
World Economic Forum. 2002. Global Competitive-ness Report 2001–2002. Oxford, U.K., and NewYork: Oxford University Press.
WTO (World Trade Organization). 1998. “Report ofthe Working Group on the Relationship betweenTrade and Investment to the General Council.”WT/WG/TI/2. December 8.
Xu, Bin, and Jianmao Wang. 2000. “Trade, FDI, andInternational Technology Diffusion.” Journal ofEconomic Integration (Korea) 15(4): 585–601.
Zak, Paul. 2001. “Institutions, Property Rights, andGrowth.” The Gruter Institute Working Paperson Law, Economics, and Evolutionary Biology2(1): Article 2.
Zhou, Kate Xiao. 1996. How the Farmers ChangedChina. Boulder, Colo.: Westview Press.
D O M E S T I C P O L I C I E S T O U N L O C K G L O B A L O P P O R T U N I T I E S
115
gep_ch03.qxd 12/5/02 2:48 PM Page 115

Fast-growing developing countries havecommonly been successful in setting upinvestment regimes that facilitate private
investment and marshal competition to ensuregrowth in productivity. As with trade reform,most of the benefit from new sound invest-ment and competition policies comes fromunilateral reforms of domestic policies. Thischapter explores the potential of internationalcollaboration—collaboration principally inthe form of international agreements—to helpdeveloping countries consolidate sound invest-ment climates.
International agreements that are associ-ated with multilateral or regional arrange-ments can potentially provide additionalbenefits when coupled with domestic reforms.Benefits can take several forms. For investmentpolicies, international agreements usually havethe objective of eliciting more investment bylocking in reforms and providing additional in-vestor protections. They can also reduce policyexternalities that have “beggar-thy-neighbor”consequences. Moreover, participating in in-ternational negotiations can prompt partnersto undertake reciprocal reforms that wouldnot otherwise occur, as well as strengthen thehand of domestic reformers. For competitionpolicy, international agreements might lead toremoval of restraints that inhibit competition,thereby unleashing new price competition thatbenefits all countries. A central purpose of thischapter is to identify collective actions thathave the greatest development effects.
Ministers of the World Trade Organization(WTO) set an agenda for investment and com-petition when they met in Doha, Qatar, inNovember 2001, and decided to launch nego-tiations on a multilateral framework that cov-ers investment and competition. These negoti-ations are subject to a decision to be madeby explicit consensus on modalities at theCancún Ministerial Conference, to be held in2003. The purpose of the new framework is“to secure transparent, stable, and predictableconditions for long-term cross-border invest-ment” that will expand trade and “enhancethe contribution of competition policy to in-ternational trade and development.”1
The international community, and develop-ing countries in particular, therefore faces twoquestions: What types of new multilateral ini-tiatives on investment and competition policycan promote more—and more productive—investment, and hence more rapid develop-ment? And, which issues are best tackledthrough voluntary initiatives and multilateralcooperation, and which are best handledthrough binding commitments, such as those inthe WTO and regional arrangements? The an-swers to these questions require a separate dis-cussion of investment and competition policy.
Can coordinated investment policiesincrease flows to developing countriesand reduce beggar-thy-neighbor policies?An overall purpose of coordinating an invest-ment policy is to expand the flow of investment
117
1International Agreements toImprove Investment andCompetition for Development
4
gep_ch04.qxd 12/5/02 2:49 PM Page 117

around the world, to minimize distortions thathurt neighbors, and to help improve economicperformance. Coordination might contributeto achieving these goals through three mainchannels: (a) protecting investors’ rights inorder to increase incentives to invest, (b) liber-alizing investment flows to permit enhancedaccess and competition, and (c) curbing poli-cies that may distort investment flows andtrade at the expense of neighbors.
Analysis suggests several broad conclusions.As with trade reforms, unilateral reforms toliberalize foreign direct investment (FDI) arelikely to have the greatest and most directbenefit for the reforming country. Beyondthis, new international agreements that focuson establishing protections to investors cannotbe predicted to expand markedly the flow ofinvestment to new signatory countries. This isbecause many protections are already coveredthrough bilateral investment treaties (BITs),and even these relatively strong protections donot seem to have increased flows of investmentto signatory developing countries. These factssuggest that expectations for new flows associ-ated with protections emerging from any mul-tilateral agreement should be kept low.
International agreements that allow coun-tries to negotiate reciprocal market liberaliza-tion and to promote nondiscrimination canreinforce sound domestic policies and con-tribute to better performance. Because most ofthe remaining investment restrictions are onservices, the existing General Agreement onTrade in Services (GATS) provides an oppor-tunity to meet this objective. Similarly, curb-ing beggar-thy-neighbor policy externalitiescan benefit developing countries, especiallyif agreements focus on two critical issues.The first issue is the reduction of trade barri-ers that—by depriving developing countriesof market access and discouraging theirexports—will lessen the attractiveness ofopportunities for both foreign and domesticfirms to invest in developing countries’ exportindustries. In this regard, reducing trade barri-ers in developing countries is as important as
reducing trade barriers in rich countries. Thesecond issue is the curbing of emerging com-petition among countries in order to lureforeign investment through incentives. Unfor-tunately, information on the extent of invest-ment incentives is inadequate to assess theireffects. Thus, a high priority for internationalcollaboration is to systematically compile thisinformation.
Finally, participating in international in-vestment agreements may have benefits overand above unilateral reforms if those agree-ments are accompanied by reciprocal marketaccess in areas of importance to developingcountries. These benefits can become clearonly in the course of negotiations.
Collective action can improve competitionGreater competition is associated with morerapid development. Lowering policy barriersto trade and foreign investment in develop-ing countries, as shown in chapter 3 of thisvolume, is a powerful, procompetitive force.International agreements on competition pol-icy might bring benefits beyond unilateralactions—provided that the agreements addressthe major restrictions that adversely affectdeveloping countries.
Restrictions on competition in the globalmarketplace that will most hurt developmentcan take three forms. First, policy barriers inmarkets abroad limit competition from devel-oping countries in these markets. Particularlyharmful are the $311 billion in agriculturalsubsidies and textile quotas, as well as thehigh border protection, tariff distortions (suchas tariff peaks and escalation), and protection-ist use of antidumping. Those policy barriersare common in all countries—rich and pooralike. All of these restrictions limit the abilityof exporters in developing countries to com-pete in international markets.
Second, private restraints on competitioncan adversely affect prices for consumers andproducers in developing countries. For exam-ple, companies that are based in high-incomecountries have cartelized some markets;
G L O B A L E C O N O M I C P R O S P E C T S 2 0 0 3
118
gep_ch04.qxd 12/5/02 2:49 PM Page 118
proven cartels have taxed consumers in devel-oping countries by up to $7 billion in the1990s. Actions that facilitate prosecution ofcartels should be high on the priority list.Such actions can range from more systematicarrangements to exchange information, togranting developing countries the ability tosue under foreign antitrust laws when theirtrade is adversely affected. Indeed, developingcountries would benefit from much greaterefforts to identify and to document restrictivebusiness practices that adversely affect pricesof their trade.
Third, many governments in high-incomecountries officially sanction trade restraints byexempting their companies from domestic an-titrust laws. For example, many governmentspermit their companies to cartelize exports.Although these cartels are shrouded in thesecrecy of government registries, national ex-port cartels may well raise prices to develop-ing countries. Efforts should be made to maketransparent any information on national ex-port cartels. If cartels were found to haveadverse price effects, everyone would benefitfrom reducing these officially sanctioned pri-vate restraints on trade. Similarly, antitrustexemptions of ocean transport have given riseto price-fixing arrangements that systemati-cally hurt consumers everywhere, includingconsumers in developing countries.
Competition policies in developing coun-tries themselves can, in many cases, be im-proved through increased transparency,nondiscrimination, and procedural fairness.However, international cooperation in thiscomplex area of regulation has to recognizethat countries have different capacities andinstitutional settings, which warrant cautionin recommending—much less in mandating—across-the-board policies. This is an area wherevoluntary programs that facilitate learning andadoption of best practice in developing coun-tries can pay high dividends.
This chapter analyzes first the investmentpolicy issues, and then the global competitionissues.
International efforts to promoteinvestment
Any pro-development effort to coordinateinvestment policies through agreement
has as its objectives increasing the flow ofinvestment, minimizing distortions amongcountries, and helping countries participatein the potential gains from investment andinvestment-related trade. Chapter 3 of thisvolume singled out domestic policies that in-fluence the quantity and productivity of pri-vate investment, both domestic and foreign.Governments that have provided stablemacroeconomic policies and effective prop-erty rights for investors, and that have low-ered policy barriers to competition have, byand large, enjoyed greater success in creatingthe conditions for sustained growth. Interna-tional efforts to support these policies cantake several forms: bilateral, regional, andmultilateral. They can be binding, as in thecase of the WTO and the North AmericanFree Trade Agreement (NAFTA), or nonbind-ing, as in the case of the Organisation for Eco-nomic Co-operation and Development(OECD). The current regimen is a mixture ofbinding and nonbonding efforts.
Today’s international investmentframework is a patchwork quilt sewntogether over many yearsThe growing waves of FDI observed in recentdecades have been accompanied by a steadyrise in international agreements on invest-ment. Agreements are typically founded onthe presumptions that cross-border investmentprovides benefits to both investing and reci-pient countries, that rules can minimize dis-putes and provide for their resolution, andthat agreed-on rules can enhance both thequantity and quality of investment. TheHavana Charter, designed to create the Inter-national Trade Organization (ITO) at the endof the 1940s, proposed the inclusion of invest-ment provisions together with trade provi-sions. The investment provisions were quitelimited in scope because many countries—
I N T E R N A T I O N A L A G R E E M E N T S T O I M P R O V E I N V E S T M E N T A N D C O M P E T I T I O N
119
gep_ch04.qxd 12/5/02 2:49 PM Page 119

particularly developing ones—feared foreigncontrol over their natural resources and strate-gic industries.2 Since then, a patchwork quilthas emerged, made of differing bilateraltreaties, regional arrangements, and multilat-eral instruments relating to cross-border in-vestment. This regulatory quilt stands in sharpcontrast to the more comprehensive system
of norms and principles that govern interna-tional trade.
Bilateral agreements. Recent years havewitnessed a surge in BITs. The number of BITsquintupled during the 1990s, reaching 2,099by the end of 2001 (see box 4.1). During 2001alone, 97 countries concluded 158 BITs (see
G L O B A L E C O N O M I C P R O S P E C T S 2 0 0 3
120
The number of BITs mushroomed in the 1990s(see box figures). These agreements typically
contain broad definitions of foreign investment,inclusive of nonequity forms, various types of invest-ment assets (including portfolio investments), andintangible assets such as intellectual property. BITsgenerally avoid a direct regulation of the right toestablishment, referring this matter to national laws(and thus recognizing implicitly the right of hostcountries to regulate the entry of FDI). Most BITs
Box 4.1 What is a BIT?treatment, and treatment according to customaryinternational law. In addition, BITs prescribe specificinvestment protections, which cover topics such asthe transfer of funds, expropriation, and nationaliza-tion. They typically provide for the settlement ofdisputes between the treaty partners and betweeninvestors and the host state. Provisions for so-calledinvestor-state arbitration normally refer to pre-existing arbitration rules, notably those under theInternational Center for the Settlement of Investment
2,000
0
500
1960s 1970s 1980s 1990s
1,000
1,500
Source: UNCTAD (2000).
BITs are increasing...
500
0
100
200
300
400
1960s
Source: UNCTAD (2000).
1970s 1980s 1990s
...even among developing countries
With transition Europe
South-South BITs
North-South
also do not explicitly address ownership and controlissues, though they often cover some operationalrestrictions, such as the admission of key managerialpersonnel. Only a few BITs discipline the use of per-formance requirements.
Most BITs prescribe national treatment, most-favored nation (MFN) treatment, fair and equitable
Disputes (or ICSID, which is affiliated with theWorld Bank); the United Nations Commission onInternational Trade Law (UNCITRAL); or the Inter-national Chamber of Commerce (ICC).
Source: World Bank staff.
gep_ch04.qxd 12/5/02 2:49 PM Page 120

UNCTAD 2002). For much of the post–WorldWar II period, BITs tended to be negotiated ona North-South basis. More recently, however,there has been strong growth in the numberof South-South BITs. In 2001, for example,treaties between developing countries ac-counted for 42 percent of new BITs (UNCTAD2002). BITs covered an average of 50 percentof all foreign investment flows to developingcountries in 1999–2001.
Regional arrangements. Investment disci-plines have figured prominently in regionaltrade and integration agreements, particularlythe most recent ones. Some of these agree-ments embed foreign investment into abroader framework of rules that are aimed atpromoting economic cooperation and deeperintegration. This framework includes theEuropean Union; NAFTA; the free tradeagreement linking the G-3 countries (Mexico,the República Bolivariana de Venezuela, andColombia); the recently concluded Singapore-Japan agreement; and the European FreeTrade Area. Other agreements—such as theOECD’s Codes of Liberalization of CapitalMovements, the Colonia Protocol on the Pro-motion and Reciprocal Protection of Invest-ments within the Southern Cone CommonMarket (Mercosur), and the Asia PacificEconomic Cooperation (APEC) Non-BindingInvestment Principles—are less comprehensivewith regard to their treatment of the trade-investment interface.
A distinguishing feature of regional agree-ments with investment disciplines is their ten-dency to address both investment protectionand liberalization (entry) issues, together withdisciplines on post-establishment operatingconditions and means to settle investmentdisputes (both state-to-state and investor-state disputes). The architecture of the most-advanced regional free trade and integrationagreements reflects the complex interrelationsamong investment, trade, services, intellectualproperty rights, competition policy, and themovement of business people. Other impor-tant issues that are dealt with in some regional
agreements include technology transfers, envi-ronmental protection, taxation, conflictingrequirements, and standards for the conductof multinational enterprises.
Multilateral accords. Significant multilateralrules for investment were put in place dur-ing the Uruguay Round, which concluded in1994. All of the following agreements eitherdirectly or indirectly address key investmentissues: the Agreement on Subsidies and Coun-tervailing Measures (ASCM), the Agreementon Trade-Related Investment Measures(TRIMs), the GATS, the Agreement on Trade-Related Aspects of Intellectual Property Rights(TRIPs), and the plurilateral Government Pro-curement Agreement.
Numerous multilateral agreements andarrangements that have been concluded out-side the WTO also affect investment and canmake a positive contribution to enhancinginvestment climates in developing countries.Among others, these arrangements includeefforts to curb bribery and corruption (OECD,Organization of American States [OAS]); rulesgoverning the conduct of multinational enter-prises (OECD Guidelines on MultinationalEnterprises, United Nations [U.N.] GlobalCompact); guidelines on corporate socialresponsibility and corporate governance(OECD, World Bank); and cooperation onbest practices in investment promotion activi-ties (U.N. Conference on Trade and Develop-ment (UNCTAD), World Bank).
New efforts exist for collective action oninvestmentThe rising tide of FDI around the world hasbeen, in part, a consequence of a progressive re-ceptivity of developing countries to FDI flows.Just as tariffs have fallen, so too have restric-tions on incoming investments (particularly inmanufacturing) been lifted. Governments oncehostile to transnational corporations (TNCs)now actively seek their participation—andeven compete for it. One indicator of this is thechange in investment regulations. Between1991 and 2001, a total of 1,393 regulatory
I N T E R N A T I O N A L A G R E E M E N T S T O I M P R O V E I N V E S T M E N T A N D C O M P E T I T I O N
121
gep_ch04.qxd 12/5/02 2:49 PM Page 121

changes were introduced in national FDIregimes, of which 1,315 (or 95 percent) were inthe direction of creating a more favorable envi-ronment for FDI (figure 4.1). During 2001alone, a total of 208 regulatory changes weremade by 71 countries, only 14 of which (or6 percent) were less favorable for foreign in-vestors (UNCTAD 2002). This opens the ques-tion of whether this evident willingness to im-prove the investment regime could be leveragedto achieve some additional benefits, throughreciprocating in multilateral negotiations, anissue that we take up below.
The potential—and the challenge—of co-operation on investment policies becomeclearer if it is broken down into the three coresubagendas that parallel the investment cli-mate discussions in chapters 2 and 3. Thesepolicies relate to liberalizing investment to
facilitate access and entry, establishing in-vestor protections as an incentive to invest,and curbing investment-distorting policiesthat affect trade and investment location.
Liberalizing investment promotes market access—The inclusion of investment in internationalnegotiations may lead to greater openness ofinvestment regimes that can be accomplishedunilaterally. If investment is negotiated as partof a broader set of trade negotiations, ratherthan in isolation, then the traditional mecha-nism of reciprocal access concessions can helpcreate support for greater openness at homeand abroad. For example, exporters in devel-oping countries who obtain improved accessto foreign agricultural markets can be a coun-tervailing force against those who resist the
G L O B A L E C O N O M I C P R O S P E C T S 2 0 0 3
122
Because investment regulations extend beyond tar-iffs into domestic regulation, the political difficul-
ties of enticing large groups of countries to harmo-nize their domestic rules are not trivial. Thosedifficulties were evident in the latest—and failed—attempt at crafting a multilateral accord. In 1995,developed countries pushed to establish a Multilat-eral Agreement on Investment (MAI) within theOECD that had the objective of setting “state of theart standards for investment regimes and investmentprotection with effective dispute settlement proce-dures.”3 These efforts were unsuccessful, and theMAI was not established.
One reason for the MAI’s demise was the wan-ing support within the business community as it be-came apparent that the level of investment protectionafforded to MAI signatories would almost certainlybe lower than that offered in BITs. It was apparentthat prospects for significant investment liberaliza-tion would be held back, first, by concerns of freeriding by non-OECD WTO members (which stoodto receive many of the benefits of the MAI by virtue
Box 4.2 The Multilateral Agreement on Investment (MAI)
of the GATS’s MFN requirement without makingany reciprocal concessions). Also at play was thereluctance of OECD countries to open up sensitivesectors to foreign investment (for example, to mar-itime transport and audiovisual services). Labor andenvironmental groups objected to the fact that theMAI would give TNCs more power to ignore work-ers’ interests and environmental concerns whileproviding them with extensive rights to challengedomestic regulatory conduct before internationalarbitration panels. Meanwhile, many developingcountries, left out of the discussions because of theMAI’s venue in the OECD, protested their unwilling-ness to accept rules that they had no voice in design-ing (Gilpin 2000).4 By the fall of 1998, negotiationson the MAI were formally abandoned, thereby offer-ing sobering insights on the complexity and politicalsensitivities involved in attempts at comprehensiveinvestment rulemaking.
Source: World Bank staff.
gep_ch04.qxd 12/5/02 2:49 PM Page 122

elimination of investment barriers in telecom-munications. At the same time, the need tofight these battles about the domestic politi-cal economy makes a country a credible ne-gotiator for improved access. The process, if itworks, could produce a double benefit: liber-alizing countries would benefit from the in-creased competition that is associated withFDI, and their firms would have improvedaccess to foreign markets. A key issue—whichcan be determined only during the negotiationprocess—is the extent to which an investmentagreement leverages reciprocal commitmentsamong trading partners. Because reciprocalgains are difficult to gauge, an important pre-requisite for each country is to ensure that anydomestic policy commitment makes sensewhen seen through the lens of promotingnational development.
Even though most foreign investment orig-inates in rich countries and is destined forother rich countries, there may well be somescope for reciprocal agreements that benefitdeveloping countries, even within the narrowdomain of investment. Because developingcountries are increasingly becoming active asinvestors themselves, they have a mutual in-terest in clear rules of access. They tend to
invest primarily in other developing countries.Estimates suggest that nearly one-third offoreign investment flows to developing coun-tries originated in other developing countries,up from negligible amounts in the early 1990s(World Bank 2002a), so South-South FDIflows have grown.5 (See figures 4.2 and 4.3.)
I N T E R N A T I O N A L A G R E E M E N T S T O I M P R O V E I N V E S T M E N T A N D C O M P E T I T I O N
123
0
10
20
30
40
50
60
80
70
Source: UNCTAD (2002).
1991
1992
1993
1994
1995
1996
1997
1998
1999
2000
2001
Figure 4.1 Countries are increasingly liberalizing their investment regimes
National regulatory changes in FDI regimes, 1991–2000
(number of regulatory changes)
0
50
100
150
250
200More favorable to FDI
Less favorable to FDI
1991
1992
1993
1994
1995
1996
1997
1998
1999
2000
2001
(number of regulatory changes)
Source: Aykut and Ratha (2002).
Figure 4.2 South-South FDI is rising
FDI flows to developing countries
10
020001994 1995 1996 1997 1998 1999
20
40
30
50
60
70
80
90
100
High non-OECD countries
High OECD (North-South) countries
South-South
(billions of dollars)
gep_ch04.qxd 12/5/02 2:49 PM Page 123

The preceding argues that the potentialfor benefits investment agreements to gener-ate merits examination. Coordinated efforts toliberalize investments can subsume two issues:first, transparency, and second, nondiscrimi-nation in treatment of foreign investment inmarket access.
Transparency. Transparency involves mak-ing relevant laws and regulations availableto the public, notifying parties when lawschange, and ensuring uniform administrationand application. In addition, transparency canbe increased by offering affected parties theopportunity to comment on laws and regula-tions, which implies communicating the policyobjectives of proposed changes, allowing timefor public review, and providing a means tocommunicate with relevant authorities.
A nontransparent business environment ina host country raises information costs, divertscorporate energies toward rent-seeking activi-ties, and may give rise to corrupt practices. Thisenvironment weighs down both domestic andforeign businesses, though in many cases it maybe particularly discouraging to foreigners whoare usually less privy to locally available infor-mation. This heightened risk of operating in
the host country’s business environment eithertranslates into higher risk premiums (in the caseof pricing corporate assets) or imposes addi-tional information costs on enterprises. To besure, transparency, alone, can add little if theunderlying laws and rules are inadequate orunpredictable.
Case studies suggest that companies may,for example, be willing to invest in countrieswith legal and regulatory frameworks thatwould not otherwise be considered “investorfriendly”—provided the companies are able toobtain a reasonable degree of clarity about theenvironment in which they will be operating.Conversely, there appear to be certain thresh-old levels for transparency beneath which thebusiness conditions become so opaque thatvirtually no investor is willing to enter, re-gardless of the extent of the inducement.
These policies do not lend themselves wellto including sanction-based dispute resolutionprocedures in legally binding agreements.Thus, international collaborative efforts shouldperhaps take other forms such as increasingdeveloping countries’ participation in nonbind-ing best-practice instruments or developing as-sistance to strengthen institutions. To the ex-tent that transparency obligations are anchoredin WTO agreements, monitoring by multilat-eral peer review and surveillance may providethe best means for promoting governance-enhancing reforms in host countries.
Nondiscrimination in treatment of foreigninvestment in market access. The practice ofplacing foreign and domestic sellers on anequal competitive footing is a hallmark oftrade agreements. This objective is no lessimportant in investment agreements. Promot-ing liberalization in international investmentessentially boils down to securing nondiscrim-inatory terms of entry and operation. Thisapproach has elements of both MFN treat-ment (that is, nondiscrimination as between allforeign entities) and national treatment (thatis, nondiscrimination between “like” domesticand foreign entities).
G L O B A L E C O N O M I C P R O S P E C T S 2 0 0 3
124
0
1994 1996 1997 1998 1999
102030405060708090
100
Source: Aykut and Ratha (2002).
Figure 4.3 Share of South-South FDI intotal FDI is rising
South-South FDI is rising and so is its share in totalFDI
1995 2000
High-incomenon-OECD/total FDI
South-South FDI/total FDI
North-South FDI/total FDI
(percent)
gep_ch04.qxd 12/5/02 2:49 PM Page 124

Departures from nondiscriminatory treat-ment essentially take one of two forms: beforeentry in the “pre-establishment” phase of aninvestment, and after entry in the “postestab-lishment” operating conditions of a business.Governments everywhere have been reluctantto extend full pre-establishment privileges toall potential entrants in every sector. Securingnondiscriminatory conditions of treatment isequally important in the postestablishmentphase, because foreign investors will typicallyhave significant start-up costs and will beaverse to sudden, unanticipated changes inregulatory conditions that may tilt competi-tive conditions in favor of local competitors.Nondiscrimination commitments in the post-
establishment phase can thus send to foreigninvestors powerful signals of the credibility ofa host country’s reform efforts.
By far the most contentious aspect of liber-alization is the pre-establishment commitmentto openness, given the tendency to maintainrestrictions on entry in a few sensitive sectors.Most countries now permit liberal access toforeign investors in manufacturing. The sameholds true—if to a lesser extent—in miningand agriculture. Indeed, as a result of variousinvestment incentive schemes that are notavailable to domestic firms, foreign investorsin manufacturing often enjoy treatment thatis better than that available to domestic in-vestors. Most governmental measures that
I N T E R N A T I O N A L A G R E E M E N T S T O I M P R O V E I N V E S T M E N T A N D C O M P E T I T I O N
125
Most FDI flows within developing countries arebetween the Association of Southeast Asian
Nations (ASEAN) countries, and, recently, amongthe Latin American countries, especially the Mercosurmembers (UNCTAD 1999). There are signs thatFDI flows from East and Southeast Asia to LatinAmerica and Africa are picking up. According to theChinese Ministry of Foreign Trade and EconomicCooperation, China attracted $3 billion in invest-ment from 22 developing countries in 1998. Thoughthis figure made up only 7 percent of total FDI in-flows to China, the flows originated in a wide spec-trum of countries (in terms of size and per capitaincome levels) and extended to varying sectors(Aykut and Ratha 2002). In addition, Chinese TNCsare becoming prominent in world markets. Chinahas invested, not only in Asian countries, but also inBangladesh, Brazil, India, the Islamic Republic ofIran, and Poland, in addition to countries in Africa.
The Republic of Korea, an OECD member,invested nearly one-third of its direct investment indeveloping countries (excluding those in Africaand the Middle East) in 1998. By 1999, Korea hadinvested nearly 50 percent of its aggregate invest-ment in other developing countries. Malaysian FDI
Box 4.3 South-South flows: who invests and whoreceives?
has also expanded its boundaries from East Asia toLatin America and to parts of Africa. Since the sec-ond half of the 1990s, almost 30 percent of totalFDI inflows into India are from other developingcountries—the principal sources being Mauritius,Malaysia, and Korea (Aykut and Ratha 2002). Out-flows from Latin America in 2001 were directed pri-marily at other countries in the region (UNCTAD2002). Chile continued to be the major player ininterregional investment, followed closely by Mexicoand Argentina. Some South African TNCs haverecently moved to a strategy of international growth,partly through cross-border mergers and acquisi-tions. A noteworthy example of a global player isSouth African Breweries, which operates 108 brew-eries in 24 countries including China, large parts ofAfrica, and Europe (UNCTAD 2002). FDI outflowsfrom the Central and Eastern European countriessuch as Croatia, Estonia, and Slovenia are alsoheaded primarily to neighboring countries. A ten-dency to invest in neighboring countries that are atsimilar or lower levels of development is another fea-ture of South-South FDI (Aykut and Ratha 2002).
Source: World Bank staff.
gep_ch04.qxd 12/5/02 2:49 PM Page 125

overtly discriminate against foreign investorsand that restrict FDI inflows are maintained inthe service sector and concern key industriessuch as telecommunications, broadcasting andrelated audiovisual services, satellite services,energy services, financial services (especiallybanking and insurance), civil aviation, andmaritime transport.6 Sauvé (2002) estimatesthat 80–85 percent of restrictions affecting in-ternational investment are maintained in ser-vice sectors. Among the most dynamic sectorsof the global economy, services are also wheresome two-thirds of cross-border FDIs havebeen directed in recent years (see chapter 2,this volume).
One telling proxy of the potential of ser-vices for investment liberalization is providedby the negative lists of measures drawn up byprospective signatories of the ill-fated MAI.The lists identify those sectors in which thenegotiators wished to restrict access by foreigninvestors (see figure 4.4). A similar trend is ev-ident under the NAFTA. Simply put, the mar-ket access or agenda for investment is largelycentered on services (Hoekman and Saggi2000; Sauvé and Wilkie 2000).
A multilateral vehicle already exists forrealizing the positive externalities that poten-
tially arise from the liberalization of invest-ment in services: the GATS. The GATS hasseveral features that are attractive to countries,potentially making it a useful tool to widennondiscriminatory access in a reciprocal frame-work. By having a positive list approach—inwhich countries voluntarily schedule sectoralcommitments to apply national treatmentand to grant market access—governmentsenjoy considerable flexibility to exempt sec-tors that they deem of special national interest.Once commitments are undertaken, countriesaccord all suppliers—foreign and nationalalike—the same conditions of entry and oper-ation in a nondiscriminatory fashion. To date,however, the GATS has fallen short of itsliberalizing potential. The coverage of com-mitments for a large number of countries islimited. About two-thirds of the WTO mem-bership has scheduled fewer than 60 sectors(of the 160 or so specified in the GATS list)(see Stern 2002). In many cases, commitmentsdo not reflect the actual degree of openness(Mattoo 2000). In other cases, countries havenot moved actively to schedule sectors—evenwhen domestic policies are open to foreigninvestments. Finally, sometimes countries’commitments serve to protect the privileged
G L O B A L E C O N O M I C P R O S P E C T S 2 0 0 3
126
Note: Listed are nonconforming measures reserved under the draft Multilateral Agreement on Investment.Source: Sauvé (2002).
Figure 4.4 Revealed preferences: governments shield services more often thanmanufacturing from the winds of investment competition
Business
Communication
Construction
Financial
Tourism
Recreation
Transport
Other
Total
16%
16%
2%
21%
2%
2%
37%
4%
100%
All sectors21%
Goods16%
Services63%
gep_ch04.qxd 12/5/02 2:49 PM Page 126

position of incumbents, domestic or foreign,rather than to enhance the contestability ofmarkets.
Countries could take greater advantage ofthe opportunity offered by the GATS to lendcredibility to reform programs by committingto maintain current levels of openness or byprecommitting to greater levels of futureopenness. To advance the process of servicesreforms beyond levels undertaken indepen-dently and to lead to more balanced outcomesfrom the developing countries’ points of view,countries could better harness the power ofreciprocity by devising negotiating formulasthat widen the scope for tradeoffs across sec-tors (both goods and services) and acrossmodes of delivery, notably temporary move-ment of workers (Mattoo 2002).
—but protecting investment may not increase flowsA foundation of any country’s investment cli-mate is the protection of property rights forits investors. An agreement that encouragescountries to improve investor protections hasthe potential for improving investment flowsfrom abroad and for eliciting more domesticinvestment. The international community, ingeneral, and developing countries, in particu-lar, might find three benefits from multilateraldisciplines on investment protection.
First, an agreement on common standardswould promote efficiency by carrying poten-tially significant economies of scale in makingrules: one multilateral agreement could be-come a “one-stop” substitute for the complexand legally divergent web of existing BITs.
Second, a multilateral regime for invest-ment protection could help counterbalancethe bargaining asymmetries built into BITsand into regional agreements conducted alongNorth-South lines. In some cases, the negoti-ating asymmetries that are common to bilat-eral agreements have led to treaties in whichdeveloping countries have taken on substan-tive obligations without any reciprocity otherthan the promise of increases in future privateinvestment. However, there is an important
caveat to this argument: To the extent thatthe power imbalance is redressed in a multi-lateral agreement in favor of weaker states,then the constituencies within the global busi-ness community may well prefer—as was thecase in the MAI negotiations—the strongerlevel of investment protection flowing fromBITs, and may lose interest in a multilateralagreement.
Third, a multilateral set of disciplines oninvestment protection would arguably helpdeveloping countries send a positive signal topotential foreign investors regarding the per-manence of policy changes, the expectedstandard of treatment afforded to foreign in-vestors, and recourse to a dispute-settlementprocedure.
While these factors suggest that investmentflows might increase because of such anarrangement, care should be taken not tooverstate the response of investors. Five factsargue for caution. First, the absence of a bodyof multilateral disciplines on investmentprotection has hardly deterred cross-borderinvestment activity. Indeed, FDI has far out-stripped trade and output growth over thepast decade and a half (see figure 4.5).
Second, the absence of an agreement hasnot prevented substantial unilateral reform(see discussion above, and figure 4.1).
Third, a more precise indicator is the his-torical experience of the BITs in eliciting newinvestment. Does the signing of BITs increasethe flow of FDI? Hallward-Driemeier (2002)finds few independent effects of BITs on sub-sequent increases in investment (box 4.4).
Fourth, it is not clear whether multilateralinvestment disciplines—whether in the U.N.,WTO, or OECD—will embody investmentprotections that are superior—and, therefore,additive—to BITs. In the case of the WTO, theDoha Ministerial Declaration reflects a signif-icantly more-limited approach that clearlydoes not view a multilateral framework on in-vestment as a substitute for bilateral and re-gional arrangements. Recent negotiating briefsin the WTO indicate that some major coun-tries have withdrawn support for investor-state
I N T E R N A T I O N A L A G R E E M E N T S T O I M P R O V E I N V E S T M E N T A N D C O M P E T I T I O N
127
gep_ch04.qxd 12/5/02 2:49 PM Page 127

dispute settlement, which would tend to lessenthe additive value of investor protection in amultilateral accord.
Dispute settlement is another critical—andas yet unresolved—issue that will influencethe content of any multilateral agreement tostrengthen investor protections. Most BITscontain dispute resolution mechanisms thatallow investors to challenge government rul-ings before arbitration panels or internationalcourts. In the context of the WTO, while thereis generally little support for the inclusionof investor-state arbitration provisions in aprospective multilateral investment agree-ment, WTO rules on investment protectioncould entail complications even when admin-istered through state-to-state dispute settle-ment. For example, what would be the appro-priate remedy in an instance of unlawfulexpropriation of a foreign investment? Thesedifficult and contentious issues will take timeto resolve in any international agreement.
Beggar-thy-neighbor investmentdistortions must be minimizedGovernments have adopted policies that mayaffect the location and performance of trans-
national investment. Three negative policyexternalities—when one country’s policiesadversely affect another—merit discussion.The first and most powerful of these negativepolicy externalities are investment-distortingtrade barriers. Tariffs, tariff escalation,and other forms of protection discourageinvestment—both foreign and domestic—inexport industries in developing countries.Said differently, if developing countries con-front impediments to market access abroad,the effect of the barriers is to lower the poten-tial stream of earnings in their export activities.This change reduces the incentive for foreignand domestic investors to invest in produc-tion for export in developing countries. Quotaarrangements, antidumping actions, subsidies,overly restrictive rules of origin, and othertrade restrictions distort not only trade, butalso investment, and these distortions arearguably the largest negative policy externalityaffecting investment in developing countries.
Two other sets of policy externalities figureprominently in investment decisions: perfor-mance requirements—to compel multina-tional companies to locate a greater part of thevalue added chain in the domestic market—
G L O B A L E C O N O M I C P R O S P E C T S 2 0 0 3
128
Figure 4.5 FDI is growing faster than exports and output
Source: UNCTAD (2001), Handbook of Statistics: World Bank (2002), World Development Indicators; and WTO (2001),International Trade Statistics.
Developing countries: merchandise exports, output, and FDI inflows, 1980–2000
(index, 1980 � 100; average annual growth rates in parentheses)
0
500
1980 1982 1984 1986 1988 1990 1992 1994 1996 1998 2000
1,000
1,500
2,000
2,500
3,000FDI inflows(1981–90: 5.3%)(1991–2000: 20.8%)
GDP(1981–90: 3.2%)(1991–2000: 4.4%)
Merchandise exports(1981–90: 3.3%)(1991–2000: 9.6%)
gep_ch04.qxd 12/5/02 2:49 PM Page 128
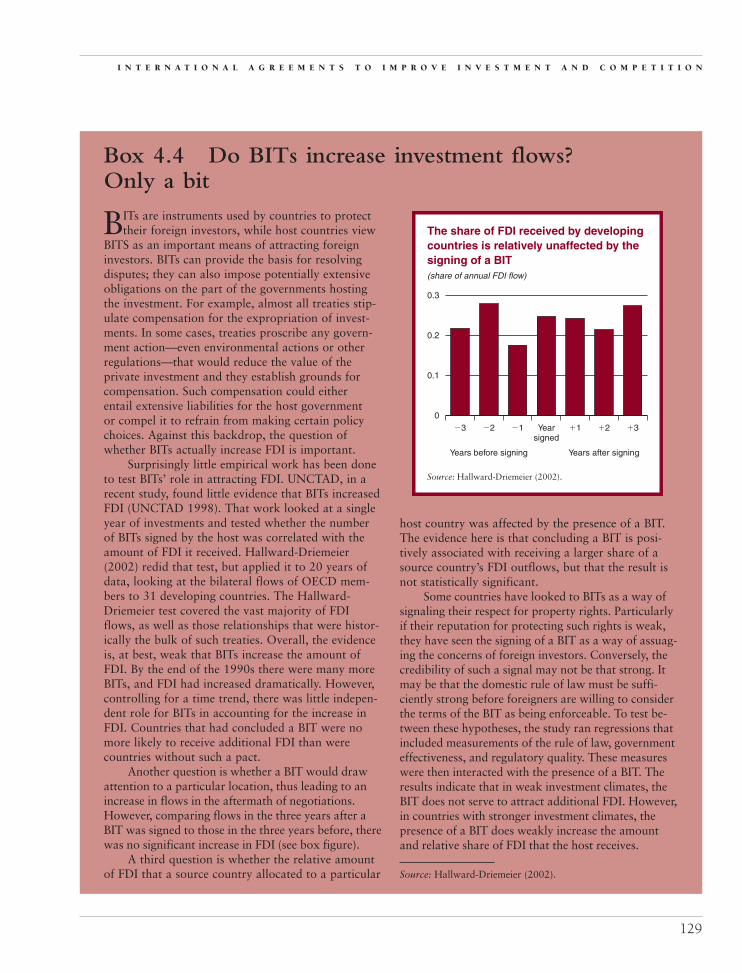
I N T E R N A T I O N A L A G R E E M E N T S T O I M P R O V E I N V E S T M E N T A N D C O M P E T I T I O N
129
BITs are instruments used by countries to protecttheir foreign investors, while host countries view
BITS as an important means of attracting foreigninvestors. BITs can provide the basis for resolvingdisputes; they can also impose potentially extensiveobligations on the part of the governments hostingthe investment. For example, almost all treaties stip-ulate compensation for the expropriation of invest-ments. In some cases, treaties proscribe any govern-ment action—even environmental actions or otherregulations—that would reduce the value of theprivate investment and they establish grounds forcompensation. Such compensation could eitherentail extensive liabilities for the host governmentor compel it to refrain from making certain policychoices. Against this backdrop, the question ofwhether BITs actually increase FDI is important.
Surprisingly little empirical work has been doneto test BITs’ role in attracting FDI. UNCTAD, in arecent study, found little evidence that BITs increasedFDI (UNCTAD 1998). That work looked at a singleyear of investments and tested whether the numberof BITs signed by the host was correlated with theamount of FDI it received. Hallward-Driemeier(2002) redid that test, but applied it to 20 years ofdata, looking at the bilateral flows of OECD mem-bers to 31 developing countries. The Hallward-Driemeier test covered the vast majority of FDIflows, as well as those relationships that were histor-ically the bulk of such treaties. Overall, the evidenceis, at best, weak that BITs increase the amount ofFDI. By the end of the 1990s there were many moreBITs, and FDI had increased dramatically. However,controlling for a time trend, there was little indepen-dent role for BITs in accounting for the increase inFDI. Countries that had concluded a BIT were nomore likely to receive additional FDI than werecountries without such a pact.
Another question is whether a BIT would drawattention to a particular location, thus leading to anincrease in flows in the aftermath of negotiations.However, comparing flows in the three years after aBIT was signed to those in the three years before, therewas no significant increase in FDI (see box figure).
A third question is whether the relative amountof FDI that a source country allocated to a particular
Box 4.4 Do BITs increase investment flows? Only a bit
0.3
0
0.1
Yearsigned
Years before signing Years after signing
�1�3 �2 �1 �2 �3
0.2
Source: Hallward-Driemeier (2002).
The share of FDI received by developingcountries is relatively unaffected by thesigning of a BIT(share of annual FDI flow)
host country was affected by the presence of a BIT.The evidence here is that concluding a BIT is posi-tively associated with receiving a larger share of asource country’s FDI outflows, but that the result isnot statistically significant.
Some countries have looked to BITs as a way ofsignaling their respect for property rights. Particularlyif their reputation for protecting such rights is weak,they have seen the signing of a BIT as a way of assuag-ing the concerns of foreign investors. Conversely, thecredibility of such a signal may not be that strong. Itmay be that the domestic rule of law must be suffi-ciently strong before foreigners are willing to considerthe terms of the BIT as being enforceable. To test be-tween these hypotheses, the study ran regressions thatincluded measurements of the rule of law, governmenteffectiveness, and regulatory quality. These measureswere then interacted with the presence of a BIT. Theresults indicate that in weak investment climates, theBIT does not serve to attract additional FDI. However,in countries with stronger investment climates, thepresence of a BIT does weakly increase the amountand relative share of FDI that the host receives.
Source: Hallward-Driemeier (2002).
gep_ch04.qxd 12/5/02 2:49 PM Page 129
and investment incentives—usually throughtax breaks or direct transfers from the state toattract FDI. Even when these policies benefitthe domestic economy, they both have the po-tential for adversely affecting trade and invest-ment flows with neighbors. Therefore, furtherinternational cooperation to curb their nega-tive effects can create positive benefits for all.
Unlike restrictions on entry that primarilyaffect services, performance requirements andinvestment incentives usually affect manufac-turing. In general, performance requirementshave been the instrument of choice for devel-oping countries that are seeking to ensure thatTNCs’ activities generate the greatest possiblespillovers for their economies. OECD coun-tries have been the predominant users of in-vestment incentives to attract investment,though in recent years numerous developingcountries have followed suit (see chapter 3,this volume; see also UNCTAD 2002).
The trade-distorting effects of performancerequirements—termed TRIMs—have forsome time been subject to negotiated disci-plines at both the regional and multilaterallevels. WTO disciplines on performance re-quirements were codified with the TRIMsAgreement in 1995. Among performance re-quirements, the most prevalent measuresrelate to local content, joint ventures (ordomestic equity participation), exports, tech-nology, and employment requirements. Theinitial rationale for export requirements wasin part to relieve the pressure on the trade bal-ance that inward investment—particularlyimport-substituting investment—was generat-ing. Local content requirements were designedto maximize vertical linkages and develop-ment of local skills.7 Current discussions ofchanges to the TRIMs Agreement are associ-ated with the review process that is mandatedunder Article 9 of that agreement.8 At present,these debates are not on the Doha Agenda.
In contrast with disciplines on performancerequirements, disciplines on investment incen-tives are—with the exception of the EuropeanUnion’s comprehensive set of disciplines onstate aids—more limited. The Uruguay
Round’s ASCM introduced limited disciplineson the granting of investment incentives.These disciplines are largely indirect becausethey apply solely to export subsidies and othergoods-related transactions—that is, a govern-ment may invoke the agreement’s provisionsonly when certain types of investment incen-tives used by certain types of members can beshown to distort trade in goods.9
Strengthening disciplines on investment-distorting incentives could benefit developingcountries because those disciplines would re-duce the scope for this zero-sum tax competi-tion. However, progress in crafting a set ofmultilateral disciplines on investment incen-tives has been negligible to date. One reasonfor this stalemate is that in large federal gov-ernments many investment incentive programsoriginate at the subnational level as instru-ments to promote regional development.Another reason is that many emerging devel-oping countries have themselves become heavyusers of incentives in recent years. Conse-quently, investment incentives have not figuredprominently among topics to be discussed ininternational forums such as the WTO. The ill-fated discussions in the MAI were also unsuc-cessful in broaching investment incentives.
Nonetheless, competition among govern-ments for FDI through incentives is becomingincreasingly common in many parts of theworld. Developing countries often find them-selves in competition with each other, but fewexamples can be found of developing coun-tries in direct competition with developedcountries. Also, competing developing coun-tries are often middle-income countries. Fourreasons seem to explain these patterns.
First, studies show that the bulk ofincentive-bidding activity among governmentstakes place within regions, rather than glob-ally (Oman 2000; Charlton 2002). Only ahandful of developing countries situated closeto developed nations experience direct compe-tition with the deep pockets of the treasuriesof rich countries. Mexico’s automotive indus-try under NAFTA is perhaps the most promi-nent example of this situation.10
G L O B A L E C O N O M I C P R O S P E C T S 2 0 0 3
130
gep_ch04.qxd 12/5/02 2:49 PM Page 130

Second, locational competition tends to bestrongest between close neighbors with similareconomic conditions, factor endowments, andpolicy regimes. Competition is also strongestin high-skill, technologically intensive indus-tries, particularly for firms producing goodsfor export. Automakers, silicon chip produc-ers, and pharmaceutical firms are among themost sought-after investments. Only a limitednumber of higher-income developing countriesare likely to qualify for such a category ofinvestment.
Third, competition is likely only when in-vestors are somewhat indifferent about whereto locate an investment among alternative lo-cations. This indifference implies that only themore relatively advanced economies (emerg-ing or transition economies) could have causeto bid against developed nations.11
Fourth, overt bidding wars between coun-tries are relatively rare—even though biddingmay be intense within particular countries—and are typically limited to a few sectors. Theygenerally occur when individual projects are ex-ceptionally large and when the sectors in ques-tion (for example, automobiles or electronics)are considered a high priority for national orregional economic strategies (Charlton 2002).
To be sure, striving for a ban on all incen-tives may be counterproductive because, insome cases, incentives can offset local disad-vantages or can be used to capture spilloversfrom inward FDI (see Hoekman and Saggi2000). In the case of Ireland and Portugal,for example, incentive programs have playeda significant role in attracting investment toless-developed regions. In the case of Brazil,some evidence shows that incentives competi-tion may have contributed to reducing re-gional disparities, because FDI in some sectors(particularly automobile manufacturing) is in-creasingly located outside the traditional in-dustrial heartland around São Paulo (Cano1998). While it is probable that, with re-spect to incentives, stories of failures andexcessive expenditures outnumber successes,agreements must contain some elements offlexibility. A first step is generating adequate
information that can be used to assess thetrade- and investment-distorting consequencesof incentives—and, more broadly, to evaluatetheir net development benefits.
Taken together, the existing multilateralagreements do provide limited discipline oncertain types of beggar-thy-neighbor policiesthat are currently in use around the world.With respect to curbing incentives, eventhough potential benefits for countries existfrom a multilateral accord, the absence ofevident momentum at the multilateral level—when combined with a regional pattern ofpossible tax competition and trade effects—suggests that regional arrangements may bemore promising for international collective ac-tions. However, data are lacking. Multilateralefforts to improve information on investmentincentives, perhaps through a WTO mecha-nism, would help remedy that lacuna andallow better analysis of the extent of invest-ment distortions.
Summary: Getting the biggestdevelopment benefit from internationalcollaboration on investmentDeveloping countries can benefit from inter-national collaboration to liberalize marketaccess for investment, to address investor pro-tections, and to minimize investment distor-tions. Five conclusions emerge.
First, in each of these areas the primarybenefits of attracting high-quality investmentfrom sound investment policies are likely toresult from unilateral enacting of domesticreforms. Long a truism for trade liberalizingreforms, this conclusion—given the apparentlack of investor responsiveness to interna-tional agreements—is increasingly germane toinvestment. Many of the remaining restric-tions are on services. As we have seen in chap-ter 3, progressive liberalization in services canproduce substantial economy-wide benefitsand should be a priority for consideration aspart of any development strategy. Bettertelecommunications, banking, auditing ser-vices, retail and wholesale trade, and the otherservice industries have multiple linkages to the
I N T E R N A T I O N A L A G R E E M E N T S T O I M P R O V E I N V E S T M E N T A N D C O M P E T I T I O N
131
gep_ch04.qxd 12/5/02 2:49 PM Page 131

rest of the economy, and can be sources ofproductivity growth for the whole economy.But the pace and form of investment liberal-ization necessarily must vary across sectorsand across countries, because they require reg-
ulations that are consistent with local capaci-ties and national objectives. The internationalcommunity can assist with these effortsthrough multilateral and bilateral develop-ment assistance, government-to-government
G L O B A L E C O N O M I C P R O S P E C T S 2 0 0 3
132
Currently, proposed investment rules in theWTO focus exclusively on disciplines for gov-
ernments, but they say little about responsibilitiesof corporations (see Moran 2002). Improper corpo-rate behavior—bribery or improper accounting—can corrode the social fabric of developing and de-veloped countries alike. In the wake of the Enron,Arthur Andersen, and WorldCom accounting scan-dals in the United States, efforts to improve corpo-rate transparency and good conduct assume a newimportance. Many such activities outside the WTOare under way.
To help combat bribery and corruption, theOECD has recently established the Convention onCombating Bribery of Foreign Public Officials inInternational Business Transactions. The convention,put into force in 1999, currently includes all 29OECD members and five nonmembers (Argentina,Brazil, Bulgaria, Chile, and the Slovak Republic) assignatories. The convention makes bribing a foreignpublic official a criminal offense. It also encompassesnoncriminal rules for prevention, overall trans-parency, and cooperation between countries, and itends the practice of allowing tax deductibility offoreign bribes. Many countries, however, have yet tomodify their national legislation to implement theconvention fully. Regional forums of cooperation canalso help. For example, the Inter-American Conven-tion against Corruption was established in 1996 inthe OAS; in April 2001, the Summit of the Americascreated an implementation mechanism for the Inter-American Convention. Experience shows that, foranticorruption initiatives to be effective, participa-tion by civil society, private agencies, and the generalpublic is critical. In this context, cooperative effortsby nongovernmental organizations (NGOs), such asTransparency International, the Global Coalition forAfrica, the Novartis Foundation, and the Public
Box 4.5 Disciplines on corporations can also improvethe investment climate
Affairs Center, and by international organizationsand banks, such as the World Bank, the InternationalMonetary Fund (IMF), the Asian Development Bank,the U.N. Development Programme, and the U.S.Agency for International Development, in developingapproaches to counter corruption are noteworthy.
Other programs have a more technical focus.The World Bank’s work on corporate governanceemphasizes disclosure, transparency, the rights andtreatment of shareholders and stakeholders, and theduties of board members. Using the OECD’s Princi-ples of Corporate Governance as a benchmark, theBank prepares corporate governance assessments forits client countries to assess their institutional frame-works for corporate governance. In addition, theWorld Bank and the IMF together initiated theFinancial Sector Assessment Program and theReports on the Observance of Standards and Codes.
More broadly, the U.N. adopted the GlobalCompact in July 2000 to allay concerns about thesocial effects of globalization on the developingworld. About 100 major multinationals and 1,000other companies across the world’s regions are cur-rently engaged in the Global Compact. Projectsrelate to making microcredit more accessible, reduc-ing carbon dioxide emissions, fighting against humanimmunodeficiency virus/acquired immune deficiencysyndrome (HIV/AIDS), and expanding of basic edu-cation in local communities. In a similar vein, theOECD significantly revamped its Guidelines onMultinational Enterprises in 2000 by addingrecommendations about eliminating child and forcedlabor, improving internal environmental manage-ment, addressing human rights, finding methods tocombat corruption, and improving disclosure andtransparency.
Source: World Bank staff.
gep_ch04.qxd 12/5/02 2:49 PM Page 132

information exchanges, and private efforts toinform and assist governments.
Second, international agreements thatfocus on liberalizing conditions of entry by re-moving barriers that discriminate against for-eign competition may help consolidate domes-tic reforms at the same time that they opennew avenues for reciprocity abroad. Becauseof the sensitivity of investment regimes, espe-cially in services, any agreement has to allowfor country diversity and must permit govern-ments the flexibility to design liberalization inways consistent with their development strate-gies. Because the GATS provides this flexibil-ity and addresses most of the remaining out-standing restrictions, multilateral efforts couldconcentrate on expanding the still-limited cov-erage of the GATS by increasing the numberand quality of commitments that allow com-mercial presence. Harnessing the full force ofreciprocity—both across modes (especially byputting on the table any temporary movementof workers) and across sectors—may helpmotivate this expanded coverage.
Third, an international agreement thatseeks to substantially increase investmentflows by increasing investor protections seemsdestined, on the basis of available evidence, tofall short of expectations. Some key issues arealready covered by relatively strong investorprotections in BITs. Moreover, it is not clearthat any investor protections emerging frommultilateral negotiations would add markedlyto existing protections found in bilateralagreements. Finally, merely creating new pro-tections does not seem to be strongly associ-ated with increased investment flows. Forthese reasons, the overall additional stimulusof multilateral rules that apply to new invest-ment over and above unilateral reforms wouldprobably be small—and virtually nonexistentfor low-income developing countries.
Fourth, international agreements can use-fully discipline two forms of beggar-thy-neighbor policy externalities that are particu-larly adverse to development. The first andmost important are investment-distortingtrade measures. Tariff escalation, tariff peaks,
quota arrangements, and other barriers—barriers that are common among developingcountries as well as between rich and poorcountries—stifle developing countries’ exportsand the investment needed to supply them.Reducing these trade barriers would precipi-tate new investment in exports as these activi-ties expand, and some portion of this newinvestment can be predicted to come fromabroad. The second set of externalities con-cerns disciplines for investment incentives thatdistort the allocation of investment. Coopera-tive measures at the multilateral level have theadvantage of being conceptually clean andbroad based. However, because investmentstend to affect countries in close regional prox-imity, countries may find it easier to work onrules that curb disadvantageous competitionon investment incentives through regionalarrangements. A prerequisite for collectiveaction is information on the extent of invest-ment incentives and their effects; thus, a mul-tilateral inventory of investment incentives isa high priority. One option is to set up an an-nual surveillance process, perhaps under theauspices of the WTO or as part of the IMF’sannual surveillance.
Finally, if new investment arrangementsleverage reciprocal commitments for reformsabroad on other issues on the trade agenda,particularly new market access, then agree-ments would certainly help developing coun-tries. These matters can be decided only in thecourse of negotiations.
International agreements topromote competition andcompetition policy
Promoting development requires not onlypolicies to encourage investment, but also
policies to ensure that investment is produc-tive; among these policies, competition is oneof the most powerful. Most policies to pro-mote competition are domestic, and an impor-tant conclusion of chapter 3, this volume, isthat the reduction of policy-related barriers tocompetition is essential to raising domestic
I N T E R N A T I O N A L A G R E E M E N T S T O I M P R O V E I N V E S T M E N T A N D C O M P E T I T I O N
133
gep_ch04.qxd 12/5/02 2:49 PM Page 133

productivity. Among the many domestic policybarriers to competition, the most prominentoften involve aspects of globalization, such astariffs, restrictions on FDI (especially in ser-vices), state monopolies, and competition-limiting regulations in postprivatized sectors.Competition policy that disciplines private re-straints in domestic markets is also important.However, competition laws have to be appro-priate to local circumstances because they relyheavily on the strength and independence ofthe judiciary, the enforcement capacity oflegal authorities, and probity in public admin-istration. A well-intentioned law in an inap-propriate institutional environment can be-come a source of bureaucratic harassment andcorruption.
Governments working together in a multi-lateral or regional framework may be able toenact policies that widen the scope of compe-tition and thereby confer benefits beyondthose obtained from unilateral reforms. Analy-sis has to begin with the restraints on compe-tition in the global marketplace that mostadversely affect developing countries and that,if removed, would provide the biggest stimu-lus to development.
Three categories of restraints on competi-tion in the global marketplace are particularlyadverse. First are those that involve policybarriers to trade that disadvantage exportersin developing countries by directly limitingtheir ability to compete in markets. The mostimportant barriers affect agriculture, textiles,and other labor-intensive manufactures andservices. Second are private restraints on inter-national competition that can raise prices toconsumers or to producers in developingcountries. These restraints include interna-tional cartels that are commonly illegal inOECD countries when they affect OECD mar-kets. Third are officially sanctioned restraintsthat may adversely affect developing coun-tries’ import or export prices. We discussbelow the effects of exemptions from antitrustlaws that governments grant to their firmsnational export cartels, and the price-raisingeffects of ocean transport and aviation
arrangements that systematically hurt devel-oping countries. Competition policies in de-veloping countries themselves can, in manycases, be improved through increased trans-parency, nondiscrimination, and proceduralfairness. All of these policies are subjects ofinternational negotiation, but they have quitedifferent potential effects on development.
The most important restraints oncompetition are policy barriers to tradeExporters from developing countries—particularly exporters of agricultural prod-ucts, textiles, and labor-intensive manufac-tures and services—confront significantrestraints on their ability to compete in globalmarkets. Developing countries generally facehigher barriers to exports than do industrialcountries (World Bank–IMF 2002). Japan andthe United States provide maximum protec-tion against imports from developing coun-tries, while European Union protection isskewed against imports from middle-incomecountries. Developing countries, with averagebarriers higher than those in rich countries,also raise barriers against competition fromother developing countries. Taken together,protectionist measures such as high tariffs,tariff peaks, restrictive tariff rate quotas onlow-tariff imports, and domestic and exportsubsidies are ubiquitous and raise barriers tocompetition from all developing countries. Be-cause the world’s poor people usually produceagricultural and labor-intensive products, theworld trading system is tilted against the poor.The average poor person selling into theglobal marketplace confronts tariffs that aretwice as high as those faced by people who arenot poor (World Bank 2002c; see also Oxfam2002).
Subsidies and trade barriers in agricultureare particularly pernicious. In developedcountries tariff rates in agriculture are twicethose of manufactures. Sheltering of agricul-ture by hefty subsidies aggravates the effectsof these tariffs (OECD 2001; WorldBank–IMF 2002). The costs of such price sup-ports are borne by low-income consumers in
G L O B A L E C O N O M I C P R O S P E C T S 2 0 0 3
134
gep_ch04.qxd 12/5/02 2:49 PM Page 134
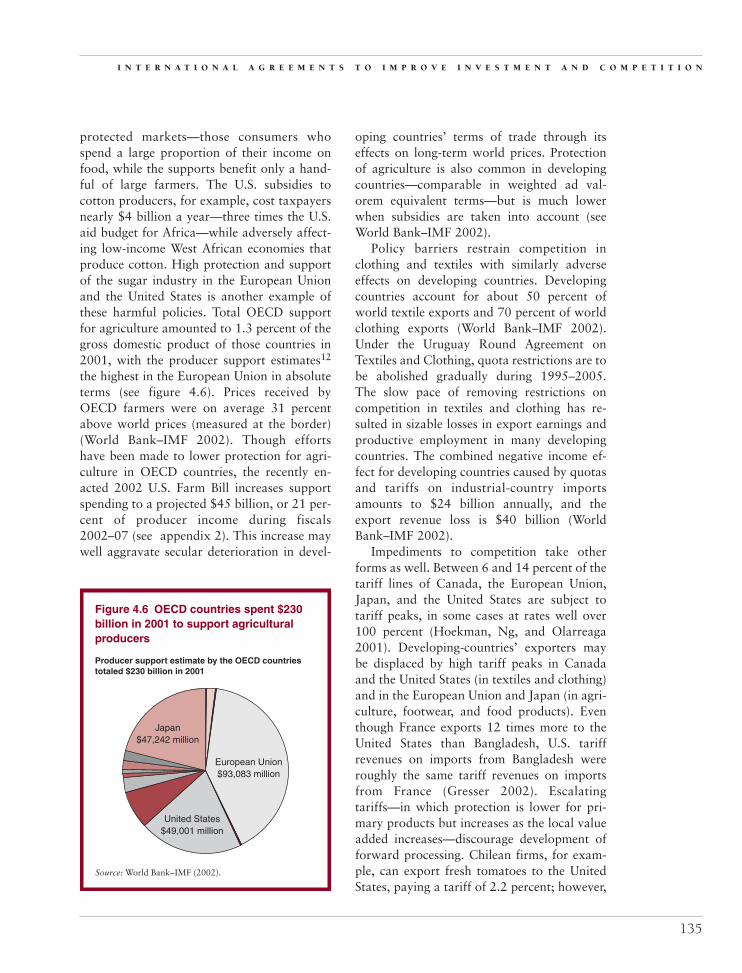
protected markets—those consumers whospend a large proportion of their income onfood, while the supports benefit only a hand-ful of large farmers. The U.S. subsidies tocotton producers, for example, cost taxpayersnearly $4 billion a year—three times the U.S.aid budget for Africa—while adversely affect-ing low-income West African economies thatproduce cotton. High protection and supportof the sugar industry in the European Unionand the United States is another example ofthese harmful policies. Total OECD supportfor agriculture amounted to 1.3 percent of thegross domestic product of those countries in2001, with the producer support estimates12
the highest in the European Union in absoluteterms (see figure 4.6). Prices received byOECD farmers were on average 31 percentabove world prices (measured at the border)(World Bank–IMF 2002). Though effortshave been made to lower protection for agri-culture in OECD countries, the recently en-acted 2002 U.S. Farm Bill increases supportspending to a projected $45 billion, or 21 per-cent of producer income during fiscals2002–07 (see appendix 2). This increase maywell aggravate secular deterioration in devel-
oping countries’ terms of trade through itseffects on long-term world prices. Protectionof agriculture is also common in developingcountries—comparable in weighted ad val-orem equivalent terms—but is much lowerwhen subsidies are taken into account (seeWorld Bank–IMF 2002).
Policy barriers restrain competition inclothing and textiles with similarly adverseeffects on developing countries. Developingcountries account for about 50 percent ofworld textile exports and 70 percent of worldclothing exports (World Bank–IMF 2002).Under the Uruguay Round Agreement onTextiles and Clothing, quota restrictions are tobe abolished gradually during 1995–2005.The slow pace of removing restrictions oncompetition in textiles and clothing has re-sulted in sizable losses in export earnings andproductive employment in many developingcountries. The combined negative income ef-fect for developing countries caused by quotasand tariffs on industrial-country importsamounts to $24 billion annually, and theexport revenue loss is $40 billion (WorldBank–IMF 2002).
Impediments to competition take otherforms as well. Between 6 and 14 percent of thetariff lines of Canada, the European Union,Japan, and the United States are subject totariff peaks, in some cases at rates well over100 percent (Hoekman, Ng, and Olarreaga2001). Developing-countries’ exporters maybe displaced by high tariff peaks in Canadaand the United States (in textiles and clothing)and in the European Union and Japan (in agri-culture, footwear, and food products). Eventhough France exports 12 times more to theUnited States than Bangladesh, U.S. tariffrevenues on imports from Bangladesh wereroughly the same tariff revenues on importsfrom France (Gresser 2002). Escalatingtariffs—in which protection is lower for pri-mary products but increases as the local valueadded increases—discourage development offorward processing. Chilean firms, for exam-ple, can export fresh tomatoes to the UnitedStates, paying a tariff of 2.2 percent; however,
I N T E R N A T I O N A L A G R E E M E N T S T O I M P R O V E I N V E S T M E N T A N D C O M P E T I T I O N
135
Source: World Bank–IMF (2002).
Figure 4.6 OECD countries spent $230billion in 2001 to support agriculturalproducers
Producer support estimate by the OECD countriestotaled $230 billion in 2001
European Union$93,083 million
United States$49,001 million
Japan$47,242 million
gep_ch04.qxd 12/5/02 2:49 PM Page 135

if they dry and package the tomatoes, the U.S.tariff is 8.7 percent; and if they make salsaout of the tomatoes for export, the duty is11.6 percent (Schiff 2001). By reducing thedemand for higher-processed imports from de-veloping countries, tariff escalation preventsdeveloping countries from diversifying exportsinto areas of their competitive advantage.These tariff structures are common in poor aswell as in rich countries (see World Bank2002c: 45).
Another restraint on competition is fre-quent recourse to antidumping and othertypes of contingent protection. Antidumpinglaws were originally created to counteractpredatory practices of foreign sellers into ahome market. This was the original rationalefor U.S. antidumping legislation of 1916. Thefear was that a foreign firm (or cartel) coulddeliberately price products low enough todrive existing domestic firms out of businessand to establish a monopoly. Once estab-lished, the monopolist could more than re-coup its losses by exploiting its market power.For predation to work, the monopolist or car-tel would not only have to eliminate domesticcompetition, but would also have to be able toblock entry by new competitors. It would,therefore, need to have a global monopoly,
need to convince the importing government toimpose or tolerate entry restrictions, or needto be able to raise private entry barriers(Hoekman and Kostecki 2001).
In practice, post–World War II cases of suc-cessful predatory dumping are the exception,not the rule. More than 90 percent of all an-tidumping investigations would never havebeen launched if a competition standard—potential threat of injury to competition—hadbeen used as a criterion (Messerlin 2000).13 Asit has evolved, antidumping has become a fa-vored vehicle for restricting competition fromimports, and it is applied with increasing fre-quency by developing countries against eachother. Since 1995, countries have initiatedmore than 1,800 antidumping investigations(table 4.1). Although industrial countries havetraditionally been the main users of such mea-sures, developing countries have been moreactive in recent years, led by India, Argentina,Brazil, and South Africa. In the seven years to2001, developing countries initiated almosttwo-thirds of all investigations, well in excessof their share in world trade. However, devel-oping countries have also been the target ofnearly 60 percent of investigations, mostly ini-tiated by other developing countries. The re-cent steep rise in antidumping investigations
G L O B A L E C O N O M I C P R O S P E C T S 2 0 0 3
136
Table 4.1 Many antidumping investigations were initiated during the 1995–2001 period
Affected countries
Industrial United European Developing TransitionInitiating country countries States Union countries countries Total
Number of investigations 511 102 313 1,086 248 1,845Industrial countries 128 17 67 363 114 605
Of whichUnited States 79 0 46 146 30 255European Union 15 6 0 165 66 246
Developing countries 379 85 242 718 131 1,228Transition countries 4 0 4 5 3 12
Percentage of investigations 28 6 17 59 13 100Industrial countries 21 3 11 60 19 100
Of whichUnited States 31 0 18 57 12 100European Union 6 2 0 67 27 100
Developing countries 31 7 20 58 11 100Transition countries 33 0 33 42 25 100
Source: WTO Secretariat, as reported in World Bank–IMF 2002.
gep_ch04.qxd 12/5/02 2:49 PM Page 136

puts the predictability and nondiscriminatoryapplication of trade policies at risk.
Removing these restraints on competitionfrom developing countries would have a bigdevelopment payoff. These issues and detailedpolicy recommendations have been well ana-lyzed elsewhere (see, for example, World Bank2002c). Suffice it to say that dismantling bothworldwide trade barriers and agricultural sub-sidies could increase long-term growth in de-veloping countries by as much as 0.5 percentannually, which, when taken together withterms-of-trade improvements, could reducethe number of people living in poverty by asmuch as 13 percent by 2015. One-third toone-half of the welfare gains would accrue tothe developing world (World Bank 2002c).Because of the growing importance of South-South trade and the remaining high barriersamong developing countries, removing thebarriers to competition among themselveswould produce substantial gains (see WorldBank 2002a; and World Bank–IMF 2002).These facts underscore the importance of theDoha Development Agenda of the WTO andthe various regional efforts around the worldthat could lower trade barriers to developingcountries’ exports. Because not all countrieswill benefit from some reforms (such as re-moving the textile quotas), a broader reformthat covers all trade issues and is linked todevelopment assistance is vital.
Private restraints on internationalcompetition can raise pricesto developing countriesBesides policy barriers to competition, largeinternational companies with market powercan form cartels that fix prices, allocate mar-kets, and restrain competition. Although tradereform and the expansion of potential com-petitors in markets around the world haveundoubtedly reduced the scope for privatecartels, the numerous international cartels un-covered in the 1990s suggest that marketforces alone do not offer complete protectionagainst price-fixing and market-allocationarrangements that raise prices to developing
countries. These cartels are typically illegalwhen they adversely affect a country’s owncommerce. However, OECD governmentshave no authority to prosecute cases whencartel activities function outside their nationaljurisdictions and cannot be shown to affectprices of imports or domestic goods.
The 1990s saw the uncovering of severalinternational cartels. Prosecutions of interna-tional cartels picked up after 1993 when theUnited States revised its anticartel enforce-ment practices to grant amnesty to the firstcartel member that cooperated with authori-ties. Before 1993, approximately one firm ayear applied for leniency under anticartellaws, and big cases were rare; now, one firm amonth applies for leniency. U.S. fines againstdomestic and international cartels during the1990s totaled $1.7 billion. The publicity asso-ciated with these prosecutions (many of whichaffected international markets as well as theUnited States) encouraged prosecutions byother enforcement agencies, including those inseveral middle-income countries (for example,Brazil and Korea). Antitrust authorities in theUnited States and European Union aloneprosecuted 40 international cartels during the1990s.
Cartels that have been uncovered throughlaw enforcement have had a substantial role inincreasing the prices to developing countries.Although estimates vary, the average interna-tional price increases caused by internationalcartels have been estimated to be on the orderof 20–40 percent. The estimated price in-creases resulting from cartels, as shown in sixhigh-profile international cartel prosecutions(table 4.2), vary widely—from 10 percent forstainless steel tubes to 45 percent for graphiteelectrodes. Cumulative overcharges to devel-oping countries over the life of the cartels inthe six cases ranged from $3 billion to $7 bil-lion, depending on whether SITC or HS codesare used. Developing countries imported 12products that had a value of sales of $11 bil-lion in 2000 and that were sold by interna-tional cartels prosecuted during the 1990s(figure 4.7); if price collusion were to raise
I N T E R N A T I O N A L A G R E E M E N T S T O I M P R O V E I N V E S T M E N T A N D C O M P E T I T I O N
137
gep_ch04.qxd 12/5/02 2:49 PM Page 137

prices by an average 20 percent, the total over-charges would have reached almost $2 billionin 2000.
Despite the rise in prosecutions, reiningin international cartels remains difficult. Thefines imposed by authorities often fall wellshort of the estimated overcharges, raising
questions about the effectiveness of prosecu-tion as a deterrent for cartel behavior. More-over, 24 of the 40 cartels prosecuted by theUnited States and the European Union lastedfor at least four years, indicating that marketforces are not always adequate to rapidlyeliminate cartels. The history of cartels
G L O B A L E C O N O M I C P R O S P E C T S 2 0 0 3
138
Table 4.2 International cartels can be expensive: estimates of sales and overcharge
Possible overcharge toCartel sales developing countries
Years of Number PriceProduct cartel of firms SITC HS increase SITC HS Fines
Vitamins 1990–99a $26.4 billion $10.8 billion 35% $3.05 billion $1.71 billion Almost $2 billionCitric acid 1991–95 111 $9.9 billion $447 million 20% $402 million $67 million Over $250 millionBromine 1995–98 2 $598 million $409 million 15% $46 million $8 million $7 millionSeamless steel tubes 1990–95 8 $26.6 billion $21.7 billion 10% $1.63 billion $1.19 billion 99 million eurosGraphite electrodes 1992–97 23 $9 billion $7 billion 45% $1.35 billion $975 million Over $560 millionLysine 1992–95 5 $4.8 billion $913 million 10% $294 million $43 million About $200 million
SITC � Standard International Trade Code; HS � Harmonized System Classification.Notes: Figures for each cartel span the entire period of the conspiracy. Sales are approximated using export statistics from countries of origin of indictedfirms and thus exclude domestic sales. If participating firms are multinationals and the locations of their subsidiaries are known, sales are calculated bytaking into account the exports of countries of subsidiaries. When that information is unavailable and production is understood to be global, sales arecalculated by using exports of all countries producing the cartel product. Overcharge refers to imports to developing countries / (1 � price increase) �price increase. Sales calculations provided are based on the SITC Revision II and the HS 1988.a. Because the cartel ended in February 1999, sales and overcharge estimates are aggregated from 1990 to 1998.Source: Connor (2001), Levenstein and Suslow (2001), OECD (2000), and World Integrated Trade Solution database.
30
35
25
20
15
10
5
01981 1982 1983 1984 1985 1986 1987 1988 1989 1990 1991
Year
1992 1993 1994 1995 1996 1997 1998 1999 2000
Source: World Bank staff.
Imports to industrial countries
Imports to developing countries
Figure 4.7 Imports affected by cartels rose from 1981 to 2000 for both richand poor countries
Total imports of twelve products where proven cartels existed
(in billions of dollars)
gep_ch04.qxd 12/5/02 2:49 PM Page 138

indicates that some operate intermittently overdecades.14
New initiatives to discipline illegalinternational cartelsFirms will be deterred from price fixing andforming cartels if the fines for doing so, multi-plied by the probability of being caught (thatis, the expected value of the cost), exceed theextra profits that result from this anticompet-itive behavior (that is, if the potential punish-ments for creating cartels exceed the benefits).Reforms that raise the sanctions on cartels andthat increase the probability of successfullyprosecuting cartels will tend to dissuade morefirms from forming cartels, whether domesticor international. The secret nature of mostcartel agreements poses a special problembecause it implies that governments must ac-tively search for evidence or must encouragecartel members to come forward with evi-dence; otherwise, firms will perceive the prob-
ability of prosecution to be very low (Evenett,Lehmann, and Steil 2000).
One option for curbing illegal internationalcartels is to extend further the extraterritorialreach of industrial nations’ anticartel laws(Hoekman and Mavroidis 2002). When acompetition authority in an industrial econ-omy uncovers a cartel that affects marketsboth inside its own borders and in other coun-tries, then that authority could take enforce-ment action on behalf of all affected nations.A stronger version would have the competi-tion authority take action even if the cartelaffected a foreign market without affecting thehome market. In both cases, the authoritycould request help in collecting evidence fromenforcement bodies in other nations. Finesand sanctions against the cartel would be de-termined on the basis of its detrimental effectson all affected economies.
Yet another option is to grant governmentsof developing countries—or their citizens—
I N T E R N A T I O N A L A G R E E M E N T S T O I M P R O V E I N V E S T M E N T A N D C O M P E T I T I O N
139
Lysine is a food additive used in hog and poultryfeeds. The global lysine cartel lasted from 1992
to 1995. During that period the five participantscontrolled more than 97 percent of global capacity.Cartel members engaged in price-fixing, allocatingsales quotas, and monitoring volume agreements. In1994, at the peak of the cartel’s effectiveness, theprice of lysine reached about $1.20 per pound, ap-proximately $0.50 above the competitive price level.
Estimates of the overcharges to U.S. customersduring this period vary and are as high as $141 mil-lion. Although no formal analysis of non-U.S. over-charges is available, the observed lower prices inAsia suggest overcharges in the rest of the worldwere lower than those in the United States. Accord-ing to Connor (2001) a reasonable projection of theglobal overcharge by the lysine cartel would be inthe $200 million to $250 million range. A more con-servative estimate assumes a 10 percent overchargeon $1.4 billion in global sales during the life of thecartel, for a total of $140 million (OECD 2000: 16).
Box 4.6 The lysine cartel, 1995–2001The cartel had a significant effect on both po-
tential producers and users of lysine. Lysine produc-tion in 1994 was at least 20 percent less than undercompetitive conditions, resulting in lower productionamong the feed and meat industries that dependon lysine. Moreover, the cartel limited potentialdeveloping-country competitors by using price dis-crimination across regions, and it froze the relativepositions of the leading firms in the market, whencompared with the very fluid situation before theconspiracy. Although a few relatively small produc-ers entered the market during the 1990s (mainly inHungary, the Slovak Republic, and South Africa),most new entrants began production only after thelysine cartel had been broken up in 1995. China, inparticular, has been a source of increasing lysine pro-duction. Nevertheless, the five original participantsin the cartel continued to control 95 percent ofglobal capacity at the end of the decade.
Source: Connor (2001).
gep_ch04.qxd 12/5/02 2:50 PM Page 139

standing in the major OECD countries sothose affected could initiate private injurysuits against companies headquartered underthe jurisdiction of a particular antitrust au-thority. Because most antitrust actions are dri-ven by private complaints and through privatesuits, such legal changes would markedlystrengthen the hand of consumers and busi-nesses in developing countries to curb privaterestraint practices. The principal attraction ofsuch a proposal is that it would allow devel-oping countries to benefit from the sophisti-cated investigative powers and regulatoryexpertise in the OECD competition authori-ties. The enforcement record in the 1990s sug-gests that the overwhelming majority of cartelmembers have their headquarters in industrialeconomies. A drawback to the proposal is thatextraterritorial application is a perennialsource of tensions among countries, and theincentives are low for OECD governments totake actions against their own firms for effectsin foreign markets.
A more modest option for reform couldfocus on notification and information ex-changes by national enforcement authorities.This exchange would build on the growingnumber of bilateral cooperation agreementson competition matters, thus expanding theirscope to include many more economies. Theobjective here is to raise the probability of suc-cessfully prosecuting cartels by encouragingthe sharing of conspiracy-related informationbetween enforcement authorities. The modali-ties for this type of international cooperationhave received considerable attention in recentyears, not the least of which is the OECD’snonbinding Recommendation on Hard CoreCartels. However, this approach essentially of-fers gains only to those economies that haveeffective competition laws, and many devel-oping economies do not. Furthermore, theamount of information that can be exchangedon cartel cases today is highly constrainedbecause most countries have laws againstsharing confidential information. The originalintent of those laws was to protect legal busi-ness secrets and plans, and the confidentiality
provisions have, unfortunately, been appliedto illegal conduct uncovered during cartel in-vestigations. These restrictions on informationexchange are especially worrisome at a timewhen so much evidence about internationalcartels is being collected through nationalleniency programs, thereby suggesting that thepotential for information exchange could beconsiderable.
Another approach is a multilateral agree-ment. Proponents of including competition onthe multilateral agenda have gravitated to-ward a relatively narrow focus. They are seek-ing disciplines on (a) the so-called core issuesof nondiscrimination, national treatment, andtransparency; and (b) private “hard core” in-ternational cartels. These disciplines wouldapply to all WTO members, both industrialand developing, with technical assistance andcapacity building envisaged. Most recent dis-cussions have emphasized the need for volun-tary international cooperation (Anderson andJenny 2001).15
In summary, policies that help developingcountries discipline international cartels moreeffectively would have a potentially large ben-efit, for consumers in rich and poor countriesalike.
Officially sanctioned private restraints canhurt trade to developing countries . . .Officially sanctioned restraints on trade makeup the third major category of competitionrestrictions that adversely affect developingcountries. These restraints take the form ofexemptions from domestic antitrust laws andpertain to certain types of international activ-ity. Many governments legally permit theirown private firms to cartelize export mar-kets—as long as markets affected are outsidethe country, and export cartels do not providean opportunity for producers to fix pricesat home. Indeed, numerous economies haveexplicitly exempted export cartels fromtheir domestic competition laws—essentiallyproviding some legal cartel privileges fortheir national firms, but not foreign firms(table 4.3). U.S. soda ash producers have
G L O B A L E C O N O M I C P R O S P E C T S 2 0 0 3
140
gep_ch04.qxd 12/5/02 2:50 PM Page 140

taken advantage of these provisions in U.S.law to form an export cartel, which hassubsequently been the target of Europeanand Indian enforcement actions. Generally,these cartels may attempt to raise prices intheir export markets to the detriment ofoverseas consumers. Their success depends onthe number of other foreign competitors inthese markets. Because competition is morelikely to be limited in the smaller marketsof developing countries, it is probable that de-veloping countries are adversely affecteddisproportionately.
Because cartel registers are secret in Europeand Japan, and virtually secret in the UnitedStates, information on their extent, products,and geographic coverage is nil. The legal ex-emptions are known, and the latest availableinformation—from the OECD in 1974—hasindicated a broad proliferation. The initialrationale for export cartel exemptions was thatsmall exporters could join to share theallegedly substantial costs of marketing theirproducts abroad. Even if such arguments were
legitimate in the past, most small- and medium-sized enterprises in industrial economies todayexport without a need for cartels, so the ratio-nale is moot.
Another exemption from OECD antitrustlaws is maritime transport, which inadver-tently put developing countries at the mercyof price fixing. The exemption in U.S. lawextended to maritime transport has facili-tated, through shipping conferences, collusivearrangements in ocean-liner shipping. Agree-ments among private shipping companieshave a long history, beginning with trade be-tween the United Kingdom and India in the1870s. Such arrangements have taken differ-ent forms, including the conclusion of agree-ments on uniform freight tariff rates andconditions of service, the establishment of ex-clusive or preferential working relationshipsbetween shipping lines, or the integration ofshipping networks through strategic alliances.
The power of such arrangements haseroded in recent years because outside ship-ping lines have gained a significant share of
I N T E R N A T I O N A L A G R E E M E N T S T O I M P R O V E I N V E S T M E N T A N D C O M P E T I T I O N
141
Table 4.3 National exemptions to competition law for exporters
Country Type of exemption Reporting requirement
Australia Contracts for the export of goods or Submission of full particulars to the national supply of services outside Australia authority within 14 days
Brazil Joint ventures for exports, as long as there Approval by the national authorityare no effects on the Brazilian market
Canada Export activities that do not affect domestic Nonecompetition
Croatia Agreements that contain restrictions that aim Notification of the agreement to national authorityto improve the competitive power of within 30 days after conclusion of the agreementundertakings on the international market
Estonia Activities that do not affect the domestic market NoneHungary Activities that do not affect the domestic market NoneJapan Agreements regarding exports or among Notification of and approval by the industry
domestic exporters administrator Latvia Activities that do not affect the domestic market NoneLithuania Activities that do not affect the domestic market NoneMexico Associations and cooperatives that export NoneNew Zealand Arrangements that relate exclusively to exports Authorization of the national authority
and that do not affect the domestic marketPortugal Activities that do not affect the domestic market NoneSweden Activities that do not affect the domestic market NoneUnited States Webb-Pomerene Act: activities that do not Webb-Pomerene Act: filing of agreements with the
affect domestic competition U.S. Federal Trade CommissionExport Trading Companies Act: strengthened Export Trading Companies Act: Certificates ofimmunities granted by Webb-Pomerene Act Review provided by U.S. Department of Commerce
Source: Evenett and Ferrarini (2002); drawn from OECD (1996), OECD (2000), and <http://www.gettingthedealthrough.com>(accessed May 2002).
gep_ch04.qxd 12/5/02 2:50 PM Page 141

the market and regulators have moved to en-courage greater price competition. Nonethe-less, Fink, Mattoo, and Neagu (2001) con-clude that a breakup of cooperative workingagreements and price-fixing arrangementsamong the major private carriers could reducetransport prices by 20 percent on U.S. routes,for a savings of $2 billion or more (seetable 4.4; see also Francois and Wooton 2001).
If developing countries could save the samepercentage of their import costs, then theirtotal import bill would fall by $2.3 billion.This figure is probably an underestimate ofthe effect of breaking up private constraintson ocean trade services for developing coun-tries. Their freight charges are more likely tobe subject to price-fixing than are freightcharges on industrial-country routes becauselow traffic volumes limit the number of com-mercially viable competitors. For example, theEuropean Commission found that the Associ-ated Central West African Lines abused itsdominant position by providing rebates toshippers that complied with its policies, aswell as carrying out other anticompetitivepractices.16
. . . and international agreement couldrein in their adverse effectsMultilateral efforts to curb national exportcartels, as well as to rein in private restraintsin regulated industries that have been rootedin exemption from antitrust laws, are particu-larly well suited to the WTO. Most govern-ments today either encourage or acquiesce tonational cartels that adversely affect markets
beyond their borders. Government supportfor beggar-thy-neighbor export cartels isanachronistic in an era of global trade rules.Reciprocal international agreements offer thepromise of reducing foreign distortions todomestic markets in return for commitmentsto desist from such practices. Agreements oninternational cartels involve giving up somerents from exporting in return for the benefitsof more competitive markets at home.
A multilateral accord to curb export cartelswould probably benefit developing countries.An alternative and less-ambitious approach isto narrow the coverage to sectors in which itcan be demonstrated that small- and medium-sized enterprises cannot compete internation-ally without a mechanism to share burdenssuch as marketing costs, and so on. Becausethe extent of injury to foreign consumers isnot known, a minimalist policy toward exportcartels involves disclosure. If export cartels areallowed to retain their legality, governmentsshould agree to require that firms seeking toestablish an export cartel publicly register assuch—and that those registries be updated an-nually and made accessible to the public overthe Internet. Furthermore, if these cartel ex-emptions were specifically to aid small firms,then there is no argument for permitting largefirms to participate.
Similarly, countries could agree to end anti-trust exemptions for maritime transport and,at the same time, give standing so exportersin developing countries that are harmed bysubsequent cartel activities can sue under an-titrust statutes. This change would have sig-nificant effects by unleashing competition inthis sector and by altering an arrangementthat today drives up the cost of exportingfrom many developing countries.
International collaboration can strengthendomestic competition policiesDomestic policies in developing countrieshave a significant effect on competitive con-ditions. Chapter 3 underscored the particu-lar importance of policy barriers to competi-tion, particularly in trade, in restrictions on
G L O B A L E C O N O M I C P R O S P E C T S 2 0 0 3
142
Table 4.4 Breaking up floating cartelscould help developing countries(Economic effects of ending private restrictions on ocean-liner competition)
Effect Amount
Reduction in price of ocean transport 20%Projected total savings for U.S. imports $2.1 billionProjected savings for developing-country
imports $2.3 billion
Source: Fink, Mattoo, and Neagu (2001); World Bank(2002c).
gep_ch04.qxd 12/5/02 2:50 PM Page 142

incoming FDI, and in restrictions on newentry (foreign or domestic) in regulated indus-tries. Chapter 3 also concluded that the po-tential role of a domestic competition agencywas shaped largely by the domestic institu-tional environment. In some countries withstrong legal and judicial systems, a competi-tion agency could help augment competition;in other countries with weak legal and judicialsystems, establishing a competition agencycould be counterproductive if they become asource of rent-seeking and corruption.
International discussions on trade policyhave, since their inception, seen domesticcompetition policy as an issue associated withmarket access. Competition policy is intrinsi-cally related to the principles of national treat-ment and MFN treatment insofar as competi-tion law allows recourse to address certainkinds of discriminatory policies and arrange-ments that deny foreigners access to markets.17
The launching in 1997 of the WTO Work-ing Group on Trade and Competition Policysignaled the beginning of the most recent in-ternational discussions about the interfacebetween trade and competition, as well as thepossibility of multilateral cooperation oncompetition law. Not all domestic competitionmatters give rise to international trade prob-lems, and vice versa. There are situationswhen the lack of, or inappropriate applicationof, competition law can impede trade andmarket access, however. After five years ofdiscussions, governments have progressivelyretreated from ambitious applications (such asharmonization) to proposals that focus oncore principles, transparency, nondiscrimina-tion, and procedural fairness. Governmentsmay perhaps also focus on provisions address-ing illegal international cartels (see discussionabove). Aside from these general principles,the exact content of national competitionlaws could vary considerably in the range ofconduct and structural disciplines that theyinclude.
From a national point of view, for compe-tition law to be a priority it must yield ahigher payoff than other choices. Competi-
tion law is technical and requires the use ofskills that are in short supply in many devel-oping countries. Building capacity to applycompetition legislation effectively will taketime. Given that competition law is appliedon a case-by-case basis, dealing with systemictrade and investment barriers and with gov-ernment regulations that restrict competitionmay generate a higher rate of return (seechapter 3). Kee and Hoekman (2002) haveinvestigated the effect of the existence of acompetition law on estimated industrymarkups over cost. They used cross-country,cross-industry time series panel regressionsthat include data on the number of firms byindustry (turnover), sales (market size), andimport competition. They concluded thatantitrust legislation on its own has no effecton markups, but that imports and entry havea major and statistically significant effect inreducing markups (see chapter 3). Competi-tion law is found to have an indirect effect,however, by reducing the first order marginaleffect of imports and by reinforcing the mar-ginal effect of domestic competition. Thateffect is stronger in the more-developed andlarger economies.
The effect of government policies that re-strict competition for nontradables may bemore important from a development perspec-tive than is antitrust enforcement, becausethose policies affect the price and quality ofkey intermediate inputs that determine thecompetitiveness of industries on world mar-kets (for example, Fink, Mattoo, and Neagu2002; Francois and Wooton 2001). Depend-ing on the capacity of government, a role mayexist for a competition agency that reviewsnew policy and regulatory barriers to compe-tition (see chapter 3, this volume, as well asAnderson and Holmes 2002).
As Winters (2002) notes, administration ofcompetition law is complex, and its misappli-cation can have a costly and chilling effect oninvestment. Issues relating to the institutionaldesign, the independence of investigating au-thorities, the effective judicial review andappeal mechanisms, and the availability of
I N T E R N A T I O N A L A G R E E M E N T S T O I M P R O V E I N V E S T M E N T A N D C O M P E T I T I O N
143
gep_ch04.qxd 12/5/02 2:50 PM Page 143

expertise—both legal and analytical—are allcritical issues for the effective application ofantitrust law. Therefore, the development ofcompetition law in many countries has oc-curred gradually over a long period, and con-tinues to evolve. The necessary administrativeapparatus cannot be put into place within ashort time frame. The institutional guaranteesnecessary for a competition authority to beindependent from eventual political influence(so that it can concentrate on its mandate) re-quire government acceptance that branches of
the national administration will operate out-side its direct control. Until a few decades agomost European Union member states had noexperience in the field of antitrust. Before agovernment determines national priorities,both the costs and benefits of competition en-forcement ought to be considered, includingthe possibility of perverse outcomes throughcapture or corruption.
This discussion suggests that the reciprocalbargaining and enforcement framework ofthe WTO is less well suited to collective action
G L O B A L E C O N O M I C P R O S P E C T S 2 0 0 3
144
Several entities outside the WTO have activities thatare germane to competition policy. For example,
the OECD launched a Global Forum on Competitionin October 2001 to stimulate a comprehensive policydialogue about competition, and that goes beyond itsprevious activity of providing technical assistance.The Forum, backed by the OECD’s Committee onCompetition Law and Policy, engages in high-leveldiscussions with key officials from member and non-member countries, including countries that do nothave well-developed competition enforcement author-ities. The objective of the Forum is, first, to encouragecommon understanding and sharing of experiencesamong a larger number of competition officials and,second, to generate benefits through cooperation,conflict prevention, and voluntary convergence. Itsfirst meeting successfully highlighted the role ofcompetition policy and of its authorities in economicreform; it also fomented greater international cooper-ation on such matters. The latest semiannual meetingin February 2002 discussed the merits of competitionpolicy for developing economies, international coop-eration in merger and cartel cases, capacity building,and technical assistance. In addition, the forum bene-fits from contributions of regional organizations suchas the Common Market for Eastern and SouthernAfrica and international organizations such as theWorld Bank, UNCTAD, and the WTO.
Another example of an entity outside the WTOwith activities germane to competition policy is the
Box 4.7 International cooperation aids competition policy
ICN, created on October 25, 2001, to deal with in-ternational antitrust enforcement through regularconsultations between government officials, privatefirms, and NGOs from around the world. Accordingto its mandate, the ICN will “formulate proposalsfor procedural and substantive convergence througha results-oriented agenda and structure.” Its specialstatus stems from the fact that it is maintained by theenforcement authorities themselves, has voluntarymembership, and is not bound by rules, but ratherby a community of interests. The first annual confer-ence was held in Italy during 2002 and sparked dis-cussions on reforms to the merger review process;the advocacy role and activities of competition agen-cies (especially in developing and emergingeconomies); and recommendations on best practices.Individual enforcement authorities will have the flex-ibility to make decisions on the most suitable meansof implementing the recommendations. The ICN willaddress complex issues, and newly established com-petition authorities will no doubt benefit from thecollective experience of other member agencies.
Though it is too early to gauge the success ofthe Global Forum on Competition and the ICN interms of fostering global cooperation, they play auseful role in disseminating information on bestpractices for implementing a competition law policy.
Source: World Bank staff.
gep_ch04.qxd 12/5/02 2:50 PM Page 144

on competition law than international col-laboration through development assistanceand other venues. To be sure, internationalnegotiations can help reinforce progressivedomestic reforms in competition law (seeBirdsall and Lawrence 1999).18 However, inthis complex area of domestic regulation, onesize does not fit all, and, as many WTO mem-bers have noted, cooperation on competition-law policy requires establishing a domesticenforcement capacity that at present is beyondthe reach of many developing countries. Otherchannels can help disseminate best practices tocountries wishing to strengthen their competi-tive conditions. Several agencies and forumshave work programs on international compe-tition policy. These agencies include theOECD, UNCTAD, and the InternationalCompetition Network (ICN) (see box 4.7).The OECD and UNCTAD have developedtheir own guidelines or recommendations fortackling international cartels, but they have nopowers of enforcement or investigation. Thenascent ICN has focused more on interna-tional mergers and acquisitions, and it is in-tended to facilitate information exchange anddissemination of best practices.
Conclusions
For both investment and competition policy,domestic reforms that are implemented
unilaterally in the national interest of promot-ing a sound investment climate and a morecompetitive economy are likely to yield themost direct and positive effect on growth andpoverty reduction. The international commu-nity can assist the reform process throughmultilateral and bilateral development assis-tance, government-to-government informa-tion exchanges, and private efforts to informand assist reform-minded governments. Coun-tries may be able to use regional and multi-lateral agreements to motivate progressive re-forms at home at the same time that they usereforms to leverage reforms abroad to pro-mote development. Yet to be effective, theseagreements must be designed to achieve spe-
cific objectives that will be important to de-veloping and reinforcing positive domesticpolicies rather than distorting them.
For investment policy, international agree-ments may help increase flows of foreigninvestment, but evidence suggests that thesebenefits are likely to be limited unless theyfocus on creating nondiscriminatory termsof liberalization and on eliminating adversepolicy externalities. Agreements that curbbeggar-thy-neighbor investment policies thatdistort investment location are particularlyimportant in two areas. One critical area isinvestment-distorting trade barriers—that is,border protections, agricultural subsidies, tar-iff escalation, and other practices that bias in-vestment flows away from developing coun-tries’ export activities because such barriersdiscourage imports from those countries. Asecond critical area is disciplining competitionamong governments to lure foreign invest-ment through wasteful investment incentives.An important initial step is developing an in-ventory of the extent, costs, and distortingconsequences of those incentives. Agreementsshould be carefully designed to limit theirscope to areas where international externali-ties exist. In the case of the WTO, the designshould focus on reducing discrimination andincreasing market access. International coop-eration on the design of domestic regulation ismore effectively provided through develop-ment assistance—whether bilateral, regional,or multilateral.
For competition policy, an agreementwould potentially have large benefits if itaddressed those restrictions on competition inthe global marketplace that most adverselyaffected developing countries: policy barriersto competition that hurt exporters, private re-straints in the form of international cartels,and officially sanctioned private restraints em-anating from antitrust exemptions. Muchmore information is needed in this area on theprevalence and effects of policies that restrictcompetition. The international communitycan collaborate with developing countries byproviding technical and financial assistance
I N T E R N A T I O N A L A G R E E M E N T S T O I M P R O V E I N V E S T M E N T A N D C O M P E T I T I O N
145
gep_ch04.qxd 12/5/02 2:50 PM Page 145

to foster mutual learning, information ex-changes, and cooperation on competitionpolicy.
Notes1. WTO 2001a, Paragraphs 20 and 23 in the Doha
WTO Ministerial Declaration. The need for enhancedtechnical assistance and capacity building in theseareas was also recognized.
2. See Ostry 1997; see also Hart 1996.3. United States 1998, as cited in Gilpin 2000: 184.4. See Smythe 1998.5. South-South FDI is calculated by comparing
developing countries’ FDI inflows with recorded out-flows from other regions. This figure may be more ac-curate than others because developing countries oftenunderreport FDI outflows. In addition, round trippingof a country’s own capital can overestimate the FDIfigure (World Bank 2002a).
6. For a cogent description of the predominance ofservices in the NAFTA reservation lists, see Rugmanand Gestrin 1994. See also Gestrin and Rugman 1993.
7. By 2003, all members must have completelyphased out performance requirements that were inplace at the time of the agreement and that were grand-fathered through a notification process. All 27 notifi-cations of policies not consistent with the agreementwere from developing countries. Almost half of noti-fied measures related specifically to the automotive sec-tor. Many of these performance requirements havealready been phased out during the transition period.Ten countries that requested an extension of the tran-sition were granted an additional four years, to 2003.
8. WTO members are faced with two options.First, they can agree to re-open the agreement, whichseems unlikely. Second, they can seek to reduce or elab-orate on the length of the Annex Illustrative List. Theissue is that, even though both notifications and dis-putes have, to date, centered primarily on the “illus-trated” list (notably on local content and, less so, ontrade-balancing requirements), the agreement arguablyprohibits a greater range of as-yet unspecified perfor-mance requirements. Introducing greater specificity inthe language could enlarge the effective coverage of theagreement or confine it to the illustrated list.
9. Within the framework of the ASCM the scopefor discipline lies in the challenge of an investment in-centive that can be shown to be specific, to be withinthe meaning of the agreement, and to be contingent onexport or on having an “adverse effect” on the trade ofanother member. The difficulty of such a challenge de-pends on the specific types of policies that are in ques-tion. One of the key factors in determining a subsidy is
the “financial contribution” that could cover the rangeof fiscal and financial incentives that are used by de-veloped and developing countries. These disciplineshave yet to be tested. In the case of services, the GATSprovides a mandate for developing “necessary multi-lateral disciplines to avoid such trade-distortiveeffects.” The work has progressed slowly.
10. There is evidence of significant investment diver-sion away from the Caribbean Basin countries and to-ward Mexico, but Mexico’s adherence to NAFTA hasalmost certainly been a more important motivating fac-tor than the use of fiscal or financial incentives, whichit can generally ill afford.
11. This is not to deny the potential risk of “invest-ment poaching,” including within developing coun-tries. Studies have indeed documented the negativewelfare implications that derive from incentive pack-ages that merely transfer investment from one locationto another without creating new jobs or improvingproductivity. In the case of Brazil, for instance, the con-sensus among researchers is that heavily indebtedstates have granted very large tax breaks to automotivecompanies to build factories that the companies hadintended to build in Brazil anyway (Rodríguez-Poseand Arbix 2001).
12. Producer support estimates are the annualmonetary value of gross transfers from consumersand taxpayers to support agricultural producers. Thesenumbers are taken from World Bank–IMF 2002.
13. The fact that predation has very little to do withantidumping as it is practiced is perhaps best illustratedby the United States, which has two antidumpingstatutes. One, the Antidumping Act of 1916, maintainsa predation standard for antidumping; the other, theTariff Act of 1930, as amended, has a price and cost-discrimination standard. Invariably cases invoke thesecond act and not the first.
14. Epstein and Newfarmer 1980, for example,found that a cartel for heavy industry operated off andon from December 1939 through the mid-1970s, withovercharges of more than 20 percent on sales of steamturbines and other products.
15. WTO members with established competitionenforcement seem to insist that a precondition for co-operation is that developing countries adopt legislationand establish enforcement capacity: “[C]ooperationwith respect to competition matters [is] only possiblewhen a competition regime [is] already in operation;that is, when there [is] a domestic competition law ofsome sort and a domestic competition authority ex-isted with sufficient powers to effectively enforce thatlaw . . . . While cooperation could be provided within avoluntary framework of mutual interest, it would notbe possible for a developing country to eradicate anti-competitive practices which had an impact on their
G L O B A L E C O N O M I C P R O S P E C T S 2 0 0 3
146
gep_ch04.qxd 12/5/02 2:50 PM Page 146

markets unless it also developed a national competitionlaw” (WTO 2001c: 27, para. 79).
16. See World Bank 2002c for a fuller discussion ofconferences on ocean liners.
17. See WTO 2002.18. Birdsall and Lawrence (1999) write: “When de-
veloping countries enter into modern trade agreements,they often make certain commitments to particulardomestic policies—for example, to antitrust or othercompetition policy. Agreeing to such policies can be inthe interests of developing countries (beyond the tradebenefits directly obtained) because the commitmentcan reinforce the internal reform process. Indeed, partic-ipation in an international agreement can make feasi-ble internal reforms that are beneficial for the countryas a whole [and] that might otherwise be successfullyresisted by interest groups.”
ReferencesAnderson, Robert D., and F. Jenny. 2001. “Current
Developments in Competition Policy in the WorldTrade Organization.” Antitrust 16(1): 40–44 Fall.
Anderson, Robert D., and Peter Holmes. 2002. “Com-petition Policy and the Future of the MultilateralTrading System.” Journal of International Eco-nomic Law 5(2): 531–63.
Aykut, D., and D. Ratha. 2002. “South-South Flowsin the 1990s.” Background Paper for GlobalDevelopment Finance 2002. World Bank,Washington, D.C. April.
Birdsall, N., and Robert Z. Lawrence. 1999. “DeepIntegration and Trade Agreements: Good forDeveloping Countries?” In Kaul, Grunberg, andStern, eds., Global Public Goods: InternationalCooperation in the 21st Century: 128–151.[[City?]]: Oxford University Press.
Cano, Wilson. 1998. Desequilibrios Regionais e Con-centração Industrial no Brasil, 1930–1995. 2d ed.Campinas, São Paulo: Instituto de Economia daUNICAMP.
Charlton, Andrew. 2002. “Incentive Bidding Warsfor Mobile Investment: Economic Consequencesand Potential Responses.” OECD DevelopmentCenter, Paris.
Connor, John M. 2001. Global Price-Fixing: Our Cus-tomers Are the Enemy. Boston: Kluwer AcademicPublishing.
Epstein, B., and Richard S. Newfarmer. 1980. “Inter-national Electrical Association: A ContinuingCartel.” Report to the Committee on Interstateand Foreign Commerce, U.S. House of Repre-sentatives. U.S. Government Printing Office,Washington, D.C. June.
Evenett, Simon J., and Benno Ferrarini. 2002. “Devel-oping Country Interests in International CartelEnforcements in the 1990s.” Background paperfor Global Economic Prospects 2002: Investingto Unlock Global Opportunities. World Bank,Washington, D.C.
Evenett, Simon J., A. Lehmann, and B. Steil. 2000.Antitrust Goes Global: What Future for Transna-tional Corporation? London: Royal Institute ofInternational Affairs, and Washington, D.C.:Brookings Institution Press.
Finger, J. Michael, and A. Winters. 2002. “Reciprocityin the WTO.” In Bernard M. Hoekman, PhilipEnglish, and Aaditya Mattoo, eds., Development,Trade, and the WTO: A Handbook. Washington,D.C.: World Bank.
Fink, C., A. Mattoo, and I. C. Neagu. 2001. “Trade inInternational Maritime Services: How MuchDoes Policy Matter?” World Bank EconomicReview 16: 81–108.
Francois, Joseph F., and I. Wooton. 2001. “Trade inInternational Transport Services: The Role ofCompetition.” Review of International Econom-ics 9(2): 249–61 (May).
Gestrin, Michael, and Alan M. Rugman. 1993. “TheNAFTA’s Impact on the North American Invest-ment Regime.” C. D. Howe Commentary no. 42,C. D. Howe Institute, Toronto. March.
Gilpin, Robert. 2000. The Challenge of GlobalCapitalism: The World Economy in the 21st Cen-tury. Princeton, N.J.: Princeton University Press.
Gresser, Edward. 2002. “America’s Hidden Tax onthe Poor: The Case for Reforming U.S. TariffPolicy.” Progressive Policy Institute Policy Report.Progressive Policy Institute, Washington, D.C.March.
Hallward-Driemeier, M. 2002. “Bilateral InvestmentTreaties: Do They Increase FDI Flows?” Back-ground Paper for Global Economic Prospects2003: Investing to Unlock Global Opportunities.World Bank, Washington D.C.
Hart, M. 1996, “A Multilateral Agreement on ForeignDirect Investment: Why Now?” In P. Sauvé andD. Schwanen, eds., Investment Rules for theGlobal Economy: Enhancing Access to Markets,Policy Study 28: 36–99. Toronto: C. D. HoweInstitute.
Hoekman, Bernard M., and Michel Kostecki. 2001.The Political Economy of the World TradingSystem: The WTO and Beyond. Oxford andNew York: Oxford University Press.
Hoekman, Bernard M., and Petros C. Mavroidis.2002. “Economic Development, CompetitionPolicy, and the WTO.” Paper presented at theRoundtable “Informing the Doha Process: New
I N T E R N A T I O N A L A G R E E M E N T S T O I M P R O V E I N V E S T M E N T A N D C O M P E T I T I O N
147
gep_ch04.qxd 12/5/02 2:50 PM Page 147
Trade Research for Developing Countries.”Cairo, May 20–21.
Hoekman, Bernard M., and K. Saggi. 1999. “Multi-lateral Disciplines for Investment-RelatedPolicies.” Policy Research Working Paper no.2138. Development Research Group, WorldBank, Washington, D.C.
———. 2000. “Assessing the Case for Extending WTODisciplines in Investment-Related Policies.” Jour-nal of Economic Integration 15(4): 629–53(December).
Hoekman, Bernard M., Francis Ng, and M. Olarreaga.2001. “Eliminating Excessive Tariffs on Ex-ports of Least-Developed Countries.” WorkingPaper no. 2604. World Bank, Washington,D.C. May.
Kee, Hiau L., and Bernard M. Hoekman. 2002. “Com-petition Law as Market Discipline.” DevelopmentResearch Group, World Bank, Washington, D.C.Processed.
Levenstein, Margaret, and V. Suslow. 2001. “PrivateInternational Cartels and Their Effects on Devel-oping Countries.” Background paper for theWorld Bank’s World Development Report 2001.World Bank, Washington, D.C.
Mattoo, Aaditya. 2000. “Developing Countries inthe New Round of GATS Negotiations: Towardsa Pro-Active Role.” World Economy 23(4):471–89.
———. 2002. “Shaping Future Rules for Trade inServices: Lessons from the GATS.” In TakatoshiIto and Anne Krueger, eds., Trade in Services.Cambridge, Mass.: NBER.
Messerlin, Patrick A. 2000. Measuring the Costs ofProtection in Europe. Washington, D.C.: Institutefor International Economics.
Moran, Theodore. 2002. “The Relationship betweenTrade, Foreign Direct Investment, and Develop-ment: New Evidence, Strategy, and Tactics underthe Doha Development Agenda Negotiations.”Paper prepared for Asian Development Bank’sStudy on Regional Integration and Trade: Emerg-ing Policy Issues for Selected Developing MemberCountries, September.
OECD (Organisation for Economic Co-operation andDevelopment). 1974. Export Cartels. Report ofthe Committee of Experts on Restrictive BusinessPractices. Paris: OECD.
———. 1996. “Antitrust and Market Access: TheScope and Coverage of Competition Laws andImplications for Trade.” Paris: OECD.
———. 2000. Hard Care Cartels. Paris: OECD.———. 2001. “Agricultural Policies in Emerging and
Transition Economies: Special Focus on Non-Tariff Measures.” Paris: OECD.
Oman, Charles. 2000. Policy Competition for ForeignDirect Investment: A Study of Competitionamong Governments to Attract FDI. Paris:Organisation for Economic Co-operation andDevelopment.
Ostry, Sylvia. 1997. “A New Regime for ForeignDirect Investment.” Occasional Papers no 53.Group of Thirty, Washington, D.C.
Oxfam (Oxfam International). 2002. “Rigged Rulesand Double Standards: Trade, Globalization andthe Fight Against Global Poverty.” London.
Rodríguez-Pose, Andrés, and Glauco Arbix. 2001.“Strategies of Waste: Bidding Wars in theBrazilian Automobile Actor.” International Jour-nal of Urban and Regional Research 2(1): 134–54(March).
Rugman, Alan M., and Michael Gestrin. 1994.“NAFTA’s Treatment of Foreign Investment.” InAlan M. Rugman, ed., Foreign Investment andNAFTA: 47–79. Columbia, S. C.: University ofSouth Carolina Press.
Sauvé, Pierre. 2002. “Collective Action Issues in In-vestment Rule-Making.” Background Paper forGlobal Economic Prospects 2003: Investing toUnlock Global Opportunities World Bank,Washington, D.C.
Sauvé, Pierre, and Christopher Wilkie. 2000. “Invest-ment Liberalisation in GATS.” In Pierre Sauvéand Robert M. Stern, eds., GATS 2000: New Di-rections in Services Trade Liberalization: 331–63.Washington, D.C.: Centre for Business and Gov-ernment, Harvard University, and BrookingsInstitution Press.
Schiff, Maurice. 2001. “Chile’s Trade Policy: AnAssessment.” World Bank, Washington, D.C.November. Processed.
Smythe, Elizabeth. 1998. “Agenda Formation and theNegotiation of Investment Rules at the WTO:The History of a Campaign.” Paper presented atthe Annual Meeting of the International StudiesAssociation, Washington, D.C. February 18.
Stern, Robert M. 2002. “Quantifying Barriers to Tradein Services.” In Bernard M. Hoekman, Philip Eng-lish, and Aaditya Mattoo, eds., Development,Trade, and the WTO: A Handbook. Washington,D.C.: World Bank.
UNCTAD (United Nations Conference on Trade andDevelopment). 1998. World Investment Report.New York: United Nations.
———. 1999. World Investment Report. New York:United Nations.
———. 2000. Bilateral Investment Treaties 1959–1999. United Nations: New York and Geneva.
———. 2001a. World Investment Report. New York:United Nations.
G L O B A L E C O N O M I C P R O S P E C T S 2 0 0 3
148
gep_ch04.qxd 12/5/02 2:50 PM Page 148

———. 2001b. Handbook of Statistics. New York:United Nations.
———. 2002. World Investment Report: UnitedNations.
United States. 1998. Economic Report of the Presi-dent. Washington, D.C.: U. S. Government Print-ing Office. February.
Winters, Alan. 2002. “Doha and the World PovertyTargets.” Paper presented at the ABCDE Confer-ence. World Bank, Washington, D.C. April.
World Bank. 2002a. Global Development Finance.Washington, D.C.: World Bank.
———. 2002b. World Development Indicators.Washington, D.C.: World Bank.
———. 2002c. Global Economic Prospects: MakingTrade Work for the World’s Poor. Washington,D.C.: World Bank.
World Bank–IMF (World Bank–InternationalMonetary Fund). 2002. “Market Access forDeveloping Country Exports—Selected Issues.”September.
WTO (World Trade Organization). 2001a. “DohaWTO Ministerial Declaration.” (WT/MIN(01)/DEC/1). November.
———. 2001b. “International Trade Statistics.”———. 2001c. “Report of the Working Group on the
Interaction between Trade and CompetitionPolicy to the General Council.” (WT/WGTCP/5).October 8.
———. 2002. “Core Principles, Including Trans-parency, Non-Discrimination, and ProceduralAwareness.” Background note by Secretariat.(WT/WGTCP/W/209). Geneva, September 19.
I N T E R N A T I O N A L A G R E E M E N T S T O I M P R O V E I N V E S T M E N T A N D C O M P E T I T I O N
149
gep_ch04.qxd 12/5/02 2:50 PM Page 149

East Asia and Pacific
Recent developments
THE EAST ASIA ECONOMIC RECOVERY
that began in late 2001 continued tostrengthen in the first half of 2002, but
momentum slowed after the summer and un-certainties have increased. Output growth indeveloping East Asia is estimated to have risento 6.3 percent in 2002 from about 5.5 percentin 2001, led by China growing at more than7 percent. Output growth has reboundedmost rapidly in those economies, such as theRepublic of Korea, Malaysia, Taiwan (China),Singapore, and Thailand, that had been hard-est hit by 2001’s steep fall in world trade andhigh-tech demand. Annualized growth in thefirst half of 2002 over the last half of 2001jumped to a 5- to 10-percent range in most ofthese economies, although industrial produc-tion and trade data indicate that outputgrowth softened in the second half of the year.Elsewhere in the region growth had in anycase slowed less among transition economiessuch as China and Vietnam, because of con-tinued strength in domestic demand and aless marked slowdown in exports. Growth inIndonesia and the Philippines had fallen lesssharply to a 3- to 3.5-percent pace in 2001from a 4- to 5-percent pace in 2000, andthe cyclical rebound in these countries (whilemore pronounced in the Philippines), has alsobeen less clear-cut than elsewhere in theregion.
The recovery so far has been underpinnedby both external and domestic demand. Agradual pickup in world conditions from2001’s severe global slowdown supported arevival of exports, including exports in the im-portant high-tech sector. U.S. dollar prices formany important East Asian primary commod-ity exports such as rice, rubber, palm oil, co-conut products, and lumber also rose sharplyafter late 2001, although they rose from thevery low levels reached following several yearsin which steep declines in the terms of tradeinflicted large income losses in many EastAsian countries. Intraregional exports havebeen strong, most notably those to China,which jumped an amazing 50 percent in thefirst half of 2002. Supportive monetary and(in several cases) fiscal policy conditions havefueled domestic demand. Household spendingin the region has been especially robust, boost-ing spending on cars and other consumerdurables, but private investment still lags.Debt-equity ratios, though they have fallenin some instances, remain high by interna-tional standards in most cases, and togetherwith low corporate profitability, continue todepress the investment climate and underminethe prospects for accelerated medium-termgrowth.
World semiconductor sales and orders forhigh-tech equipment in the United States re-bounded strongly in late 2001, but growthrates had already peaked before the summerof 2002, and the levels remained far below the
151
Appendix 1Regional Economic Prospects
gep_app01.qxd 12/5/02 1:04 PM Page 151
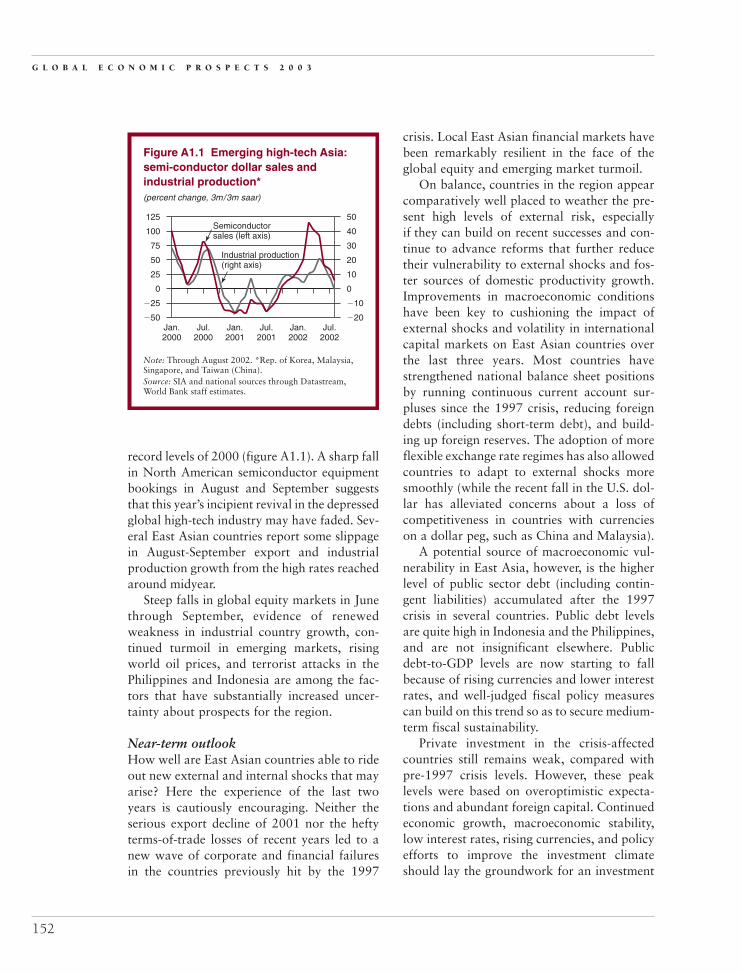
record levels of 2000 (figure A1.1). A sharp fallin North American semiconductor equipmentbookings in August and September suggeststhat this year’s incipient revival in the depressedglobal high-tech industry may have faded. Sev-eral East Asian countries report some slippagein August-September export and industrialproduction growth from the high rates reachedaround midyear.
Steep falls in global equity markets in Junethrough September, evidence of renewedweakness in industrial country growth, con-tinued turmoil in emerging markets, risingworld oil prices, and terrorist attacks in thePhilippines and Indonesia are among the fac-tors that have substantially increased uncer-tainty about prospects for the region.
Near-term outlookHow well are East Asian countries able to rideout new external and internal shocks that mayarise? Here the experience of the last twoyears is cautiously encouraging. Neither theserious export decline of 2001 nor the heftyterms-of-trade losses of recent years led to anew wave of corporate and financial failuresin the countries previously hit by the 1997
crisis. Local East Asian financial markets havebeen remarkably resilient in the face of theglobal equity and emerging market turmoil.
On balance, countries in the region appearcomparatively well placed to weather the pre-sent high levels of external risk, especiallyif they can build on recent successes and con-tinue to advance reforms that further reducetheir vulnerability to external shocks and fos-ter sources of domestic productivity growth.Improvements in macroeconomic conditionshave been key to cushioning the impact ofexternal shocks and volatility in internationalcapital markets on East Asian countries overthe last three years. Most countries havestrengthened national balance sheet positionsby running continuous current account sur-pluses since the 1997 crisis, reducing foreigndebts (including short-term debt), and build-ing up foreign reserves. The adoption of moreflexible exchange rate regimes has also allowedcountries to adapt to external shocks moresmoothly (while the recent fall in the U.S. dol-lar has alleviated concerns about a loss ofcompetitiveness in countries with currencieson a dollar peg, such as China and Malaysia).
A potential source of macroeconomic vul-nerability in East Asia, however, is the higherlevel of public sector debt (including contin-gent liabilities) accumulated after the 1997crisis in several countries. Public debt levelsare quite high in Indonesia and the Philippines,and are not insignificant elsewhere. Publicdebt-to-GDP levels are now starting to fallbecause of rising currencies and lower interestrates, and well-judged fiscal policy measurescan build on this trend so as to secure medium-term fiscal sustainability.
Private investment in the crisis-affectedcountries still remains weak, compared withpre-1997 crisis levels. However, these peaklevels were based on overoptimistic expecta-tions and abundant foreign capital. Continuedeconomic growth, macroeconomic stability,low interest rates, rising currencies, and policyefforts to improve the investment climateshould lay the groundwork for an investment
G L O B A L E C O N O M I C P R O S P E C T S 2 0 0 3
152
Note: Through August 2002. *Rep. of Korea, Malaysia,Singapore, and Taiwan (China).Source: SIA and national sources through Datastream,World Bank staff estimates.
�50
�25
0
25
50
75
100
125
�20
�10
20
10
0
30
40
50
Figure A1.1 Emerging high-tech Asia:semi-conductor dollar sales andindustrial production*
Jul.2002
Jan.2000
Jul.2000
Jan.2001
Jul.2001
Jan.2002
(percent change, 3m/3m saar)
Industrial production(right axis)
Semiconductorsales (left axis)
gep_app01.qxd 12/5/02 1:04 PM Page 152

revival in due course. Equity markets in EastAsia also fell sharply in this period, but overthe last one or two years they have generallyoutpaced industrial country equity markets.In countries with flexible regimes, currenciesgenerally rose against the dollar during 2002while remaining steady or depreciating mod-estly against the yen. The stronger trend incurrencies occurred despite the fact that do-mestic interest rates in most countries weresignificantly lower than average 2001 levels,and is striking evidence of improving investorperceptions of the region.
The October terrorist attack in Bali isalso expected to reduce near-term growth inIndonesia. Receipts from tourism represent 4 to5 percent of gross domestic product (GDP) inIndonesia, and in Southeast Asia generally.Indonesian tourist arrivals could fall byaround 20 percent, based on the experience ofthe 1997 terrorist attack on tourists in Luxor,the Arab Republic of Egypt, and the impact ofprevious political unrest in Indonesia itself.Lower levels of tourist arrivals and the adverseimpact of the attack on consumer and busi-
ness confidence could reduce Indonesia’sgrowth by 1 percentage point in 2003. Gov-ernments in Southeast Asia must now grapplewith a major security challenge that also haspotentially divisive domestic political implica-tions—all at a time when many countries aremoving into the next turn of their electoralcycles. A loss of focus on development andreform priorities could result.
In this environment, acceleration of growthis unlikely, although there are also no signs ofsharp deterioration. Regional GDP is expectedto grow 6.1 percent in 2003 and 6.4 percent in2004. Growth in the region, excluding China, isexpected to reach 3.8 and 4.3 percent in 2003and 2004 respectively. Median inflation is ex-pected to remain low, albeit probably above thehistorically low 2.5 percent in 2002. With ex-port volumes growing at a rate of around 9 per-cent, the current accounts remain on average ata comfortable surplus of 2.5 percent of GDP.
Long-term outlookEast Asian countries face growing demandsfor better-quality public goods and services,
R E G I O N A L E C O N O M I C P R O S P E C T S
153
Table A1.1 East Asia and Pacific forecast summary(percent per year)
Baseline forecast
Growth rates/ratios 1991–2000 2000 2001 2002 2003 2004 2005–15
Real GDP growth 7.7 7.0 5.5 6.3 6.1 6.4 6.2Private consumption per capita 5.8 6.0 6.2 5.7 5.2 5.6 5.6GDP per capita 6.4 5.9 4.5 5.4 5.2 5.6 5.4
Population 1.2 1.0 0.9 0.9 0.9 0.8 0.7Gross domestic investment/GDPa 28.7 29.2 30.1 32.8 33.9 34.9 30.4Inflationb 5.6 5.0 6.6 2.5 3.6 3.6 …Central gvt. budget balance/GDP �1.2 �3.3 �3.3 �3.6 �3.4 �3.3 …Export market growthc 9.7 14.1 �2.5 3.6 9.2 8.7 …Export volumed 11.4 22.5 2.5 15.9 15.7 11.3 …Terms of trade/GDPe 0.0 0.0 �0.4 �0.5 �0.1 �0.3 …Current account/GDP 0.5 3.6 2.7 2.7 2.7 2.5 …Memorandum itemsGDP growth: East Asia excluding China 4.5 5.4 2.3 3.6 3.8 4.3 5.0
… Not available.a. Fixed investment, measured in real terms.b. Local currency GDP deflator, median.c. Weighted average growth of import demand in export markets.d. Goods and nonfactor services.e. Change in terms of trade, measured as a proportion to GDP (percentage).Source: World Bank baseline forecast, November 2002.
gep_app01.qxd 12/5/02 1:04 PM Page 153

not least for better law and order. Protectingthe lives and property of the public and up-holding rule of law are essential complementsto the ongoing emergence or consolidationof representative or democratic government inthe region, as well as a basic underpinning foreconomic development. The Bali terrorist at-tack underlines the importance of strengthen-ing security and law and order, through bothnational and cooperative regional efforts.
Continued public sector and governance re-forms are important if greater fiscal discipline inEast Asia is to be combined with meeting pub-lic demand for more and better public goodsand services, such as law and order, health, ed-ucation, basic research, technology dissemina-tion, and infrastructure generally. Many of thesethings are valuable to consumers in their ownright, are key elements of a productive invest-ment climate, and provide a crucial underpin-ning for political legitimacy and stability. Thereis now open discussion and acknowledgment ofthese issues in the region, though the pace of re-form is generally slow, except in the Republic ofKorea, Malaysia, and Singapore.
Countries have generally continued to makesome progress (at varying rates) on corporateand financial restructuring, reforms to improvefinancial supervision and regulation, andstrengthening corporate governance. However,most countries need to deepen corporate andfinancial sector reform efforts, as well as fur-ther the broader institutional agenda of foster-ing private sector development and strengthen-ing the investment climate. It is notable thatthe sectors which are more dynamic are thosewhere the corporate restructuring agenda isless urgent, for example, small- and medium-scale enterprises or large exporters who havemoved more quickly to resolve their debts.This is especially important because China’sWorld Trade Organization (WTO) accession isleading to a restructuring of regional produc-tion networks, a surge in foreign direct invest-ment (FDI) to China, and an increase in com-petitive pressures in other countries in theregion, especially those competing directlywith China in low wage sectors.
Efforts to strengthen regional cooperationin East Asia have gained ground in recentyears, alongside the region’s long-standingcommitment to multilateral trade liberaliza-tion and integration. The Association ofSoutheast Asian Nations (ASEAN) Free TradeArea (AFTA) came into force at the begin-ning of 2002 among the six original members.Association members now seek to build ontheir success in reducing tariff barriers andfostering deeper integration by tackling issuessuch as non-tariff barriers, product standards,customs procedures, trade in services, trans-port and logistics, and investment flows. Atthe same time the Initiative for ASEAN Inte-gration (IAI) has been launched to help newand less-developed members (Cambodia, theLao People’s Democratic Republic, Myanmar,and Vietnam) build capacity and integratemore fully into the AFTA over time. Regionaldiscussions and cooperation in the ASEAN�3(ASEAN, China, Japan, and Korea) and othernew forums also continue to develop.
Against this background, per capita GDPin the region could grow solidly at a rate ofaround 5.5 percent during the coming decade,although this implies a slowing by 1 percent-age point compared with the previous decadeof rapid catching up. As population growthalso slows during the coming 15 years—being0.5 percentage point lower than during the1990s—the long-run trend in GDP growth isestimated to be 6.2 percent, 1.5 percentagepoint below the trend during the 1990s.
South Asia
Recent developments
Growth in the South Asia region is proj-ected to average 4.6 percent in 2002.This downward revision from the
Global Economic Prospects 2002 forecast of5.3 percent GDP growth for the year largelyreflects adverse weather conditions, continuedinternal and external security concerns, andthe more protracted than anticipated recentglobal economic slowdown. As a consequence,
G L O B A L E C O N O M I C P R O S P E C T S 2 0 0 3
154
gep_app01.qxd 12/5/02 1:04 PM Page 154

given slower demand growth, inflation hasremained low throughout most of the region,notwithstanding high oil prices. Further, gov-ernment budget balances are expected to postrising deficits in most countries. On an ag-gregate level, current account balances—which strengthened during 2001, reaching asurplus in the case of India—are projectedto show a slight improvement during 2002.This is partly due to lower levels of imports,which are generally projected to more thanoffset the negative impact of slow exportvolume growth dampened by weak externaldemand.
Because agriculture is a key sector in the re-gion’s economies, important to both employ-ment and growth, the recent drought has re-strained output, although the late rains (insome cases flooding) have somewhat amelio-rated the shortfall for the season. As a conse-quence, 2002 harvests are expected to be gen-erally smaller than in 2001, an outcome that isexpected to put some additional pressure ongovernment coffers through increased trans-fers for drought relief.
Security issues are an ongoing concern, al-though there has been some easing of tensionsin parts of the region, paving the way forimproved growth conditions. The diminishedfighting in Afghanistan from late 2001, andthe more recent introduction of a new govern-ment in June 2002, has led to a rebound in ac-tivity to begin rebuilding the economy fromextremely low levels and contraction in 2001.
Throughout the region, the weakening ofeconomic conditions has complicated effortsat fiscal consolidation. Although some coun-tries were able to achieve budget targets bycutting expenditures—including spending ondevelopment programs—to offset revenuelosses, India notably did not cut expenditures.Citing concerns about the magnitude ofIndia’s domestic debt—estimated at 70 per-cent of GDP—Standard and Poor down-graded Indian government paper to junk bondstatus in October 2002.
External demand in South Asia’s majormarkets has been subdued in the first half of
2002, although it shows some firming relativeto the contraction witnessed in 2001 for mostof the region’s economies. During the secondhalf of 2002, preliminary data suggest somefurther acceleration of export volume growth,although not as strong as projected in GlobalEconomic Prospects 2002, given the moreprotracted recovery in world trade volumes.Import volume growth has been dampened bysluggish demand for raw materials and inter-mediate goods by exporters and by weak do-mestic demand conditions. The overall impactof these factors has led to a net improvementin the region’s trade balance. This improve-ment, combined with a rise in the region’s ag-gregate worker remittances—reflecting port-folio shifts following the September 11 attacksand, in the case of Bangladesh, a sharp in-crease in private inflows due to improvementsin the speed with which remittances are trans-ferred through official channels—has con-tributed to an increase in the region’s foreignreserve holdings. Given the recent weakness ofthe U.S. dollar, a number of currencies in theregion have appreciated during 2002. How-ever, a general monetary stance of maintainingcompetitiveness suggests that these short-term
R E G I O N A L E C O N O M I C P R O S P E C T S
155
Jul.
1997
Jan.
199
8Ju
l. 19
98Ja
n. 1
999
Jul.
1999
Jan.
200
0Ju
l. 20
00Ja
n. 2
001
Jul.
2001
Jan.
200
2Ju
l. 20
02
Source: International Monetary Fund, InternationalFinancial Statistics.
�15
�10
�5
0
5
10
15
20
25
Figure A1.2 Industrial production inSouth Asia(3-month moving average, y/y percentage change)
Bangladesh Pakistan
India
gep_app01.qxd 12/5/02 1:04 PM Page 155

cross-currency dynamics will reverse and thatregional exchange rates will resume a path ofdepreciation.
Near-term outlookOur near-term outlook is premised upon con-tinued improvement in both domesticpolitical stability and regional security issues—although tensions will remain evident. Amarked improvement in Sri Lanka’s politicaland policy environment, for example, shouldallow that country to enjoy a sharp accelera-tion of GDP over the near term—and, indeed,into the medium term. In contrast, continueddomestic political pressures would cause Nepalto underperform relative to regional growthaverages in the near-term forecast horizon.
We are also assuming a return to morenormal weather patterns over the next twoyears, in contrast to the recent drought condi-tions discussed above. Agriculture accountsfor approximately one-fourth of regional out-put, but the impact of improved harvests willbe even more pronounced for the pooresthouseholds, for whom the rural economy
provides the largest share of employment.Higher rural incomes will feed through intostronger private consumption growth, butprospects for investment—particularly in theprivate sector—are more mixed, as continuedconcerns over stability will at least partiallyoffset the impetus to invest generated bystronger domestic and external demand. In-dustrial production will marginally underpacereal GDP growth, as the service sector contin-ues to provide the main near-term contri-bution to growth over much of the region.
Our global projections of a recovery inworld trade prospects translate into strength-ening external demand conditions for theeconomies in the South Asia region. Partly be-cause of the above assessment of the domesticeconomy, the region is forecast to post a firm-ing of growth to an average of 5.4 percent in2003 and 5.8 percent in 2004. Trade balancesshould benefit, although import growth willalso strengthen along with external demand,given the high import content of exportsand high import intensity of consumption.Coupled with a modest deterioration in the
G L O B A L E C O N O M I C P R O S P E C T S 2 0 0 3
156
Table A1.2 South Asia forecast summary(percent per year)
Baseline forecast
Growth rates/ratios 1991–2000 2000 2001 2002 2003 2004 2005–15
Real GDP growth 5.2 4.8 4.4 4.6 5.4 5.8 5.4Private consumption per capita 2.0 1.4 4.1 2.6 3.6 4.0 3.2GDP per capita 3.3 2.9 2.6 2.9 3.8 4.2 4.1
Population 1.9 1.9 1.7 1.7 1.6 1.6 1.3Gross domestic investment/GDPa 21.9 24.2 24.9 25.8 25.8 25.5 24.8Inflationb 7.9 3.9 6.1 5.0 5.1 6.8 …Central gvt. budget balance/GDP �10.3 �9.7 �10.3 �10.3 �9.8 �9.2 …Export market growthc 12.8 13.1 0.4 2.8 7.3 7.9 …Export volumed 10.9 7.4 5.3 8.3 8.8 8.5 …Terms of trade/GDPe �0.1 �0.8 0.4 0.0 0.2 0.2 …Current account/GDP �1.5 �0.8 �0.3 �0.1 �0.2 �0.2 …Memorandum itemsGDP growth: South Asia excluding India 4.3 4.2 3.8 3.9 4.8 5.2 5.3
… Not available.a. Fixed investment, measured in real terms.b. Local currency GDP deflator, median.c. Weighted average growth of import demand in export markets.d. Goods and nonfactor services.e. Change in terms of trade, measured as a proportion to GDP (percentage).Source: World Bank baseline forecast, November 2002.
gep_app01.qxd 12/5/02 1:04 PM Page 156

terms of trade, these growth patterns are ex-pected to translate into a slight increase in theregional average current account deficit toGDP ratios.
Macroeconomic policies in the region havehistorically been biased toward accommodat-ing growth and have generated fiscal imbal-ances. Generally, revenue mobilization remainsa challenge in the region. The unsustainablenature of fiscal deficits has been widely rec-ognized by governments across the region—although this does not imply that a consensushas been reached. Therefore, the introductionof prudent fiscal policies over the next twoyears could be tempered by political consider-ations, and by the need to address the laggedeffects of the current downturn in agriculturaloutput. Indeed, budget deficits in many coun-tries could deteriorate in the next fiscal year.One of the key problems is the scale of publicdebt—large servicing requirements limit thescope for cutting expenditures, especially inconditions of extreme poverty. The main issuefor the region is extending the tax base, butprogress to date has not been as rapid as an-ticipated. The introduction of tax reforms inIndia, for example, has been delayed.
Most regional economies have a generalmonetary policy posture involving deprecia-tion aimed at shoring up foreign reserves andpromoting exports through increased compet-itiveness, which is forecast to also have a pos-itive impact on current account balances. Thisconduct of monetary policies had been facili-tated by relatively weak inflationary pressuresacross the region. In general, consumer priceinflation in the region has been relatively low,despite the droughts and firm oil prices of re-cent years. Several countries have subsidies forfuel and some foods, a policy that cushionsthe impact of imported inflation on consumerprices. However, these are being lifted in somecases (for example, Pakistan). While the recentslowdown in demand will restrain price risesinitially, inflation is forecast to rise moderatelylater in 2003 and in 2004 as growth momen-tum builds, and as the average prices of non-oil imports rise.
Long-term prospectsLong-term growth in South Asia is forecastto average about 5.5 percent, in line withthe growth forecast in Global EconomicProspects 2002. This forecast is somewhathigher than the 5.2 percent average realgrowth posted during the 1990s. The higherprojected growth over the coming decade,through 2015, reflects a number of underly-ing assumptions, such as the assumption of alarger contribution of growth by the privatesector. This in turn reflects the expectation ofprogress with fiscal consolidation and contin-ued structural reforms, including reforms intrade, banking, privatization, and infrastruc-ture. These factors, combined with the im-provement in human capital indicators inrecent years—such as rising literacy rates andschool enrollments, and declining infant mor-tality rates—will lead to an increase in pro-ductivity. Despite a projection of declininginfant mortality rates, overall the South Asianpopulation growth rate is projected to deceler-ate because birthrates are expected to declinefaster. Lower population growth in the com-ing decade, along with the forecast growthrates, implies that per capita GDP growth willbe close to 4 percent per year.
RisksDownside risks to the forecast include a weakerthan anticipated recovery in global demand,translating into slower export growth andlower regional GDP. Similarly, a continuationof adverse weather conditions would result inlower than anticipated growth caused bylower agricultural output. Domestic politicaluncertainty could slow down implementationof fiscal and other structural reforms.Regional political tensions also pose impor-tant threats to the growth forecasts, poten-tially aggravating economic disruptions andincreasing poverty rates, as well as generatingless severe effects, such as declines in tourismrevenues and the reduction of foreign assis-tance. Generally, the region faces a number ofvulnerabilities, as evidenced by the covariantshocks over recent years—such as droughts in
R E G I O N A L E C O N O M I C P R O S P E C T S
157
gep_app01.qxd 12/5/02 1:04 PM Page 157
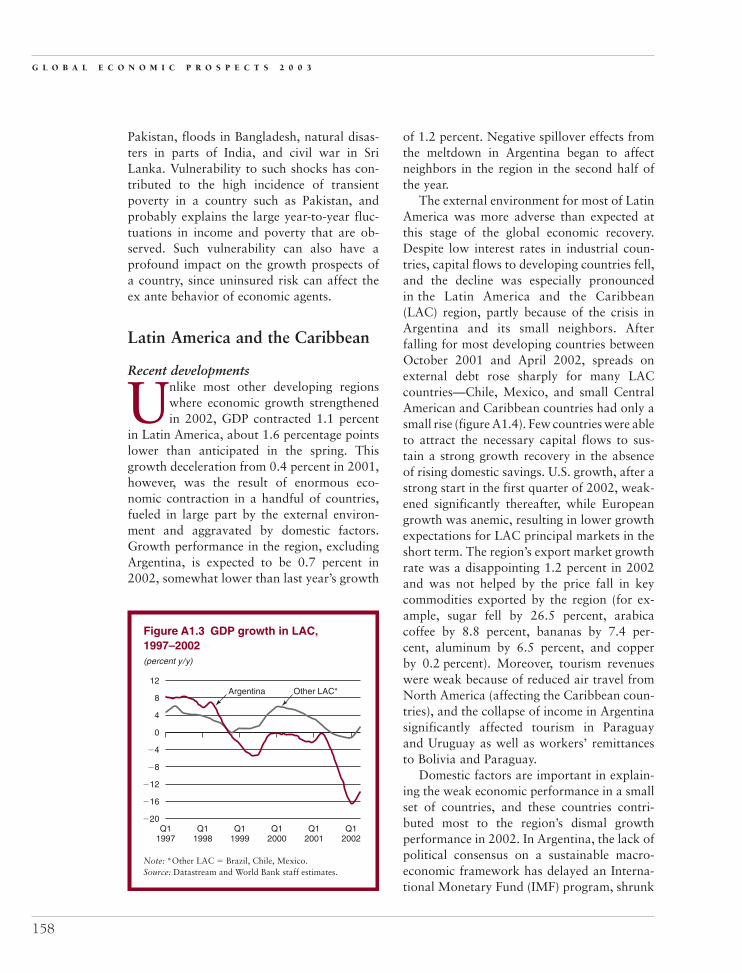
Pakistan, floods in Bangladesh, natural disas-ters in parts of India, and civil war in SriLanka. Vulnerability to such shocks has con-tributed to the high incidence of transientpoverty in a country such as Pakistan, andprobably explains the large year-to-year fluc-tuations in income and poverty that are ob-served. Such vulnerability can also have aprofound impact on the growth prospects ofa country, since uninsured risk can affect theex ante behavior of economic agents.
Latin America and the Caribbean
Recent developments
Unlike most other developing regionswhere economic growth strengthenedin 2002, GDP contracted 1.1 percent
in Latin America, about 1.6 percentage pointslower than anticipated in the spring. Thisgrowth deceleration from 0.4 percent in 2001,however, was the result of enormous eco-nomic contraction in a handful of countries,fueled in large part by the external environ-ment and aggravated by domestic factors.Growth performance in the region, excludingArgentina, is expected to be 0.7 percent in2002, somewhat lower than last year’s growth
of 1.2 percent. Negative spillover effects fromthe meltdown in Argentina began to affectneighbors in the region in the second half ofthe year.
The external environment for most of LatinAmerica was more adverse than expected atthis stage of the global economic recovery.Despite low interest rates in industrial coun-tries, capital flows to developing countries fell,and the decline was especially pronouncedin the Latin America and the Caribbean(LAC) region, partly because of the crisis inArgentina and its small neighbors. Afterfalling for most developing countries betweenOctober 2001 and April 2002, spreads onexternal debt rose sharply for many LACcountries—Chile, Mexico, and small CentralAmerican and Caribbean countries had only asmall rise (figure A1.4). Few countries were ableto attract the necessary capital flows to sus-tain a strong growth recovery in the absenceof rising domestic savings. U.S. growth, after astrong start in the first quarter of 2002, weak-ened significantly thereafter, while Europeangrowth was anemic, resulting in lower growthexpectations for LAC principal markets in theshort term. The region’s export market growthrate was a disappointing 1.2 percent in 2002and was not helped by the price fall in keycommodities exported by the region (for ex-ample, sugar fell by 26.5 percent, arabicacoffee by 8.8 percent, bananas by 7.4 per-cent, aluminum by 6.5 percent, and copperby 0.2 percent). Moreover, tourism revenueswere weak because of reduced air travel fromNorth America (affecting the Caribbean coun-tries), and the collapse of income in Argentinasignificantly affected tourism in Paraguayand Uruguay as well as workers’ remittancesto Bolivia and Paraguay.
Domestic factors are important in explain-ing the weak economic performance in a smallset of countries, and these countries contri-buted most to the region’s dismal growthperformance in 2002. In Argentina, the lack ofpolitical consensus on a sustainable macro-economic framework has delayed an Interna-tional Monetary Fund (IMF) program, shrunk
G L O B A L E C O N O M I C P R O S P E C T S 2 0 0 3
158
Note: *Other LAC � Brazil, Chile, Mexico.Source: Datastream and World Bank staff estimates.
Figure A1.3 GDP growth in LAC,1997–2002(percent y/y)
�16
�20
�12
Q12002
Q11997
Q11998
Q11999
Q12000
Q12001
�8
�4
0
4
8
12Argentina Other LAC*
gep_app01.qxd 12/5/02 1:04 PM Page 158
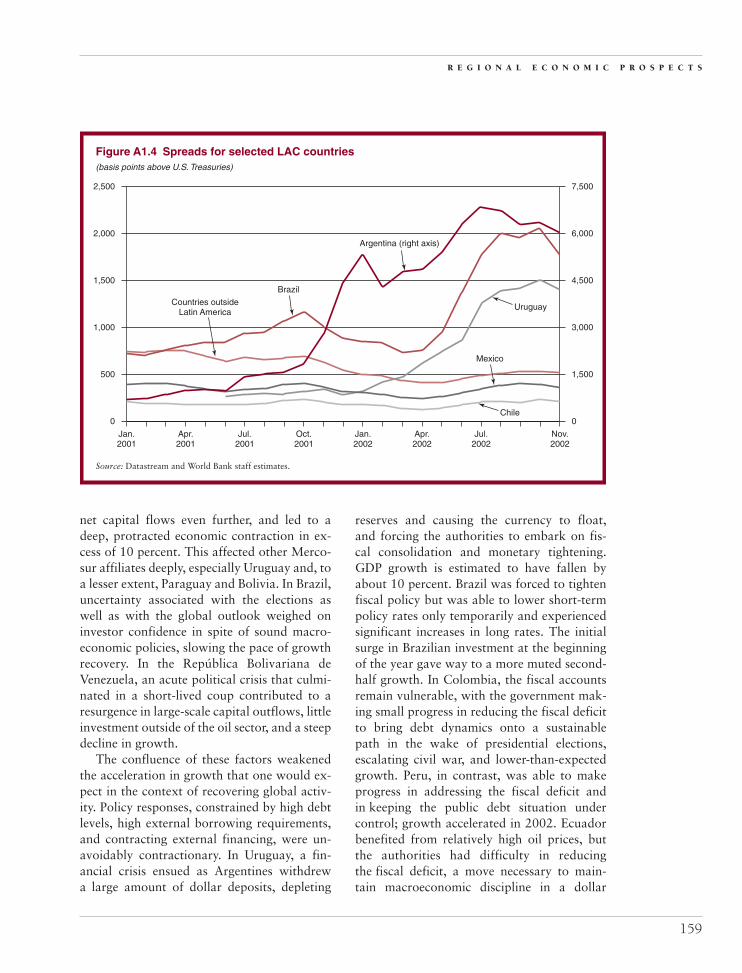
net capital flows even further, and led to adeep, protracted economic contraction in ex-cess of 10 percent. This affected other Merco-sur affiliates deeply, especially Uruguay and, toa lesser extent, Paraguay and Bolivia. In Brazil,uncertainty associated with the elections aswell as with the global outlook weighed oninvestor confidence in spite of sound macro-economic policies, slowing the pace of growthrecovery. In the República Bolivariana deVenezuela, an acute political crisis that culmi-nated in a short-lived coup contributed to aresurgence in large-scale capital outflows, littleinvestment outside of the oil sector, and a steepdecline in growth.
The confluence of these factors weakenedthe acceleration in growth that one would ex-pect in the context of recovering global activ-ity. Policy responses, constrained by high debtlevels, high external borrowing requirements,and contracting external financing, were un-avoidably contractionary. In Uruguay, a fin-ancial crisis ensued as Argentines withdrewa large amount of dollar deposits, depleting
reserves and causing the currency to float,and forcing the authorities to embark on fis-cal consolidation and monetary tightening.GDP growth is estimated to have fallen byabout 10 percent. Brazil was forced to tightenfiscal policy but was able to lower short-termpolicy rates only temporarily and experiencedsignificant increases in long rates. The initialsurge in Brazilian investment at the beginningof the year gave way to a more muted second-half growth. In Colombia, the fiscal accountsremain vulnerable, with the government mak-ing small progress in reducing the fiscal deficitto bring debt dynamics onto a sustainablepath in the wake of presidential elections,escalating civil war, and lower-than-expectedgrowth. Peru, in contrast, was able to makeprogress in addressing the fiscal deficit andin keeping the public debt situation undercontrol; growth accelerated in 2002. Ecuadorbenefited from relatively high oil prices, butthe authorities had difficulty in reducingthe fiscal deficit, a move necessary to main-tain macroeconomic discipline in a dollar
R E G I O N A L E C O N O M I C P R O S P E C T S
159
Figure A1.4 Spreads for selected LAC countries(basis points above U.S. Treasuries)
Source: Datastream and World Bank staff estimates.
0
500
1,000
1,500
2,000
2,500
0
1,500
3,000
4,500
6,000
7,500
Jan.2001
Apr.2001
Jul.2001
Oct.2001
Jan.2002
Apr.2002
Jul.2002
Nov.2002
Argentina (right axis)
Brazil
UruguayCountries outsideLatin America
Mexico
Chile
gep_app01.qxd 12/5/02 1:04 PM Page 159

economy. In Central America, low exportearnings from falling coffee prices and weakdemand in the United States, and relativelyhigh fiscal and external deficits, limited fiscalexpansion. And some Caribbean countrieswere faced with little scope for fiscal expan-sion or monetary easing in light of decliningtourism revenues; weak prices of bananas,sugar, and aluminum; and, in the case ofJamaica, a large debt overhang that was ex-acerbated by the financial sector crisis in themid-1990s. In Mexico, the government stuckto fiscal discipline—helped by higher-than-expected oil prices—and is making slowprogress with key reforms, while being onlypartially successful in increasing non-oil gov-ernment revenues.
Overall, policies in Latin America were in-strumental in keeping inflation from accelerat-ing in most countries. However, countries thathad a sharp adjustment in their exchange ratesdue to a sharp fall in net capital flows did faceinflationary pressures. Inflation (as measuredby consumer price index—CPI) rose to fairlyhigh levels in Argentina (about 45 percent), inVenezuela (in excess of 20 percent), and inUruguay (about 20 percent). Given high debtlevels and worsening public debt dynamics—due to high interest rates and depreciatingcurrencies—most authorities were unable topursue countercyclical policies, and unemploy-ment remained high throughout the region(21.5 percent [May] in Argentina, 19 percent[September] in Uruguay, 16.2 percent [June]in Venezuela, 17.2 percent [September] inColombia, and 9.7 percent [September] inChile).
Slow world growth and external financingconstraints compelled an adjustment in the re-gion’s external accounts. Import volumes fellfor a second consecutive year (mostly due tosharp declines in Argentina, Uruguay, andVenezuela), and the current account deficitnarrowed from over $50 billion (or 2.9 per-cent of GDP) in 2001 to below $25 billion (or1.5 percent of GDP) in 2002, with most ofthe adjustment coming after April. The levelof foreign reserves in August was around
$10 billion lower than at the end of last year,due primarily to sharp declines in Argentinaand Uruguay.
Near-term outlookThe region’s growth prospects are expected toimprove in 2003, supported by strengtheningof the global economy, particularly in tradevolumes, commodity prices, and capital flows.The region’s GDP is now expected to grow by1.8 percent in 2003—still almost 2 percentagepoints lower than the spring forecast and inline with the downgrading of world growth,provided there is a turnaround in the currentuncertain political and financial market out-look. Greater fiscal adjustment in a number ofcountries with high debt and relatively largefinancing requirements is a necessity for reduc-ing economic vulnerabilities. This, along withreforms currently on the agendas of manycountries, is needed to restore investor confi-dence (which will lower interest costs), attractmore equity external financing, and reinvigo-rate growth.
In the baseline forecast, it is assumed thatArgentina will put in place an externally sup-ported macroeconomic program that will bereaffirmed by the new government after theelection in March 2003. Depending on itsactual timing, this would lead to a revival ofgrowth, possibly by midyear—but may notshow up in strong annual growth until 2004.If this scenario were to materialize, it wouldimprove prospects for the smaller Mercosurcountries. The base case also depicts a newBrazilian government that maintains prudentmacroeconomic policies and succeeds inrestoring market confidence. Regional GDPgrowth is expected to rise to 3.7 percent in2004.
There are a number of positive factors forthe region that give credence to the baselineforecast. Mexico has weathered the recentglobal downturn very well. Sound policieshave kept investors confident and inflowslarge, and the upturn in U.S. growth shouldbolster a rapid expansion in 2003. Chile alsohas fared well in light of negative effects from
G L O B A L E C O N O M I C P R O S P E C T S 2 0 0 3
160
gep_app01.qxd 12/5/02 1:04 PM Page 160
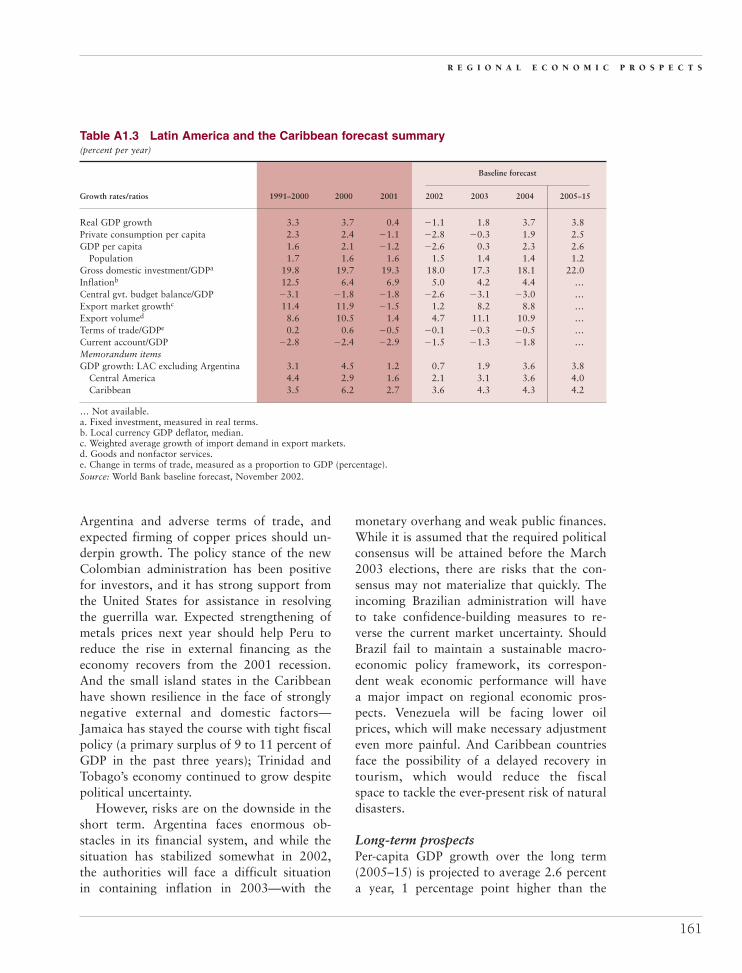
Argentina and adverse terms of trade, andexpected firming of copper prices should un-derpin growth. The policy stance of the newColombian administration has been positivefor investors, and it has strong support fromthe United States for assistance in resolvingthe guerrilla war. Expected strengthening ofmetals prices next year should help Peru toreduce the rise in external financing as theeconomy recovers from the 2001 recession.And the small island states in the Caribbeanhave shown resilience in the face of stronglynegative external and domestic factors—Jamaica has stayed the course with tight fiscalpolicy (a primary surplus of 9 to 11 percent ofGDP in the past three years); Trinidad andTobago’s economy continued to grow despitepolitical uncertainty.
However, risks are on the downside in theshort term. Argentina faces enormous ob-stacles in its financial system, and while thesituation has stabilized somewhat in 2002,the authorities will face a difficult situationin containing inflation in 2003—with the
monetary overhang and weak public finances.While it is assumed that the required politicalconsensus will be attained before the March2003 elections, there are risks that the con-sensus may not materialize that quickly. Theincoming Brazilian administration will haveto take confidence-building measures to re-verse the current market uncertainty. ShouldBrazil fail to maintain a sustainable macro-economic policy framework, its correspon-dent weak economic performance will havea major impact on regional economic pros-pects. Venezuela will be facing lower oilprices, which will make necessary adjustmenteven more painful. And Caribbean countriesface the possibility of a delayed recovery intourism, which would reduce the fiscalspace to tackle the ever-present risk of naturaldisasters.
Long-term prospectsPer-capita GDP growth over the long term(2005–15) is projected to average 2.6 percenta year, 1 percentage point higher than the
R E G I O N A L E C O N O M I C P R O S P E C T S
161
Table A1.3 Latin America and the Caribbean forecast summary(percent per year)
Baseline forecast
Growth rates/ratios 1991–2000 2000 2001 2002 2003 2004 2005–15
Real GDP growth 3.3 3.7 0.4 �1.1 1.8 3.7 3.8Private consumption per capita 2.3 2.4 �1.1 �2.8 �0.3 1.9 2.5GDP per capita 1.6 2.1 �1.2 �2.6 0.3 2.3 2.6
Population 1.7 1.6 1.6 1.5 1.4 1.4 1.2Gross domestic investment/GDPa 19.8 19.7 19.3 18.0 17.3 18.1 22.0Inflationb 12.5 6.4 6.9 5.0 4.2 4.4 …Central gvt. budget balance/GDP �3.1 �1.8 �1.8 �2.6 �3.1 �3.0 …Export market growthc 11.4 11.9 �1.5 1.2 8.2 8.8 …Export volumed 8.6 10.5 1.4 4.7 11.1 10.9 …Terms of trade/GDPe 0.2 0.6 �0.5 �0.1 �0.3 �0.5 …Current account/GDP �2.8 �2.4 �2.9 �1.5 �1.3 �1.8 …Memorandum itemsGDP growth: LAC excluding Argentina 3.1 4.5 1.2 0.7 1.9 3.6 3.8
Central America 4.4 2.9 1.6 2.1 3.1 3.6 4.0Caribbean 3.5 6.2 2.7 3.6 4.3 4.3 4.2
… Not available.a. Fixed investment, measured in real terms.b. Local currency GDP deflator, median.c. Weighted average growth of import demand in export markets.d. Goods and nonfactor services. e. Change in terms of trade, measured as a proportion to GDP (percentage).Source: World Bank baseline forecast, November 2002.
gep_app01.qxd 12/5/02 1:04 PM Page 161

growth achieved by the region in the 1990s.Improvement in macroeconomic managementin a number of countries throughout the1990s, albeit emanating from crises, shouldprovide the basis for a good investor climate.This has already encouraged FDI into the re-gion at the fastest pace of all regions, eventhough this has been due partly to privatiza-tion of public enterprises and mergers and ac-quisitions. The next wave of FDI is likely to bein greenfield activities, as witnessed in CostaRica’s attracting high-tech firms. Regulationand supervision of financial sectors have beenstrengthened since the early 1990s, but thereremains room for further improvement. Poten-tial gains from global trade have increasedwith trade liberalization during the 1990s,leading to high and rising ratios of trade toGDP (Chile, Mexico, the Caribbean Commu-nity and Common Market, and other smalleconomies are examples). Moreover, the re-gion has been proactive in deepening trade in-tegration, especially with North America,through negotiations to establish a Free TradeAssociation of the Americas (FTAA) and bilat-eral agreements (Chile and Central Americawith the United States).
At the same time, the region remains morevulnerable than many other developing re-gions. First, a high debt overhang from the1980s remains a problem to finance in manycountries. In the 1990s, some countries con-tinued to rely on significant debt financing,particularly in the public sector. Public debt-to-GDP ratios rose in some countries and thematurity of that debt shortened in duration,increasing their vulnerability to shifts in in-vestor sentiment as they question debt sustain-ability. LAC countries may have to learn tolive with less debt in the future, adjusting pub-lic expenditures as required. Countries need tocreate fiscal space during good times (boomyears) to be able to conduct countercyclicalpolicies in future downswings in economicactivity. Second, many countries, especially thelow-income coffee producers, also need tofurther diversify their export base to reducevulnerability to large swings in commodity
prices. Finally, the region still lags in financialdeepening (which could help raise nationalsaving rates), infrastructure, and quality ofinstitutions—areas that need to be improvedbefore the region can attain high sustainablegrowth rates.
Europe and Central Asia
Recent developments
The slack external environment, espe-cially in Western Europe, is contribut-ing to a general slowdown of growth
in most of the countries of the Europe andCentral Asia (ECA) region in 2002 relative to2001. However, the region has weathered therecent global economic downturn relativelywell, largely because of fairly strong domesticdemand throughout most ECA countries, andsustained high oil prices to the benefit of theoil-exporting Commonwealth of IndependentStates (CIS) countries. Whereas almost all ECAcountries are facing a moderation of growth in2002, Turkey is expected to post a recovery—a massive swing from the over 7 percent col-lapse in GDP that it posted in 2001—which israising the region’s average growth for theyear. As a consequence, aggregate growth forthe ECA region is projected to expand from anestimated 2.3 percent in 2001 to 3.6 percent in2002. Growth in the ECA region (excludingTurkey) is forecast to decelerate to 2.3 percentin 2002 from 2.9 percent in 2001.
The Central and Eastern European (CEE)countries, in particular, have been affected byweakening demand from Western Europe—their main export market—as well as by ex-change rate appreciation in many of the sub-region’s economies. As a result, export volumegrowth has slowed significantly, although itstill remains at impressive levels in a numberof countries (such as the Czech Republic,Hungary, and Poland), as they have increasedmarket penetration (see box 1.2 in chapter 1).Thus, the consequent drag on GDP is not ashigh as it might have been. Furthermore, eas-ing import volumes—which largely reflect
G L O B A L E C O N O M I C P R O S P E C T S 2 0 0 3
162
gep_app01.qxd 12/5/02 1:04 PM Page 162

high import intensity of exports in all of theCEEs—are helping to reduce the impact of theslowdown in export volumes. Strong domesticdemand, witnessed in most of the CEE coun-tries, is partially offsetting the loss in impetusto growth from the slowdown in the externalsector. Domestic demand has been generallysupported by lower inflation, easing interestrates, and expanding private consumption. Insome countries, fiscal policy has become moreexpansionary, notably in the Czech Republic,Hungary, and the Slovak Republic. Poland isthe main exception to this picture of relativelystrong domestic markets, with tight monetaryconditions, weak wage growth and recordunemployment rates translating into anemicdomestic demand. While inflationary pres-sures have generally been subsiding in the CEEsubregion, they remain significant (in doubledigits) in Romania, Turkey, and the FederalRepublic of Yugoslavia. Many of the CEEcountries continue to run relatively high cur-rent account deficits of above 4 percent, al-though sufficient external financing has beensustained. Continued significant FDI inflows,in particular, are helping to finance the currentaccount deficits, in addition to generally sup-porting domestic demand and regional growth.
Turkey remains a key question mark. Indica-tors for early 2002 point to a recovery, facili-tated in part by the new reform program,lower interest rates, and improved confidencerelative to 2001. However, uncertainty linkedto the continued implementation of the cur-rent economic program of the new govern-ment, as well as heightened political instabilityin the Middle East, could contain the buildinggrowth momentum, as interest rates havebegun to rise and market sentiment is becom-ing more cautious. Lowering interest rates re-mains important to achieving a sustainablepublic debt.
Relatively firm oil prices—fueling fiscallinkages in oil producers and bolstering intra-CIS trade—have sustained the recent recoveryin the CIS subregion, partially buffering itfrom the deterioration in external conditions.Nevertheless, given the moderation in externaldemand, exchange rate appreciation in anumber of countries (such as the Russian Fed-eration), and some easing in oil prices in thefirst half of 2002, growth is moderatingthroughout the CIS subregion. Hydrocarbonexporters—Azerbaijan, Kazakhstan, Russia,and Turkmenistan—in particular have experi-enced robust growth, although growth has
R E G I O N A L E C O N O M I C P R O S P E C T S
163
Jun.1999
Aug.1999
Oct.1999
Dec.1999
Feb.2000
Apr.2000
Jun.2000
Aug.2000
Oct.2000
Dec.2000
Feb.2001
Apr.2001
Jun.2001
Aug.2001
Oct.2001
Dec.2001
Feb.2002
Apr.2002
Oct.2002
Jun.2002
Aug.2002
Source: International Monetary Fund, International Financial Statistics.
0
5
15
10
25
20
�20
�15
�10
�5
Figure A1.5 German imports and CEECs exports in dollars, 1999–2002(3-month moving average, y/y percentage change)
CEEC-exports
German imports
gep_app01.qxd 12/5/02 1:04 PM Page 163

slowed significantly from 2001. Increased in-vestment in production capacity in the energysector has also supported economic activity inthese countries. Among the energy-importingCIS countries, other factors have contributedto the continued strong growth, including rel-atively good harvests in the Kyrgyz Republic(combined with increased gold production),Tajikistan (combined with increased alu-minum production), and Ukraine. Not onlybecause Russia represents the largest weight inthe subregion, but also because it represents amajor export market for many of the CIScountries (in addition to some of the CEEs),continued strong growth in Russia has alsosustained growth in the subregion. As in manyCEE countries, domestic demand has been un-derpinned in the CIS countries by falling infla-tion rates and lower interest rates. While in-flationary pressures have eased in all the CIScountries, they remain a source of concern insome cases, particularly in Belarus and Uzbek-istan. Inflation rates in Russia and Tajikistanare also expected to post in the double digitsin 2002, but at more moderate levels. Whileenergy-related receipts boosted revenues, fis-cal positions remained relatively prudent inthe energy-exporting CIS countries, althoughthey became somewhat more expansionaryin Azerbaijan and Kazakhstan. To providefor budgetary smoothing, Azerbaijan andKazakhstan have created national funds forwindfall oil rents. With the decline in energyprices posted in 2001 (in both real and nomi-nal terms) from the spike posted in 2000, thefiscal surplus in Russia narrowed, although re-cent firming in oil prices should contribute tosome stabilization of budget receipts for 2002over 2001. In other CIS countries, fiscal policyhas been more expansionary, in general, gen-erating widening deficits (for example, inUkraine). Throughout the CIS subregion, cur-rent account surpluses (for instance, in Russiaand Ukraine) are narrowing and deficits (inmost of the remaining CIS economies) arewidening somewhat, because of exchange rateappreciation, rising imports, and, until morerecently, moderating oil export earnings.
Russia’s current account surplus has nar-rowed, although it remains very large.
Near-term outlookGrowth in the CEE countries is expected tobegin increasing again in 2003, assuming afirming of European Union (EU) import de-mand in 2003, which is projected to strengthensignificantly in 2004. For Turkey, assuming rel-ative political stability and the continued pur-suit of the current reform program by the newgovernment, the recovery is expected to be sus-tained in 2003. Growth in the CEE subregionis forecast to accelerate from 2.3 percent in2002 to 3.1 percent and 4.3 percent in 2003and 2004, respectively. As the EU accessionprocess moves forward, it is expected that thefirst round of new members in particular willcontinue to receive significant FDI inflows (inaddition to EU transfers), which will remain animportant source of external finance and un-derpin long-term growth.1 While a number ofimportant hurdles remain—linked in particu-lar to the negotiations on the existing commonagricultural policy (CAP), on the EU’s budget,and on transfers to new member countries—the process is still on schedule.2 Growth is ex-pected to slow in the CIS subregion (throughfiscal and trade linkages) through 2004, as-suming significant declines in oil prices in both2003 and 2004 (from a projected $25 per bar-rel in 2002 to a forecast of $23 per barrel and$20 per barrel in 2003 and 2004, respectively).CIS GDP is forecast to decline from a pro-jected 4.4 percent in 2002 to 3.5 percent andto 3 percent in 2003 and 2004, respectively.While Russia’s current account is expected toremain in surplus over the near term, it isforecast to narrow markedly as energy pricessoften. In 2003 and 2004, growth is expectedto average 3.4 percent and 3.6 percent, respec-tively, for the ECA region as a whole.
Long-term prospectsIn the CEE, during the second decade of tran-sition, a number of factors are expected tocontribute to stronger growth than postedduring the previous decade. These include
G L O B A L E C O N O M I C P R O S P E C T S 2 0 0 3
164
gep_app01.qxd 12/5/02 1:04 PM Page 164

higher investment rates and ongoing restruc-turing of the capital base. Continued improve-ments in the policy environment, includinggreater macroeconomic stability, are expectedto underpin the projected higher growth rates.The EU accession process and coming mem-bership will continue to act as an anchor forstructural reforms and will help attract signif-icant inflows of FDI. While structural reformsare being pursued in many CIS countries, ingeneral, implementation is not as advancedor as widespread as in the CEE subregion’seconomies, and in some cases there is signif-icant resistance to structural reforms. Thisimplies lower long-run growth in comparison.The recent boom in hydrocarbon rents hasprovided an impetus to growth, facilitated theintroduction of a number of reforms in manyof the oil-exporting countries, and contributedto an increase in investment outlays (particu-larly in the energy sector). However, giventhe volatility of energy market prices, theseeconomies will not be able to sustain recently
achieved higher growth rates until diversifica-tion from energy becomes much more broadlybased. Given the degree of energy dependencein many of the CIS economies, particularlyRussia, the projected softening of oil prices—to an average nominal price of about $18to $19 per barrel for the 2005–10 period, inthe underlying forecast—implies a ratchetingdown of the subregion’s growth from recenthigh rates.
RisksWeaker than anticipated recovery in the EUarea would reduce external demand for re-gional economies, particularly for the CEEcountries, and thus translate into lowergrowth. In many CEE countries high currentaccount deficits could become an importantdownside risk for international credit, if FDIinflows suddenly dry up (which a pronounceddelay in the EU accession process couldtrigger). For CIS hydrocarbon exporters,which are highly dependent on energy prices,
R E G I O N A L E C O N O M I C P R O S P E C T S
165
Table A1.4 Europe and Central Asia forecast summary(percent per year)
Baseline forecast
Growth rates/ratios 1991–2000 2000 2001 2002 2003 2004 2005–15
Real GDP growth �1.7 6.6 2.3 3.6 3.4 3.6 3.6Private consumption per capita 0.2 9.1 1.5 4.8 4.0 3.8 3.7GDP per capita �1.9 6.4 2.2 3.5 3.3 3.5 3.5
Population 0.2 0.1 0.1 0.1 0.1 0.1 0.1Gross domestic investment/GDPa 23.6 22.1 21.9 20.6 20.8 21.2 28.6Inflationb 128.0 9.8 7.0 3.2 5.8 5.7 …Central gvt. budget balance/GDP �4.4 �5.4 �6.5 �6.2 �6.0 �5.5 …Export market growthc 10.7 12.9 6.7 2.1 6.4 8.1 …Export volumed 9.4 10.9 8.8 6.4 8.2 7.5 …Terms of trade/GDPe 0.0 �1.6 3.0 �2.5 �1.3 0.1 …Current account/GDP �2.3 �4.9 �1.8 �2.4 �2.4 �2.3 …Memorandum itemsGDP growth: transition countriesf �2.6 6.4 4.6 3.5 3.3 3.5 …
Central and Eastern Europef 0.6 3.8 2.9 2.3 3.1 4.3 …CIS �4.4 8.4 5.9 4.4 3.5 3.0 …
… Not available.a. Fixed investment, measured in real terms.b. Local currency GDP deflator, median.c. Weighted average growth of import demand in export markets.d. Goods and nonfactor services.e. Change in terms of trade, measured as a proportion to GDP (percentage).f. Excluding Turkey.Source: World Bank baseline forecast, November 2002.
gep_app01.qxd 12/5/02 1:04 PM Page 165

a sharper decline in oil prices than forecastposes a significant downside risk. In Russia, asa consequence, a more rapid decline in growththan projected would result in lower externaldemand for a number of the other economiesof the CIS and of some CEEs (that is, theBaltic states). Greater political uncertainty ora reversion from the reform program inTurkey could undermine its fledgling recoveryand result in much lower than anticipatedgrowth—and affect some of its trade partners(including Bulgaria). Some of the poorest CIScountries (Georgia, the Kyrgyz Republic, andTajikistan) have relatively high external debt(up to 200 percent of exports), placing them atrisk of default if growth does not materializeas anticipated and external assistance is notforthcoming. Greater political instability andheightened tensions in the Middle East couldprove destabilizing to economic (and political)positions in the neighboring ECA countries,particularly in Turkey and in some of thesouthern-tier CIS countries. Aside from poten-tially undermining tourism revenues, therecould be trade disruptions and a general rise inthe perception of risks in the region leading tohigher interest rates.
Sub-Saharan Africa
Recent developments
Sub-Saharan Africa was not immune tothe chilling effects of the global recession.The slowdown may have been less pro-
nounced there than elsewhere, but the collapsein world trade and steep declines in commod-ity prices had a depressing effect on economicperformance. Services exports, primarilytourism, were further affected by the Septem-ber 11 terrorist attacks. In real terms, GDPgrowth slowed from 3.2 percent in 2000 to2.9 percent in 2001 and 2.5 percent in 2002.With the exception of Nigeria, oil exportersgenerally outpaced the region, especially thosewhere production was increasing—Angola,Equatorial Guinea, Sudan—as oil prices,though down from 2001, remained relatively
strong. Meanwhile, countries where severedrought put a damper on agricultural pro-duction fared worse and, as usual, the worstoutturns were to be found in countries experi-encing civil and political strife. But slowdownwas widespread throughout the region.
The subdued economic performance in2002 is attributable to the region’s export de-pendence on European markets, where growthwas weak. As a result, exports remained basi-cally stagnant in real terms. On the plus side,there was a turnaround in non-oil commod-ity prices, albeit from historically depressedlevels. After reaching a low in October 2001,non-energy commodity prices reboundedsharply, gaining 26 percent in export weightedterms by August 2002. The main contributorwas cocoa, which was up 80 percent, but othercommodities gained as well—robusta coffeeup by 20 percent, cotton up by 33 percent,copper by 7 percent, and gold by 10 percent.Because the upward momentum began late inthe year, on an annual basis many commodityprices exhibited declines in 2002, and most re-main well below peak levels of the mid-1990s.Nevertheless, modest real price gains over themedium term will deliver a measure of reliefto external balances. Oil prices, too, remainedstronger than expected, an outcome that,though unwelcome to non-oil exporters, wasa positive benefit to the region as a whole.
The disappointing results for tourism,which accounts for 11 percent of regional ex-port receipts, reflected not only the weaknessof Europe’s economy, but the aftermath ofSeptember 11. Some important destinations—such as Mauritius, which benefits from its rep-utation as a safe destination—saw an increasein the flow of arrivals in 2002. Most othercountries, however, only partially recoveredfrom the impact of September 11. Accordingto estimates by the World Travel and TourismCouncil (WTTC),3 Sub-Saharan travel andtourism exports slowed to just 1.5 percentgrowth in 2001 before recovering to 4.3 per-cent in 2002. Both years represent growth sig-nificantly below potential. The WTTC esti-mates September 11 to have cost 3.2 percent
G L O B A L E C O N O M I C P R O S P E C T S 2 0 0 3
166
gep_app01.qxd 12/5/02 1:04 PM Page 166

of exports and 1.3 million jobs over the period2001–02.
In the domestic sphere, agricultural pro-duction was disrupted by drought and, in thecase of Zimbabwe, political disturbances. Asa result, nearly 30 million persons were leftin need of emergency food aid. Approximatelyhalf of them were in southern Africa, whichexperienced a second successive year of poorharvests. Malawi, Zambia, and Zimbabwewere most affected, and because agricultureconstitutes a large share of their economies,incomes and consumption spending were de-pressed. But Ethiopia suffered the worst, withdrought putting at risk an estimated 15 mil-lion persons. However, the effects were quitelocalized. South Africa experienced a bumpermaize harvest, which gave a strong boost todomestic spending.
South Africa sustained a recovery throughthe first half of 2002, with broad-basedstrength in agriculture, as well as in export-oriented mining and manufacturing, whichbenefited from the rand’s weakness. On the
expenditure side, domestic demand grew at a2.3 percent annual pace in the first half, re-flecting buoyant fixed investment, strong pri-vate consumption, and a moderately expan-sionary fiscal stance, though weak inventoryaccumulation slowed the pace. In the external
R E G I O N A L E C O N O M I C P R O S P E C T S
167
02001 2002 2003 2004
1
2
3
4
5
Source: World Bank staff estimates.
Figure A1.6 Real GDP growth ofSub-Saharan Africa oil and non-oilexporters(percent)
Oil
Non-oil
Table A1.5 Sub-Saharan Africa forecast summary(percent per year)
Baseline forecast
Growth rates/ratios 1991–2000 2000 2001 2002 2003 2004 2005–15
Real GDP growth 2.2 3.2 2.9 2.5 3.2 3.8 3.7Private consumption per capita �0.6 �1.4 0.7 0.3 0.8 1.3 1.2GDP per capita �0.4 0.7 0.5 0.1 0.9 1.5 1.5
Population 2.6 2.5 2.4 2.4 2.3 2.3 2.2Gross domestic investment/GDPa 16.9 17.9 18.7 18.9 18.6 18.2 21.1Inflationb 9.8 6.3 5.4 4.3 3.9 4.2 …Central gvt. budget balance/GDP �3.0 �0.6 �0.3 �0.4 �0.5 �0.3 …Export market growthc 14.4 10.8 0.1 2.4 7.1 7.8 …Export volumed 4.1 4.3 2.8 1.1 5.3 5.8 …Terms of trade/GDPe 0.0 2.1 �1.1 �1.5 0.2 �0.8 …Current account/GDP �2.1 �2.3 �2.2 �3.0 �1.8 �1.2 …Memorandum itemsGDP growth: SSA excluding South Africa 2.7 3.3 3.6 2.7 3.7 4.2 …
Oil exporters 2.5 4.8 4.4 2.0 3.6 3.8 …CFA countries 2.6 2.3 3.2 2.9 3.3 3.8 …
… Not available. SSA is Sub-Saharan Africa. CPA is Communaute Financiere Africaine.a. Fixed investment, measured in real terms.b. Local currency GDP deflator, median.c. Weighted average growth of import demand in export markets.d. Goods and nonfactor services.e. Change in terms of trade, measured as a proportion to GDP (percentage).Source: World Bank baseline forecast, November 2002.
gep_app01.qxd 12/5/02 1:04 PM Page 167

accounts, tourism has been slow to recoverfrom the effects of September 11, but theweaker rand boosted net visibles trade, andthe current account balance moved back into asmall surplus. The main concern for the SouthAfrican economy was an uptick in inflation—not surprising after a nearly 40 percent depre-ciation of the rand in 2001, but neverthelessputting upward pressure on interest rates.Robust wage gains were only partially offsetby higher productivity, resulting in a substan-tial rise in unit labor costs. Nevertheless, indi-cations are that monetary restraint will prevail,and the outlook is for inflation to ease. Therand stabilized at an average of 10.9 againstthe dollar in the first three quarters of the year,after weakening to above 12 in late 2001.
In Nigeria, adherence to reduced Organi-zation of Petroleum Exporting Countries(OPEC) quotas more than offset the impact ofstronger-than-expected oil prices, while bud-get gridlock constrained government spend-ing, resulting in a real GDP decline estimatedat 0.6 percent from 2001. Unfortunately, thestrength of oil revenues may have also relievedpressure to implement urgently needed struc-tural reforms, as evidenced by the discontinu-ation of the informal monitoring arrangementwith the IMF. Politically, the situation remainstense. Local elections have been postponedtwice, and national elections are now sched-uled for April 2003. President Obasanjo hascome under strong pressure by the NationalAssembly on budgetary issues. If oil prices de-crease, as expected in the near term, Nigeria’sproblems will mount, though there are indica-tions that these problems may be offset bya significant medium-term expansion of theenergy sector, consistent with expected OPECpolicies. The United States is particularlyinterested in expanding oil purchases fromNigeria in an effort to diversify sources ofsupply to decrease dependence on the MiddleEast.
Near-term outlookThe forecast calls for growth to accelerate in2003–04 on the strength of a pickup in exter-
nal performance. Overall, the forecast antici-pates real growth rising to 3.2 percent in 2003and 3.8 percent in 2004, around 1.1 percent inper capita terms. Faster growth in Europe willboost export volumes, and price trends willremain broadly favorable as supply-demandbalances for most commodities tighten withthe recovery in the world economy. Cocoa, al-ready at a 15-year high, is the main exception.Oil prices are expected to ease, though theyremain significantly above late-1990s lows.While large, real price gains for commoditiesimportant to Sub-Saharan Africa are unlikelyto be sustained in the medium term, the wide-spread introduction of structural reforms andmarket liberalization are expected to raiseexport competitiveness, and the region shouldremain a significant commodity supplier forthe foreseeable future. On balance, with im-port price inflation remaining low, non-oilexporters’ terms of trade are forecasted tostrengthen marginally in 2003–04.
Along with a modest improvement in ex-ternal sectors, the forecast assumes a strongerdomestic performance. The expectation is fora return to more normal weather conditions,which will underpin a recovery of agricultureand consumption spending, while fastergrowth stimulates a cyclical upturn in invest-ment. Overall, domestic demand will remainthe primary source of GDP growth, as risingimport demand—constrained mainly by theavailability of financing—holds net exports incheck. Indeed, current account balances areexpected to narrow marginally as foreign di-rect investment eases back from recent levelswith a slowdown in privatization offeringssuch as Air Madagascar, though at the sametime more favorable economic conditionsoverseas should have a positive impact onremittances.
For the region’s oil producers, weaker ex-port prices will be offset by higher production.Major new offshore developments are sched-uled to come onstream in the Gulf of Guinea(Angola, Equatorial Guinea, and Nigeria)over the next few years, and despite the fallin prices oil sectors should remain highly
G L O B A L E C O N O M I C P R O S P E C T S 2 0 0 3
168
gep_app01.qxd 12/5/02 1:04 PM Page 168
profitable. As in the past, however, moregeneral spillovers to non-oil sectors will berelatively muted. As a result, growth of oilproducers will improve from 2 percent in2002 to 3.6 percent in 2003 and 3.8 percent in2004. Falling terms of trade will widen cur-rent account deficits, though oil prices areexpected to remain comparatively strong,above $20 per barrel, containing the pressureon external performance and fiscal accounts.
Long-term prospectsThe forecast anticipates per capita growth av-eraging 1.5 percent over the 2005–15 period,near the levels achieved in the mid-1990s. Theoutlook is optimistic—such a result would sig-nify a reversal of the region’s long-term histor-ical decline—but even so growth will fall shortof what is needed to reduce poverty andachieve the Millennium Development Goals.Sub-Saharan Africa will continue to lag behindother developing regions, and by 2015 thenumber of persons living on less that $1 perday is forecasted to rise by nearly 30 percent,from 315 million to 404 million.
The outlook is predicated on a continuationof broad trends toward better standards ofgovernance and economic policies. The greatmajority of countries in the region have begunpreparing Poverty Reduction Strategy Papers,and nine are in different stages of implemen-tation of the strategies. Early results seempromising. At the same time, NEPAD (the NewPartnership for Africa’s Development) andother regional initiatives are enhancing thecredibility of governments and strengtheningintraregional cooperation. There has beenencouraging progress as well toward resolvingintractable conflicts in central Africa, eventhough events in Côte d’Ivoire, Madagascar,and Zimbabwe underscore the fragility ofthe region’s political processes. Improved pol-icy environments should stimulate faster pro-ductivity growth and diversification fromagriculture, and reduce export dependence onprimary commodities.
These internal developments, coupled withmodest improvements in the external environ-
ment, will promote diversification, encouragehigher savings and investment, and stimulateproductivity growth. Despite a dismal overallrecord, the region boasts a number of exem-plary performers (Botswana and Mauritius)and cases in which policy reform has pro-duced dramatic turnarounds (Ethiopia,Mozambique, Tanzania, and Uganda). At thesame time, a panoply of deep-rooted problemswill continue to plague economic perfor-mance. There are no quick solutions to lowlevels of human and physical capital, poorinfrastructure, HIV/AIDS, civil strife and neg-ative perceptions of international investors,and excessive export specialization will con-tinue to expose external sectors to high pricevolatility. Nevertheless, if the new realism thatappears to be taking hold on the continentproves to be more than just rhetoric, there isadequate reason to believe the moderate im-provement in overall performance that theforecast anticipates can be achieved.
Middle East and North Africa
Recent developments
Despite a continuation of high oilprices, growth in the Middle East andNorth Africa (MENA) region slowed
in 2002 to 2.5 percent, down from 3.2 percentin 2001 as the events of September 11, 2001,continue to reverberate throughout the region.
For the oil-exporting countries, growth re-mained above 2 percent. The larger increasesin growth that might have been expectedfrom both high oil prices and increased publicexpenditures were offset by a slowdown inproduction and exports, a result of tightenedOPEC quotas put into place in 2001 to sup-port higher oil prices. To counter these effects,some oil exporters have implemented expendi-ture programs financed with increased oil rev-enues. In the absence of a strong private in-vestment response to the reform program ithad implemented, Algeria, for example, put afour-year economic recovery program in placeworth about 10 percent of 2001 GDP, aimed at
R E G I O N A L E C O N O M I C P R O S P E C T S
169
gep_app01.qxd 12/5/02 1:04 PM Page 169

supporting growth in domestic demand whileenhancing social and economic infrastructure.
Diversified exporters faced worsening con-ditions in 2002, with GDP growth falling to2.2 percent, a decline of 2 percent from 2001.External factors leading to this decline includethe deterioration in export market growth forEgypt, Morocco, and Tunisia, as well as sharpdeclines in the tourism sector in North Africaand the several countries in the Levant, fol-lowing the events of September 11, 2001. InEgypt, the number of tourists fell 41 percentyear-on-year in the last quarter of 2001, andeven by the end of the first half of 2002,tourism had not yet returned to precrisis lev-els. In Morocco, tourist arrivals were down byover 20 percent in the first half of 2002. Forsome countries in the region, however, thedeclines in tourism from abroad have beenpartially offset by MENA nationals divertingtheir tourism to within the region. Touristreceipts may likely show an even larger declinethan tourist numbers, as many firms in thetourist sectors have discounted heavily. Ex-ports to the EU have also suffered, in particu-lar Moroccan textiles and electronics exportsto the EU. Jordan has been somewhat insu-lated from this situation, as its export demandfrom India and the United States continued togrow quite strongly in 2002.
Internal factors have also contributed toa decline in growth in several countries. The
positive agricultural growth of 2001 inMorocco slowed down somewhat in 2002because of the less favorable weather condi-tions. To prevent a potentially steep increasein the current account deficit, fiscal and mon-etary policies were tightened in Tunisia; thisaction contained domestic demand pressuresand reduced pressures on external balancebut exacerbated the impact of the slowdownstemming from the external shocks. Thoughtourism has begun to recover gradually inEgypt, the recovery of the private sector hasbeen hampered by unresolved problems withthe exchange rate regime, which have theirroots in the late 1990s.
Short-term prospectsGrowth prospects for MENA are clearly con-tingent upon whether military actions aretaken in the region. Assuming that there is noconflict over the next year (and thus that thereis a gradual resumption in confidence in theregion), the region’s growth is forecast at3.7 percent for 2003–04. A recovery would beexpected for both oil-exporting countries anddiversified exporters. The public expenditureprograms being implemented by oil-exportingcountries over the next several years to im-prove infrastructure, agriculture, and supportreforms in social sectors would help to increasethe public sector’s contribution to growth.Growth is expected to average 3.6 percent
G L O B A L E C O N O M I C P R O S P E C T S 2 0 0 3
170
Figure A1.8 Export volume growth(percent) (percent)
�2
6420
8101214
01
2000 2001 2002 2003 2004
2345678
Source: World Bank staff estimates.
Export growth
Export market growth (right axis)
Figure A1.7 Oil prices and currentaccounts(dollars/barrel) (billions of dollars)
50
10
2015
3025
4035
15
2000 2001 2002 2003 2004
17
19
21
23
25
27
29
Source: World Bank staff estimates.
Oil prices
Current account
gep_app01.qxd 12/5/02 1:04 PM Page 170
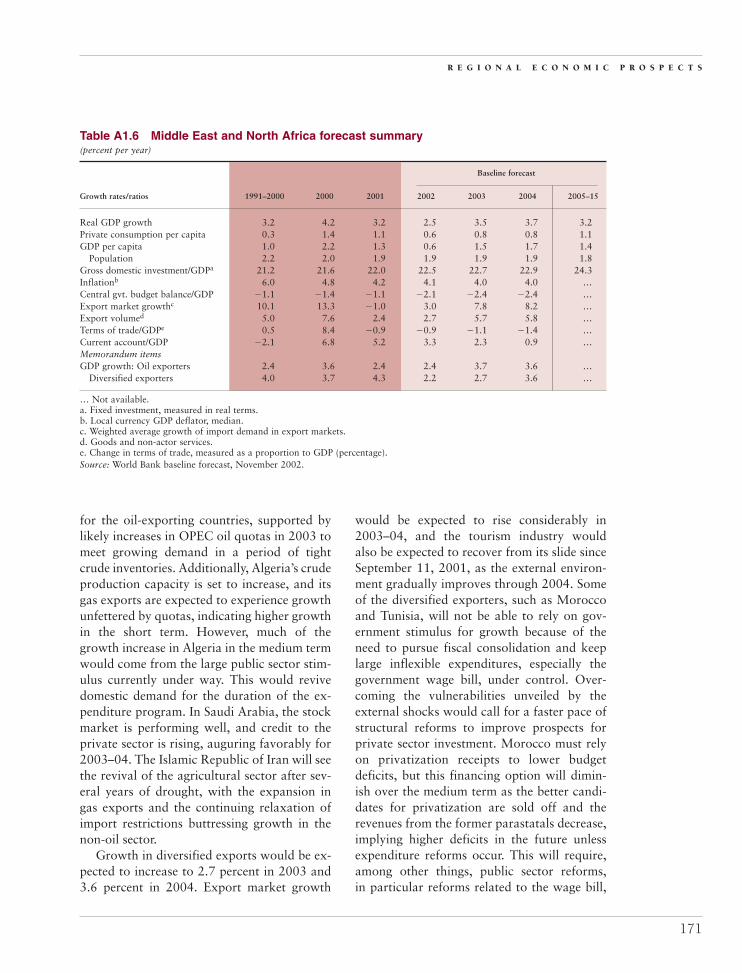
for the oil-exporting countries, supported bylikely increases in OPEC oil quotas in 2003 tomeet growing demand in a period of tightcrude inventories. Additionally, Algeria’s crudeproduction capacity is set to increase, and itsgas exports are expected to experience growthunfettered by quotas, indicating higher growthin the short term. However, much of thegrowth increase in Algeria in the medium termwould come from the large public sector stim-ulus currently under way. This would revivedomestic demand for the duration of the ex-penditure program. In Saudi Arabia, the stockmarket is performing well, and credit to theprivate sector is rising, auguring favorably for2003–04. The Islamic Republic of Iran will seethe revival of the agricultural sector after sev-eral years of drought, with the expansion ingas exports and the continuing relaxation ofimport restrictions buttressing growth in thenon-oil sector.
Growth in diversified exports would be ex-pected to increase to 2.7 percent in 2003 and3.6 percent in 2004. Export market growth
would be expected to rise considerably in2003–04, and the tourism industry wouldalso be expected to recover from its slide sinceSeptember 11, 2001, as the external environ-ment gradually improves through 2004. Someof the diversified exporters, such as Moroccoand Tunisia, will not be able to rely on gov-ernment stimulus for growth because of theneed to pursue fiscal consolidation and keeplarge inflexible expenditures, especially thegovernment wage bill, under control. Over-coming the vulnerabilities unveiled by theexternal shocks would call for a faster pace ofstructural reforms to improve prospects forprivate sector investment. Morocco must relyon privatization receipts to lower budgetdeficits, but this financing option will dimin-ish over the medium term as the better candi-dates for privatization are sold off and therevenues from the former parastatals decrease,implying higher deficits in the future unlessexpenditure reforms occur. This will require,among other things, public sector reforms,in particular reforms related to the wage bill,
R E G I O N A L E C O N O M I C P R O S P E C T S
171
Table A1.6 Middle East and North Africa forecast summary(percent per year)
Baseline forecast
Growth rates/ratios 1991–2000 2000 2001 2002 2003 2004 2005–15
Real GDP growth 3.2 4.2 3.2 2.5 3.5 3.7 3.2Private consumption per capita 0.3 1.4 1.1 0.6 0.8 0.8 1.1GDP per capita 1.0 2.2 1.3 0.6 1.5 1.7 1.4
Population 2.2 2.0 1.9 1.9 1.9 1.9 1.8Gross domestic investment/GDPa 21.2 21.6 22.0 22.5 22.7 22.9 24.3Inflationb 6.0 4.8 4.2 4.1 4.0 4.0 …Central gvt. budget balance/GDP �1.1 �1.4 �1.1 �2.1 �2.4 �2.4 …Export market growthc 10.1 13.3 �1.0 3.0 7.8 8.2 …Export volumed 5.0 7.6 2.4 2.7 5.7 5.8 …Terms of trade/GDPe 0.5 8.4 �0.9 �0.9 �1.1 �1.4 …Current account/GDP �2.1 6.8 5.2 3.3 2.3 0.9 …Memorandum itemsGDP growth: Oil exporters 2.4 3.6 2.4 2.4 3.7 3.6 …
Diversified exporters 4.0 3.7 4.3 2.2 2.7 3.6 …
… Not available.a. Fixed investment, measured in real terms.b. Local currency GDP deflator, median.c. Weighted average growth of import demand in export markets.d. Goods and non-actor services.e. Change in terms of trade, measured as a proportion to GDP (percentage).Source: World Bank baseline forecast, November 2002.
gep_app01.qxd 12/5/02 1:04 PM Page 171

that underlie high expenditures. Weaknesseswill remain in the private sectors of severalcountries. Jordan is weathering the downturnmore successfully than other countries be-cause of the high demand for its exports inIndia and the United States, but weak con-sumer demand and subdued rates of lendingto the private sector indicate that domesticweakness will continue. Egyptian private sec-tor activity is weak, reflecting credit condi-tions and tight monetary policy (althoughthe recent 100 basis point fall in the discountrate to 10 percent will help somewhat); fallingbank earnings in 2002 indicate that privatesector investment will remain sluggish in theshort term. In the current policy context, thegovernment will continue expansionary fiscalpolicy despite already high deficits and willput off the implementation of reforms thatmight have the potential for high social costs.
Recent political events obviously cast ashadow over prospects in the region. The con-tinuing uncertainty stemming from the poten-tial actions against Iraq would significantlyaffect the gradual recovery in the short-termforecast. Oil exporters would benefit fromincreased quotas and higher oil prices initially,but these impacts would probably be shortlived. Diversified exporters would suffermore, particularly from declines in thetourism industry. Even the expectations sur-rounding military action within the regioncould significantly affect growth in the shortterm. Moreover, the effects of military actionon confidence in already fragile global capitalmarkets may lead to increased spreads and aflight to quality, particularly from countries inthe region close to the field of war.
Long-term prospectsEven if relatively stronger growth perfor-mance is managed in the short term, growth inthe long term is expected to average just over3.2 percent.
The policy environment affecting long-termgrowth is gradually improving in many coun-tries in the region, albeit at a gradual pace.
Jordan is reaping the benefits of a more opentrade regime, and many of the North Africancountries are pressing ahead with more liberaltrade relations. However, budget deficits inthese countries could lead to problems, partic-ularly in those countries that rely heavily onprivatization revenues to finance increased ex-penditures. The temporary nature of receiptsfrom privatization makes reforms in publicexpenditures (and the public sector policiesthat underlie them) and taxation of para-mount importance in the future. Furthermore,many of the Mediterranean countries are cur-rently facing sluggish growth or stagnation inthe private sector, with low levels of growth inprivate investment. This indicates the need forstrengthening the investment climate and re-moving bottlenecks in access to finance andbackbone productive inputs that hamper pri-vate sector investment. In Egypt, long-termprospects appear weak. The policy reformagenda has slowed, mirroring the slowdownin the domestic economy. The current policymix includes an expansionary fiscal policy tocounter the tight monetary policy necessaryto support the exchange rate.
In the oil-exporting countries, Iran has uni-fied its exchange rate, allowed the formationof private banks, reaffirmed its commitmentto privatization, and is pushing ahead withfiscal reforms. Algeria is considering thederegulation of the power industry and open-ing the sector to private investment, and hasannounced the privatization of public compa-nies. In Saudi Arabia, customs tariffs havebeen reduced to pave the way for a customsunion with the Gulf Cooperation Council in2003, negotiations are under way with theWTO, and new legislation is being preparedto increase competition in domestic capital,labor, and insurance markets. However, manyof these changes are occurring very gradually,and some are being greatly delayed. Algeriahas not pushed ahead with its announced pri-vatizations, and reform in the power sector isvery slow. Many of the oil-exporting countriesin the region still have large and inefficient
G L O B A L E C O N O M I C P R O S P E C T S 2 0 0 3
172
gep_app01.qxd 12/5/02 1:04 PM Page 172

public sectors, and low rates of private invest-ment in the non-hydrocarbon sectors. Re-forms in these sectors leading to efficiencygains and higher potential growth rates will berequired.
In the long term, the region has to continueto address several obstacles. The region reliesvery heavily on a narrow range of externalrevenue sources, particularly oil, remittances,and tourism, and this reliance introduces thepotential for vulnerability in export earnings.Although several countries have adjustednominal exchange rates in recent years, fixedexchange rate regimes in several countriesmay adversely affect export competitivenessand offset gains made from trade and customsreforms. Receipts from tourism and remit-tances are vulnerable to the sluggish incomegrowth in source countries and recurringpolitical conflicts and potential military actionin the region. Oil revenue windfalls are usu-ally temporary, and real long-term oil pricesare expected to decline, particularly after
2005–06, when Caspian oil production is ex-pected to come onstream.
Notes1. At both the June 2002 summit in Seville and
October 2002 summit in Brussels, the EuropeanCommunity (EC) confirmed that eight of the ECA EUaccession candidate countries (the Czech Republic,Estonia, Hungary, Latvia, Lithuania, Poland, theSlovak Republic, and Slovenia) are on track to con-clude accession negotiations at the end of 2002 andto sign formal accession treaties in 2003. The officialtarget is for enlargement to happen in time for themid-2004 European Parliament elections. Bulgaria andRomania are at an earlier stage in the accession pro-cess and are expected to accede somewhat later. Turkeyis also an accession candidate, although it has yet tobegin formal negotiations.
2. Following the forthcoming EC Copenhagen sum-mit in mid-December 2002, the existing 15 EU membercountries’ national parliaments will vote to approve orreject enlargement.
3. WTTC. 2002. The Impact of Travel and Tourismon Jobs and the Economy—2002. http://www.wttc.org.
R E G I O N A L E C O N O M I C P R O S P E C T S
173
gep_app01.qxd 12/5/02 1:04 PM Page 173

Crude oil prices increased about 3 percentin 2002 as a result of tight supplies andMiddle East tensions. Non-oil prices in-
creased about 5 percent, led by a 9 percent in-crease in agricultural commodities, which morethan offset a 4 percent decline in metals andminerals (figure A2.1). Uncertainty about thestrength of the global economic recovery con-tributed to the decline in metals and mineralprices, but the effect of uncertainty on agri-cultural prices was offset by lower supplies ofselected commodities, such as grains andoilseeds, because of drought. The weakness inthe U.S. dollar supported commodity prices.
Crude oil prices are expected to remainfirm in early 2003 because of the potential formilitary action against Iraq and tight supplyconditions resulting from production restrainton the part of the Organization of PetroleumExporting Countries (OPEC). Once MiddleEast tensions ease, oil prices are expected todecline because non-OPEC oil supplies will in-crease and Iraqi oil will return to the market.The average price of crude oil is projectedto decline from $25 per barrel in 2002 to$23 per barrel in 2003. By 2005, crude oil pricesare projected to decline to $19 per barrel.
Non-oil prices are in the early stages ofprice recovery. That recovery is expected tolast about three years before nominal prices willbegin to weaken. The strength of the globaleconomic recovery will strongly influence thetiming and strength of the recovery in metalsand mineral prices. However, the recovery of
agricultural prices will be more strongly influ-enced by supply increases and by recentweather disturbances such as El Niño anddroughts. The index of nominal non-oilcommodity prices is projected to increase by5.8 percent in 2003 and by nearly 8 percent by2005 in real terms. (Specific forecasts for com-modity price and price indexes for 2002, 2003,2005, 2010, and 2015 in current and constantdollars are given in tables A2.13–A2.15 laterin this appendix.)
Agricultural commodity prices appear tohave reached a cyclical low, after decliningsince mid-1997, and by 2005 nominal pricesare expected to increase about 13 percent over2002 levels. The increases will leave nominalprices of most agricultural commodities wellbelow 1997 highs. Prices of specific agricul-tural commodities have declined much morethan the average decline because of large sup-ply increases, weak demand, or both. Some ofthose prices are not expected to recover to1997 levels for the foreseeable future. Becauseof large supply increases from Vietnam andBrazil and because of slow growth in demanddespite low prices, robusta coffee prices, forexample, have fallen to nominal lows not seensince the 1960s. In 2002, cotton prices fell tonominal levels, which were last seen in 1986and the mid-1970s. Palm oil prices declinedby more than half from 1998 to 2002 andreached nominal levels last seen in 1986.
In real terms,1 robusta coffee prices fell85 percent from 1980 to 2001, and cotton
175
Appendix 2Global Commodity Price Prospects
gep_app02.qxd 12/5/02 12:52 PM Page 175
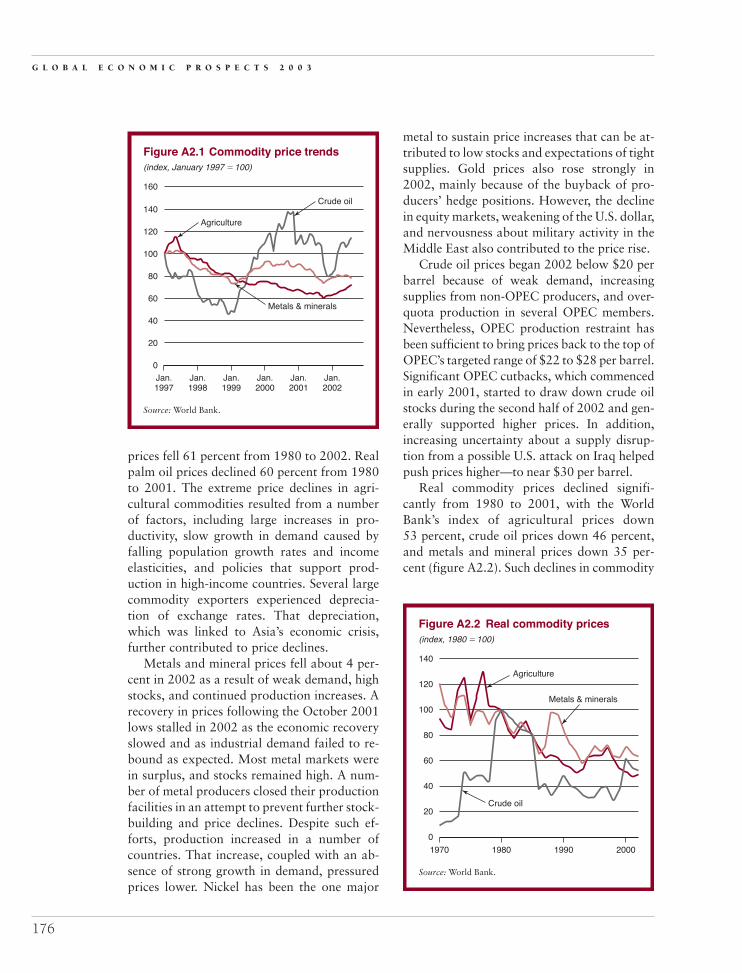
prices fell 61 percent from 1980 to 2002. Realpalm oil prices declined 60 percent from 1980to 2001. The extreme price declines in agri-cultural commodities resulted from a numberof factors, including large increases in pro-ductivity, slow growth in demand caused byfalling population growth rates and incomeelasticities, and policies that support prod-uction in high-income countries. Several largecommodity exporters experienced deprecia-tion of exchange rates. That depreciation,which was linked to Asia’s economic crisis,further contributed to price declines.
Metals and mineral prices fell about 4 per-cent in 2002 as a result of weak demand, highstocks, and continued production increases. Arecovery in prices following the October 2001lows stalled in 2002 as the economic recoveryslowed and as industrial demand failed to re-bound as expected. Most metal markets werein surplus, and stocks remained high. A num-ber of metal producers closed their productionfacilities in an attempt to prevent further stock-building and price declines. Despite such ef-forts, production increased in a number ofcountries. That increase, coupled with an ab-sence of strong growth in demand, pressuredprices lower. Nickel has been the one major
metal to sustain price increases that can be at-tributed to low stocks and expectations of tightsupplies. Gold prices also rose strongly in2002, mainly because of the buyback of pro-ducers’ hedge positions. However, the declinein equity markets, weakening of the U.S. dollar,and nervousness about military activity in theMiddle East also contributed to the price rise.
Crude oil prices began 2002 below $20 perbarrel because of weak demand, increasingsupplies from non-OPEC producers, and over-quota production in several OPEC members.Nevertheless, OPEC production restraint hasbeen sufficient to bring prices back to the top ofOPEC’s targeted range of $22 to $28 per barrel.Significant OPEC cutbacks, which commencedin early 2001, started to draw down crude oilstocks during the second half of 2002 and gen-erally supported higher prices. In addition,increasing uncertainty about a supply disrup-tion from a possible U.S. attack on Iraq helpedpush prices higher—to near $30 per barrel.
Real commodity prices declined signifi-cantly from 1980 to 2001, with the WorldBank’s index of agricultural prices down53 percent, crude oil prices down 46 percent,and metals and mineral prices down 35 per-cent (figure A2.2). Such declines in commodity
G L O B A L E C O N O M I C P R O S P E C T S 2 0 0 3
176
Source: World Bank.
Figure A2.1 Commodity price trends(index, January 1997 �100)
20
0
40
60
80
100
160
120
140
Jan.2002
Jan.2001
Jan.2000
Jan.1999
Jan.1998
Jan.1997
Agriculture
Crude oil
Metals & minerals
Source: World Bank.
Figure A2.2 Real commodity prices(index, 1980 �100)
0
20
40
60
80
100
140
120
2000199019801970
Crude oil
Metals & minerals
Agriculture
gep_app02.qxd 12/5/02 12:52 PM Page 176

prices, relative to manufactures prices, posereal challenges for developing countries thatdepend on primary commodities for a sub-stantial share of their export revenues. The de-clines are expected to continue in the longerterm as productivity increases in commoditiescontinue to outpace those in manufactures.
Agriculture
Agricultural commodity prices are expectedto increase about 9 percent in 2002 after
falling 9 percent in 2001. The increase followssharp declines from 1997 to 2001 that reducedthe World Bank’s index of annual agriculturalprices by 38 percent. Prices are expected to in-crease 13 percent from 2002 to 2005 in nomi-nal terms. That increase will recover a littlemore than one-third of the 1997–2001 decline.The recovery of prices is expected to be mod-est because of weak growth in demand, con-tinued rapid increases in production andproductivity, and high stocks in some com-
modities, such as coffee, cotton, and sugar.Real prices will rise an estimated 11 percentfrom 2002 to 2015. However, the rise in realprices is a reflection of current low pricesrather than a change in the long-term trend ofdeclining prices relative to manufactures.
There has been considerable disparityamong commodities: prices of some com-modities (cocoa) reached multiyear highs in2002, while others (coffee and cotton) haverecently reached new lows or continue todecline. The disparity is related partly to thedifferent levels of carryover stocks, and partlyto the effects of weather conditions on supply.Droughts in Australia, Canada, and theUnited States reduced yields and contributedto increases in grain and oilseed prices.
The United States enacted a new farm bill,which will be in effect from 2002 to 2007. Thebill raised price supports for many commodi-ties and included some commodities that hadnot previously been included under govern-ment programs (see box A2.1). The European
G L O B A L C O M M O D I T Y P R I C E P R O S P E C T S
177
On May 13, 2002, the United States enacted a newfarm bill, the Farm Security and Rural Invest-
ment Act of 2002. The new bill covers a six-yearperiod, from 2002 to 2007. Low commodity priceshad led to a series of annual bailouts to supplementregular subsidy programs under the previous law. Thenew farm bill essentially extends those temporarybailouts through the six-year life of the bill.
The key features of the new farm bill are higherprice supports for major crops, the revival of targetprices to give more subsidies to producers whenworld prices fall, and a large increase in conservationprograms. The bill continues fixed annual paymentsto grain and cotton farmers. It creates a new targetprice system similar to the one abolished in 1996,to provide supplemental payments when prices fallbelow certain levels—except that acreage set-asidesare no longer necessary for farmers to qualify forpayments under the new bill. It allows farmers toupdate planting records that are used in calculatingcertain program payments. The bill also establishes
Box A2.1 U.S. Farm Billnew subsidies for dairy farmers as well as for pro-ducers of lentils, chickpeas, peanuts, honey, wool,and mohair. It expands the Conservation ReserveProgram, which pays farmers to let environmentallysensitive land stand idle, and it establishes a newConservation Security Program to pay crop farmersfor improved environmental practices.
Under the 1994 Uruguay Round Agreement onAgriculture, the United States agreed to limit spend-ing on domestic agricultural support programs, whichare considered trade distorting, to $19.1 billion peryear. Since payments are not fixed, but are deter-mined by the levels of market prices as well as the lev-els of support, it is not possible to know whether pay-ments under the new farm bill will exceed the agreedlimit. If it appears that this limit will be met orexceeded, the U.S. Congress has instructed the U.S.Department of Agriculture (USDA) to take steps toreduce payments so as not to exceed this limit.
Source: Bank staff.
gep_app02.qxd 12/5/02 12:52 PM Page 177

G L O B A L E C O N O M I C P R O S P E C T S 2 0 0 3
178
President Chirac of France and Chancellor Schroederof Germany reached a budget agreement on the
Common Agriculture Policy (CAP) in BrusselsOctober 26–27, 2002. The agreement limits CAPbudgets to increases of 1 percent annually from 2006to 2013 from an estimated budget of 45.6 billioneuros in 2006. Total direct and indirect support toE.U. agriculture was estimated at 117.9 billion eurosin 2001 by the OECD; more than half of that supportcomes from higher food prices paid by consumers.
Participants in the Brussels summit proposedthat agricultural support to new E.U. accessioncountries increase from 25 percent of currentmember-support levels when those countries join in2004 to 40 percent in 2007 and parity by 2013. Theagreement puts a limit on CAP spending increaseseven after the 10 accession countries join in 2004,a limit that could necessitate CAP reforms as theaccession countries’ support levels increase or thatcould require shifting of funds from farmers incurrent member countries.
Box A2.2 E.U. Common Agricultural PolicyE.U. Agriculture Commissioner Franz Fischler
had proposed radical CAP reforms in July 2002 inthe Midterm Review of Agenda 2000. The reformswould shift income support away from productionof surpluses and toward meeting of tough environ-mental, animal welfare, and food safety standards.According to the proposal, E.U. farmers would geta single decoupled payment based on historicalreferences—regardless of whether they continueproduction on the same scale. Direct spending onfarmers would be cut by 3 percent per year overseven years, and the savings would be spent on ruraldevelopment. Aid to large farms would be capped.This proposal has proved controversial, and severalEuropean states have indicated their opposition tochanging the current system.
Sources: Agra Europe Ltd., London and European Commission. Information about the Common Agricultural Policy can befound on the European Union Web site:http://europa.eu.int/pol/agr/index_en.htm.
Union reached an agreement that limits futurebudget increases for the Common AgriculturalPolicy through 2013 (see box A2.2).
BeveragesThe World Bank’s index of beverage prices(comprising coffee, cocoa, and tea prices)increased about 17 percent in 2002, largelybecause of a 70 percent increase in cocoaprices. In contrast, coffee and tea pricesremained weak. The sharp increase in cocoaprices reflects production problems and therecent coup attempt in Côte d’Ivoire, a majorproducer of cocoa. The weakness in coffeeprices can be attributed to large stocks, weakdemand, and large production increases bymajor exporters. Tea prices declined as a re-sult of abundant supplies and weak growth indemand.
Coffee. Coffee prices fell to record lows andbecame the most visible symbol of the declinesin agricultural commodity prices during 2002.
In real terms, coffee prices are currently lessthan one-third of their 1960 level. The declinereflects mostly the surge in supplies, but theequally important longer-term problem isweak demand. According to the U.S. Depart-ment of Agriculture (USDA), per capita annualcoffee consumption in the major importingcountries has been stagnant, at about 4.5 kilo-grams of green coffee equivalent, during thepast decade.
Global coffee production in the 2002–03season is expected to increase 10.7 percentfrom last season’s 110.7 million bags(table A2.1). Brazil, the dominant producerwith one-third of global output, is expected toproduce a record 46.9 million bags, whileColombia and Vietnam, the second and thirdlargest producers, will each reach about 10 mil-lion bags.
A number of unsuccessful attempts havebeen made to arrest the price decline. TheAssociation of Coffee Producing Countries,which has urged coffee producers to join its
gep_app02.qxd 12/5/02 12:52 PM Page 178

export retention scheme for the past three sea-sons, ceased operating on February 1, 2002.A plan backed by the International CoffeeOrganization, which called for removal of low-quality coffee beans from the market, was notwell supported by some coffee-producing coun-tries because it did not compensate producersof low-quality beans. A number of countrieshave also undertaken their own price-supportschemes or stock-holding mechanisms. Brazil,for example, has subsidized put options toeffectively guarantee a minimum price to pro-ducers. While such schemes may be partiallysuccessful in the short run, they could exacer-bate the oversupply problem in the long run.
We project a recovery in both robusta andarabica prices in 2003 and a further recoveryin arabica in 2004. Nevertheless, we recognizethe risk that it may take longer for the recov-ery to materialize if the recent supply surgepersists. Over the long term, real coffee pricesare expected to recover, but they will remainwell below the historical highs of the 1970sand more recent highs of the 1990s. By 2015,real arabica and robusta prices are projectedto increase about 75 percent from the 2002levels. Prices would still be about only half oftheir 1990s peaks.
Cocoa. Cocoa prices led the recovery of agri-cultural commodity prices, after falling to athree-decade low in February 2000. Since then,cocoa prices have more than doubled to a 16-year high amid supply disruption in majorproducers from political instability and fromproducers’ responses to extremely low prices.
Production in two major producers, Côted’Ivoire and Ghana, is estimated to be down4 percent and 2 percent, respectively, in thejust-ending 2001–02 marketing season. Theextreme price increases in response to suchrelatively small changes in output were partlycaused by speculative buying by commodityfunds. In addition, uncertainty about the relia-bility of supplies prompted strong demandfrom processors.
Cocoa prices are expected to remain attheir 2002 level next year. They will decline12 percent in 2004 as production continuesto increase. This forecast is based on the as-sumptions that (a) the strong prices enjoyedthis season have already given incentives togrowers to maintain their trees and to increaseproduction; (b) part of the recent surge inprices may have been caused by speculativeactivities of a short-term nature that are un-likely to be carried over into the next year;and (c) the recent coup attempt in Côted’Ivoire has been repelled.
In response to high prices, growth in de-mand for cocoa in the current and next mar-keting season is expected to slow from the1990–2000 average of 2.4 percent. But itshould then return to historical growth rates(table A2.2). By 2015, real prices are projectedto decline 25 percent from 2002 levels.
Tea. The three-auction average tea price fell6 percent in 2002 as supplies continued to in-crease relative to demand and stocks remainedhigh (table A2.2). Production in major ex-porters (India, Kenya, and Sri Lanka) was up
G L O B A L C O M M O D I T Y P R I C E P R O S P E C T S
179
Table A2.1 Coffee production in selected countries(million bags)
1997–98 1998–99 1999–2000 2000–01 2001–02 2002–03
Brazil 22.8 35.6 30.8 34.1 33.7 46.9Colombia 12.2 10.9 9.5 10.5 11.0 10.9Côte d’Ivoire 3.7 2.2 5.7 4.3 3.3 3.3Indonesia 7.8 6.9 6.7 6.5 6.0 5.8Mexico 5.1 5.0 6.2 4.8 4.7 5.2Vietnam 6.9 7.5 11.0 15.3 12.3 10.5World 96.4 108.4 113.3 117.0 110.7 122.6
Source: U.S. Department of Agriculture.
gep_app02.qxd 12/5/02 12:52 PM Page 179

4 percent in 2001—the last year for whichdata are available. Other exporters, such asChina and Vietnam, have also been increasingexports rapidly, and such increases could fur-ther weaken prices.
Prices are projected to increase modestlyfrom the 2002 lows (up 3 percent in 2003), butthey will remain depressed relative to the highsin 1997 and 1998. If emerging exporters, suchas Vietnam, continue to increase exports, thereis a significant risk that prices could continueto fall. However, higher petroleum exportprices in the Russian Federation and in majorconsuming countries in the Middle East havehistorically supported demand, and we expecttea prices to begin a gradual recovery. By 2005,we project nominal tea prices to rise 10 percentfrom 2002 levels, which would leave nominalprices down 20 percent from 1997 levels.
FoodThe index of food prices has not changed forseveral years after declining sharply during1997–99 (figure A2.3). The index rose about4 percent in 2002 and is expected to rise 7 per-cent in 2003 and 2 percent in 2004 because ofhigher grain and oilseed prices following thisyear’s drought in major grain- and soybean-
exporting countries. By 2015, real prices shoulddecline about 2 percent from 2002 levels.
Fats and oils. Prices of fats and oils recov-ered 13 percent in 2002 after falling 40 per-cent from 1997 to 2001. The increase wasgreatest in vegetable oils such as palm oil (up35 percent) and coconut oil (up 30 percent)
G L O B A L E C O N O M I C P R O S P E C T S 2 0 0 3
180
Table A2.2 Global balance for beverages
Annual growth rate (%)
1970 1980 1990 1999 2000 2001 1970–80 1980–90 1990–00
Coffee (thousand bags)Production 64,161 86,174 88,849 113,345 117,049 110,773 2.11 1.36 1.20Consumption 71,536 79,100 96,300 104,670 106,580 108,450 1.01 1.97 0.22Exports 54,186 60,996 76,163 92,256 89,968 88,788 0.78 2.41 1.68
Cocoa (thousand tons)Production 1,554 1,695 2,506 3,073 2,812 2,750 0.46 4.62 1.16Grindings 1,418 1,556 2,335 2,967 3,014 2,823 0.16 4.48 2.58Stocks 497 675 1,791 1,341 1,111 1,101 2.38 13.89 �4.66
Tea (thousand tons)Production 1,286 1,848 2,516 2,900 2,960 3,030 4.09 2.87 1.49Exports 752 859 1,132 1,259 1,330 1,389 2.35 2.39 1.62
Notes: Time reference for coffee (production and exports) and cocoa are based on crop year shown under the year thatproduction begins: October to September for cocoa and April to March for coffee. Coffee consumption and tea data are basedon the calendar year.Sources: International Coffee Organization (ICO), International Cocoa Organization (ICCO), Food and Agriculture Organization(FAO) of the United Nations, International Tea Committee (ITC), U.S. Department of Agriculture, and World Bank.
Source: World Bank.
Figure A2.3 Food prices(index, 1990 �100)
70
80
90
100
110
130
120
Jan.2002
Jan.2000
Jan.2001
Jan.1999
Jan.1998
Jan.1997
gep_app02.qxd 12/5/02 12:52 PM Page 180

because of lower production. Meal prices re-mained weak, with soymeal down 3 percentbecause of weak demand for livestock andpoultry feeds. Prices of most fats and oils areexpected to increase during 2003–05, and theindex of prices is expected to increase 13 per-cent in nominal terms from 2002 to 2005.
Global production of the major fats andoils is expected to increase about 2 percentin 2002–03, while consumption is expectedto increase by 3.2 percent, causing stocks todecline and prices to continue increasing. Palmand soybean oil production is the largest amongthe vegetable oils. Together they represent40 percent of total vegetable oil production.World soybean production is expected to re-main constant in 2002 because of drought inthe United States, after growing by 5.3 percentper year since 1990. This stoppage in growthhas led to higher soybean prices and reducedstocks in 2002 and is expected to supporthigher prices in 2003. Other major producers(table A2.3) are expected to increase soybeanproduction despite economic problems and un-certainties.
Palm oil production has more than doubledsince 1990 (table A2.4), with the largest in-creases coming from Indonesia and Malaysia.However, production is expected to increase amore modest 2 percent in 2002–03.
Grains. World grain stocks, relative to use,are expected to fall significantly during thecurrent crop year (table A2.5), and the declinesare expected to keep grain prices rising through2003. Prices should then decline as production
increases in response to price increases. Thereis a risk that grain prices could continue to riseeven more sharply than projected if thedrought continues in the major exportingcountries, or if other major grain producershave lower-than-expected production. Wheatprices are projected to rise an additional19 percent in nominal terms by 2003 afterincreasing nearly 20 percent in 2002. Prices arethen expected to decline 6 and 12 percent in2004 and 2005, respectively, as productionresponds to the higher prices. Maize prices rose12 percent in 2002 and are expected to rise anadditional 25 percent by 2003 before decliningin 2004 and 2005. Rice prices rose 11 percentin 2002 and are expected to rise an additional22 percent by 2005.
Stocks in the major grain exporting coun-tries—the United States, the European Union,Canada, Australia, and Argentina—are ex-pected to fall to the lowest level in 2003–03,relative to total use, since 1997–98. The de-cline is mostly attributable to the droughtsin the United States, Canada, and Australia,which are expected to reduce grain yields by 9,
G L O B A L C O M M O D I T Y P R I C E P R O S P E C T S
181
Table A2.3 Soybean production(million tons)
Year Argentina Brazil United States World
1990 11.5 15.8 52.4 104.11995 12.4 24.2 59.2 124.92000 27.8 39.0 75.1 175.12001 29.5 43.5 78.7 183.72002 30.0 48.0 71.5 183.3
Note: Argentina, Brazil, and the United States account forabout 80 percent of global production.Source: U.S. Department of Agriculture.
Table A2.4 Palm oil production(million tons)
Year Indonesia Malaysia World
1990–91 2.41 6.10 11.031995–96 4.22 7.81 15.222000–01 7.53 11.94 23.542001–02 8.20 11.65 23.982002–03 8.50 11.82 24.53
Source: Oil World.
Table A2.5 Global grain stocks-to-use(percentages, excluding China)
Year Maize Rice Wheat Total grains
1997–98 10.1 8.8 17.0 13.11998–99 11.5 9.6 18.6 14.01999–2000 11.4 11.5 17.7 13.72000–01 11.5 12.9 19.0 14.32001–02 10.1 13.7 21.1 15.12002–03 6.0 10.9 19.9 12.71990s low 6.0 7.8 13.9 9.7
Source: U.S. Department of Agriculture.
gep_app02.qxd 12/5/02 12:52 PM Page 181

7, and, 6 percent, respectively, in 2002–03compared with yields in the previous year. AnEl Niño weather pattern has contributed to theunfavorable weather pattern in Australia andcould further reduce production next year.2
The lower yields in the United States, Canada,and Australia have been partially offset byrecord grain yields and production in theEuropean Union. Economic problems inArgentina have contributed to lower produc-tion and exports from that country, but thelargest effect of the economic turmoil is ex-pected to be in the next crop year, because mostof the planting and input-use decisions hadalready been made before the economic crisisfully emerged.
Grain production in developing countriesis projected to be down 1.8 percent in2002–03, with production generally strong inAsia, Latin America, and the Middle East, butlower in Eastern Europe and Russia. Produc-tion in China is expected to be up 2.3 percent,while production in India is expected to bedown 4.9 percent because of a poor monsoonseason.
There is considerable variation in the stocksituation in individual grains, with the globalstocks-to-use percentage for maize at the low-est levels of the 1990s, while rice and wheatpercentages are above previous lows. How-ever, grain prices are highly correlated, andprice increases in one grain would normallybe reflected in the prices of others. Highergrain prices would benefit developing-countrynet exporters such as Argentina (which isexpected to export more than 22 million tonsof grain in 2002–03) while harming net im-porters such as Mexico and the Arab Republicof Egypt, which are expected to import 13 mil-lion and 10 million tons of grain, respectively,in 2002–03.
Sugar. Sugar prices fell to 15 cents per kilo-gram in 2002 (down 21 percent from 2001) toreturn to the lower end of the trading range of10–30 cents per kilogram of the past 20 years.The decline follows an estimated 5 percent in-crease in world sugar production in the mar-
keting year that just ended in August, and anincrease in carryover stocks to nearly 50 per-cent of annual consumption. Brazil, the largestexporter, is expected to have a sugar cane cropthat could exceed the previous year’s crop by8 or 9 percent. Imports are expected to beweak because of large production in import-ing countries. Hence, prices are unlikely torecover significantly in 2003.
Brazil has nearly 30 percent of the exportshare in recent years and has been the primarysource of increased global exports, with pro-duction and exports growing rapidly in thepast decade (figure A2.4). The other majorexporters, Australia and Thailand, increasedproduction by 50 and 70 percent, respectively,from 1990–91 to 1997–98, when sugar priceswere attractive. However, they have cut pro-duction as prices have declined.
Sugar prices are expected to begin to re-cover in 2004 as low prices reduce globalsupplies. However, prices are expected to re-main relatively weak for the next several years,with fluctuations depending on the year-to-year balance of production and consumption.By 2005, nominal sugar prices are expectedto increase 17 percent over 2002 levels. In thelong term, nominal prices are expected toreturn to the center of the trading range,and real prices are expected to average about18 cents per kilogram (8.2 cents per pound).
G L O B A L E C O N O M I C P R O S P E C T S 2 0 0 3
182
Source: U.S. Department of Agriculture.
01990 1992 1994 1996 1998 2000 2002
5
10
15
20
25
35
30
40
Figure A2.4 Sugar exports(million tons, raw equivalent)
Rest of world
Brazil
gep_app02.qxd 12/5/02 12:52 PM Page 182

The global balances for major foods aregiven in table A2.6. The balances show that therate of growth of production and consumptionof grains has slowed during the 1990s com-pared with previous decades, while growthrates have increased for soybeans and sugar.The growth rates for fats and oils were rela-tively constant during the 1980s and 1990s.
Agricultural raw materialsThe index of agricultural raw materials prices(comprising prices of tropical hardwoods,cotton, and natural rubber) declined sharplyduring Asia’s economic crisis and then sta-bilized before declining again as suppliesof commodities continued to increase (fig-ure A2.5). Prices reached a low in 2001 andhave since recovered because of higher cottonand natural rubber prices. Nominal prices areprojected to increase 16 percent by 2005 from
2002 levels, while real prices are projected torise 18 percent by 2015 over 2002 levels.
Cotton. Cotton prices declined an additional5 percent in 2002 after declining 19 percent in2001 because of large production increases inthe United States and China, the two largestproducers (table A2.7). Prices in 2002 wereless than half of their 1995 highs, and theyreached 30-year nominal lows. The extremeprice weakness was caused by a number offactors, such as slow growth in demand, largeproduction, and competition from syntheticfibers. Subsidies to cotton producers in theUnited States and China have contributed tothe production surplus. During the past threeseasons, U.S. support to its cotton producersaveraged almost $3 billion, and China’s sup-port averaged $2 billion.
Cotton production in the coming season isexpected to be 19.2 million tons—10 percent
G L O B A L C O M M O D I T Y P R I C E P R O S P E C T S
183
Table A2.6 Global balance for foods
Annual growth rates (%)
1970 1980 1990 1999 2000 2001 1970–80 1980–90 1990–2000
Grains (million tons)Production 1,079 1,430 1,769 1,871 1,839 1,860 2.88 1.55 1.04Consumption 1,114 1,451 1,717 1,869 1,868 1,890 2.58 1.78 1.02Exports 119 212 206 245 233 231 6.35 0.13 0.94Stocks 193 309 490 529 500 470 7.24 3.83 �0.56
Soybean (thousand tons)Production 42,133 62,173 104,093 159,904 175,098 183,724 6.84 1.87 5.08Consumption 45,968 68,052 104,307 160,541 172,166 184,228 6.53 2.04 4.99Exports 12,342 20,822 25,388 46,683 55,074 57,127 5.24 0.80 2.88Stocks 3,394 10,266 20,569 27,908 30,803 30,218 13.83 �0.66 0.20
Sugar (thousand tons [raw equivalent])
Production 70,919 84,742 109,403 138,094 143,220 136,111 2.80 1.59 3.26Consumption 65,395 91,062 106,807 130,281 133,104 134,712 3.30 1.40 3.00Exports 21,931 27,571 34,078 38,710 42,015 38,495 3.26 0.83 3.12Stocks 19,614 19,494 19,299 31,702 35,939 35,474 3.96 �0.77 4.52
Fats and oils (million tons)Production 39.78 58.09 80.84 113.42 117.09 119.42 3.68 3.54 3.70Consumption 39.82 56.80 80.87 111.98 116.94 120.74 3.55 3.69 3.64Exports 8.83 17.76 26.89 35.55 38.10 39.57 7.05 4.19 3.39Stocks 5.18 9.25 12.15 14.26 14.47 13.19 7.09 2.44 0.69
Note: Time references for grains, soybeans, and sugar are based on marketing years, shown under the year in which productionbegins, and they vary by country. For fats and oils, crop years begin in September.Source: U.S. Department of Agriculture and Oil World.
gep_app02.qxd 12/5/02 12:52 PM Page 183
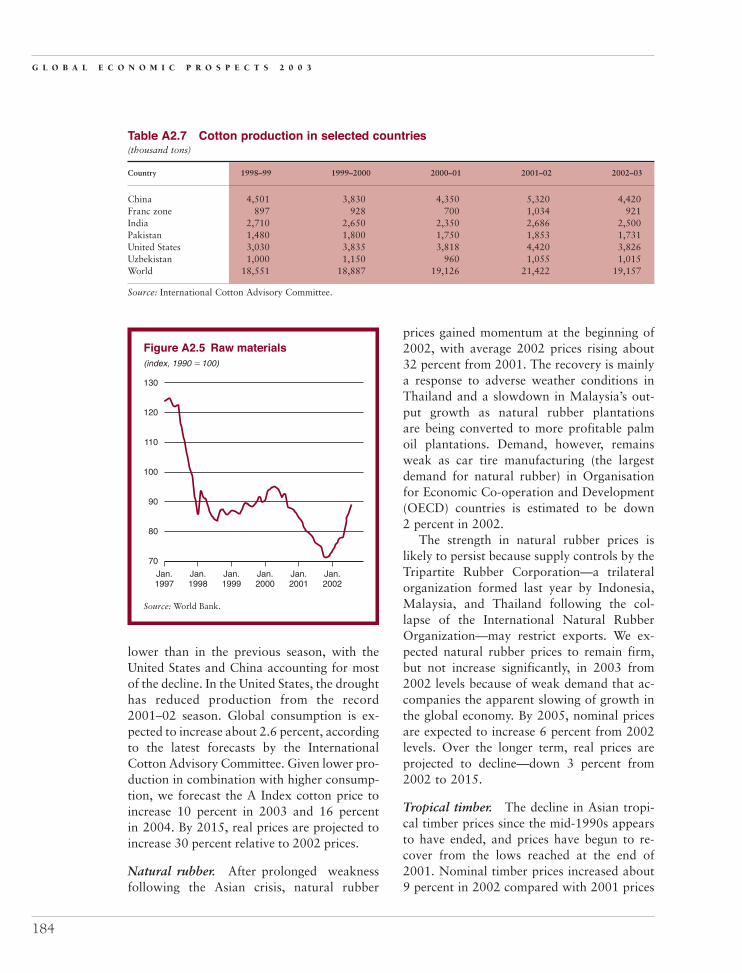
G L O B A L E C O N O M I C P R O S P E C T S 2 0 0 3
184
Table A2.7 Cotton production in selected countries(thousand tons)
Country 1998–99 1999–2000 2000–01 2001–02 2002–03
China 4,501 3,830 4,350 5,320 4,420Franc zone 897 928 700 1,034 921India 2,710 2,650 2,350 2,686 2,500Pakistan 1,480 1,800 1,750 1,853 1,731United States 3,030 3,835 3,818 4,420 3,826Uzbekistan 1,000 1,150 960 1,055 1,015World 18,551 18,887 19,126 21,422 19,157
Source: International Cotton Advisory Committee.
Source: World Bank.
Figure A2.5 Raw materials(index, 1990 �100)
70
80
90
100
110
130
120
Jan.2002
Jan.2000
Jan.2001
Jan.1999
Jan.1998
Jan.1997
lower than in the previous season, with theUnited States and China accounting for mostof the decline. In the United States, the droughthas reduced production from the record2001–02 season. Global consumption is ex-pected to increase about 2.6 percent, accordingto the latest forecasts by the InternationalCotton Advisory Committee. Given lower pro-duction in combination with higher consump-tion, we forecast the A Index cotton price toincrease 10 percent in 2003 and 16 percentin 2004. By 2015, real prices are projected toincrease 30 percent relative to 2002 prices.
Natural rubber. After prolonged weaknessfollowing the Asian crisis, natural rubber
prices gained momentum at the beginning of2002, with average 2002 prices rising about32 percent from 2001. The recovery is mainlya response to adverse weather conditions inThailand and a slowdown in Malaysia’s out-put growth as natural rubber plantationsare being converted to more profitable palmoil plantations. Demand, however, remainsweak as car tire manufacturing (the largestdemand for natural rubber) in Organisationfor Economic Co-operation and Development(OECD) countries is estimated to be down2 percent in 2002.
The strength in natural rubber prices islikely to persist because supply controls by theTripartite Rubber Corporation—a trilateralorganization formed last year by Indonesia,Malaysia, and Thailand following the col-lapse of the International Natural RubberOrganization—may restrict exports. We ex-pected natural rubber prices to remain firm,but not increase significantly, in 2003 from2002 levels because of weak demand that ac-companies the apparent slowing of growth inthe global economy. By 2005, nominal pricesare expected to increase 6 percent from 2002levels. Over the longer term, real prices areprojected to decline—down 3 percent from2002 to 2015.
Tropical timber. The decline in Asian tropi-cal timber prices since the mid-1990s appearsto have ended, and prices have begun to re-cover from the lows reached at the end of2001. Nominal timber prices increased about9 percent in 2002 compared with 2001 prices
gep_app02.qxd 12/5/02 12:52 PM Page 184

as a result of the improved demand fromJapan, the weakening of the U.S. dollarrelative to the yen, and the continued strongimport demand from China. Prices are ex-pected to continue to recover in 2003 and2004, with annual average increases of 8 per-cent per year, resulting from improved eco-nomic growth in Asia. African sapelli log priceshave declined less than Asian log prices, asdemand has remained firm in Europe. Sapellinominal log prices are expected to increaseabout 5 percent from 2002 to 2005.
Real tropical timber prices are expected torecover from lows, but they are not expectedto reach new highs during the forecast periodto 2015. By 2015, real meranti log prices areprojected to rise 47 percent, while sapelli logprices are projected to rise by only 18 percent.The difference is due to the smaller decreaseand, therefore, smaller rebound of Africansapelli logs prices compared with Asian mer-anti log prices.
The global balances for raw materialsare given in table A2.8. The data show thatcotton production, consumption, and exports
slowed dramatically during the 1990s com-pared with the 1980s. Exports of cotton grewonly 0.2 percent during the 1990s, which con-tributed to the sharp price decline. Growthrates of natural rubber production, consump-tion, and exports remained nearly constantduring the 1990s compared with the 1980s.Tropical timber log production slowed whileproduction of sawnwood increased as timber-producing countries shifted to increased do-mestic processing. Sawnwood imports in-creased while plywood imports slowed duringthe 1990s compared with the 1980s.
Fertilizers
Fertilizer prices remained nearly constantin 2002 after several years of large adjust-
ments (figure A2.6). Import demand remainedweak because of low commodity prices andincreased local production. However, fertilizerproduction in major exporters contracted inresponse to low fertilizer prices. Hence, amarket balance was achieved with little pres-sure on prices. Acreage used for global grain
G L O B A L C O M M O D I T Y P R I C E P R O S P E C T S
185
Table A2.8 Global balance for raw materials
Annual growth rates (%)
1970 1980 1990 1999 2000 2001 1970–80 1980–90 1990–2000
Cotton (thousand tons)Production 11,740 13,832 18,970 19,126 19,408 21,422 1.2 3.1 0.8Consumption 12,173 14,215 18,576 19,796 19,762 20,070 1.1 3.1 0.2Exports 3,875 4,414 5,081 6,142 5,750 6,430 0.9 2.8 0.5Stocks 4,605 4,895 6,645 9,559 9,274 10,630 1.7 2.8 1.4
Natural rubber (thousand tons)Production 3,140 3,820 5,080 6,810 6,740 7,170 1.8 3.2 3.1Consumption 3,090 3,770 5,190 6,660 7,330 7,030 1.6 3.2 3.3Net exports 2,820 3,280 3,950 4,670 4,940 5,160 1.3 2.1 1.8Stocks 1,480 1,480 1,500 2,540 1,950 2,090 0.6 0.2 3.7
Tropical timber (thousand cubic meters)Logs, production 210 262 300 286 287 276 1.5 1.7 0.5Logs, imports 36.1 42.2 25.1 18.3 21.1 21.0 0.2 5.1 5.4Sawnwood, production 98.5 115.8 131.8 103.9 101.5 99.3 1.2 1.7 2.0Sawnwood, imports 7.1 13.2 16.1 21.2 24.3 23.5 5.0 2.6 3.3Plywood, production 33.4 39.4 48.2 52.6 55.4 54.9 1.2 2.0 0.5Plywood, imports 4.9 6.0 14.9 18.9 19.8 20.3 0.7 9.1 3.6
Notes: Time reference for cotton is based on the crop year beginning in August. For natural rubber and tropical timber, timerefers to the calendar year.Sources: International Cotton Advisory Committee, International Study Rubber Group, FAO, and World Bank.
gep_app02.qxd 12/5/02 12:52 PM Page 185

production, which accounts for more than halfof total fertilizer use, declined for the sixthconsecutive year in 2002, but it is expected toincrease in 2003 and 2004 in response to re-cent and expected grain price increases. Pro-duction capacity remains substantially largerthan demand for all major fertilizers, but it ismost extreme in potash, where surplus capac-ity may be as high as 30 percent of demand,according to industry estimates.
Nitrogen fertilizer prices (as represented byurea prices) were down about 2 percent in2002, as exports from major producers inEastern Europe fell because of rising naturalgas prices, currency changes that made ex-ports less profitable, and increased local fertil-izer demand. This fall was partially offset byreduced demand in major importing countriesas a result of low commodity prices and in-creased local fertilizer production. Urea pricesare expected to continue to increase becauseof higher grain prices and reduced exportsfrom Eastern Europe. By 2005, nominal ureaprices are projected to increase 36 percentfrom 2002, but then increases are expected toslow, and real prices should decline. By 2015,real urea prices are expected to remain 19 per-
cent above 2002 levels, as the industry contin-ues to rationalize and reduce surplus capacity.
Prices for potassium chloride (also knownas muriate of potash, or MOP) declined 5 per-cent in 2002 from weak demand and largesurplus capacity. Price declines could havebeen much larger without aggressive supplycontrols by major exporters. Increased domes-tic production in China is expected to weakenfuture import demand and, along with a largesurplus in global production capacity, to keepprice increases small, despite the increased usefor grain production, which accompanies therecovery in grain prices. By 2005, nominalMOP prices are projected to increase 10 per-cent from 2002 levels, and real prices are pro-jected to fall 6 percent by 2015 compared with2002 prices.
Triple super phosphate (TSP) prices in-creased 5 percent in 2002 after falling 27 per-cent from 1998 to 2001. Production fell in2001 in response to low prices, and importsdeclined slightly because of increased localproduction in China and India. Demandshould increase along with increased grainprices and area planted. Surplus capacity issmaller than for other major fertilizers and isexpected to decline over the next several years.This decline will cause nominal TSP prices toincrease by an estimated 13 percent by 2005.Real prices are projected to decline by 5 per-cent by 2015 from 2002 levels.
The large surplus of global production ca-pacity in the fertilizer industry is largely a resultof the sharp declines in consumption in formerSoviet bloc and Eastern European countriesfollowing the collapse of the former SovietUnion and the transition of those countriesto market economies. Many countries (suchas Russia and Ukraine) were left with largeproduction capacities and reduced domesticdemand—which led to export growth of nearly4 percent per year since 1993 from the formerSoviet Union. Those increased exports dis-placed traditional exports and depressed pricesof nitrogen and phosphate fertilizers. Globalfertilizer consumption fell about 17 percentfrom 1988 to 1993 and has only recently
G L O B A L E C O N O M I C P R O S P E C T S 2 0 0 3
186
Note: TSP � triple super phosphate; MOP � muriate ofpotash.Source: Fertilizer Week.
Figure A2.6 Fertilizer prices(dollars per ton)
0
20
40
60
80
120
100
200
160
180
140
200019951985 19901980
TSP
UreaMOP
gep_app02.qxd 12/5/02 12:52 PM Page 186
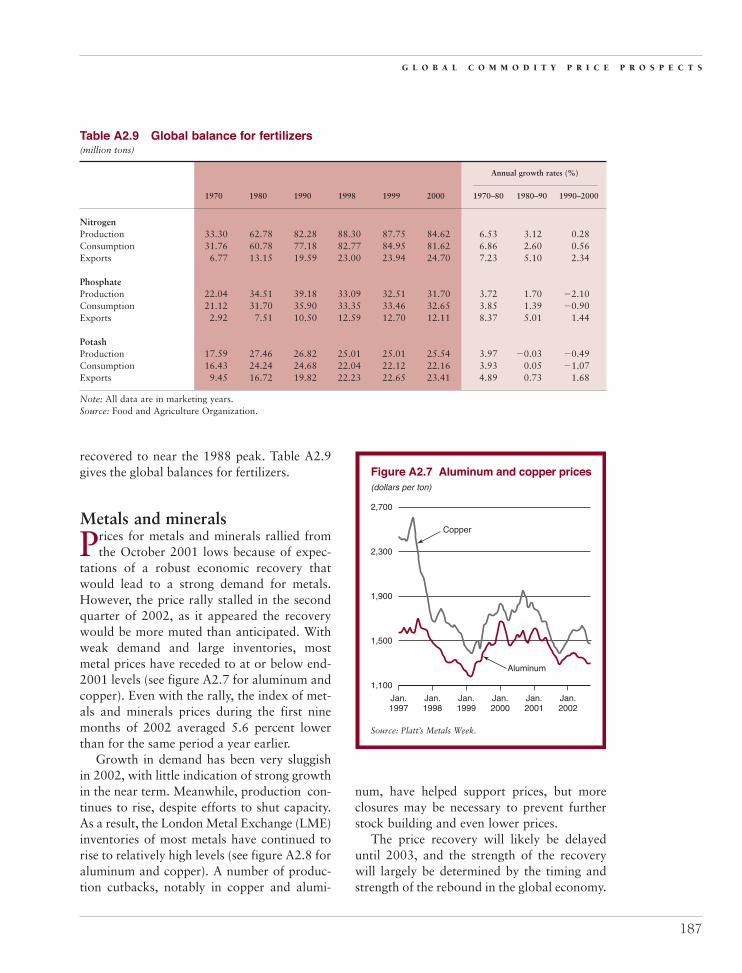
recovered to near the 1988 peak. Table A2.9gives the global balances for fertilizers.
Metals and minerals
Prices for metals and minerals rallied fromthe October 2001 lows because of expec-
tations of a robust economic recovery thatwould lead to a strong demand for metals.However, the price rally stalled in the secondquarter of 2002, as it appeared the recoverywould be more muted than anticipated. Withweak demand and large inventories, mostmetal prices have receded to at or below end-2001 levels (see figure A2.7 for aluminum andcopper). Even with the rally, the index of met-als and minerals prices during the first ninemonths of 2002 averaged 5.6 percent lowerthan for the same period a year earlier.
Growth in demand has been very sluggishin 2002, with little indication of strong growthin the near term. Meanwhile, production con-tinues to rise, despite efforts to shut capacity.As a result, the London Metal Exchange (LME)inventories of most metals have continued torise to relatively high levels (see figure A2.8 foraluminum and copper). A number of produc-tion cutbacks, notably in copper and alumi-
num, have helped support prices, but moreclosures may be necessary to prevent furtherstock building and even lower prices.
The price recovery will likely be delayeduntil 2003, and the strength of the recoverywill largely be determined by the timing andstrength of the rebound in the global economy.
G L O B A L C O M M O D I T Y P R I C E P R O S P E C T S
187
Table A2.9 Global balance for fertilizers(million tons)
Annual growth rates (%)
1970 1980 1990 1998 1999 2000 1970–80 1980–90 1990–2000
NitrogenProduction 33.30 62.78 82.28 88.30 87.75 84.62 6.53 3.12 0.28Consumption 31.76 60.78 77.18 82.77 84.95 81.62 6.86 2.60 0.56Exports 6.77 13.15 19.59 23.00 23.94 24.70 7.23 5.10 2.34
PhosphateProduction 22.04 34.51 39.18 33.09 32.51 31.70 3.72 1.70 �2.10Consumption 21.12 31.70 35.90 33.35 33.46 32.65 3.85 1.39 �0.90Exports 2.92 7.51 10.50 12.59 12.70 12.11 8.37 5.01 1.44
PotashProduction 17.59 27.46 26.82 25.01 25.01 25.54 3.97 �0.03 �0.49Consumption 16.43 24.24 24.68 22.04 22.12 22.16 3.93 0.05 �1.07Exports 9.45 16.72 19.82 22.23 22.65 23.41 4.89 0.73 1.68
Note: All data are in marketing years.Source: Food and Agriculture Organization.
Source: Platt’s Metals Week.
Figure A2.7 Aluminum and copper prices(dollars per ton)
1,100
1,500
1,900
2,300
2,700
Jan.2002
Jan.2000
Jan.2001
Jan.1999
Jan.1998
Jan.1997
Copper
Aluminum
gep_app02.qxd 12/5/02 12:52 PM Page 187

There is a possibility that during the upturnof the next economic cycle metal prices couldrise significantly, augmented by strong buy-ing from investment funds. However, this risewould induce the development of new capac-ity and the restart of idle facilities, and priceswould eventually decline. Real metals andminerals prices are expected to decline in thelong term, as production costs continue to fallwith the implementation of new technologiesand of improved managerial practices.
AluminumAluminum prices have fallen back near thelows of October 2001 because of relativelyweak demand, rising production, and soaringstocks. Prices have been partly supported byreductions in capacity caused by high electric-ity prices and rationing in the Pacific North-west and Brazil, but reactivations in Brazil andto a lesser extent in North America have con-tributed to the surplus. Production in Chinahas grown significantly, and despite demandgrowth of more than 10 percent per year,the country became a net exporter this year,adding to the downward pressure on prices.
Growth in demand is expected to acceleratein 2003, but the market is expected to remain in
surplus over the next two years, which shouldprevent any substantial increase in prices.Chinese exports are expected to continue risingover this period, contributing to the surplus.The market is not expected to move into deficituntil 2005, but there are many risks in the nearterm, such as the strength of the economicrecovery, the reactivation of idle capacity, andthe amount of Chinese net exports.
Real prices for primary aluminum are ex-pected to decline in the long term, as new low-cost capacity is developed to meet expectedgrowth in demand. However, investment innew aluminum plants will continue to requirelow-cost power supplies. There is not expectedto be any significant constraint on alumina sup-ply in the medium term, because several newalumina capacity expansions are under way.
CopperCopper prices led the rally in base metals duringthe past year following a series of productioncuts, with prices rising 20 percent from October2001 to June 2002. Prices have since recededbecause of prospects of weak demand in thenear term. However, the market is expected tobe in reasonable balance this year as world mineproduction declines about 2 percent because of
G L O B A L E C O N O M I C P R O S P E C T S 2 0 0 3
188
Source: London Metal Exchange.
Figure A2.8 Aluminum and copper stocks(thousand tons)
0
400
200
800
600
1,200
1,000
1,400
Jan.2002
Jan.2000
Jan.2001
Jan.1999
Jan.1998
Jan.1997
Aluminum
Copper
gep_app02.qxd 12/5/02 12:52 PM Page 188

industry curtailments. LME inventories re-main high, although they started to decline inMay largely as a result of the strong growth ofChinese imports.
Demand is expected to strengthen nextyear, and supply is expected to almost keeppace, largely because of the recent commis-sioning of Chile’s Escondida Phase IV projectand the restart of idle capacity. The firm mar-ket balance should help support prices, buthigh stocks may prevent sharply higher gainsnext year. The market is expected to remain inmodest deficit over the next few years, whichshould support rising prices during the forth-coming economic cycle. In the longer term, in-creases in new low-cost capacity are expectedto result in the continued decline of real prices.A major uncertainty over the forecast periodwill be the volume of Chinese imports.
NickelNickel has been one base metal to sustain priceincreases this year, with a 38 percent gainbetween October 2001 and September 2002.Relatively low stocks and Russian Norilsk’sefforts to keep surplus supplies off the exportmarket have supported prices that are signifi-cantly higher than would be expected at thebottom of the business cycle. Norilsk is using
60,000 tons of stock as collateral against athree-year loan from Western banks, whichmay keep the material off the market for theduration of the loan. Demand for nickel hasbeen relatively strong in the stainless steel sec-tor, largely because of the shortage of scrapsupply.
The nickel market is expected to move intodeficit in 2003 and over the next few years be-cause production increases are expected to fallshort of a strong growth in demand. No majornew projects are being commissioned until2005. Poor technical and financial perfor-mance with pressure-acid-leach technology inAustralia has been a major reason for the cur-rent lack of investment, which could result infairly strong prices over the next couple ofyears. Over the long term, large new develop-ments are expected to come onstream, suchas Inco’s Goro project in New Caledonia (in2005) and Voisey Bay in Labrador, Canada (in2006). Supply will originate from other newprojects, expansions, and Norilsk’s stockpiledmaterial. New technologies will lead to lowercosts, and real prices are expected to decline.
Table A2.10 shows the production, con-sumption, and LME ending stocks for alu-minum, copper, and nickel from 1970 through2001.
G L O B A L C O M M O D I T Y P R I C E P R O S P E C T S
189
Table A2.10 Global balance for metals and minerals(thousand tons)
Annual growth rates (%)
1970 1980 1990 1999 2000 2001 1970–80 1980–90 1990–2001
AluminumProduction 10,257 16,027 19,362 23,710 24,465 24,521 3.2 1.9 2.2Consumption 9,996 14,771 19,244 23,358 24,871 23,525 3.2 1.8 1.8LME ending stocks 68 311 775 322 821 n.a. �0.3 9.2
CopperProduction 7,583 9,242 10,809 14,463 14,831 15,571 1.9 1.1 3.4Consumption 7,294 9,400 10,780 14,024 15,104 14,583 2.5 1.0 2.8LME ending stocks 72 123 179 790 357 799 7.4 �5.6 14.6
NickelProduction 0 717 842 1,028 1,102 1,128 n.a. 1.6 2.7Consumption 0 742 858 1,059 1,146 1,150 n.a. 1.5 2.7LME ending stocks 2,130 4,554 4,344 47 10 19 n.a. �0.5 15.2
Sources: World Bureau of Metal Statistics, London Metal Exchange, and World Bank.
gep_app02.qxd 12/5/02 12:52 PM Page 189
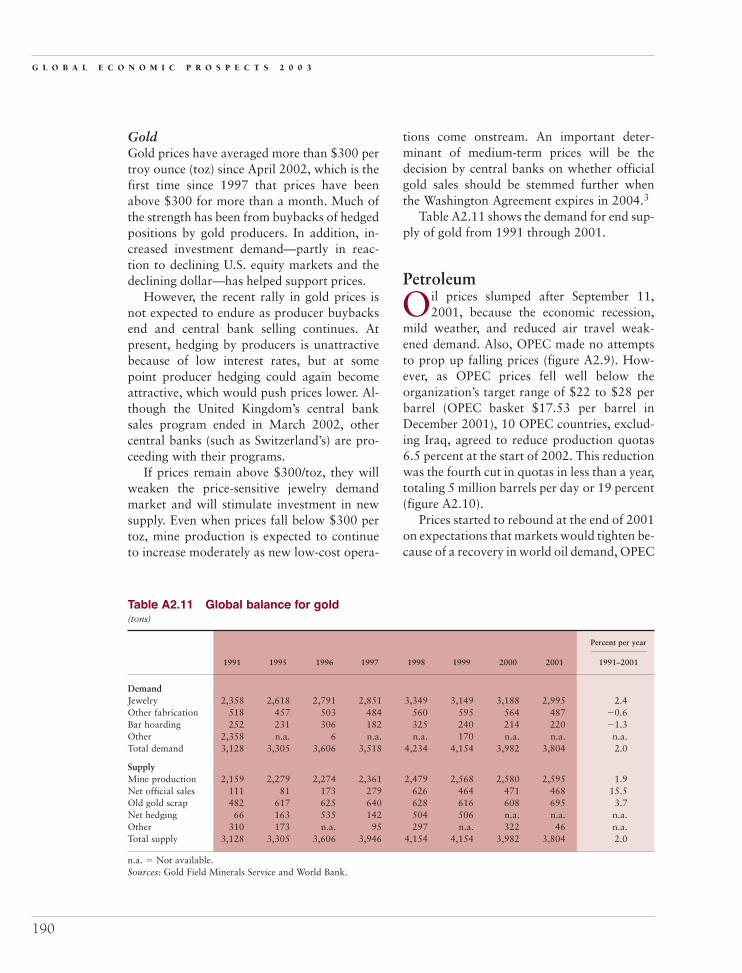
GoldGold prices have averaged more than $300 pertroy ounce (toz) since April 2002, which is thefirst time since 1997 that prices have beenabove $300 for more than a month. Much ofthe strength has been from buybacks of hedgedpositions by gold producers. In addition, in-creased investment demand—partly in reac-tion to declining U.S. equity markets and thedeclining dollar—has helped support prices.
However, the recent rally in gold prices isnot expected to endure as producer buybacksend and central bank selling continues. Atpresent, hedging by producers is unattractivebecause of low interest rates, but at somepoint producer hedging could again becomeattractive, which would push prices lower. Al-though the United Kingdom’s central banksales program ended in March 2002, othercentral banks (such as Switzerland’s) are pro-ceeding with their programs.
If prices remain above $300/toz, they willweaken the price-sensitive jewelry demandmarket and will stimulate investment in newsupply. Even when prices fall below $300 pertoz, mine production is expected to continueto increase moderately as new low-cost opera-
tions come onstream. An important deter-minant of medium-term prices will be thedecision by central banks on whether officialgold sales should be stemmed further whenthe Washington Agreement expires in 2004.3
Table A2.11 shows the demand for end sup-ply of gold from 1991 through 2001.
Petroleum
Oil prices slumped after September 11,2001, because the economic recession,
mild weather, and reduced air travel weak-ened demand. Also, OPEC made no attemptsto prop up falling prices (figure A2.9). How-ever, as OPEC prices fell well below theorganization’s target range of $22 to $28 perbarrel (OPEC basket $17.53 per barrel inDecember 2001), 10 OPEC countries, exclud-ing Iraq, agreed to reduce production quotas6.5 percent at the start of 2002. This reductionwas the fourth cut in quotas in less than a year,totaling 5 million barrels per day or 19 percent(figure A2.10).
Prices started to rebound at the end of 2001on expectations that markets would tighten be-cause of a recovery in world oil demand, OPEC
G L O B A L E C O N O M I C P R O S P E C T S 2 0 0 3
190
Table A2.11 Global balance for gold(tons)
Percent per year
1991 1995 1996 1997 1998 1999 2000 2001 1991–2001
DemandJewelry 2,358 2,618 2,791 2,851 3,349 3,149 3,188 2,995 2.4Other fabrication 518 457 503 484 560 595 564 487 �0.6Bar hoarding 252 231 306 182 325 240 214 220 �1.3Other 2,358 n.a. 6 n.a. n.a. 170 n.a. n.a. n.a.Total demand 3,128 3,305 3,606 3,518 4,234 4,154 3,982 3,804 2.0
SupplyMine production 2,159 2,279 2,274 2,361 2,479 2,568 2,580 2,595 1.9Net official sales 111 81 173 279 626 464 471 468 15.5Old gold scrap 482 617 625 640 628 616 608 695 3.7Net hedging 66 163 535 142 504 506 n.a. n.a. n.a.Other 310 173 n.a. 95 297 n.a. 322 46 n.a.Total supply 3,128 3,305 3,606 3,946 4,154 4,154 3,982 3,804 2.0
n.a. � Not available.Sources: Gold Field Minerals Service and World Bank.
gep_app02.qxd 12/5/02 12:52 PM Page 190

output restraint, and declining stocks. In addi-tion, perceived threats of a supply disruptionfrom a United States–led invasion of Iraq alsohelped push prices higher, and those anxietiesdeepened as the year progressed. The WorldBank’s average price rose above $20 per barrel
in March and approached $30 per barrel inSeptember as U.S. President George W. Bushtook his case for war against Iraq to the UnitedNations (U.N.). Market fundamentals alsostarted to tighten heading into the peak-demand winter season.
G L O B A L C O M M O D I T Y P R I C E P R O S P E C T S
191
Source: World Bank and International Energy Agency.
Figure A2.9 Oil price and OECD stocks(dollars per barrel)
10
15
25
20
30
35
2400
2450
2500
2550
2600
2650
2750
2700
2800
2850
Jan.2002
Jan.2000
Jan.2001
Jan.1999
Jan.1998
Jan.1997
(million barrels)
Stocks WB price
Source: International Energy Agency and Organization of Petroleum Exporting Countries.
Figure A2.10 OPEC-10 production and quotas(million barrels per day)
21
22
23
25
24
27
26
30
29
28
Jan.2002
Jan.2000
Jan.2001
Jan.1999
Jan.1998
Jan.1997
OPEC-10 quotas
OPEC-10 production
Plus Iraq production
gep_app02.qxd 12/5/02 12:52 PM Page 191

Fundamentally, the market was in reason-able balance for much of 2002, and invento-ries were at fairly typical levels, althoughstocks could fall to relatively low levels duringthe winter without higher OPEC production.World oil demand is likely to rise only mar-ginally this year (table A2.12), similar to thegain in 2001. Meanwhile non-OPEC suppliescontinue to increase strongly, rising by an esti-mated 1.2 million barrels per day, with morethan half of the gain expected to come fromRussia.
It is only through significant productionrestraint that OPEC has kept prices within itstarget range—notwithstanding some overpro-duction by members of the group. In addition,Iraq’s exports have been less than half of thecountry’s potential for much of the year, be-cause of disputes with the U.N. about Iraq’ssurcharges, which the U.N. sought to eliminatewith a retroactive pricing scheme. However,buyers are exposed to large risks with thismechanism, and crude oil purchases from Iraqwere curtailed.
Expectations of an attack on Iraq haveled to a wide range of estimates of a “warpremium” on prices this year. Estimates rangefrom very little (prices reflect the market bal-ance) to several dollars per barrel. It is very
difficult to quantify such a premium, and noprecise definition exists. Energy expert PhilipK. Verleger Jr. defines the premium as theincremental amount a buyer is willing to payfor ensured prompt supply over deferred oilgiven the level of inventories. He argues ac-cording to that definition that no war pre-mium existed at the end of September 2002.4
The near-term outlook for the oil marketdepends heavily on developments in Iraq andon OPEC’s production decisions. While thereis agreement between the United States andU.N. to allow weapons inspectors back intoIraq, there is likely to be less agreement onhow to proceed if Iraq refuses U.N. demands.Should an attack occur in the coming months,prices could spike sharply higher, dependingon the prevailing level of inventories, the re-sponse from OPEC producers, and the draw-down of strategic reserves. During the 1990war in the Persian Gulf, more than 4 mb/d ofoil from Kuwait and Iraq were removed frominternational markets, and prices exceeded$40/bbl. There was substantial surplus pro-duction within OPEC, and the organizationraised output—but not immediately. Impor-tantly, prices did not fall until the war com-menced (and its success was quickly assured)and the strategic stocks were released.
G L O B A L E C O N O M I C P R O S P E C T S 2 0 0 3
192
Table A2.12 Global balance for petroleum(million barrels per day)
Annual growth rates (%)
1970 1980 1990 2001 2002 2003 1970–80 1980–90 1990–2001
ConsumptionOECD 34.0 41.5 41.5 47.7 47.6 48.0 2.0 0.0 1.3Former Soviet Union 5.0 8.9 8.4 3.7 3.8 3.9 6.0 �0.6 �7.2Other non-OECD countries 6.8 12.3 16.1 25.1 25.3 25.7 6.1 2.7 4.1Total 45.7 62.6 66.0 76.5 76.6 77.5 3.2 0.5 1.3
ProductionOPEC 23.5 27.2 24.5 30.2 28.5 28.7 1.5 �1.0 1.9Former Soviet Union 7.1 12.1 11.5 8.6 9.3 9.9 5.4 �0.5 �2.6Other non-OPEC countries 17.4 24.6 30.9 38.2 38.6 39.1 3.5 2.3 1.9Total 48.0 63.9 66.9 76.9 76.4 77.7 2.9 0.5 1.3Stock change, miscellaneous 2.3 1.3 0.9 0.4 �0.2 0.3Memo item: Iraq 1.6 2.7 2.0 2.4 1.9 2.0 5.5 �2.7 1.5
Sources: BP, International Energy Agency, and World Bank.
gep_app02.qxd 12/5/02 12:52 PM Page 192

G L O B A L C O M M O D I T Y P R I C E P R O S P E C T S
193
Since Iraq is exporting only around 1 mb/d,much less oil is at risk, although it is conceiv-able that Iraq could launch scud missiles intoKuwait and Saudi Arabia and could tem-porarily disrupt supplies. There is more sur-plus capacity within OPEC than in 1990, andsufficient spare capacity within Saudi Arabiaalone could easily replace lost oil from Iraq.However, OPEC desires prices of at least$25/bbl, and it is not clear how quickly itsmembers will raise production to prevent asurge in prices. In such an environment, crudeprices could be bid up sharply because ofhigher demand, speculation, and hoarding.Buyers might have to pay a substantial pre-mium for prompt supplies, and prices couldrise to 1990 levels.
Once war ends, prices could fall precipi-tously as a result of a higher OPEC produc-tion, a draw from strategic stocks, and thereturn of Iraqi exports. Disputes within OPECover market share could take prices well below$20/bbl.
In the absence of an attack, OPEC’s pro-duction decisions will heavily influence prices.The group will likely attempt to keep pricesat $25/bbl. Higher OPEC production will berequired during the winter to keep prices
below $30/bbl, but the organization may haveto reduce output at winter’s end to keep priceswithin its price target. The demand for OPECoil is expected to rise only modestly in 2003.An increase in non-OPEC supply of 1 mb/dis expected to capture the bulk of the growthin world oil demand. Rising capacity withinOPEC, requests for higher quotas (fromAlgeria and Nigeria), and a recovery of Iraq’sexports could strain OPEC’s efforts to supporthigher prices. But as long as the risk of a sup-ply disruption hangs over the market, pricesare likely to remain well within OPEC’s targetrange.
Oil prices are expected to decline from$25 per barrel in 2002 to $23 per barrel in2003 as a result of rising supply competitionand below-trend growth in demand. By mid-decade, prices are expected to fall below$20 per barrel (figure A2.11). A risk to theforecast is that OPEC could maintain strongproduction discipline over the next few yearsto keep prices at or above $25 per barrel. Ifsuch efforts prove successful, they wouldadd to the growing pressures on prices—bynegatively affecting demand and by stimulat-ing competing supplies—and prices would stillbe expected to fall below $20 per barrel by
Source: World Bank.
Figure A2.11 Crude oil prices(dollars per barrel)
0
5
10
15
20
30
25
50
45
1990 dollars
40
35
2110 2015200519901985 2000199519801975197019651960
Nominal
Real
gep_app02.qxd 12/5/02 12:52 PM Page 193

mid-decade. By 2005–06, significant new sup-plies from West Africa, the Caspian Sea, andelsewhere are expected to become available.Coupled with rising capacity within OPEC,those supplies will exert severe downwardpressure on prices.
In the long term, growth in demand willbe only moderate, as it has been for the past20 years (table A2.12), but new technologies,environmental pressures, and governmentpolicies could further reduce this growth.Prices somewhat below $20 per barrel are suf-ficiently high to generate ample developmentof conventional and unconventional oil sup-plies, and there are no apparent resource con-straints far into the future. In addition, newareas continue to be developed (for example,
deep water offshore and the Caspian Sea), anddevelopment costs continue to fall from newtechnologies (shifting supply curves outward).In addition, OPEC members are increasingcapacity and will add to the supply competi-tion in the coming years. Consequently, realoil prices are expected to continue their long-term decline.
As mentioned at the beginning of this ap-pendix, we will now present tables showingactual commodity prices for 1970 through2001, plus price projections for 2002 through2015. Table A2.13 gives the commodity pricesand forecasts in current dollars, table A2.14uses constant 1990 dollars, and table A2.15displays weighted indices of commodity pricesand inflation.
G L O B A L E C O N O M I C P R O S P E C T S 2 0 0 3
194
gep_app02.qxd 12/5/02 12:52 PM Page 194

G L O B A L C O M M O D I T Y P R I C E P R O S P E C T S
195
Table A2.13 Commodity prices and price projections in current dollars
Actual Projections
Commodity Unita 1970 1980 1990 2000 2001 2002 2003 2005 2010 2015
EnergyCoal, Australia $/mt n.a. n.a. 39.67 26.25 32.31 26.50 26.00 27.00 29.50 32.00Crude oil, average $/bbl 1.21 36.87 22.88 28.23 24.35 25.00 23.00 19.00 19.00 21.00Natural gas, Europe $/mmbtu n.a. 3.40 2.55 3.86 4.06 3.00 2.80 2.60 2.75 3.00Natural gas, U.S. $/mmbtu 0.17 1.55 1.70 4.31 3.96 3.25 3.20 3.00 3.00 3.25
Nonenergy commoditiesAgriculture
BeveragesCocoa c/kg 67.5 260.4 126.7 90.6 106.9 182.0 182.0 160.0 157.0 168.0Coffee, other milds c/kg 114.7 346.6 197.2 192.0 137.3 133.0 141.1 187.4 242.5 280.0Coffee, robusta c/kg 91.4 324.3 118.2 91.3 60.7 63.9 70.6 83.8 110.0 142.6Tea, auctions (3) average c/kg 83.5 165.9 205.8 187.6 159.8 150.0 155.0 165.0 175.0 180.0
FoodFats and oilsCoconut oil $/mt 397.2 673.8 336.5 450.3 318.1 415.0 450.0 600.0 645.0 670.0Copra $/mt 224.8 452.7 230.7 304.8 202.1 268.0 375.0 450.0 480.0 500.0Groundnut oil $/mt 378.6 858.8 963.7 713.7 680.3 680.0 750.0 820.0 850.0 875.0Palm oil $/mt 260.1 583.7 289.8 310.3 285.7 385.0 390.0 400.0 450.0 475.0Soybean meal $/mt 102.6 262.4 200.2 189.2 181.0 175.0 200.0 205.0 215.0 220.0Soybean oil $/mt 286.3 597.6 447.3 338.1 354.0 440.0 450.0 430.0 460.0 505.0Soybeans $/mt 116.9 296.2 246.8 211.8 195.8 210.0 230.0 235.0 240.0 250.0
GrainsMaize $/mt 58.4 125.3 109.3 88.5 89.6 100.0 125.0 115.0 120.0 130.0Rice, Thailand, 5% $/mt 126.3 410.7 270.9 202.4 172.8 192.0 210.0 235.0 260.0 265.0Sorghum $/mt 51.8 128.9 103.9 88.0 95.2 102.0 125.0 116.6 119.5 128.0Wheat, U.S., HRW $/mt 54.9 172.7 135.5 114.1 126.8 151.5 180.0 150.0 160.0 165.0
Other foodBananas, U.S. $/mt 166.1 377.3 540.9 424.0 583.3 530.0 518.1 529.1 568.0 590.0Beef, U.S. c/kg 130.4 276.0 256.3 193.2 212.9 215.0 230.0 228.0 222.0 230.0Oranges $/mt 168.0 400.2 531.1 363.2 595.5 588.0 550.0 500.0 525.0 550.0Shrimp, Mexico c/kg n.a. 1,152 1,069 1,513 1,517 1,040 1,150 1,650 1,700 1,720Sugar, world c/kg 8.2 63.16 27.67 18.04 19.04 15.00 15.00 17.60 21.00 22.00
Agricultural raw materialsTimberLogs, Cameroon $/cum 43.0 251.7 343.5 275.4 266.1 265.0 275.0 300.0 338.0 385.0Logs, Malaysia $/cum 43.1 195.5 177.2 190.0 159.1 163.0 170.0 215.0 260.0 295.0Sawnwood, Malaysia $/cum 175.0 396.0 533.0 594.7 481.4 528.0 560.0 625.0 720.0 820.0
Other raw materialsCotton c/kg 67.6 206.2 181.9 130.2 105.8 100.0 110.2 127.9 149.9 160.0Rubber, RSS1, Malaysia c/kg 40.7 142.5 86.5 69.1 60.0 79.4 81.6 83.8 87.7 95.1Tobacco $/mt 1,076 2,276 3,392 2,976 3,005 2,770 3,000 3,250 3,275 3,300
FertilizersDAP $/mt 54.0 222.2 171.4 154.2 147.7 158.0 168.0 170.0 175.0 180.0Phosphate rock $/mt 11.00 46.71 40.50 43.75 41.77 40.80 41.00 43.00 45.00 46.00Potassium chloride $/mt 32.0 115.7 98.1 122.5 118.1 113.0 120.0 124.0 127.0 130.0TSP $/mt 43.0 180.3 131.8 137.7 126.9 133.0 140.0 150.0 150.0 155.0Urea, East Europe, bagged $/mt n.a. n.a. 119.3 101.1 95.3 93.0 108.6 126.7 131.3 135.8
Metals and mineralsAluminum $/mt 556 1,456 1,639 1,549 1,444 1,340 1,400 1,500 1,600 1,700Copper $/mt 1,416 2,182 2,661 1,813 1,578 1,545 1,650 1,900 2,000 2,050Gold $/toz 35.9 607.9 383.5 279.0 271.0 310.0 300.0 275.0 300.0 300.0Iron ore c/dmtu 9.84 28.09 32.50 28.79 30.03 29.50 30.00 31.00 32.00 32.50Lad c/kg 30.3 90.6 81.1 45.4 47.6 45.0 48.0 55.0 60.0 62.5Nickel $/mt 2,846 6,519 8,864 8,638 5,945 6,700 7,500 7,500 6,700 6,800Silver c/toz 177.0 2,064 482.0 499.9 438.6 460.0 480.0 500.0 525.0 550.0Tin c/kg 367.3 1,677 608.5 543.6 448.4 405.0 450.0 525.0 540.0 550.0Zinc c/kg 29.6 76.1 151.4 112.8 88.6 77.0 84.0 100.0 105.0 110.0
n.a. � Not available.a. $ � U.S. dollar, c � U.S. cent, bbl � barrel, cum � cubic meter, dmtu � dry metric ton unit, kg � kilogram, mmbtu � million British thermal unit, mt � metric ton, and toz � troy ounce. Note: Projections as of November 12, 2002.Source: World Bank, Development Prospects Group.
gep_app02.qxd 12/5/02 12:52 PM Page 195
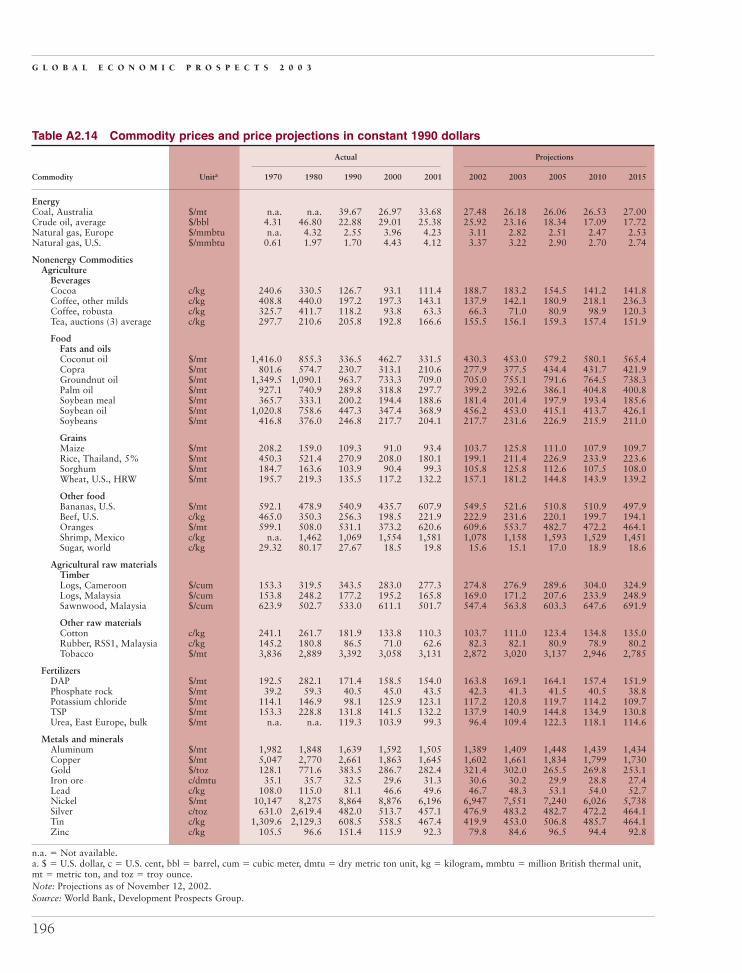
G L O B A L E C O N O M I C P R O S P E C T S 2 0 0 3
196
Table A2.14 Commodity prices and price projections in constant 1990 dollars
Actual Projections
Commodity Unita 1970 1980 1990 2000 2001 2002 2003 2005 2010 2015
EnergyCoal, Australia $/mt n.a. n.a. 39.67 26.97 33.68 27.48 26.18 26.06 26.53 27.00Crude oil, average $/bbl 4.31 46.80 22.88 29.01 25.38 25.92 23.16 18.34 17.09 17.72Natural gas, Europe $/mmbtu n.a. 4.32 2.55 3.96 4.23 3.11 2.82 2.51 2.47 2.53Natural gas, U.S. $/mmbtu 0.61 1.97 1.70 4.43 4.12 3.37 3.22 2.90 2.70 2.74
Nonenergy CommoditiesAgriculture
BeveragesCocoa c/kg 240.6 330.5 126.7 93.1 111.4 188.7 183.2 154.5 141.2 141.8Coffee, other milds c/kg 408.8 440.0 197.2 197.3 143.1 137.9 142.1 180.9 218.1 236.3Coffee, robusta c/kg 325.7 411.7 118.2 93.8 63.3 66.3 71.0 80.9 98.9 120.3Tea, auctions (3) average c/kg 297.7 210.6 205.8 192.8 166.6 155.5 156.1 159.3 157.4 151.9
FoodFats and oilsCoconut oil $/mt 1,416.0 855.3 336.5 462.7 331.5 430.3 453.0 579.2 580.1 565.4Copra $/mt 801.6 574.7 230.7 313.1 210.6 277.9 377.5 434.4 431.7 421.9Groundnut oil $/mt 1,349.5 1,090.1 963.7 733.3 709.0 705.0 755.1 791.6 764.5 738.3Palm oil $/mt 927.1 740.9 289.8 318.8 297.7 399.2 392.6 386.1 404.8 400.8Soybean meal $/mt 365.7 333.1 200.2 194.4 188.6 181.4 201.4 197.9 193.4 185.6Soybean oil $/mt 1,020.8 758.6 447.3 347.4 368.9 456.2 453.0 415.1 413.7 426.1Soybeans $/mt 416.8 376.0 246.8 217.7 204.1 217.7 231.6 226.9 215.9 211.0
GrainsMaize $/mt 208.2 159.0 109.3 91.0 93.4 103.7 125.8 111.0 107.9 109.7Rice, Thailand, 5% $/mt 450.3 521.4 270.9 208.0 180.1 199.1 211.4 226.9 233.9 223.6Sorghum $/mt 184.7 163.6 103.9 90.4 99.3 105.8 125.8 112.6 107.5 108.0Wheat, U.S., HRW $/mt 195.7 219.3 135.5 117.2 132.2 157.1 181.2 144.8 143.9 139.2
Other foodBananas, U.S. $/mt 592.1 478.9 540.9 435.7 607.9 549.5 521.6 510.8 510.9 497.9Beef, U.S. c/kg 465.0 350.3 256.3 198.5 221.9 222.9 231.6 220.1 199.7 194.1Oranges $/mt 599.1 508.0 531.1 373.2 620.6 609.6 553.7 482.7 472.2 464.1Shrimp, Mexico c/kg n.a. 1,462 1,069 1,554 1,581 1,078 1,158 1,593 1,529 1,451Sugar, world c/kg 29.32 80.17 27.67 18.5 19.8 15.6 15.1 17.0 18.9 18.6
Agricultural raw materialsTimberLogs, Cameroon $/cum 153.3 319.5 343.5 283.0 277.3 274.8 276.9 289.6 304.0 324.9Logs, Malaysia $/cum 153.8 248.2 177.2 195.2 165.8 169.0 171.2 207.6 233.9 248.9Sawnwood, Malaysia $/cum 623.9 502.7 533.0 611.1 501.7 547.4 563.8 603.3 647.6 691.9
Other raw materialsCotton c/kg 241.1 261.7 181.9 133.8 110.3 103.7 111.0 123.4 134.8 135.0Rubber, RSS1, Malaysia c/kg 145.2 180.8 86.5 71.0 62.6 82.3 82.1 80.9 78.9 80.2Tobacco $/mt 3,836 2,889 3,392 3,058 3,131 2,872 3,020 3,137 2,946 2,785
FertilizersDAP $/mt 192.5 282.1 171.4 158.5 154.0 163.8 169.1 164.1 157.4 151.9Phosphate rock $/mt 39.2 59.3 40.5 45.0 43.5 42.3 41.3 41.5 40.5 38.8Potassium chloride $/mt 114.1 146.9 98.1 125.9 123.1 117.2 120.8 119.7 114.2 109.7TSP $/mt 153.3 228.8 131.8 141.5 132.2 137.9 140.9 144.8 134.9 130.8Urea, East Europe, bulk $/mt n.a. n.a. 119.3 103.9 99.3 96.4 109.4 122.3 118.1 114.6
Metals and mineralsAluminum $/mt 1,982 1,848 1,639 1,592 1,505 1,389 1,409 1,448 1,439 1,434Copper $/mt 5,047 2,770 2,661 1,863 1,645 1,602 1,661 1,834 1,799 1,730Gold $/toz 128.1 771.6 383.5 286.7 282.4 321.4 302.0 265.5 269.8 253.1Iron ore c/dmtu 35.1 35.7 32.5 29.6 31.3 30.6 30.2 29.9 28.8 27.4Lead c/kg 108.0 115.0 81.1 46.6 49.6 46.7 48.3 53.1 54.0 52.7Nickel $/mt 10,147 8,275 8,864 8,876 6,196 6,947 7,551 7,240 6,026 5,738Silver c/toz 631.0 2,619.4 482.0 513.7 457.1 476.9 483.2 482.7 472.2 464.1Tin c/kg 1,309.6 2,129.3 608.5 558.5 467.4 419.9 453.0 506.8 485.7 464.1Zinc c/kg 105.5 96.6 151.4 115.9 92.3 79.8 84.6 96.5 94.4 92.8
n.a. � Not available.a. $ � U.S. dollar, c � U.S. cent, bbl � barrel, cum � cubic meter, dmtu � dry metric ton unit, kg � kilogram, mmbtu � million British thermal unit,mt � metric ton, and toz � troy ounce.Note: Projections as of November 12, 2002.Source: World Bank, Development Prospects Group.
gep_app02.qxd 12/5/02 12:52 PM Page 196

G L O B A L C O M M O D I T Y P R I C E P R O S P E C T S
197
Table A2.15 Weighted indices of commodity prices and inflation (1990 = 100)
Actual Projectionsa
Index 1970 1980 1990 2000 2001 2002 2003 2005 2010 2015
Current dollarsPetroleum 5.3 161.2 100.0 123.4 106.4 109.3 100.5 83.0 83.0 91.8Nonenergy commoditiesb 43.8 125.5 100.0 86.9 79.0 82.9 87.7 94.2 102.7 109.9
Agriculture 45.8 138.1 100.0 87.7 79.7 86.5 91.7 98.0 108.9 118.0Beverages 56.9 181.4 100.0 88.4 72.1 84.4 87.5 97.8 115.1 130.6Food 46.7 139.3 100.0 84.5 86.0 89.8 96.3 97.8 104.3 108.2
Fats and oils 64.4 148.7 100.0 96.2 89.0 100.2 108.2 113.1 120.9 126.1Grains 46.7 134.3 100.0 79.5 78.2 89.0 104.5 99.4 106.6 111.1Other food 32.2 134.3 100.0 77.7 87.9 81.9 81.9 84.4 89.4 92.0
Raw materials 36.4 104.6 100.0 91.4 77.4 83.6 88.8 98.4 110.2 121.2Timber 31.8 79.0 100.0 111.0 90.2 98.1 103.9 117.8 136.6 155.5Other raw materials 39.6 122.0 100.0 78.0 68.6 73.7 78.5 85.2 92.2 97.8
Fertilizers 30.4 128.9 100.0 105.8 98.8 102.0 104.4 111.0 112.8 116.1Metals and minerals 40.4 94.2 100.0 83.0 75.1 72.4 76.5 83.2 86.4 89.5
Constant 1990 dollarsc
Petroleum 18.9 204.6 100.0 126.8 110.9 113.3 101.2 80.2 74.7 77.5Nonenergy commodities 156.3 159.3 100.0 89.3 82.3 86.0 88.3 90.9 92.4 92.7
Agriculture 163.3 175.3 100.0 90.1 83.1 89.6 92.3 94.6 97.9 99.5Beverages 202.8 230.3 100.0 90.8 75.1 87.5 88.1 94.4 103.5 110.2Food 166.5 176.8 100.0 86.8 89.6 93.1 96.9 94.5 93.8 91.3
Fats and oils 229.5 188.7 100.0 98.9 92.8 103.8 109.0 109.2 108.8 106.4Grains 166.6 170.5 100.0 81.7 81.5 92.3 105.2 96.0 95.9 93.8Other food 114.9 170.5 100.0 79.9 91.6 84.9 82.4 81.5 80.4 77.6
Raw materials 129.8 132.7 100.0 93.9 80.6 86.7 89.4 95.0 99.1 102.3Timber 113.3 100.3 100.0 114.1 94.0 101.7 104.6 113.7 122.9 131.2Other raw materials 141.1 154.9 100.0 80.1 71.5 76.5 79.0 82.2 82.9 82.5
Fertilizers 108.3 163.6 100.0 108.7 102.9 105.7 105.1 107.2 101.5 98.0Metals and minerals 143.9 119.6 100.0 85.3 78.3 75.1 77.0 80.3 77.7 75.5
Inflation indicesd
MUV indexe 28.05 78.78 100.00 97.32 95.95 96.45 99.33 103.59 111.18 118.51Percentage change per annum 10.88 2.41 �0.27 �1.40 0.53 2.98 2.12 1.42 1.29
US GDP deflator 33.59 65.93 100.00 123.73 126.42 127.69 129.73 136.03 153.01 172.27Percentage change per annum 6.98 4.25 2.15 2.18 1.00 1.60 2.40 2.38 2.40
a. Commodity price projections as of November 12, 2002.b. The World Bank primary commodity price indices are computed from 1987–89 export values in U.S. dollars for low- and middle-income economies,rebased to 1990. Weights for the subgroup indices expressed as ratios to the nonenergy index are as follows: agriculture—69.1 percent, fertilizers—2.7 percent, and metals and minerals—28.2 percent; beverages—16.9 percent, food—29.4 percent, and raw materials—22.8 percent; fats and oils—10.1 percent, grains—6.9 percent, and other food—12.4 percent; timber—9.3 percent and other raw materials—13.6 percent.c. Computed from unrounded data and deflated by the manufactures unit value (MUV) index.d. Inflation indices for 2002–15 are projections as of November 8, 2002. MUV for 2001 is an estimate. Growth rates for 1980, 1990, 2000, 2005,2010, and 2015 refer to compound annual rate of change between adjacent endpoint years; all others are annual growth rates from the previous year.e. Unit value index in U.S. dollar terms of manufactures exported from the G-5 countries (France, Germany, Japan, the United Kingdom, and the UnitedStates) weighted proportionally to the countries’ exports to developing countries.Source: World Bank, Development Prospects Group. U.S. Department of Commerce for historical U.S. GDP deflator.
gep_app02.qxd 12/5/02 12:52 PM Page 197

Notes1. As measured relative to the manufactures unit
value (MUV) index, which is the unit value index in U.S.dollar terms (1990 � 100) of manufactures exportedfrom the G-5 countries (France, Germany, Japan, theUnited Kingdom, and the United States) weighted by thecountry’s exports to developing countries.
2. An El Niño occurs when the Pacific Oceanwarms, as occurred this year. But this year’s El Niño issignificantly weaker than the last one, which occurredin 1997. The Pacific is about 1 degree Centigradewarmer than usual this year compared with 3 degrees
Centigrade warmer in 1997. Thus the effects of thisyear’s El Niño are expected to be smaller than in 1997,when drought in Southeast Asia led to wildfires andpoor crop harvests.
3. The European Central Bank and 14 Europeancentral banks agreed in September 1999 to limit salesto only 400 tons of gold per year, and not more than2,000 tons in total, over the subsequent five years.
4. Verleger, Philip K. Jr. The Petroleum EconomicsMonthly. August 2002, p. 11, and September 2002,p. 1.
G L O B A L E C O N O M I C P R O S P E C T S 2 0 0 3
198
gep_app02.qxd 12/5/02 12:52 PM Page 198

Appendix 3Global Economic Indicators
gep_app03.qxd 12/5/02 12:17 PM Page 199

G L O B A L E C O N O M I C P R O S P E C T S 2 0 0 3
200
Table A3.1 Growth of real GDP, 1971–2015GDP in 1995 prices and exchange rates, average annual growth (percent)
GDP in 2001 Growth percent
(current billions Estimate Forecastof dollars) 1971–80 1981–90 1991–2000 2001 2002 2003–15
World 30,790 3.7 3.0 2.6 1.1 1.7 3.1
High-income economies 24,852 3.5 3.1 2.5 0.7 1.5 2.6Industrial countries 24,088 3.4 3.1 2.4 0.8 1.4 2.5
G-7 countries 20,632 3.4 3.1 2.3 0.5 1.3 2.5United States 10,082 3.3 3.2 3.2 0.3 2.3 3.1Japan 4,166 4.5 4.1 1.3 �0.3 0.0 1.6G-4 Europe 5,678 2.9 2.4 1.8 1.4 0.7 2.2
Germanya 1,856 2.7 2.2 1.7 0.7 0.4 1.9Euro area 6,090 3.2 2.3 2.0 1.5 0.8 2.3Non-G-7 industrial 3,456 3.2 2.9 3.0 2.0 2.2 3.0
Other high income 764 7.7 5.1 5.1 �0.7 2.3 4.3Asian NIEs 531 9.5 7.4 6.1 �1.4 2.6 4.7
Low- and middle-income economies 5,938 4.8 2.6 3.2 2.9 2.8 4.6Excluding CE.Eur / CIS 5,101 5.5 3.0 4.7 3.0 2.7 4.7
Asia 2,205 5.2 6.8 7.0 5.2 5.8 6.0East Asia and Pacific 1,573 6.6 7.3 7.7 5.5 6.3 6.2
China 1,150 6.2 9.3 10.1 7.3 7.8 …Indonesia 145 7.9 6.4 4.2 3.3 3.2 …
South Asia 632 3.1 5.7 5.2 4.4 4.6 5.4India 495 3.0 5.8 5.6 4.5 4.8 …
Latin America and the Caribbean 1,882 5.9 1.1 3.3 0.4 �1.1 3.6Brazil 503 8.5 1.5 2.7 1.5 0.7 …Mexico 618 6.7 1.8 3.5 �0.3 1.3 …Argentina 269 3.0 �1.5 4.5 �4.4 �11.9 …
Europe and Central Asia 977 3.5 1.7 �1.7 2.3 3.6 3.6Russian Federationb 310 3.7 1.5 �4.0 5.0 4.3 …Turkey 148 4.1 5.2 3.5 �7.4 4.1 …Poland 176 5.1 �1.7 3.7 1.0 1.0 …
Middle East and North Africa 568 6.5 2.5 3.2 3.2 2.5 3.3Saudi Arabia 188 10.3 0.4 2.2 1.2 1.1 …Iran, Islamic Rep. of 114 1.8 2.7 4.1 4.8 4.5 …Egypt, Arab Rep. of 96 6.6 5.5 4.4 2.9 1.0 …
Sub-Saharan Africa 306 3.3 1.7 2.2 2.9 2.5 3.7South Africa 113 3.5 1.3 1.7 2.2 2.2 …Nigeria 41 4.7 1.1 2.6 4.0 �0.6 …
a. Data prior to 1991 covers West Germany.b. Data prior to 1992 covers former Soviet Union.Note: Growth rates over intervals are computed using compound average methods.Source: World Bank data and staff estimates.
Source: World Bank data and staff estimates.
Figure A3.1 Real GDP growth
High-incomecountries
East Asiaand Pacific
SouthAsia
Latin Americaand the
Caribbean
EasternEurope and Central Asia
Middle Eastand North
Africa
Sub-Saharan
Africa
0.0
�4.0
�2.0
10.0
(percent)
6.0
8.0
4.0
2.0
1991–2000 2003–15
gep_app03.qxd 12/5/02 12:17 PM Page 200
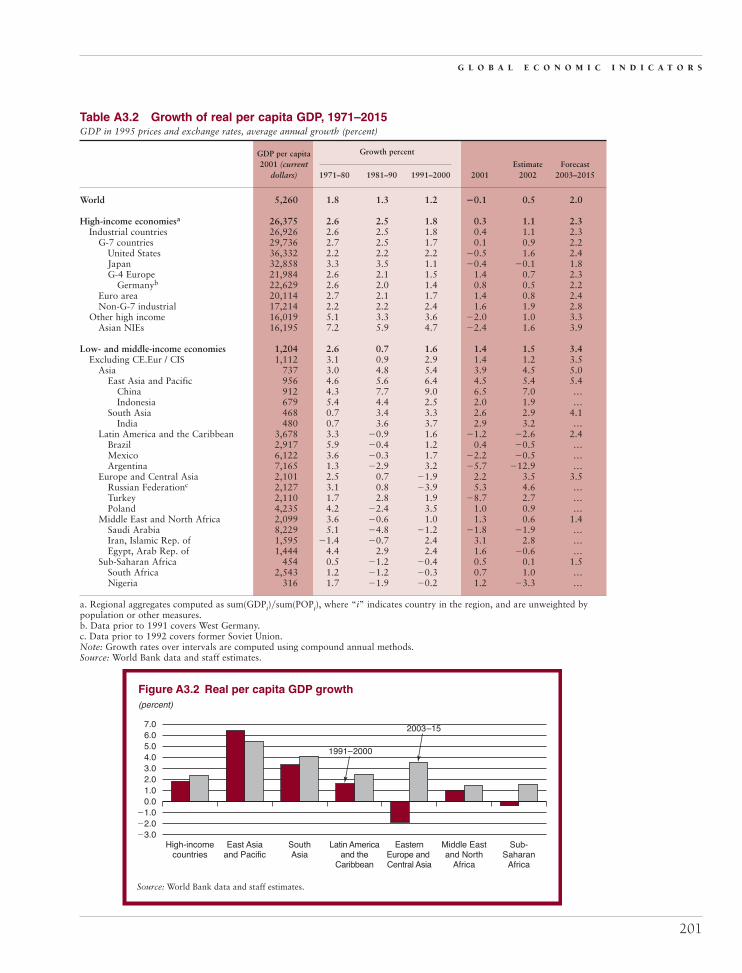
G L O B A L E C O N O M I C I N D I C A T O R S
201
Table A3.2 Growth of real per capita GDP, 1971–2015GDP in 1995 prices and exchange rates, average annual growth (percent)
GDP per capita Growth percent
2001 (current Estimate Forecastdollars) 1971–80 1981–90 1991–2000 2001 2002 2003–2015
World 5,260 1.8 1.3 1.2 �0.1 0.5 2.0
High-income economiesa 26,375 2.6 2.5 1.8 0.3 1.1 2.3Industrial countries 26,926 2.6 2.5 1.8 0.4 1.1 2.3
G-7 countries 29,736 2.7 2.5 1.7 0.1 0.9 2.2United States 36,332 2.2 2.2 2.2 �0.5 1.6 2.4Japan 32,858 3.3 3.5 1.1 �0.4 �0.1 1.8G-4 Europe 21,984 2.6 2.1 1.5 1.4 0.7 2.3
Germanyb 22,629 2.6 2.0 1.4 0.8 0.5 2.2Euro area 20,114 2.7 2.1 1.7 1.4 0.8 2.4Non-G-7 industrial 17,214 2.2 2.2 2.4 1.6 1.9 2.8
Other high income 16,019 5.1 3.3 3.6 �2.0 1.0 3.3Asian NIEs 16,195 7.2 5.9 4.7 �2.4 1.6 3.9
Low- and middle-income economies 1,204 2.6 0.7 1.6 1.4 1.5 3.4Excluding CE.Eur / CIS 1,112 3.1 0.9 2.9 1.4 1.2 3.5
Asia 737 3.0 4.8 5.4 3.9 4.5 5.0East Asia and Pacific 956 4.6 5.6 6.4 4.5 5.4 5.4
China 912 4.3 7.7 9.0 6.5 7.0 …Indonesia 679 5.4 4.4 2.5 2.0 1.9 …
South Asia 468 0.7 3.4 3.3 2.6 2.9 4.1India 480 0.7 3.6 3.7 2.9 3.2 …
Latin America and the Caribbean 3,678 3.3 �0.9 1.6 �1.2 �2.6 2.4Brazil 2,917 5.9 �0.4 1.2 0.4 �0.5 …Mexico 6,122 3.6 �0.3 1.7 �2.2 �0.5 …Argentina 7,165 1.3 �2.9 3.2 �5.7 �12.9 …
Europe and Central Asia 2,101 2.5 0.7 �1.9 2.2 3.5 3.5Russian Federationc 2,127 3.1 0.8 �3.9 5.3 4.6 …Turkey 2,110 1.7 2.8 1.9 �8.7 2.7 …Poland 4,235 4.2 �2.4 3.5 1.0 0.9 …
Middle East and North Africa 2,099 3.6 �0.6 1.0 1.3 0.6 1.4Saudi Arabia 8,229 5.1 �4.8 �1.2 �1.8 �1.9 …Iran, Islamic Rep. of 1,595 �1.4 �0.7 2.4 3.1 2.8 …Egypt, Arab Rep. of 1,444 4.4 2.9 2.4 1.6 �0.6 …
Sub-Saharan Africa 454 0.5 �1.2 �0.4 0.5 0.1 1.5South Africa 2,543 1.2 �1.2 �0.3 0.7 1.0 …Nigeria 316 1.7 �1.9 �0.2 1.2 �3.3 …
a. Regional aggregates computed as sum(GDPi)�sum(POPi), where “i” indicates country in the region, and are unweighted bypopulation or other measures.b. Data prior to 1991 covers West Germany.c. Data prior to 1992 covers former Soviet Union.Note: Growth rates over intervals are computed using compound annual methods.Source: World Bank data and staff estimates.
Source: World Bank data and staff estimates.
Figure A3.2 Real per capita GDP growth
High-incomecountries
East Asiaand Pacific
SouthAsia
Latin Americaand the
Caribbean
EasternEurope and Central Asia
Middle Eastand North
Africa
Sub-Saharan
Africa
�1.0
�3.0�2.0
7.0
(percent)
6.0
4.03.02.0
5.0
1.00.0
1991–2000
2003–15
gep_app03.qxd 12/5/02 12:17 PM Page 201

G L O B A L E C O N O M I C P R O S P E C T S 2 0 0 3
202
Table A3.3 Inflation: GDP deflators, 1971–2015Deflators in local currency units; 1995�100; percentage changea
Growth percent
Estimate Forecast1971–80 1981–90 1991–00 2001 2002 2003–15
World 9.0 5.8 3.7 2.3 1.7 1.9
High-income economies 8.8 5.3 2.0 1.5 1.0 1.3Industrial countries 8.7 4.6 2.0 1.5 1.1 1.3
G-7 countries 8.3 4.2 1.7 1.2 0.9 1.1United States 7.0 4.3 2.1 2.4 1.1 1.4Japan 7.8 2.0 0.1 �1.2 �0.9 0.0G-4 Europe 9.9 5.7 2.6 1.8 1.9 1.7
Germanyb 5.3 2.6 2.6 1.4 1.4 1.2Euro area 9.6 6.1 2.8 2.3 2.1 1.6Non-G-7 industrial 11.1 7.1 3.3 2.9 2.1 1.9
Other high income 19.3 33.1 3.8 0.4 �0.4 1.9Asian NIEs 9.5 4.7 2.4 �0.4 �1.0 1.5
Low- and middle-income economies 9.6 8.3 11.7 5.8 4.4 4.2Excluding CE.Eur / CIS 11.4 10.0 9.2 5.7 4.3 4.1
Asia 10.5 7.2 6.9 6.3 3.4 4.5East Asia and Pacific 9.6 5.5 5.6 6.6 2.5 3.4
China 0.9 5.4 6.3 0.0 0.4 …Indonesia 20.6 8.8 15.0 11.4 11.4 …
South Asia 11.9 9.0 7.9 6.1 5.0 5.5India 8.9 8.5 8.1 4.0 2.8 …
Latin America and the Caribbean 14.6 19.3 12.5 6.9 5.0 4.1Brazil 39.7 330.8 206.1 7.3 7.9 …Mexico 18.1 63.7 18.1 5.4 3.3 …Argentina 117.7 439.5 10.2 �1.1 36.5 …
Europe and Central Asia 0.3 2.4 50.3 5.9 4.7 4.0Russian Federationc 0.3 2.3 104.5 18.0 5.8 …Turkey 32.8 46.6 71.7 47.2 27.9 …Poland 4.4 72.1 24.1 1.7 3.8 …
Middle East and North Africa 11.7 8.7 6.0 4.2 4.1 4.0Saudi Arabia 23.8 �3.1 2.9 7.0 4.8 …Iran, Islamic Rep. of 20.2 15.6 25.6 8.6 5.1 …Egypt, Arab Rep. of 11.0 13.1 8.6 4.5 4.1 …
Sub-Saharan Africa 10.4 9.4 9.8 5.4 4.3 4.0South Africa 13.3 15.1 9.8 7.1 12.0 …Nigeria 13.4 16.6 28.6 5.9 4.5 …
a. High-income group inflation rates are GDP-weighted averages of local currency inflation; LMIC groups are medians; world isGDP-weighted average of the two groups.b. Data prior to 1991 covers West Germany.c. Data prior to 1992 covers former Soviet Union.Note: Growth rates over intervals are computed using compound annual methods.Source: World Bank data and staff estimates.
Source: World Bank data and staff estimates.
Figure A3.3 GDP inflation
High-incomecountries
East Asiaand Pacific
SouthAsia
Latin Americaand the
Caribbean
EasternEurope and Central Asia
Middle Eastand North
Africa
Sub-Saharan
Africa
4.0
0.0
2.0
14.0
(percent)
10.0
12.0
8.0
6.0
50.3
1991–2000
2003–15
gep_app03.qxd 12/5/02 12:17 PM Page 202

G L O B A L E C O N O M I C I N D I C A T O R S
203
Table A3.4 Current account balances, 1971–2015Expressed as shares of GDP (percent)
Current Acct2001 (billions
Shares percentEstimate Forecast
of dollars) 1971–80 1981–90 1991–2000 2001 2002 2003–15
Worlda �187 �0.1 �0.5 �0.4 �0.6 �0.7 �0.6
High-income economies �190 �0.1 �0.2 0.0 �0.8 �0.9 �0.7Industrial countries �247 �0.3 �0.5 �0.1 �1.0 �1.1 �0.9
G-7 countries �289 �0.1 �0.4 �0.3 �1.4 �1.6 �1.3United States �393 0.0 �1.9 �1.8 �3.9 �4.8 �3.3Japan 89 0.3 2.3 2.5 2.1 2.8 2.3G-4 Europe �4 0.1 0.3 �0.1 �0.1 0.6 0.4
Germanyb 2 0.5 2.4 �0.7 0.1 1.7 0.4Euro area 10 �0.1 0.4 0.3 0.2 0.8 1.0Non-G-7 industrial 42 �1.5 �0.6 0.8 1.2 1.3 1.3
Other high income 57 12.3 10.3 4.0 7.7 6.6 3.0Asian NIEs 50 1.8 6.9 5.4 9.5 10.3 4.2
Low- and middle-income economies 4 0.0 �1.7 �1.6 0.1 0.4 �0.3Excluding CE.Eur / FSU 11 0.2 �1.9 �1.6 0.2 0.6 �0.1Asia 42 �0.7 �1.6 �0.1 1.9 1.9 1.6
East Asia and Pacific 42 �0.8 �1.4 0.5 2.7 2.7 1.8China 17 0.1 0.2 1.6 1.5 1.6 …Indonesia 7 �2.3 �3.1 �0.4 4.8 2.6
South Asia 0 �0.5 �2.0 �1.5 0.0 �0.1 �1.1India 1 0.2 �1.7 �1.2 0.2 0.2 …
Latin America and the Caribbean �54 �2.8 �1.8 �2.8 �2.9 �1.5 �2.3Brazil �23 �4.4 �1.6 �2.2 �4.6 �2.8 …Mexico �18 �3.9 �0.8 �3.7 �2.9 �2.7 …Argentina �4 �0.4 �2.2 �3.2 �1.7 9.4 …
Europe and Central Asia �7 �0.8 �0.5 �2.3 �2.0 �2.4 �1.6Russian Federationc 36 2.1 3.5 4.7 11.7 8.0 …Turkey 3 �2.1 �1.3 �1.1 2.5 �0.6 …Poland �7 �0.9 �1.4 �3.6 �4.4 �3.7 …
Middle East and North Africa 29 9.5 �1.7 �2.1 5.2 3.3 �1.0Saudi Arabia 13 22.0 �7.2 �6.6 6.9 5.5 …Iran, Islamic Rep. of 7 11.8 �0.4 1.9 7.1 4.3 …Egypt, Arab Rep. of 0 �3.4 �3.4 1.5 �0.4 �0.2 …
Sub-Saharan Africa �7 �1.8 �2.7 �2.1 �2.2 �3.0 �2.0South Africa 0 �1.3 0.4 �0.2 �0.2 0.3 …Nigeria 0 1.5 �0.7 �0.4 0.4 �4.8 …
a. Current account as defined in Balance of Payments (BOP) version 5.0, world represents statistical discrepancy; shares over inter-vals are period averages.b. Data prior to 1991 covers West Germany.c. Data prior to 1992 covers former Soviet Union.Source: World Bank data and staff estimates.
Source: World Bank data and staff estimates.
Figure A3.4 Current account balance-to-GDP ratio
High-incomecountries
East Asiaand Pacific
SouthAsia
Latin Americaand the
Caribbean
EasternEurope and Central Asia
Middle Eastand North
Africa
Sub-Saharan
Africa
�2.0
�4.0
�3.0
3.0
(percent of GDP)
2.0
1.0
0.0
�1.0
1991–2000 2003–15
gep_app03.qxd 12/5/02 12:18 PM Page 203
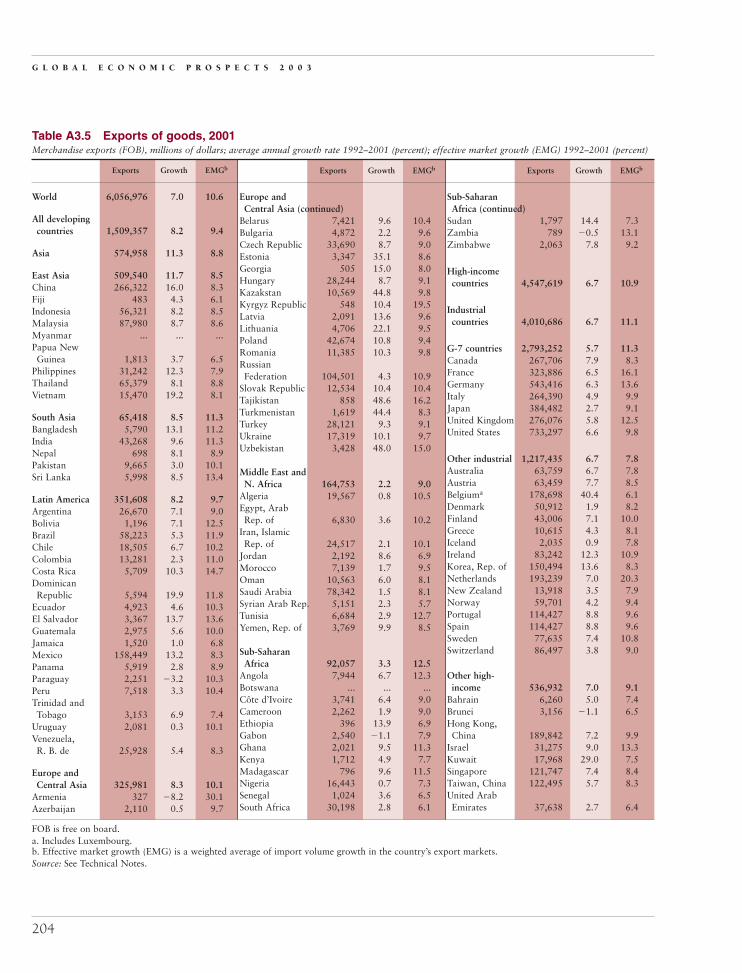
G L O B A L E C O N O M I C P R O S P E C T S 2 0 0 3
204
Table A3.5 Exports of goods, 2001Merchandise exports (FOB), millions of dollars; average annual growth rate 1992–2001 (percent); effective market growth (EMG) 1992–2001 (percent)
World 6,056,976 7.0 10.6
All developing countries 1,509,357 8.2 9.4
Asia 574,958 11.3 8.8
East Asia 509,540 11.7 8.5China 266,322 16.0 8.3Fiji 483 4.3 6.1Indonesia 56,321 8.2 8.5Malaysia 87,980 8.7 8.6Myanmar ... ... ...Papua New Guinea 1,813 3.7 6.5
Philippines 31,242 12.3 7.9Thailand 65,379 8.1 8.8Vietnam 15,470 19.2 8.1
South Asia 65,418 8.5 11.3Bangladesh 5,790 13.1 11.2India 43,268 9.6 11.3Nepal 698 8.1 8.9Pakistan 9,665 3.0 10.1Sri Lanka 5,998 8.5 13.4
Latin America 351,608 8.2 9.7Argentina 26,670 7.1 9.0Bolivia 1,196 7.1 12.5Brazil 58,223 5.3 11.9Chile 18,505 6.7 10.2Colombia 13,281 2.3 11.0Costa Rica 5,709 10.3 14.7Dominican Republic 5,594 19.9 11.8
Ecuador 4,923 4.6 10.3El Salvador 3,367 13.7 13.6Guatemala 2,975 5.6 10.0Jamaica 1,520 1.0 6.8Mexico 158,449 13.2 8.3Panama 5,919 2.8 8.9Paraguay 2,251 �3.2 10.3Peru 7,518 3.3 10.4Trinidad and Tobago 3,153 6.9 7.4
Uruguay 2,081 0.3 10.1Venezuela, R. B. de 25,928 5.4 8.3
Europe and Central Asia 325,981 8.3 10.1
Armenia 327 �8.2 30.1Azerbaijan 2,110 0.5 9.7
Europe and Central Asia (continued)
Belarus 7,421 9.6 10.4Bulgaria 4,872 2.2 9.6Czech Republic 33,690 8.7 9.0Estonia 3,347 35.1 8.6Georgia 505 15.0 8.0Hungary 28,244 8.7 9.1Kazakstan 10,569 44.8 9.8Kyrgyz Republic 548 10.4 19.5Latvia 2,091 13.6 9.6Lithuania 4,706 22.1 9.5Poland 42,674 10.8 9.4Romania 11,385 10.3 9.8Russian Federation 104,501 4.3 10.9
Slovak Republic 12,534 10.4 10.4Tajikistan 858 48.6 16.2Turkmenistan 1,619 44.4 8.3Turkey 28,121 9.3 9.1Ukraine 17,319 10.1 9.7Uzbekistan 3,428 48.0 15.0
Middle East andN. Africa 164,753 2.2 9.0
Algeria 19,567 0.8 10.5Egypt, Arab Rep. of 6,830 3.6 10.2
Iran, Islamic Rep. of 24,517 2.1 10.1
Jordan 2,192 8.6 6.9Morocco 7,139 1.7 9.5Oman 10,563 6.0 8.1Saudi Arabia 78,342 1.5 8.1Syrian Arab Rep. 5,151 2.3 5.7Tunisia 6,684 2.9 12.7Yemen, Rep. of 3,769 9.9 8.5
Sub-Saharan Africa 92,057 3.3 12.5
Angola 7,944 6.7 12.3Botswana ... ... ...Côte d’Ivoire 3,741 6.4 9.0Cameroon 2,262 1.9 9.0Ethiopia 396 13.9 6.9Gabon 2,540 �1.1 7.9Ghana 2,021 9.5 11.3Kenya 1,712 4.9 7.7Madagascar 796 9.6 11.5Nigeria 16,443 0.7 7.3Senegal 1,024 3.6 6.5South Africa 30,198 2.8 6.1
Sub-Saharan Africa (continued)
Sudan 1,797 14.4 7.3Zambia 789 �0.5 13.1Zimbabwe 2,063 7.8 9.2
High-income countries 4,547,619 6.7 10.9
Industrial countries 4,010,686 6.7 11.1
G-7 countries 2,793,252 5.7 11.3Canada 267,706 7.9 8.3France 323,886 6.5 16.1Germany 543,416 6.3 13.6Italy 264,390 4.9 9.9Japan 384,482 2.7 9.1United Kingdom 276,076 5.8 12.5United States 733,297 6.6 9.8
Other industrial 1,217,435 6.7 7.8Australia 63,759 6.7 7.8Austria 63,459 7.7 8.5Belgiuma 178,698 40.4 6.1Denmark 50,912 1.9 8.2Finland 43,006 7.1 10.0Greece 10,615 4.3 8.1Iceland 2,035 0.9 7.8Ireland 83,242 12.3 10.9Korea, Rep. of 150,494 13.6 8.3Netherlands 193,239 7.0 20.3New Zealand 13,918 3.5 7.9Norway 59,701 4.2 9.4Portugal 114,427 8.8 9.6Spain 114,427 8.8 9.6Sweden 77,635 7.4 10.8Switzerland 86,497 3.8 9.0
Other high-income 536,932 7.0 9.1
Bahrain 6,260 5.0 7.4Brunei 3,156 �1.1 6.5Hong Kong, China 189,842 7.2 9.9
Israel 31,275 9.0 13.3Kuwait 17,968 29.0 7.5Singapore 121,747 7.4 8.4Taiwan, China 122,495 5.7 8.3United Arab Emirates 37,638 2.7 6.4
Exports Growth EMGb Exports Growth EMGb Exports Growth EMGb
FOB is free on board.a. Includes Luxembourg.b. Effective market growth (EMG) is a weighted average of import volume growth in the country’s export markets.Source: See Technical Notes.
gep_app03.qxd 12/5/02 12:18 PM Page 204

G L O B A L E C O N O M I C I N D I C A T O R S
205
40
30
20
10
0
Source: World Bank data.
Figure A3.5a Merchandise exports as share of GDP, 2001(percent)
World
Industrialcountries
Sub-Saharan
Africa
East Asiaand Pacific
SouthAsia
LatinAmerica and
the Caribbean
EasternEurope andCentral Asia
MiddleEast and
North Africa
15
10
5
0
Source: World Bank data.
Figure A3.5b Annual growth rate of export volumes, 1992–2001(percent)
World
Industrialcountries
Sub-Saharan
Africa
East Asiaand Pacific
SouthAsia
LatinAmerica and
the Caribbean
EasternEurope andCentral Asia
MiddleEast and
North Africa
gep_app03.qxd 12/5/02 12:18 PM Page 205

G L O B A L E C O N O M I C P R O S P E C T S 2 0 0 3
206
Table A3.6 Imports of goods, 2001Merchandise imports (CIF), millions of dollars; average annual growth rate 1992–2001 (percent); merchandise imports share of GDP (percent)
World 6,079,466 6.2 18.1
All developing countries 1,375,828 6.2 19.7
Asia 502,434 9.2 22.7
East Asia 424,657 9.7 26.8China 232,322 15.8 20.1Fiji 503 �1.8 29.9Indonesia 30,962 4.9 21.4Malaysia 69,595 6.8 79.0Myanmar … … …Papua New Guinea 932 �3.2 31.5
Philippines 28,496 8.7 39.9Thailand 61,847 3.0 53.9Vietnam 15,059 17.0 45.8
South Asia 77,776 6.7 12.3Bangladesh 8,601 9.9 17.1India 51,624 8.0 10.4Nepal 1,047 7.1 20.8Pakistan 10,484 0.6 16.7Sri Lanka 6,020 7.2 33.2
Latin America 352,347 10.2 18.8Argentina 19,100 9.7 7.1Bolivia 1,600 6.2 19.9Brazil 55,573 9.6 11.1Chile 16,412 7.6 24.7Colombia 11,826 9.8 13.9Costa Rica 5,995 12.9 37.3Dominican Republic 8,963 17.4 43.9
Ecuador 4,674 6.7 34.3El Salvador 5,055 13.8 36.2Guatemala 4,672 10.0 23.9Jamaica 2,906 5.9 37.3Mexico 168,440 12.6 27.3Panama 6,890 3.4 67.6Paraguay 2,793 3.4 36.4Peru 7,408 6.9 14.5Trinidad and Tobago 3,216 9.5 38.2
Uruguay 2,971 6.0 15.0Venezuela,R. B. de 16,677 4.4 14.1
Europe and Central Asia 265,272 2.5 30.6
Armenia 841 �6.7 40.3Azerbaijan 1,976 2.2 31.9Belarus 8,149 6.0 26.0Bulgaria 5,771 3.3 46.1
Europe and Central Asia (continued)
Czech Republic 36,746 14.1 67.0Estonia 4,255 22.3 83.0Georgia 1,047 30.3 37.0Hungary 30,759 11.9 63.7Kazakstan 9,322 25.2 46.9Kyrgyz Republic 552 �1.2 37.5Latvia 3,351 14.7 46.9Lithuania 5,740 25.2 49.7Moldova ... ... ...Poland 53,874 13.1 32.8Romania 14,124 10.1 35.6Russian Federation 65,387 4.1 21.1
Slovak Republic 13,978 10.6 65.8Tajikistan 1,290 1.0 22.0TFYR Macedonia … … …
Turkmenistan 2,073 35.4 34.8Turkey 41,460 6.4 29.7Ukraine 15,959 5.0 42.2Uzbekistan 3,331 25.2 33.8
Middle East and N. Africa 106,531 1.3 19.2
Algeria 11,775 5.2 20.4Egypt, Arab Rep. of 15,016 3.4 16.1
Iran, Islamic Rep. of 16,665 �5.0 16.1
Iraq … … …Jordan 4,061 5.5 46.9Morocco 10,273 3.9 28.3Oman 4,735 3.8 24.6Saudi Arabia 28,427 0.8 15.1Syrian Arab Rep. 3,757 4.8 21.2
Tunisia 9,349 6.0 44.4Yemen, Rep. of 2,473 1.9 26.6
Sub-Saharan Africa 76,253 4.8 22.3
Angola 2,477 9.2 27.1Botswana 2,258 3.6 34.1Côte d’Ivoire 2,741 �0.2 28.3Cameroon 1,359 �3.6 13.5Ethiopia 1,019 �0.8 15.7Gabon 1,034 3.5 18.8Ghana 2,326 9.2 30.6Kenya 3,279 0.3 27.9Madagascar 954 7.6 20.9Nigeria 10,598 2.7 25.7Senegal 1,351 1.5 29.2
Sub-Saharan Africa (continued)
South Africa 27,873 5.5 25.3Sudan 1,439 2.4 11.5Zambia 1,018 2.8 27.9Zimbabwe 920 �5.9 10.2
High-income countries 4,703,638 6.9 18.9
Industrial countries 4,188,176 6.9 17.4
G-7 countries 3,037,774 6.7 14.7Canada 226,372 6.7 32.1France 307,429 5.5 23.5Germany 457,102 5.1 24.6Italy 243,055 3.9 22.3Japan 312,894 5.2 7.5United Kingdom 324,362 6.9 22.8United States 1,166,561 9.3 11.6
Other industrial 1,150,401 7.3 33.3Australia 61,856 7.0 17.2Austria 64,325 6.1 34.2Belgiuma 168,485 38.4 73.3Denmark 43,956 3.3 27.2Finland 30,341 3.8 24.9Greece 29,684 6.0 25.5Iceland 2,066 3.4 27.4Ireland 51,300 9.7 49.7Korea, Rep. of 141,096 7.1 33.4Netherlands 174,344 6.9 45.8New Zealand 12,447 5.3 25.8Norway 33,682 2.4 20.0Portugal … … …Spain 146,449 7.5 25.1Sweden 62,331 5.4 29.7Switzerland 89,251 3.2 36.3
Other high-income 515,462 7.4 67.6
Bahrain 4,929 1.8 83.3Brunei 1,427 1.9 48.4Hong Kong, China 198,588 7.8 21.1
Israel 35,111 7.1 30.3Kuwait 6,764 3.0 19.8Qatar … … …Singapore 109,852 7.0 28.3Taiwan, China 107,298 6.8 38.1United Arab Emirates 39,769 11.1 82.6
Imports Growth Share Imports Growth Share Imports Growth Share
CIF is cost insurance and freight.a. Includes LuxembourgSource: See Technical Notes.
gep_app03.qxd 12/5/02 12:18 PM Page 206

G L O B A L E C O N O M I C I N D I C A T O R S
207
30
20
10
0
Source: World Bank data.
Figure A3.6a Merchandise imports as share of GDP, 2001(percent)
World
Industrialcountries
Sub-Saharan
Africa
East Asiaand Pacific
SouthAsia
LatinAmerica and
the Caribbean
EasternEurope andCentral Asia
MiddleEast and
North Africa
15
10
5
0
Source: World Bank data.
Figure A3.6b Annual growth rate of import volumes, 1992–2001(percent)
World
Industrialcountries
Sub-Saharan
Africa
East Asiaand Pacific
SouthAsia
LatinAmerica and
the Caribbean
EasternEurope andCentral Asia
MiddleEast and
North Africa
gep_app03.qxd 12/5/02 12:18 PM Page 207

G L O B A L E C O N O M I C P R O S P E C T S 2 0 0 3
208
Table A3.7 Direction of merchandise trade, 2001(percentage of world trade)
Low- and middle-income importers
LatinMiddle America All
Sub East Europe East and low-Other All Other All Saha- Asia and and the and
United indus- indus- high- high- ran and South Central North Carib- middle-Source of exports States EU-15 Japan trial trial income income Africa Pacific Asia Asia Africa bean income World
High-income economies 12.8 27.8 3.3 6.6 52.1 5.7 57.8 0.9 6.1 0.8 3.4 1.5 4.5 17.1 74.9
Industrial 11.0 26.4 2.4 6.3 47.3 4.4 51.8 0.8 3.7 0.5 3.3 1.4 4.3 13.9 65.7United States … 2.6 1.0 3.4 7.4 1.1 8.5 0.1 0.8 0.1 0.2 0.2 2.8 4.2 12.8EU-15 3.7 20.4 0.7 2.2 27.2 1.4 28.6 0.5 0.9 0.2 2.9 0.8 0.9 6.2 34.8Japan 2.2 1.1 … 0.3 4.1 1.2 5.3 0.1 1.2 0.1 0.1 0.1 0.3 1.8 7.1Other industrial 4.5 2.0 0.4 0.3 7.3 0.3 7.6 0.0 0.3 0.1 0.1 0.1 0.1 0.8 8.4
Other high-income 1.9 1.4 0.9 0.3 4.8 1.2 6.0 0.1 2.4 0.3 0.1 0.1 0.2 3.2 9.2
Low- and middle-income economies 6.7 6.1 2.1 0.7 16.4 2.8 19.2 0.5 1.4 0.4 1.8 0.5 1.3 5.9 25.1
Sub-Saharan Africa 0.3 0.5 0.0 0.0 0.9 0.1 1.0 0.2 0.1 0.0 0.0 0.0 0.1 0.4 1.4East Asia and Pacific 1.9 1.3 1.5 0.3 5.5 2.0 7.5 0.1 0.7 0.2 0.2 0.1 0.2 1.6 9.1South Asia 0.3 0.3 0.0 0.0 0.7 0.1 0.8 0.0 0.1 0.1 0.0 0.0 0.0 0.3 1.1Europe andCentral Asia 0.3 0.8 0.3 0.0 1.7 0.3 2.0 0.1 0.3 0.1 0.1 0.1 0.0 0.6 2.6
Middle East andNorth Africa 0.3 0.8 0.3 0.0 1.7 0.3 2.0 0.1 0.3 0.1 0.1 0.1 0.0 0.6 2.6
Latin Americaand the Caribbean 3.6 0.7 0.1 0.2 4.6 0.1 4.7 0.0 0.1 0.0 0.1 0.1 0.9 1.2 5.9
World 19.5 33.9 5.5 7.3 68.5 8.5 77.0 1.4 7.5 1.2 5.2 2.0 5.8 23.0 100.0
EU is European Union.a. Expressed as a share (percent ) of total world exports. World merchandise exports in 2001 amounted to some $6,000 billion.b. Other high-income group includes the Asian newly industrializing economies, several oil exporters in the Gulf region, and Israel.Source: International Monetary Fund, Direction of Trade Statistics.
High-income importers
gep_app03.qxd 12/5/02 12:18 PM Page 208

G L O B A L E C O N O M I C I N D I C A T O R S
209
Table A3.8 Growth of current dollar merchandise trade, by direction 1992–2001(average annual percentage growth)
Low- and middle-income importers
LatinMiddle America All
Sub East Europe East and low-Other All Other All Saha- Asia and and the and
United indus- indus- high- high- ran and South Central North Carib- middle-Source of exports States EU-15 Japan trial trial income income Africa Pacific Asia Asia Africa bean income World
High-income economies 6.7 1.7 2.7 4.3 3.2 5.5 3.4 1.7 9.1 5.2 8.2 0.4 8.7 7.0 4.1
Industrial 6.9 1.6 1.9 4.3 3.0 4.9 3.1 1.6 8.6 2.4 8.1 0.3 8.7 6.6 3.8United States … 3.0 1.8 6.4 4.2 5.2 4.3 3.8 9.4 4.0 3.0 0.4 9.9 8.2 5.5EU-15 8.0 1.4 2.6 2.6 2.2 6.6 2.4 1.6 7.6 1.1 9.3 0.1 7.4 5.9 2.9Japan 2.9 �0.7 … �0.5 1.5 2.8 1.8 �2.6 7.2 �1.0 �1.9 �2.5 3.2 4.3 2.3Other industrial 8.8 2.8 0.3 3.8 5.9 3.2 5.8 2.7 6.0 5.8 1.4 3.4 6.1 4.6 5.7
Other high-income 5.5 4.8 5.1 3.7 5.4 7.7 5.8 2.6 10.0 12.1 11.5 1.6 8.0 9.4 6.9
Low- and middle-income economies 12.2 6.9 6.9 9.0 9.0 7.7 8.8 12.8 15.6 11.0 9.5 5.5 11.2 11.0 9.3
Sub-Saharan Africa 9.1 4.9 9.1 7.5 6.9 24.0 7.5 12.4 22.1 17.9 9.0 8.9 16.8 14.6 9.1East Asia and Pacific 15.5 11.5 9.8 13.1 12.3 7.4 10.7 16.4 16.4 14.6 12.2 8.2 22.0 15.1 11.4South Asia 12.5 5.8 0.5 7.5 7.8 9.8 8.1 11.7 15.6 11.6 �2.3 4.8 24.3 8.4 8.2Europe andCentral Asia 1.3 2.4 3.8 0.4 3.1 5.9 3.5 16.0 18.5 7.8 �2.7 3.4 0.0 7.5 4.3
Middle East andNorth Africa 1.3 2.4 3.8 0.4 3.1 5.9 3.5 16.0 18.5 7.8 �2.7 3.4 0.0 7.5 4.3
Latin Americaand the Caribbean 12.6 2.5 �0.9 9.0 9.6 2.1 9.5 7.7 13.1 10.0 8.3 5.7 10.3 10.0 9.6
World 8.2 2.4 4.1 4.7 4.3 6.2 4.5 4.3 10.1 7.0 8.6 1.4 9.2 7.9 5.2
EU is European Union.Note: Growth rates are compound averages.Source: International Monetary Fund, Direction of Trade Statistics.
High-income importers
gep_app03.qxd 12/5/02 12:18 PM Page 209

G L O B A L E C O N O M I C P R O S P E C T S 2 0 0 3
210
Table A3.9 Structure of long-term debt, 2000Share of long-term debt (percent): concessional debt; nonconcessional debt at variable interest rates; nonconcessional debt atfixed interest rates
Nonconcessional
Concessional Variable Fixed
Nonconcessional
Concessional Variable Fixed
Note: Nonconcessional debt data are available only for countries which report to the World Bank’s Debtor Reporting System. Foraggregate figures, missing values are assumed to have the same average value as the available data.Source: World Bank data; see Technical Notes.
All developing countries 18.7 40.3 41.0
Asia 28.5 38.3 33.2East Asia 20.1 44.9 35.0China 20.9 26.4 52.7Indonesia 27.9 61.8 10.4Korea, Rep. of 1.8 53.8 44.4Malaysia 6.1 60.7 33.2Myanmar 79.6 10.4 10.0Papua New
Guinea 36.1 12.3 51.6Philippines 29.6 33.0 37.4Thailand 14.9 52.0 33.1Vietnam 68.2 16.6 15.3
South Asia 55.5 17.4 27.0Bangladesh 97.9 0.0 2.1India 39.4 20.2 40.4Nepal 99.8 0.0 0.2Pakistan 60.7 27.3 12.1Sri Lanka 85.7 5.8 8.5
Latin America 4.7 56.1 39.2Argentina 1.5 45.5 53.0Bolivia 60.3 27.0 12.7Brazil 1.1 76.1 22.8Chile 1.0 55.2 43.7Colombia 3.1 60.8 36.1Costa Rica 16.7 24.1 59.2Dominican Republic 42.7 33.7 23.6Ecuador 16.7 29.9 53.4El Salvador 38.9 34.4 26.7Guatemala 40.3 30.1 29.6Jamaica 25.9 24.4 49.7Mexico 0.8 44.5 54.7Nicaragua 53.6 22.2 24.2Panama 5.6 45.1 49.3Paraguay 34.4 44.0 21.7Peru 16.3 58.4 25.3Trinidad and Tobago 0.6 39.2 60.3Uruguay 3.5 51.0 45.5Venezuela, R. B. de 0.2 60.3 39.5
Europe and Central Asia 5.9 34.8 59.3
Armenia 71.7 18.0 10.3Azerbaijan 50.4 23.4 26.3Belarus 12.0 59.6 28.3
Europe and Central Asia (continued)
Bulgaria 4.3 75.9 19.7Czech Republic 1.8 27.4 70.9Estonia 1.6 23.6 74.8Georgia 61.0 8.8 30.1Hungary 1.2 17.7 81.0Kazakhstan 3.6 16.8 79.6Kyrgyz Republic 58.3 15.6 26.1Latvia 5.5 60.4 34.1Lithuania 3.2 21.0 75.8Moldova 19.3 45.0 35.6Poland 12.1 56.0 31.9Romania 3.4 41.9 54.7Russian Federation 0.3 19.7 80.0Slovak Republic 3.9 22.6 73.6Tajikistan 76.6 7.7 15.8Turkmenistan … … …Turkey 5.9 45.3 48.7Ukraine 23.3 35.0 41.6Uzbekistan 22.3 58.2 19.5
Middle East and N. Africa 36.9 28.8 34.3
Algeria 13.3 49.8 36.9Egypt, Arab Rep. of 84.5 6.2 9.3Jordan 56.1 30.2 13.7Morocco 31.5 32.4 36.1Oman 16.7 30.6 52.7Syrian Arab Rep. of 93.0 0.0 7.0Tunisia 26.8 20.8 52.4Yemen, Rep. of 95.9 1.8 2.3
Sub-Saharan Africa 47.5 11.2 41.4Angola 22.4 9.9 67.6Botswana 64.2 10.2 25.6Côte d’Ivoire 39.1 46.6 14.3Cameroon 54.6 11.0 34.4Ethiopia 90.3 0.2 9.5Gabon 39.6 9.5 50.9Ghana 82.2 4.6 13.2Kenya 76.4 5.9 17.7Madagascar 66.9 5.0 28.1Nigeria 4.4 6.0 89.6Senegal 86.8 9.5 3.7South Africa 0.0 20.2 79.8Sudan 50.0 17.9 32.2Zambia 79.3 6.1 14.7Zimbabwe 46.5 21.2 32.4
gep_app03.qxd 12/5/02 12:18 PM Page 210

G L O B A L E C O N O M I C I N D I C A T O R S
211
100
60
80
20
40
0
Source: World Bank data.
Figure A3.9a Structure of long-term debt, by group, 2000(percent)
Severelyindebted
low-incomecountries
Moderatelyindebted
low-incomecountries
Severelyindebted
middle-incomecountries
Moderatelyindebted
middle-incomecountries
Othercountries
Concessional
Variable rate
Fixed rate
100
60
80
20
40
0
Source: World Bank data.
Figure A3.9b Structure of long-term debt, by region, 2000(percent)
Sub-SaharanAfrica
East Asiaand Pacific
South Asia Europeand Central
Asia
LatinAmerica and
the Caribbean
MiddleEast and
North Africa
Concessional
Variable rate
Fixed rate
140
80
100
120
20
40
60
0
Source: World Bank data.
Figure A3.9c Top ten ratios of nonconcessional debt to GDP, 2000(percent)
Nic
arag
ua
Con
go,
Dem
. Rep
. of
Nig
eria
Yugo
slav
ia,
Fed.
Rep
. of
Ecua
dor
Bulg
aria
Mol
dova
Moz
ambi
que
Ango
la
Con
go, R
ep. o
f
gep_app03.qxd 12/5/02 12:18 PM Page 211

G L O B A L E C O N O M I C P R O S P E C T S 2 0 0 3
212
Table A3.10 Long-term net resource flows to developing countries, 2000(millions of dollars)
PrivateOfficial
Total Percent Debt flowsmillions $ GDP Total (net) FDI Portfolio Total ODA Other
All developing countries 261,133 4.3 225,846 8,288 166,691 50,867 35,287 38,088 �2,801
Asia 87,822 4.0 74,947 �14,686 55,223 34,411 12,874 10,918 1,956East Asia 74,556 4.7 65,693 �18,721 52,130 32,285 8,863 6,649 2,214China 60,525 5.6 58,295 �2,302 38,399 22,198 2,230 992 1,238Indonesia �9,156 �6.0 �11,210 �7,039 �4,550 379 2,053 1,173 881Korea, Rep. of 13,875 3.0 13,215 �3,852 9,283 7,784 660 �73 733Malaysia 3,411 3.8 3,229 1,027 1,660 542 182 52 131Myanmar 244 ... 188 �66 255 0 55 55 0Papua New Guinea 335 9.6 128 �50 130 48 207 118 90Philippines 2,401 3.2 2,459 140 2,029 290 �57 528 �585Thailand �525 �0.4 �1,383 �5,793 3,366 1,044 858 1,129 �271Vietnam 1,790 5.7 581 �717 1,298 0 1,209 1,195 14
South Asia 13,265 2.2 9,254 4,035 3,093 2,126 4,011 4,269 �258Bangladesh 1,207 2.6 269 �14 280 3 938 931 7India 9,928 2.2 8,771 4,340 2,315 2,117 1,157 1,463 �306Nepal 237 4.3 �4 �8 4 0 240 240 0Pakistan 526 0.9 �53 �361 308 0 578 580 �1Sri Lanka 530 3.3 262 83 173 6 268 239 28
Latin America 99,315 4.9 97,304 12,839 75,088 9,378 2,010 3,245 �1,235Argentina 16,719 5.9 16,620 4,504 11,665 450 100 �222 321Bolivia 1,230 14.8 923 190 733 0 307 341 �34Brazil 43,934 7.4 45,672 7,877 32,779 5,016 �1,738 340 �2,078Chile 4,733 6.7 4,834 1,141 3,675 18 �101 0 �101Colombia 3,312 4.0 3,130 728 2,376 26 182 119 63Costa Rica 573 3.6 610 201 409 0 �36 �31 �6Dominican Republic 1,103 5.6 1,142 115 953 74 �40 �22 �17Ecuador 1,172 8.6 904 194 710 0 268 98 170El Salvador 467 3.5 338 153 185 0 129 56 73Guatemala 415 2.2 178 �52 230 0 238 173 65Jamaica 972 12.6 898 442 456 0 74 �8 81Mexico 11,035 1.9 11,536 �5,267 13,286 3,517 �502 �80 �422Nicaragua 797 38.5 395 141 254 0 401 429 �28Panama 946 9.4 947 344 603 0 �1 �15 14Paraguay 99 1.3 �16 �98 82 0 115 12 103Peru 2,291 4.3 1,553 668 680 205 738 613 125Trinidad and Tobago 633 8.2 673 23 650 0 �40 0 �39Uruguay 719 3.6 574 276 298 0 145 �8 152Venezuela, R. B. de 5,708 4.7 5,454 919 4,464 71 254 57 197
Europe and Central Asia 54,000 5.8 45,446 11,560 28,495 5,391 8,553 8,138 416Armenia 270 14.1 159 19 140 0 111 119 �8Azerbaijan 305 5.8 175 45 130 0 130 168 �38Belarus 125 1.2 122 32 90 0 3 26 �23Bulgaria 1,363 11.4 1,114 107 1,002 5 249 337 �87Czech Republic 3,441 6.8 3,299 �1,901 4,583 617 142 154 �12Estonia 514 10.3 485 126 387 �29 29 48 �19Georgia 207 6.8 155 24 131 0 52 64 �12Hungary 1,643 3.6 1,721 29 1,692 0 �78 11 �89Kazakhstan 1,979 10.8 1,900 650 1,250 0 80 111 �31Kyrgyz Republic 112 8.2 �65 �62 �2 0 177 178 �1Latvia 669 9.4 583 176 407 0 86 50 36Lithuania 910 8.0 799 269 379 151 111 63 48Moldova 269 20.9 209 81 128 0 60 62 �2Poland 13,413 8.5 13,195 2,982 9,342 871 218 470 �251Romania 2,606 7.1 1,900 875 1,025 0 706 177 529Russian Federation 2,508 1.0 2,200 �1,589 2,714 1,075 308 661 �354Slovak Republic 2,234 11.7 2,185 133 2,052 0 49 51 �3Tajikistan 134 13.5 64 40 24 0 70 70 0Turkmenistan … … … … … … … … …Turkey 12,217 6.1 11,416 7,733 982 2,701 801 37 763Ukraine 169 0.5 927 332 595 0 �759 �785 26Uzbekistan 303 2.2 18 �82 100 0 284 261 24
Middle East and N. Africa 1,470 0.2 1,074 �931 1,209 795 396 3,223 �2,827Algeria �1,678 �3.1 �1,212 �1,226 10 4 �465 �81 �384Egypt, Arab Rep. of 2,312 2.3 1,967 114 1,235 619 345 541 �196Iran, Islamic Rep. of �2,253 �2.2 �610 �649 39 0 �1,643 �11 �1,632Jordan 807 9.6 455 �115 558 12 352 369 �17Morocco �460 �1.4 �293 �449 10 147 �167 96 �263Oman 69 0.5 57 23 23 11 12 21 �9Syrian Arab Rep. 68 2.1 107 �4 111 0 �40 �14 �26Tunisia 1,009 5.2 966 214 752 0 44 190 �146Yemen, Rep. of �12 �0.1 �201 0 �201 0 189 210 �21
gep_app03.qxd 12/5/02 12:18 PM Page 212

G L O B A L E C O N O M I C I N D I C A T O R S
213
Sub-Saharan Africa 18,527 5.7 7,074 �494 6,676 893 11,453 12,563 �1,110Angola 1,407 15.9 1,206 �492 1,698 0 201 230 �29Botswana 11 0.2 27 �3 30 0 �16 10 �26Côte d’Ivoire 56 0.5 �47 �159 106 6 103 237 �134Cameroon 185 2.1 �21 �52 31 0 205 292 �87Ethiopia 587 9.2 42 �8 50 0 545 565 �20Gabon �24 �0.5 142 �8 150 0 �166 9 �175Ghana 483 9.7 71 �57 110 17 412 442 �29Kenya 374 3.6 53 �61 111 4 321 403 �82Madagascar 298 7.7 83 0 83 0 215 219 �3Nigeria 706 1.7 907 �177 1,082 2 �201 113 �314Senegal 349 8.0 106 �2 107 0 243 276 �33South Africa 2,957 2.3 2,736 911 961 864 221 219 3Sudan 563 5.0 392 0 392 0 171 173 �2Zambia 778 24.0 191 �9 200 0 587 620 �33Zimbabwe 108 1.5 29 �50 79 1 79 145 �66
Table A3.10 Long-term net resource flows to developing countries, 2000 (continued)(millions of dollars)
PrivateOfficial
Total Percent Debt flowsMillions $ GDP Total (net) FDI Portfolio Total ODA Other
Source: World Bank data.
Figure A3.10a Distribution of long-term net resource flows, 2000(percent)
Sub-SaharanAfrica
East Asiaand Pacific
South Asia LatinAmerica and
the Caribbean
Europeand Central
Asia
Middle Eastand North
Africa
40
0
20
100
80
60Private
Official
Source: World Bank data.
Figure A3.10b Change in share of private long-term flows, 1990–2000(percent)
Sub-SaharanAfrica
East Asiaand Pacific
South Asia LatinAmerica and
the Caribbean
Europeand Central
Asia
Middle Eastand North
Africa
40
0
20
80
60
FDI is foreign direct investment; ODA is official development assistance.Source: World Bank data; see Technical Notes.
gep_app03.qxd 12/5/02 12:18 PM Page 213
Technical Notes
millions of current U.S. dollars, while growthrates are based on constant price data, whichare derived from current values deflated byrelevant price indices or unit value measures.Effective market growth (EMG) in table A.3.5is the export-weighted growth of each coun-try’s trading partner imports.
Tables A3.7 and A3.8. The IMF’s Direc-tion of Trade database serves as the underly-ing source for the bilateral trade share- andgrowth information highlighted in these tables.Growth rates are compound annual averages,and are computed from current U.S. dollarmeasures of trade flows.
Table A3.9. Long-term debt covers publicand publicly guaranteed debt but excludesIMF credits. Concessional debt is that with anoriginal grant element of 25 percent or more.Nonconcessional variable interest-rate debtincludes all public and publicly guaranteedlong-term debt with an original grant elementof less-than 25 percent, whose terms dependon movements in a key market interest rate.This item conveys information about the bor-rower’s exposure to changes in internationalinterest rates.
Table A3.10. Long-term net resourceflows are the sum of net resource flows onlong-term debt (excluding IMF) plus non-debt-creating flows. Foreign direct investment refersto net inflows of investment from abroad.Portfolio equity flows are the sum of countryfunds, depository receipts and direct purchasesof shares by foreign investors.
214
The principal sources for the data in this ap-pendix are the World Bank’s central databasesand several International Monetary Funddatabases, combined with data sourced fromthe OECD and from Oxford Economics Inc.(OEF), covering the industrial and other high-income economies. The cut-off date for dataupdates was November 15, 2002. Data revi-sions and new releases since that time have notbeen incorporated in the tables. Regional ag-gregates are based on the classification ofeconomies by income group and by region, fol-lowing the Bank’s standard definitions (seecountry classification tables that follow).
Debt and finance data (appendix ta-bles A3.9 and A3.10) cover the 137 countriesthat report to the World Bank’s Debtor Re-porting System (DRS), supplemented by datafor non-DRS countries, for which commercialmarket information has been utilized. Smallcountries have generally been omitted from thetables, but are included in the regional totals.Current price data are reported in U.S. dollars.
Notes on tablesTables A3.1 through A3.4. Historic data
sourced from the databases noted above, whileprojections are consistent with those high-lighted in chapter 1 and appendix 1.
Tables A3.5 and A3.6. Merchandise tradedata is sourced from combined IMF, WorldBank, OECD, and OEF sources. Merchandiseexports and imports exclude trade in services.Imports are reported on a cost-insurance-and-freight basis. Trade values are expressed in
gep_app03.qxd 12/5/02 12:18 PM Page 214

Classificationof Economies
gep_app03.qxd 12/5/02 12:18 PM Page 215

G L O B A L E C O N O M I C P R O S P E C T S 2 0 0 3
216
Classification of economies by income and region, July 2002
Europe and Middle EastSub-Saharan Africa Asia Central Asia and North Africa Americas
East and EasternIncome Southern West East Asia South Europe and Rest of Middle Northgroup Subgroup Africa Africa and Pacific Asia Central Asia Europe East Africa
Low-incomecountries
BeninBurkina FasoCameroonCentral
AfricanRepublic
ChadCongo, Rep. ofCôte d’IvoireEquatorial
GuineaGambia, TheGhanaGuineaGuinea-BissauLiberiaMaliMauritaniaNigerNigeriaSão Tomé
and PrincipeSenegal
Sierra LeoneTogo
CambodiaIndonesiaKorea, Dem.
Rep.Lao PDRMongoliaMyanmarPapua New
GuineaSolomon
IslandsTimor-LesteVietnam
AfghanistanBangladeshBhutanIndiaNepalPakistan
ArmeniaAzerbaijanGeorgiaKyrgyz
RepublicMoldovaTajikistanUkraineUzbekistan
Yemen, Rep. of
HaitiNicaragua
Middle-incomecountries
Subtotal
Lower
Upper
156
NamibiaSouth AfricaSwaziland
BotswanaMauritiusMayotteSeychelles
25
Cape Verde
Gabon
23
ChinaFijiKiribatiMarshall
IslandsMicronesia,
Fed. Sts. ofPhilippinesSamoaThailandTongaVanuatu
AmericanSamoa
MalaysiaPalau
23
MaldivesSri Lanka
8
Turkey
Isle of Man
2
Iran, IslamicRep. of
IraqJordanSyrian Arab
RepublicWest Bank
and Gaza
LebanonOmanSaudi
Arabia
9
AlgeriaDjiboutiEgypt, Arab
Rep. ofMoroccoTunisia
LibyaMalta
7
BelizeBoliviaColombiaCubaDominican
RepublicEcuadorEl SalvadorGuatemalaGuyanaHondurasJamaicaParaguayPeruSt. Vincent and the Grenadines
Suriname
Antigua andBarbuda
ArgentinaBarbadosBrazilChileCosta RicaDominicaGrenadaMexicoPanamaPuerto RicoSt. Kitts and
NevisSt. LuciaTrinidad
and TobagoUruguayVenezuela,
R. B. de
33
AngolaBurundiComorosCongo, Dem.
Rep. ofEritreaEthiopiaKenyaLesothoMadagascarMalawiMozambiqueRwandaSomaliaSudanTanzaniaUgandaZambiaZimbabwe
AlbaniaBelarusBosnia andHerzegovina
BulgariaKazakhstanMacedonia,
FYRa
RomaniaRussian
FederationTurkmenistanYugoslavia,
Fed. Rep. of
CroatiaCzech
RepublicEstoniaHungaryLatviaLithuaniaPolandSlovak
Republic
26
gep_app03.qxd 12/5/02 12:18 PM Page 216

R E G I O N A L E C O N O M I C P R O S P E C T S
217
Definition of groupsFor operational and analytical purposes, the World Bank’smain criterion for classifying economies is gross nationalincome (GNI) per capita. Every economy is classified aslow income, middle income (subdivided into lower middleand upper middle), or high income. Other analytical groups,based on geographic regions and levels of external debt, arealso used.
Low-income and middle-income economies are sometimesreferred to as developing economies. The use of the term isconvenient; it is not intended to imply that all economies in
the group are experiencing similar development or thatother economies have reached a preferred or final stage ofdevelopment. Classification by income does not necessarilyreflect development status.
This table classifies all World Bank member economies,and all other economies with populations of more than30,000. Economies are divided among income groups accord-ing to 2001 GNI per capita, calculated using the World BankAtlas method. The groups are: low income, $745 or less;lower middle income, $746–$2,975; upper middle income,$2,976–$9,205; and high income, $9,206 or more.
High-incomecountries
AustraliaJapanKorea, Rep. ofNew Zealand
CanadaUnited
States
OECD
Total
Non-OECD
209 25 23
BruneiFrench
PolynesiaGuamHong Kong,
Chinac
Macao,Chinad
NewCaledonia
N. MarianaIslands
SingaporeTaiwan,
China
36 8
Slovenia
27
AndorraChannel
IslandsCyprusFaeroe
IslandsGreenlandLiechtensteinMonacoSan Marino
28
ArubaBahamas, The
BermudaCayman
IslandsNetherlands
AntillesVirgin
Islands (U.S.)
41
AustriaBelgiumDenmarkFinlandFranceb
GermanyGreeceIcelandIrelandItalyLuxembourgNetherlandsNorwayPortugalSpainSwedenSwitzerlandUnited
Kingdom
a. Former Yugoslav Republic of Macedonia.b. The French overseas departments French Guiana, Guadeloupe, Martinique, and Réunion are included in France.c. On 1 July 1997 China resumed its exercise of sovereignty over Hong Kong.d. On 20 December 1999 China resumed its exercise of sovereignty over Macao.Source: World Bank data.
BahrainIsraelKuwaitQatarUnited Arab
Emirates
14
Classification of economies by income and region, July 2002 (continued)
Europe and Middle EastSub-Saharan Africa Asia Central Asia and North Africa Americas
East and EasternIncome Southern West East Asia South Europe and Rest of Middle Northgroup Subgroup Africa Africa and Pacific Asia Central Asia Europe East Africa
7
gep_app03.qxd 12/5/02 12:18 PM Page 217

G L O B A L E C O N O M I C P R O S P E C T S 2 0 0 3
218
Timor-Leste
Marshall IslandsMicronesia, Fed. Sts.West Bank and Gaza
American SamoaIsle of ManMayottePalauPuerto Rico
Low-incomecountries
Middle-incomecountries
Lower
Upper
Afghanistan LiberiaAngola MadagascarBenin MalawiBurundi MauritaniaCameroon MyanmarCentral African Nicaragua
Republic NigerChad NigeriaComoros PakistanCongo, Dem. Rwanda
Rep. of São ToméCongo, Rep. of and PrincipeCôte d’Ivoire Sierra LeoneEthiopia SomaliaGuinea SudanGuinea-Bissau TajikistanIndonesia TanzaniaKyrgyz ZambiaRepublic
Lao PDR
CubaEcuadorGuyanaIraqJordanPeruSyrian Arab
Republic
ArgentinaBrazilGabon
Burkina FasoCambodiaGambia, TheGhanaHaitiKenyaMaliMoldovaMongoliaMozambiquePapua New
GuineaSenegalTogoUgandaUzbekistanYemen, Rep. ofZimbabwe
AlgeriaBelizeBoliviaBosnia and
HerzegovinaBulgariaColombiaHondurasJamaicaPhilippinesRussian
FederationSamoaSt. Vincent and
the GrenadinesThailandTunisiaTurkeyTurkmenistan
ChileCroatiaEstoniaHungaryLebanonMalaysiaMauritiusPanamaUruguayVenezuela, R. B. de
ArmeniaAzerbaijanBangladeshBhutanEquatorial
GuineaEritreaGeorgiaIndiaKorea,
Dem. Rep. ofLesothoNepalSolomon
IslandsUkraineVietnam
Albania MoroccoBelarus NamibiaCape Verde ParaguayChina RomaniaDjibouti South AfricaDominican Sri Lanka
Republic SurinameEgypt, Arab Swaziland
Rep. of TongaEl Salvador VanuatuFiji Yugoslavia,Guatemala Fed. Rep. ofIran, Islamic
Rep. ofKazakhstanKiribatiMacedonia,
FYRa
Maldives
Antigua and MexicoBarbuda Oman
Barbados PolandBotswana Saudi ArabiaCosta Rica SeychellesCzech Slovak
Republic RepublicDominica St. Kitts andGrenada NevisLatvia St. LuciaLibya Trinidad andLithuania TobagoMalta
Classification of economies by income and indebtedness, July 2002
Income Sub- Not classifiedgroup group Severely indebted Moderately indebted Less indebted by indebtedness
gep_app03.qxd 12/5/02 12:18 PM Page 218
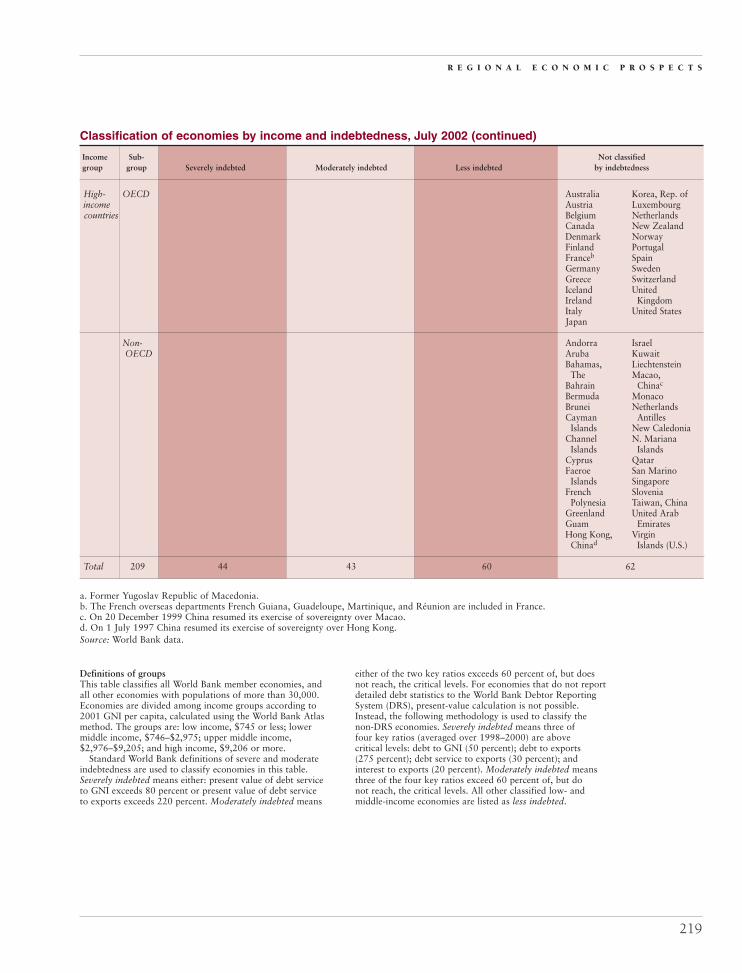
R E G I O N A L E C O N O M I C P R O S P E C T S
219
Australia Korea, Rep. ofAustria LuxembourgBelgium NetherlandsCanada New ZealandDenmark NorwayFinland PortugalFranceb SpainGermany SwedenGreece SwitzerlandIceland UnitedIreland KingdomItaly United StatesJapan
Andorra IsraelAruba KuwaitBahamas, Liechtenstein
The Macao,Bahrain Chinac
Bermuda MonacoBrunei NetherlandsCayman Antilles
Islands New CaledoniaChannel N. Mariana
Islands IslandsCyprus QatarFaeroe San Marino
Islands SingaporeFrench Slovenia
Polynesia Taiwan, ChinaGreenland United ArabGuam EmiratesHong Kong, Virgin
Chinad Islands (U.S.)
62
Definitions of groupsThis table classifies all World Bank member economies, andall other economies with populations of more than 30,000.Economies are divided among income groups according to2001 GNI per capita, calculated using the World Bank Atlasmethod. The groups are: low income, $745 or less; lowermiddle income, $746–$2,975; upper middle income,$2,976–$9,205; and high income, $9,206 or more.
Standard World Bank definitions of severe and moderateindebtedness are used to classify economies in this table.Severely indebted means either: present value of debt serviceto GNI exceeds 80 percent or present value of debt serviceto exports exceeds 220 percent. Moderately indebted means
either of the two key ratios exceeds 60 percent of, but doesnot reach, the critical levels. For economies that do not reportdetailed debt statistics to the World Bank Debtor ReportingSystem (DRS), present-value calculation is not possible.Instead, the following methodology is used to classify thenon-DRS economies. Severely indebted means three offour key ratios (averaged over 1998–2000) are abovecritical levels: debt to GNI (50 percent); debt to exports(275 percent); debt service to exports (30 percent); andinterest to exports (20 percent). Moderately indebted meansthree of the four key ratios exceed 60 percent of, but donot reach, the critical levels. All other classified low- andmiddle-income economies are listed as less indebted.
High-incomecountries
Total
OECD
Non-OECD
209 44 43 60
Classification of economies by income and indebtedness, July 2002 (continued)
Income Sub- Not classifiedgroup group Severely indebted Moderately indebted Less indebted by indebtedness
a. Former Yugoslav Republic of Macedonia.b. The French overseas departments French Guiana, Guadeloupe, Martinique, and Réunion are included in France.c. On 20 December 1999 China resumed its exercise of sovereignty over Macao.d. On 1 July 1997 China resumed its exercise of sovereignty over Hong Kong.Source: World Bank data.
gep_app03.qxd 12/5/02 12:18 PM Page 219