Geothermal regime of the Williston Basin in North Dakota
52
University of North Dakota UND Scholarly Commons eses and Dissertations eses, Dissertations, and Senior Projects 2015 Geothermal regime of the Williston Basin in North Dakota Faye N. Ricker University of North Dakota Follow this and additional works at: hps://commons.und.edu/theses Part of the Geology Commons is esis is brought to you for free and open access by the eses, Dissertations, and Senior Projects at UND Scholarly Commons. It has been accepted for inclusion in eses and Dissertations by an authorized administrator of UND Scholarly Commons. For more information, please contact [email protected]. Recommended Citation Ricker, Faye N., "Geothermal regime of the Williston Basin in North Dakota" (2015). eses and Dissertations. 246. hps://commons.und.edu/theses/246
Transcript of Geothermal regime of the Williston Basin in North Dakota

University of North DakotaUND Scholarly Commons
Theses and Dissertations Theses, Dissertations, and Senior Projects
2015
Geothermal regime of the Williston Basin in NorthDakotaFaye N. RickerUniversity of North Dakota
Follow this and additional works at: https://commons.und.edu/theses
Part of the Geology Commons
This Thesis is brought to you for free and open access by the Theses, Dissertations, and Senior Projects at UND Scholarly Commons. It has beenaccepted for inclusion in Theses and Dissertations by an authorized administrator of UND Scholarly Commons. For more information, please [email protected].
Recommended CitationRicker, Faye N., "Geothermal regime of the Williston Basin in North Dakota" (2015). Theses and Dissertations. 246.https://commons.und.edu/theses/246
GEOTHERMAL REGIME OF THE WILLISTON BASIN IN NORTH DAKOTA
by
Faye Nicole Ricker
Bachelor of Science, University of Florida, 2013
A Thesis
Submitted to the Graduate Faculty
of the
University of North Dakota
in partial fulfillment of the requirements
for the degree of
Master of Science
Grand Forks, North Dakota
May
2015
ii
This thesis, submitted by Faye Nicole Ricker in partial fulfillment of the
requirements for the Degree of Master of Science from the University of North Dakota,
has been read by the Faculty Advisory Committee under whom the work has been done
and is hereby approved.
__________________________________________
William D. Gosnold, Ph.D, Chairperson
__________________________________________
Phillip J. Gerla, Ph.D, Committee Member
__________________________________________
Ronald K. Matheney, Ph.D, Committee Member
This thesis is being submitted by the appointed advisory committee as having met
all of the requirements of the School of Graduate Studies at the University of North
Dakota and is hereby approved.
____________________________________
Wayne Swisher
Dean of the School of Graduate Studies
____________________________________
Date
iii
PERMISSION
Title Geothermal Regime of the Williston Basin in North Dakota
Department Geology
Degree Master of Science
In presenting this thesis in partial fulfillment of the requirements for a graduate
degree from the University of North Dakota, I agree that the library of this University shall
make it freely available for inspection. I further agree that permission for extensive copying
for scholarly purposes may be granted by the professor who supervised my thesis work or, in
his absence, by the Chairperson of the department or the dean of the School of Graduate
Studies. It is understood that any copying or publication or other use of this thesis or part
thereof for financial gain shall not be allowed without my written permission. It is also
understood that due recognition shall be given to me and to the University of North Dakota in
any scholarly use which may be made of any material in my thesis.
Faye Nicole Ricker
May 01, 2015

iv
TABLE OF CONTENTS
LIST OF FIGURES .......................................................................................................... vi
LIST OF TABLES ............................................................................................................ vii
ACKNOWLEDGMENTS ............................................................................................... vii
ABSTRACT ....................................................................................................................... ix
CHAPTER
I. INTRODUCTION ......................................................................................1
II. STUDY SETTING.......................................................................................4
Basin History ...................................................................................4
Hydrostratigraphy ............................................................................8
III. PREVIOUS WORKS.................................................................................13
Heat Generation and Heat Flow .....................................................14
IV. METHODS ................................................................................................16
Gravity and Magnetics ...................................................................16
Radiogenic Heat Generation ..........................................................17
Heat Flow From the Mantle ...........................................................18
Heat Flow in the Sedimentary Succession .....................................20
V. RESULTS AND DISCUSSION ................................................................22
Radiogenic Heat Generation ..........................................................22
Heat Flow From the Mantle ...........................................................22

v
Heat Flow in the Sedimentary Succession .....................................23
Basement Structure and Uranium Mineralization ..........................29
Concerning Paleo-heat Flow ..........................................................31
Play-fairway Analysis ....................................................................32
VI. CONCLUSION ..........................................................................................34
VII. APPENDIX ................................................................................................36
VIII. REFERENCES ..........................................................................................37
vi
LIST OF FIGURES
Figure Page
1. Location and outline of the Williston Basin showing major
basement structures ...............................................................................................5
2. Map of basement units in North Dakota interpreted from
gravity and magnetic data .....................................................................................7
3. Hydrostratigraphic column of North Dakota portion of the
Williston Basin with different colors representing different
hydrostratigraphic units ............................................................................................ 9
4. General direction of groundwater flow in regional Paleozoic
aquifer systems ...................................................................................................12
5. Gravity (A) and Magnetic (B) anomaly intensities ............................................13
6. Crustal thickness in North Dakota from EARS data ..........................................19
7. Surface heat flow in North Dakota .....................................................................20
8. Radiogenic heat production from basement rocks underlying the
Williston Basin of North Dakota ........................................................................25
9. Heat flow through progressively younger formations in the
Williston Basin ...................................................................................................29
vii
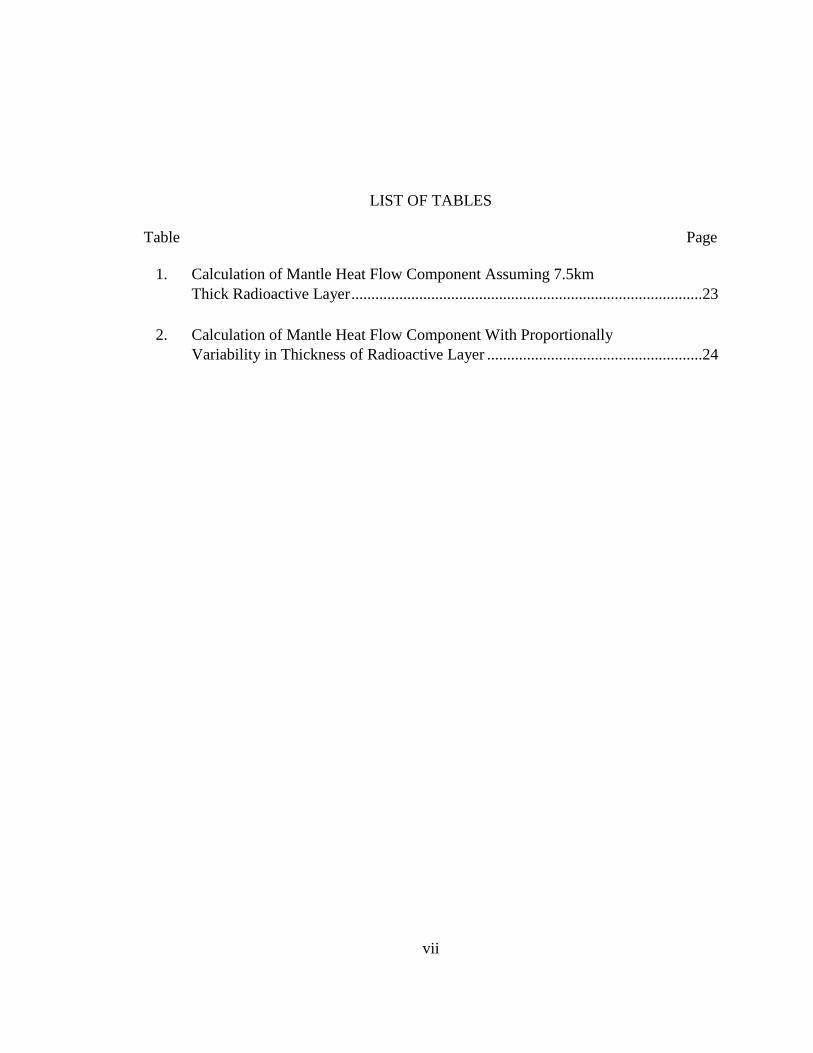
LIST OF TABLES
Table Page
1. Calculation of Mantle Heat Flow Component Assuming 7.5km
Thick Radioactive Layer ........................................................................................23
2. Calculation of Mantle Heat Flow Component With Proportionally
Variability in Thickness of Radioactive Layer ......................................................24
viii
ACKNOWLEDGMENTS
I first wish to thank Dr. William Gosnold for serving as my teacher, mentor,
advisor, invaluable encyclopedia of information, committee chairman, and tireless
encourager. I also wish to express my gratitude to Drs. Ronald Matheney and Phillip
Gerla, members of my advisory committee, for their guidance and support during my
research and their helpful insight during revisions. Thanks to the North Dakota
Geological Survey for the use of their core and Gamma Ray Spectrometer. Finally, thank
you to my wonderful friends here in North Dakota, back home in Florida, and scattered
elsewhere around the world; your companionship and conversation means so much!

To my loving family:
A “thank you” wouldn’t begin to cover it.

ix
ABSTRACT
Understanding the thermal regime of a large intracontinental basin such as the
Williston Basin can be enhanced by analysis of the relationships among radiogenic heat
production, surface heat flow, formation temperatures, and gravity and magnetic anomaly
patterns. Digital processing of the spatial and causal relationships gives insight into the
effect of basement heat production on the thermal state of the basement rocks and the
overlying sedimentary successions. These relationships provide valuable insight on the
radioactive heat contribution to heat flow, heat flow from the lower crust, composition of
the upper crust, and the potential for geothermal power generation. The specific data used
in this study include: radiogenic heat production values from well logs penetrating the
Precambrian basement of the Williston basin in North Dakota, heat production values
from gamma ray spectrometry on Precambrian basement core, tens of thousands of
formation temperatures from the National Geothermal Data System borehole temperature
data set, gravity and magnetic data (processed to generally characterize thickness and
lithology of the radioactive layer), and stratigraphy and lithology.
Surface heat flow in the Williston basin cannot be predicted strictly by inputs
from the mantle and from the radiogenic basement heat. The direct influence of basement
heat production on heat flow through the sedimentary succession is visible for deeper
units, but shallow and surface heat flow is perturbed by advection in younger aquifers.
While potential for enhanced geothermal systems (EGS) and sedimentary enhanced

x
geothermal systems (SEGS) as well as co-produced and low temperature geothermal are
ultimately controlled by temperature, understanding basement radioactivity can provide
insight for delineating exploration areas.
1
CHAPTER I
INTRODUCTION
Describing the geothermal regime of an area requires an understanding of heat
sources and the mechanisms by which heat is transported. In the stable continental
interior, the two main sources of heat are heat flow from the mantle and radioactive heat
production in the crystalline crust. For this study, the mechanisms of heat transport
considered are convection by fluids moving in the basin, and conduction though the
sedimentary strata.
In tectonically immature areas, heat flow at the crust-mantle boundary can be
variable in magnitude and distribution. However, in stable continental interiors,
contribution to heat flow from the lower crust and upper mantle is quite uniform over
large regions (Roy, Blackwell, and Birch, 1968). The youngest tectonic events in the
northern mid-continent were the 1.85 Ga Trans-Hudson orogeny and the 1.1 Ga
Keweewanan Rift, thus heat flow at the crust-mantle boundary can be considered
constant and uniform. Variability of radioactive heat production from basement rocks in
the northern mid-continent is demonstrably a factor in surface heat flow. Low
radioactivity in the mafic crust of the Keweenawan Rift is expressed as low heat flow, 40
to 50 mW/m2, throughout Lake Superior and northern Minnesota. Heat flow west of the
rift, where the crust consists of deeply eroded Proterozoic continental collision remnants,
is on the order of 50 to 70 mW/m2.
2
The geothermal regime of a sedimentary basin affects the accumulation,
distribution, and utility of energy and mineral resources in that basin. Identification of
geothermal resources, hydrocarbon type and maturity patterns, and types of mineral
deposits is aided by understanding the magnitude and contribution of heat sources and
heat transport mechanisms within the basin. Comparison of radiogenic heat production
patterns with surface heat flow, formation temperatures, and gravity and magnetic data
contributes to understanding the effect of basement heat production on the thermal state
of the basement rocks and the overlying sedimentary succession. This analysis aids in
identification of favorable areas for Enhanced Geothermal Systems (EGS) and
sedimentary EGS as well as co-produced and low-temperature geothermal resources.
For this study, gamma ray values from well logs penetrating the Precambrian
basement in the Williston basin of North Dakota were used to calculate radiogenic heat
production. Heat production data were also obtained from gamma ray spectrometry
performed on cores of the basement rocks and from previous literature. These data were
compiled to establish patterns of spatial variability in radiogenic heat production for the
region. Gravity and magnetics data were processed to generally characterize lithology of
the radioactive layer and to identify any potential areas of focus for the study. Patterns in
surface heat flow and heat flow through the sedimentary succession were obtained from
conventional heat flow measurements and calculated from corrected bottom-hole
temperatures (BHT). These data were contoured and mapped. The spatial and causal
relationships between them were then explored to reveal the nature of the current thermal
regime in the Williston Basin within North Dakota.

3
In similar studies of other sedimentary basins, convective heat transport is
considered a far more influential factor in the distribution of surface heat flow variation
than conductive heat transfer through the strata (Bachu and Burwash, 1994; Majorowicz
et al., 1986; Jones and Majorowicz, 1987). The limited cross formational flow in bedrock
aquifer systems, long tectonic quiescence, minimal hydraulic gradient, and wealth of oil
and gas industry data makes the deeper North Dakota portion of the Williston Basin a
great candidate for exploring the possibility of a different relationship between basement
radioactivity and basin heat flow.

4
CHAPTER II
STUDY SETTING
Basin History
The Williston Basin is an ellipsoidal-shaped depression centered in western North
Dakota and extending into parts of Montana, South Dakota, Manitoba, and
Saskatchewan. It is flanked on the east by the Sioux Uplift, to the north by the Punnichy
Arch and exposed Canadian Shield, and to the west by the Sweetgrass Arch. It is a
structurally simple intracratonic sedimentary basin that contains an almost continuous
stratigraphic record since the Middle Cambrian. The sedimentary secession has a
maximum thickness of over 4km near the basin center in North Dakota, and its history is
reflected in a suite of transgressive and regressive sequences indicative of a shallow
marine environment (Porter, Price, and McCrossan, 1982).
The Williston Basin spans an international border, three domestic political
boundaries in the United States, and two in Canada (Figure 1). The Western Canadian
Sedimentary Basin underlies much of Western Canada including southwest Manitoba,
southern Saskatchewan, almost all of Alberta, northeastern British Columbia, and the
southwestern portion of the Northwest Territories. The geothermal regime of this area
has been explored in detail by previous authors (Majorowicz, Jones, and Jessop, 1986;
Bachu and Burwash, 1994; Jones and Majorowicz, 1987), and analysis of the Canadian
portion of the Williston Basin is included in those works. The lack of data for the

5
Figure 1. Location and outline of the Williston Basin showing major basement structures.
(modified from Gerhard et al., 1982)
portions of the basin within Montana and South Dakota is prohibitive for conducting a
basin wide analysis of geothermics. The North Dakota portion incorporates the deepest,
most structurally significant, and most economically important elements of the basin.
These attributes, combined with the higher density and better availability of relevant data,
allows the narrowing of the study area to the North Dakota Portion of the basin.

6
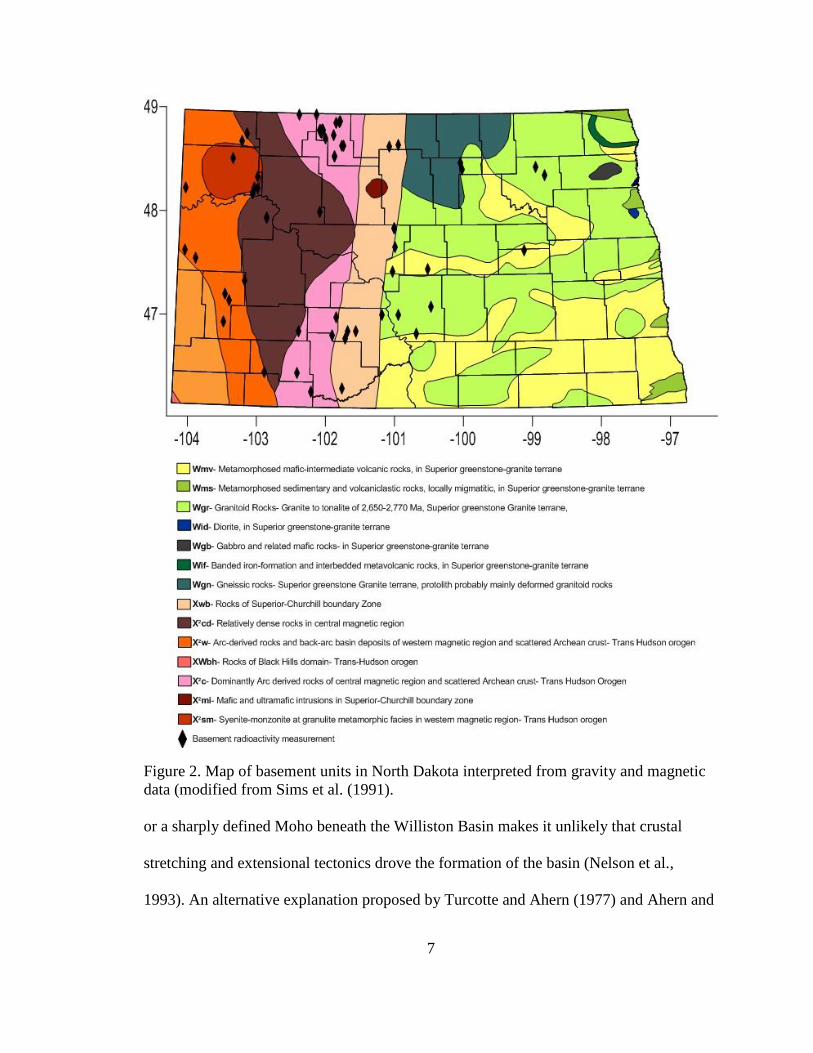
Basement rock in North Dakota is composed of distinct Precambrian provinces;
the Early Proterozoic Trans-Hudson orogenic belt consisting of mainly arc related rocks
separates the Superior and Wyoming Archean cratons consisting of greenstone-granite
and gneissic terranes (Figure 2). The Precambrian Trans-Hudson orogeny included
northeast-trending fault and lineament zones which were reactivated at least three times
during the Phanerozoic as far field responses to the Antler Orogeny (Devonian), and
Cordilleran orogenic activity (Davies, 1998). This created new north–south and
northwest–southeast oriented structures that were precursors to current structure in the
basin such as the Nesson, Cedar Creek, Little Knife, Rough Rider, and Billings anticlines
(Figure 1) (Burrett and Berry, 2000).
Sims et al. (1991) produced a map of basement terranes in the Trans-Hudson and
the adjacent Archean provinces based on the work of Green, Cumming, and Cedarwell
(1979), Green, Hajnal, and Weber (1985), and Green, Weber, and Hajnal (1985), who
correlated lithostructural domains exposed in northern Saskatchewan and Manitoba with
discrete magnetic regions delineated in southwestern Manitoba and southern
Saskatchewan. The authors then extended these magnetic regions south into the United
States. Klasner and King (1986) examined drill-hole, gravity, and magnetic data to
delineate several basement terranes in the Dakotas; these closely resemble those
suggested by Green et al. (1985).
Multiple mechanisms for the formation and subsidence of the basin have been
explored. Authors have proposed an extensional setting, the result of faulting and rifting
of the Trans-Hudson Orogenic belt following the suturing of the Archean Superior craton
to the Archean Wyoming craton (Green et al., 1985), but the lack of an obvious rift basin
7
Figure 2. Map of basement units in North Dakota interpreted from gravity and magnetic
data (modified from Sims et al. (1991).
or a sharply defined Moho beneath the Williston Basin makes it unlikely that crustal
stretching and extensional tectonics drove the formation of the basin (Nelson et al.,
1993). An alternative explanation proposed by Turcotte and Ahern (1977) and Ahern and
8
Mrkvicka (1984) attributes basin subsidence to the decay of a thermal anomaly in the
lithosphere. The origin of the thermal anomaly is problematic, and calculated subsidence
curves are incompatible with a thermal event (Fowler and Nisbet, 1984). Subsidence
calculated from wireline logs shows relatively steady rates of a few meters per million
years for most of the basin’s history with abrupt episodes of rapid subsidence in the late
Devonian (359 ma) and late Cretaceous (88 ma) (LeFever, 1988). The most likely
mechanism for subsidence is reactivation of Trans-Hudson basement structures driven by
sediment loading in the basin and far field tectonics (Green et al., 1985).
Hydrostratigraphy
The hydrologic system in the Williston Basin is established with the crystalline
Precambrian basement as a lower boundary. The 4.5km of overlying Phanerozoic
sedimentary strata can be divided into six hydrostratigraphic units consisting of aquifer
and aquitard subunits based on the work of Downey (1986) and Bachu and Hitchon
(1996) (Figure 3).
The sedimentary rocks of Cambrian and Ordovician age are grouped into the
deepest major aquifer in the basin, composed principally of limestones and dolomites of
the Red River Formation. The Interlake Formation (Silurian; silty, fine to medium
crystalline dolomite and limestone) and Ashern Formation (Devonian; microcrystalline,
anhydritic dolomite) overlie the Cambrian-Ordovician aquifer and act as a confining
layer for this lower system (Downey, 1986; Bachu and Hitchon, 1996; Bluemle et al.,
1986).

9
Figure 3. Hydrostratigraphic column of North Dakota portion of the Williston Basin with
different colors representing different hydrostratigraphic units. (modified from Bachu and
Hitchon, 1996)
10
Two minor sets of Devonian aquifer-aquitards conformably overlie the basal
hydrostratigraphic unit. The first set is comprised of the reef and inter-reef limestones and
dolomites of the Winnipegosis Formation and the confining evaporites of the Prairie
Formation. The dissolution and absence of the Prairie Formation in places in the basin
creates extensive conductivity between the two Devonian aquifers. The second aquifer-
aquitard set is comprised of the porous, permeable, fossiliferous limestone of the
Duperow and Birdbear Formations and the confining shales of the Three Forks and
Bakken Formations (Downey, 1986; Bachu and Hitchon, 1996; Bluemle et al., 1986).
The second major aquifer is the Madison aquifer containing the Lodgepole and
Mission Canyon Formations (Mississippian). These limestones and dolomites can be
cherty to argillaceous and also contain minor anhydrite and gypsum beds. The Madison
aquifer is confined by rocks of the Charles Formation and the Big Snowy Group. The
confining Poplar interval of the Charles Formation contains halite, anhydrite, and
mudstone deposits that severely limit vertical hydraulic conductivity. This very low
vertical hydraulic conductivity isolates the Madison aquifer from other aquifers overlying
it in the basin (Downey, 1986; Bachu and Hitchon, 1996; Bluemle et al., 1986).
The third major aquifer, the Pennsylvanian aquifer, is composed of sandstone and
limestone of the Minnelusa Group (Broom Creek, Amsden, and Tyler Formations). Thick
deposits of Permian, Triassic, and Jurassic shales and siltstones confine the
Pennsylvanian aquifer. These rocks are minimally vertically permeable, and even further
restrict the flow of water from the three lower Paleozoic aquifers to younger overlying
aquifer systems (Downey, 1986; Bachu and Hitchon, 1996; Bluemle et al., 1986).

11
Lower Cretaceous sandstone and siltstone of the Inyan Kara, Skull Creek, and
Newcastle formations forms the fourth major aquifer system. Known widely as the
Dakota aquifer, it is the most developed bedrock aquifer in the northern Great Plains.
This aquifer is capped by as much as a kilometer of shale and argillaceous limestone of
the Pierre Shale, Belle Fourche shale, and Niobrara Formations (Downey, 1986; Bachu
and Hitchon, 1996; Bluemle et al., 1986).
The upper boundary of the hydrologic system in the Williston Basin of North
Dakota is the upper aquifer system. This aquifer system varies in composition from
Upper Cretaceous sandstones to Quaternary glacial sediments and is unconfined
(Downey, 1986).
Groundwater flow in the uppermost hydrostratigraphic units is local and mainly
controlled by topography. In the deep bedrock aquifers, groundwater is confined and flow
is regional (Thamke et al., 2014). The regional system is recharged mainly from streams
draining the Bearpaw, Central Montana, and Black Hills uplifts and the Big Snowy and
Big Horn mountains (Whitehead, 1996). The groundwater flows at very low rates from
these recharge zones in the west toward the eastern and northeastern flanks of the
shallow, bowl shaped basin. High-density brine is present in Paleozoic strata in the North
Dakota portion of the basin, and freshwater is diverted around the brine (Figure 4)
(Whitehead, 1996). The brine is moving slowly east-northeast with much lower velocities
than the freshwater, allowing steady state conditions to prevail in the deep portions of the
basin (Bachu and Hitchon, 1996).

12
Figure 4. General direction of groundwater flow in regional Paleozoic aquifer systems.
High density, slow moving brine shown in the deep North Dakota portion of the basin.
(modified from Whitehead, 1996)
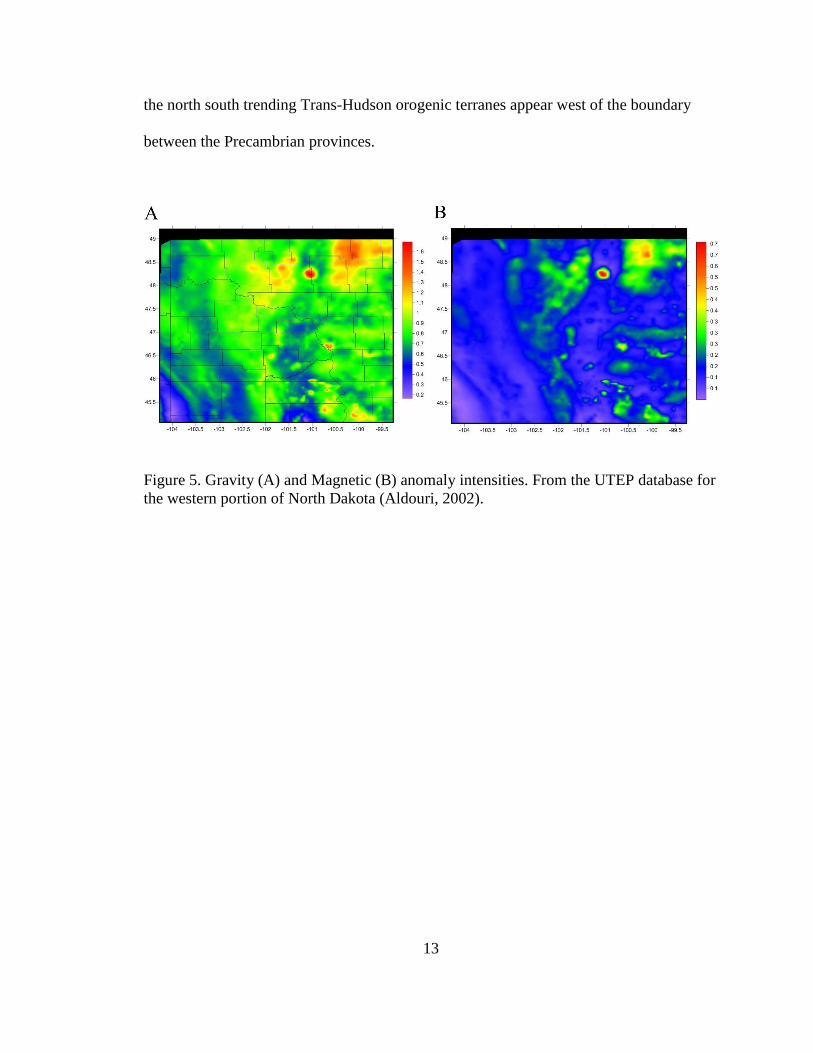
Gravity and Magnetics
Aeromagnetic and terrain corrected gravity data compiled and made publically
available by the University of Texas, El Paso in cooperation with the USGS (Aldouri,
2002) were first examined in an attempt to delineate potential areas of focus for the study.
The models prove unremarkable other than a small positive gravity and magnetic
anomaly straddling Ward and McHenry counties. Cuttings from a well drilled into the
basement there indicate a mafic intrusion. The basement terranes defined by Sims et al.
(1991) (Figure 2) are discernable from the models; the east west trend of the alternating
Superior Province granite greenstones are visible in the eastern portion of the models, and
13
the north south trending Trans-Hudson orogenic terranes appear west of the boundary
between the Precambrian provinces.
Figure 5. Gravity (A) and Magnetic (B) anomaly intensities. From the UTEP database for
the western portion of North Dakota (Aldouri, 2002).

14
CHAPTER III
PREVIOUS WORKS
Gosnold (1999) speculated on general basin geothermics in the region based on 4
radiogenic heat production measurements by Scattolini (1977), conventional heat flow
measurements, and limited BHT data. Local heat flow anomalies in the western portion
of North Dakota were attributed to advective heat transport along structure in the basin.
Majorowicz, Jones, and Ertman (1989) modeled hypothetical high basement radioactivity
as one possible cause of the heat flow anomaly in the Williston Basin that coincides with
an electrical conductivity anomaly observed from magnetotelluric studies (Jones, 1988;
Jones and Savage, 1986). These authors suggest that the preferred cause for the
anomalous heat flow and electrical conduction is mineralization and redistribution of
radiogenic and electrical conductive elements in the crust during the Trans-Hudson
Orogeny. This thesis confirms the existence of the levels of basement radioactivity
modeled in the 1989 work and elucidates the role of advection in the geothermal regime.
Similar studies done in the nearby Western Canadian Sedimentary Basin, among
other basins, have either been different in scope, tectonic setting, or data
acquisition/processing methods. General conclusions drawn from these works limit the
role of basement radioactivity in the overall geothermal regimes of the study areas;
advective heat transport is considered a far more influential control (Bachu and Burwash,
1994; Majorowicz et al., 1986; Jones and Majorowicz, 1987).

15
Heat Generation and Heat Flow
For determining heat flow through strata where internal radiogenic heat
generation is a factor, the following linear relationship has been established:
𝑸 = 𝑞 + 𝐴0𝐷 Equation 1.
Where Q is surface heat flow, q is a constant component of heat flow from the
mantle, A0 is heat generation, and D is the thickness of the radiogenic heat producing
layer (Lachenbruch, 1968; Roy, Blackwell, and Birch, 1968). Consistency in this linear
relationship between heat generation and heat flow led to the definition of “heat flow
provinces” by Roy, Blackwell, and Birch (1968). Heat flow provinces are regions or
terranes with a common tectonothermal history within which heat flow from the lower
crust and upper mantle is generally uniform and the thickness of the radiogenic heat
producing layer is constant. The Northern Great Plains, and more specifically the
Williston Basin, are included in the “Eastern US” heat flow province which is assigned a
value of 7.5 km for the general thickness of the radiogenic heat producing layer.
Authors have proposed alternatives to the linear relationship between heat flow
and heat production that include an exponential model of decreasing radioactivity with
depth (Lachenbruch, 1970), a two layer model that includes an upper layer of variable
thickness and heat generation underlain by a thicker, less variable layer (Drury, 1989),
and a modeled fractal or power law type decrease in radioactivity with depth (Vedanti et
al., 2011).
Where direct measurements of radioelements are not available, the linear
relationship developed by Bücker and Rybach (1996),
𝐴 = 0.0158(𝐺𝑅 − 0.8) Equation 2.
16
can be used to determine A (radiogenic heat production in μW/m3) from standard Gamma
Ray Log (GR) readings (in American Petroleum Institute (API) units) found in almost all
modern well logs. This relationship was empirically determined and is valid over a wide
range of lithologies (including granite, gneiss, carbonates, amphibolites, and basalts) and
over the range of 0-350 API and 0.03-7W/m3, with an error lower than 10% (Bücker
and Rybach, 1996; Beardsmore and Cull, 2001).
17
CHAPTER IV
METHODS
The approach taken in this investigation has 4 components: gravity and magnetic
anomaly observations, determination of radiogenic heat production in basement rocks
from well logs, estimates of heat flow from the mantle, and measurements of heat flow
within the major hydrostratigraphic units in the basin.
Radiogenic Heat Production
The major heat-producing isotopes in the Earth’s crust, 40K, 238U, 235U, and 232Th,
release energy as they undergo radioactive decay. The gamma-ray spectra emitted from a
rock can be analyzed to determine the proportion of each element, and in turn, the rate of
heat production (in μW/m3) for that sample.
Establishing the pattern of radiogenic heat production for basement rocks in the
Williston Basin of North Dakota is made difficult by a deficiency of deep core samples
for the area; only 10 cores penetrate more than one meter below the unconformable
boundary between Phanerozoic sediments and the varied basement terranes. However,
over 150 wells drilled in ND since the beginning of petroleum exploration activities in
the Williston Basin have reached Precambrian basement rocks. Of these wells, 49 are
recent enough and deep enough to have useful gamma ray logs.
Each of the 49 useable well logs was digitized using PETRA (IHS Inc., 2013),
and the average Gamma Ray (API) value for the Precambrian rock at the base of the log

18
was determined. Equation 2 yields an average heat production value for the Precambrian
basement at each well. Using these data, gamma ray spectrometry on the limited core
available, and some data from literature (Scattolini, 1978), two models of variation in
radiogenic heat production were constructed in Surfer (Golden Software, 2014). The first
model interpolated the A0 values with no consideration of lithology. The second model
constructed used the USGS map of basement rocks in North Dakota to assign an average
A0 value for each basement unit.
Heat Flow From the Mantle
This characterization of basement radioactivity creates an understanding of heat
inputs for the basin. The “A0D” term of Equation 1 is the heat flow component generated
by the radioactive layer. If the heat flow from the lower crust and upper mantle is
uniform and the thickness of the radioactive layer is constant, then differences in heat
flow from the crystalline basement are determined solely by the variation in radioactivity
of the upper crustal rocks. To calculate the contribution of heat flow from the mantle to
overall heat flow, the contributions of radiogenic heat production from basement rocks
and from the sedimentary succession were subtracted from total heat flow. The standard
eastern US heat flow province thickness of 7.5km was used for the radioactive basement
rocks. Heat production from the sediments was assumed to be 1.25μW/m3 due to the
thick sequences of organic rich shales in the sedimentary succession (McKenna and
Sharp, 1998; Beardsmore and Cull, 2001).
Receiver function data from the Earthscope Automated Receiver Survey (EARS)
indicate that the crust is thicker in the western terranes of the Trans-Hudson orogenic belt
underlying the Williston basin and thinner in the Superior and Wyoming Provinces. The

19
Figure 6. Crustal thickness in North Dakota from EARS data. (Crotwell and Owens,
2005; Trabant et al., 2012)
N-S trend of the thickness contours in the west parallels the trend of the arc terranes of
the Trans-Hudson (Figure 5). If the volume of heat producing material is directly
proportional to the thickness of the crust (Beardsmore and Cull, 2001) then the
differences demonstrated by the EARS data need to be taken into account. Assuming a
radioactive layer thickness of 15km (consistent with estimates by Gosnold (1999) for the
thicker high heat producing terranes of the Trans Hudson, and the standard eastern US
heat flow province thickness of 7.5km for the thinner Superior Province terranes, mantle
heat flow components were recalculated.
Heat Flow in the Sedimentary Succession
If the heat flow from the lower crust and upper mantle remain constant, variability
in upper crustal radioactivity (A0) should generate the variable heat flow observed at the
surface. However, surface heat flow shows complexity that is difficult to reconcile with

20
such a simple conductive model of the crust. Topography, subsurface structure, thermal
conductivity contrasts, transient sources and sinks, groundwater flow, and climactic
changes can all affect observed surface heat flow. The difference in heat flow above and
below an aquifer is the advective component of heat transport contributed by that aquifer
(Gosnold, 1984), and calculating heat flow below the effects of fluid migration is
essential for understanding the current thermal state and the thermal history of the basin
(Beardsmore and Cull, 2001).
Figure 7. Surface heat flow in North Dakota. Data from the International Heat Flow
Commission Database (IHFC, 2011). Triangles indicate measurement locations.
Bottom hole temperatures from the wealth of oil industry data in the state were
compiled along with thermal conductivity and heat flow data gathered by the University
of North Dakota Geothermal Laboratory to estimate the extent to which advective heat
transport within each hydrostratigraphic unit contributes to the overall geothermal regime
in the basin. Heat flow was calculated for the Red River, Bakken, Swift/Rierdon,
21
Duperow, Deadwood, and Inyan Kara formations as well as the Madison Group. Each
major hydrostratigraphic unit is represented at least once, with the exception of the upper,
unconfined aquifer for which there is little to no thermal data. Calculating the thermal
gradient rather than just observing formation temperatures eliminates the effect of
increased temperature with burial depth. Using bottom hole temperatures, corrected for
thermal disequilibrium (Crowell, Ochsner, and Gosnold, 2012), and mean annual surface
temperature in the area, the thermal gradient from each of the formations to the surface
was calculated.
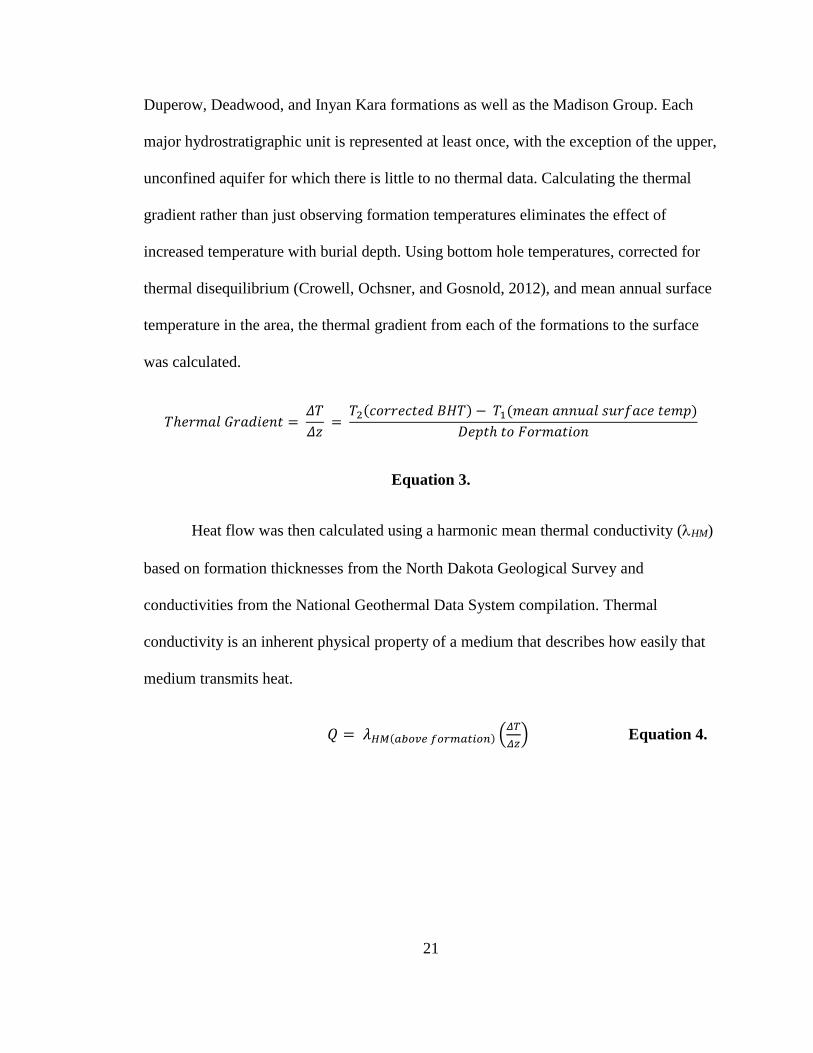
𝑇ℎ𝑒𝑟𝑚𝑎𝑙 𝐺𝑟𝑎𝑑𝑖𝑒𝑛𝑡 = 𝛥𝑇
𝛥𝑧 =
𝑇2(𝑐𝑜𝑟𝑟𝑒𝑐𝑡𝑒𝑑 𝐵𝐻𝑇) − 𝑇1(𝑚𝑒𝑎𝑛 𝑎𝑛𝑛𝑢𝑎𝑙 𝑠𝑢𝑟𝑓𝑎𝑐𝑒 𝑡𝑒𝑚𝑝)
𝐷𝑒𝑝𝑡ℎ 𝑡𝑜 𝐹𝑜𝑟𝑚𝑎𝑡𝑖𝑜𝑛
Equation 3.
Heat flow was then calculated using a harmonic mean thermal conductivity (HM)
based on formation thicknesses from the North Dakota Geological Survey and
conductivities from the National Geothermal Data System compilation. Thermal
conductivity is an inherent physical property of a medium that describes how easily that
medium transmits heat.
𝑄 = 𝜆𝐻𝑀(𝑎𝑏𝑜𝑣𝑒 𝑓𝑜𝑟𝑚𝑎𝑡𝑖𝑜𝑛) (𝛥𝑇
𝛥𝑧) Equation 4.

22
CHAPTER IV
RESULTS AND DISCUSSION
Radiogenic Heat Production
Due to variation in radioactivity within the units, the model of basement
radioactivity constructed using the USGS map of basement rocks in North Dakota to
assign an average A0 value for each basement unit yielded similar averages for most units
and was not further considered. The model constructed by interpolation of the
radioactivity values with no consideration of lithology is shown in Figure 4.
Radiogenic heat production in the basement rocks ranges from 0.04μW/m3 in the
eastern portion of the basin underlain by the Archean Granite-Greenstone belts to
3.89μW/m3 in the arc/back-arc basin lithologies of the far western part of the state. Rather
than coinciding with specific lithologies though, basement radioactivity trends higher
parallel to the major structural features in the basin.
Heat Flow From the Mantle
As shown in Table 1, upper crustal contribution to total heat flow has a range of
over 28mW/m2 with a median effect of over 10mW/m2. The variation in mantle heat
flow calculated from these values is unrealistic and the magnitudes are up to 30mW/m2
greater than that calculated by Majorowicz et al. (2014).

23
Table 1. Calculation of Mantle Heat Flow Component Assuming 7.5km Thick
Radioactive Layer.
Thickness of
radioactive
layer: 7.5km
Heat production
value (μW/m3)
Upper crustal
contribution to
heat flow
(mW/m2)
Total Heat
flow
(mW/m2)
Contribution
from sediments
(mW/m2)
Heat flow
from
mantle
(mW/m2)
Maximum
radiogenic heat
production
3.890 29.2 83.5 (max)
Deepest
portion(4.8km):
6
48.4
Minimum
radiogenic heat
production
0.0376 0.28 24.0 (min)
Shallowest
portion(1.2km):
1.5
22.3
Median
radiogenic heat
production
1.505 11.3 54.0
(median)
Median(3km):
3.75 38.9
Using the variable model for thickness of heat generating crust proportional to
crustal thickness results in mantle heat flow contributions that better fit the findings of
Majorowicz et al. (2014) of 15 ± 5 mW/m2 for the mantle derived component of heat
flow in the Western Canadian Sedimentary Basin (Table 2). The new calculated values
still show variation in mantle contribution to heat flow across the terranes, and this model
is nonunique. Better understanding of the vertical and lateral distribution of radiogenic
elements in the upper crust would refine the model.
Heat Flow in the Sedimentary Succession
The availability of BHT data is restricted by the areal extent of the formation and
by the extent of oil companies’ interest in exploration of the formation, so the coverage of
the heat flow calculations is not uniform (as demonstrated by different areal coverages in
Figure 9 A-G and in Appendix I). The density of data in the shallower two formations is
much less than that of the deeper, more economically important formations.

24
Table 2. Calculation of Mantle Heat Flow Component With Proportionally Variability in
Thickness of Radioactive Layer.
Proportional
thicknesses for
D
Heat
production
value
(μW/m3)
Thickness
of
radioactive
layer, D
Upper crustal
contribution
to heat flow
(mW/m2)
Total Heat
flow
(mW/m2)
Contribution
from sediments
(mW/m2)
Heat flow
from
mantle
(mW/m2)
Maximum
radiogenic heat
production
3.89 15km 58.4 83.5 (max)
Deepest
portion(4.8km):
6
19.2
Minimum
radiogenic heat
production
0.0376 7.5km 0.3 24.0 (min)
Shallowest
portion(1.2km):
1.5
22.3
Median
radiogenic heat
production
1.505 15km 8.4 54.0
(median)
Median(3km):
3.75 27.7
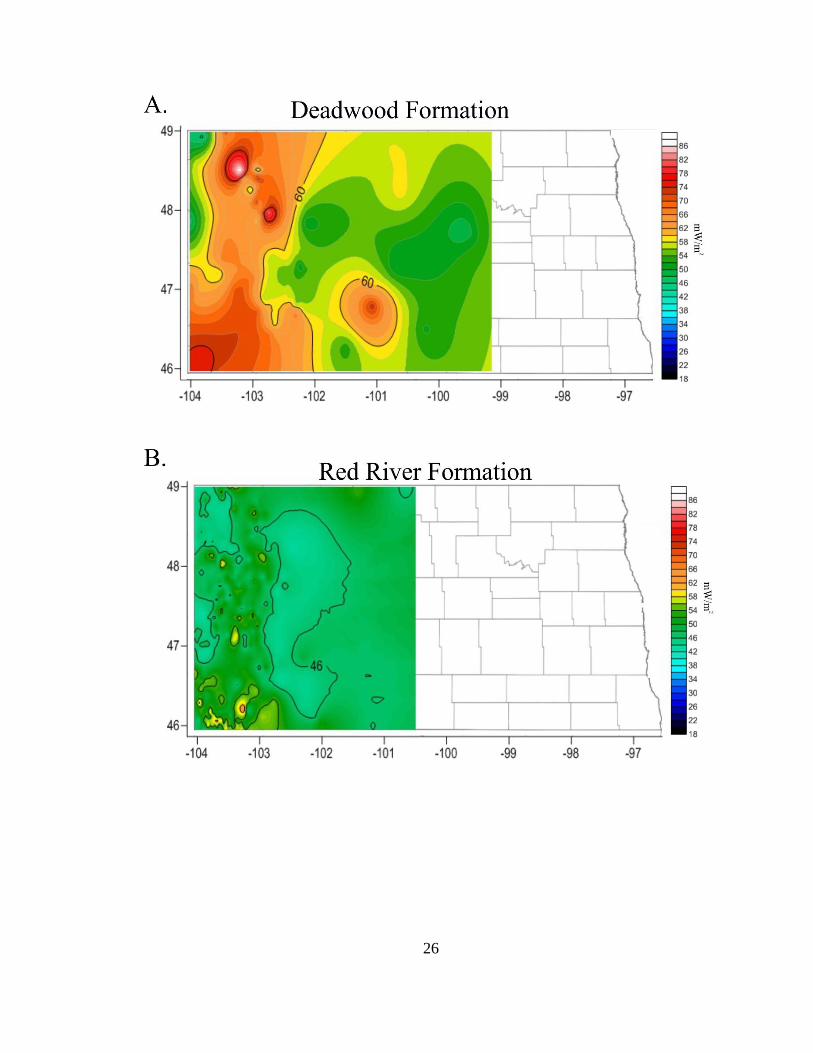
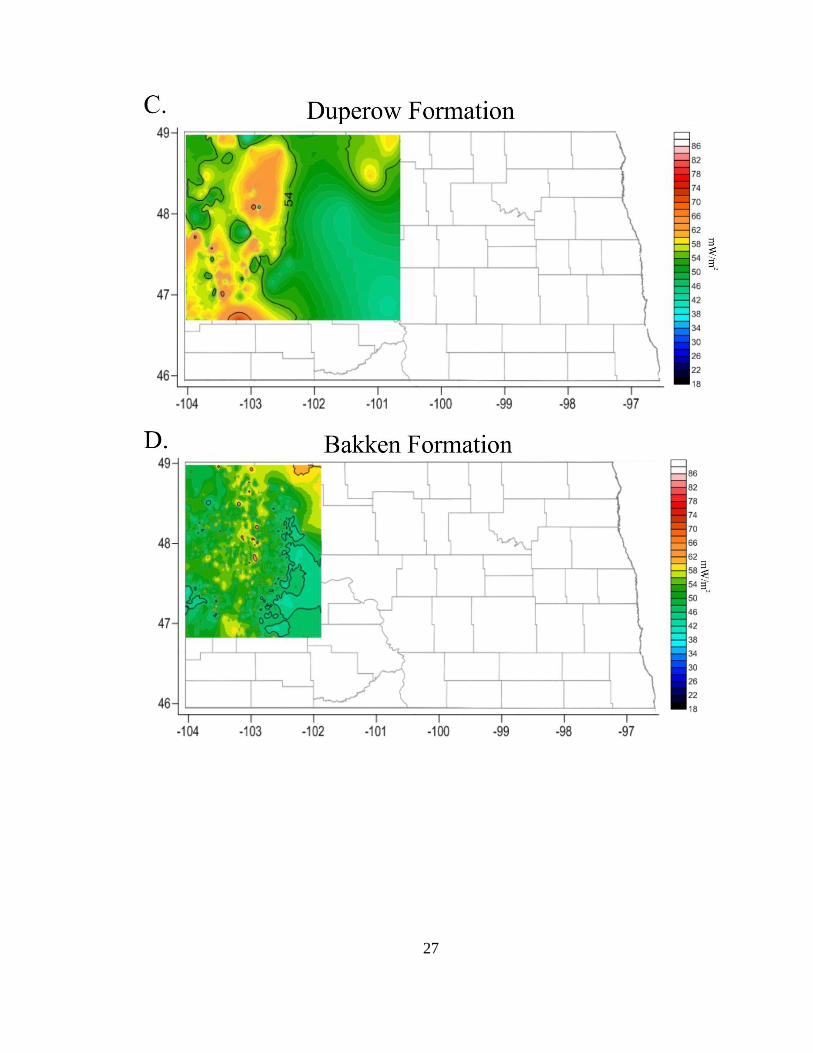
Heat flow in the deepest formations (Deadwood, Red River, Duperow, Bakken,
and Madison Group) mirrors the north/south trend of higher radioactivity detected in
basement rocks. Little effect on heat flow by east-northeast flowing groundwater is
detected in these formations. In the Swift/Rierdon and Inyan Kara, the heat flow pattern
clearly reflects advection up-dip. The east-northeast direction of groundwater flow is
observable via higher heat flow contours wrapping toward the basin margins and aquifer
discharge zones as heat is transported in these younger, shallower hydrostratigraphic
units. This phenomenon is documented in conventional heat flow measurements by
Gosnold and Crowell (2014) as an up dip profile of increasing heat flow in the Pierre
Shale near Minot, North Dakota on the northwestern flank of the Williston Basin. Were
the current study expanded to include more of the shallower basin margins, where the
dense slow-moving brines are not present in the strata, the effects of groundwater
advection would likely be more pronounced, even in the deeper units.

25
Fig
ure
8. R
adio
gen
ic h
eat
pro
duct
ion f
rom
bas
emen
t ro
cks
under
lyin
g t
he
Wil
list
on B
asin
of
Nort
h D
akota
. B
lue
lines
repre
sent
maj
or
anti
clin
al s
truct
ure
s, d
iam
onds
rep
rese
nt
wel
l an
d b
asem
ent
sam
ple
loca
tions.
26
27

28

29
Figure 9. Heat flow through progressively younger formations in the Williston Basin.
A.) Deadwood Formation. B.) Red River Formation. C.) Duperow Formation. D.)
Bakken Formation. E.) Madison Group. F.) Swift and Rierdon Formations. G.) Inyan
Kara Formation. Data derived from corrected BHT data and thermal conductivity
measurements.
Basement Structure and Uranium Mineralization
Majorowicz (1989) and Gosnold (1999) suggested that high heat flow could be caused
either by high heat generation in the Precambrian basement or high heat conduction
related to saline brine in motion along basin structures. Due to the concurrence
discovered in this study of higher basement radioactivity, higher heat flow though the
sedimentary succession, and basement rooted structures in the western portion of North
Dakota, distinguishing the contribution of each heat transport mechanism to the
geothermal regime in the basin is very difficult. Likely, the mechanisms complement
each other; basement rooted structures provide a conduit for convection of hydrothermal
fluids along their general north-south trend, which parallels the trends in heat production

30
in the crystalline basement. This allows the orientation of the higher heat flow pattern in
the basin to be maintained.
Without denser and more abundant core sampling, a source for the higher
radioactivity along the north-south trend in the basin remains hypothetical. The basement
rock units which contain the highest levels of radiogenic heat production are varied in
composition; limited drilling has intersected arc and back arc basin derived gneiss,
granite, mafic granulite, charnockite, syenite and basalt (Sims et al., 1991). Average heat
productions for these different lithologies span orders of magnitude (Beardsmore and
Cull, 2001), making it unlikely that rock type is a control on the high radiogenic heat
signal observed. Noting the coincidence of the higher radioactive heat production with
the trend of basement structures, one possible source of the elevated radioactivity levels
are syn- and post-orogenic hydrothermal fault fluid deposits of uranium.
Studies from the Beaverlodge area of northern Saskatchewan have concluded that
far-field fault reactivation of basement rooted structure during the Kenoran (2.4 Ga),
Thelon (1.85 Ga), and Trans-Hudson Orogens was a primary structural control for
widespread uranium mineralization in fault mylonites, breccias and veins. (Bergeron,
2001) Each tectonic event is associated with a complex history of deformation and
metamorphism, alteration, and a period of uranium mineralization. These basement-
hosted deposits are formed when oxidized uranium-bearing brines (carrying leached
uranium from shallow basement rocks or from overlying sediments) flow down fault
controlled pathways deeper into the basement where they encounter reduced minerals or
fluids and the uranium deposited (Cui, Yang, and Samson, 2010).
31
An investigation (closer in spatial and geologic context to the Williston Basin in
North Dakota) of uranium and thorium deposits in the Western Canadian Sedimentary
Basin found that the Proterozoic sedimentary cover, infaulted or infolded into the
crystalline basement, was not a major source of high uranium values in the study area.
The study concluded that hydration of Precambrian basement rocks, associated with fluid
circulation, prevailed during the development of the shear zones in the basement and
played a key role in the alteration and ore-forming processes (Burwash, 1979).
Structurally controlled mobilization of fluids along basement wrench faults in the
terranes of the Trans-Hudson Orogen underlying the Williston Basin could have
initialized hydrothermal alteration and uranium mineralization. The development and
subsequent reactivations of these faults during basin subsidence could have a twofold
effect on the geothermal regime in the basin; not only do the basement rooted faults
provide a conductive conduit through the sedimentary layers, but their initial formation
and subsequent reactivations acted as structural control on concentrated mineralization of
uranium.
Concerning Paleo-heat Flow
Clues about the thermal history of the Williston basin can certainly be derived
from the current geothermal regime; radioactive elements decay at a calculable rate, and
the timing of basement fault reactivations that might control deposition of these elements
is well constrained by basin subsidence curves. However, paleo-groundwater flow,
paleo-water depth, sediment compaction, erosional episodes, paleoclimate, and changes
in mantle heat flow over time are more difficult to parameterize. Characterizing paleo-
heat flow through the sedimentary succession is important for understand patterns in
32
hydrocarbon type and maturity, but has few implications for current geothermal energy
resources and is therefore not considered in this study.
Play-fairway Analysis
A recent funding focus in the geothermal research community has been play-
fairway analysis of geothermal resources. An approach used regularly in the oil and gas
industry, play fairway analysis identifies areas where elements potentially favorable to
resource development overlap. Elements considered by the oil and gas industry might be
a probable caprock or the presence nearby of a hydrocarbon source. The elements
favorable to possible geothermal resource development might be high formation
temperatures, close proximity to power transmission infrastructure, or high surface heat
flow. If play fairway analysis is undertaken for the Williston Basin or other basins with
similar structural, thermal, and hydrologic characteristics, patterns of basement
radioactivity should be an essential consideration. In these basins, deep sedimentary
thermal resources are unlikely to resemble surface heat flow, but if data are available for
heat production in the underlying crystalline rocks, it will provide an excellent first order
investigative tool.

33
CHAPTER VII
CONCLUSION
The relative structural simplicity, limited cross formational flow and deep slow-
moving brines in bedrock aquifer systems, long tectonic quiescence, and density of oil
and gas industry data in the Williston Basin make it a unique study area for geothermics.
Radiogenic heat production from basement rocks in North Dakota is variable
across and within units of the Precambrian rock, but shows a general higher trend that
parallels some of the major structures in the basin. Careful inspection of the heat flow
across specific sedimentary units reveals that radiogenic heat production from basement
rocks and convection along sub-vertical basement rooted faults are the primary control on
the deeper geothermics in the basin, but heat flow through shallow formations and
surface heat flow is perturbed by groundwater advection in bedrock aquifers. This
conclusion has implications for the methods of exploration of deep thermal resources in
the basin. Surface heat flow is not an accurate predictor of heat flow in units below the
disruptive signal of groundwater movement. These deeper, hotter resources are better
modeled using the heat flow signal from the mantle and basement.
Future investigations into the geothermal regime of the Williston Basin should
incorporate all new thermal data available including careful consideration and correction
of BHTs, refining estimates of heat production from the sedimentary succession,
analyzing any new basement samples or GR logs, and expanding analysis into the

34
shallower portions of the basin in Montana and South Dakota (hinging on data
availability).
35
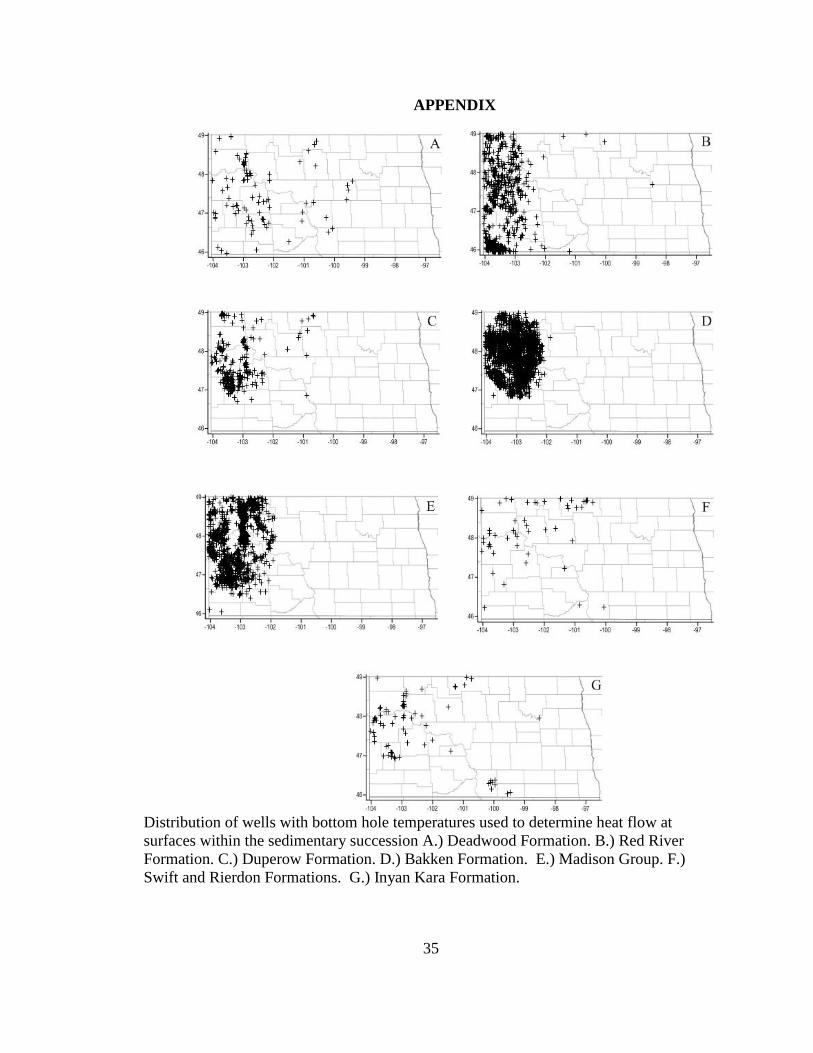
APPENDIX
Distribution of wells with bottom hole temperatures used to determine heat flow at
surfaces within the sedimentary succession A.) Deadwood Formation. B.) Red River
Formation. C.) Duperow Formation. D.) Bakken Formation. E.) Madison Group. F.)
Swift and Rierdon Formations. G.) Inyan Kara Formation.

36
REFERENCES
Ahern, J. L., Mrkvicka, S. R., 1984. A mechanical and thermal model for the evolution of
the Williston Basin, Tectonics, v. 3, p. 79-102
Aldouri, R., 2002. Gravity and Magnetic Database of North America.
http://research.utep.edu/Default.aspx?tabid=37229. Accessed February 2015.
Bachu, S. 1985. Influence of Lithology and Fluid Flow on the Temperature Distribution
in a Sedimentary Basin: A Case Study from the Cold Lake Area, Alberta, Canada.
Tectonophysics, v. 120, p. 257-284.
Bachu, S. And Burwash, R.A. 1994. Geothermal Regime in the Western Canada
Sedimentary Basin. Geological Atlas of the Western Canada Sedimentary Basin.
G.D. Mossop and I. Shetsen (Comps.). Calgary, Canadian Society of Petroleum
Geologists and Alberta Research Council, Chapter 30.
Beardsmore, G. R., and Cull, J. P., 2001. Crustal Heat Flow: A Guide to Measurement
and Modeling. Cambridge University Press, New York
Blackwell, D.D., and M. Richards, 2004. Geothermal Map of North America, U.S.
Subset. AAPG, Tulsa, OK
Bluemle, J. P., Anderson, S. B., Andrew, J. A., Fischer, D. W., LeFever, J. A. 1986.
North Dakota Stratigraphic Column: North Dakota Geological Survey
Miscellaneous Series 66.
Bücker, C., Rybach, L. 1996. A Simple Method to Determine Heat Production from
Gamma-Ray Logs. Marine and Petroleum Geology, v. 13, p. 373-375.
Burrett, C., and Berry, R., 2000. Proterozoic Australia – Western United States
(AUSWUS) fit between Laurentia and Australia: Geology, v. 28, no. 2, p.
103-106.
Burwash, R.A. 1979. Uranium and Thorium in the Precambrian Basement of Western
Canada, Part Ii. Petrologic and Tectonic Controls. Canadian Journal of Earth
Sciences, v. 16, p. 472-483.
Crotwell, H. P., and Owens, T.J., 2005. Automated receiver function processing.
Seismology Research Letters, v. 76, p. 702-708.
37
Crowell, A. M., and Gosnold, W. D., 2011. Correcting Bottom-Hole Temperatures: A
Look at the Permian Basin (Texas), Anadarko and Arkoma Basins (Oklahoma),
and Williston Bain (North Dakota). GRC Transactions, v 35, p. 735-738.
Crowell, A.M., Ochsner, A.T., Gosnold, W.D. 2012. Correcting Bottom-Hole
Temperatures in the Denver Basin: Colorado and Nebraska. GRC Transactions,
v. 36.
Crowley, K. D., Ahern, J. L., & Naeser, C. W., 1985. Origin and epeirogenic history of
the Williston Basin: Evidence from fission-track analysis of apatite. Geology,
v. 13(9), p. 620-623.
Cui, T., Yang, J., Samson, I.M., 2010. Formation of Unconformity-Related Uranium
Deposits: Perspectives from Numerical Modeling. AAPG Search and Discovery
Article #90172
Davies, J.R. 1998. The Origin, Structural Style, and Reactivation History of the
Tabbernor Fault Zone, Saskatchewan, Canada. Unpublished Master’s thesis,
McGill University, Montreal.
Downey, J.S. 1986. Geohydrology of Bedrock Aquifers in the Northern Great Plains in
Parts of Montana, North Dakota, South Dakota, and Wyoming: USGS
Professional Paper 1402-E
Drury, M.J., 1989. The heat flow-heat generation relationship: Implications for the nature
of continental crust. Tectonophysics, v. 164 p. 93-106.
Fowler, C.M.R., Nisbet, E.G. 1985. The Subsidence of the Williston Basin. Canadian
Journal of Earth Science. v. 22, p. 408-415
Gerhard, L.C., Anderson, S.B., Lefever, J. A., Carlson, C.G. 1982. Geological
Development, Origin, and Energy Mineral Resources of the Williston Basin,
North Dakota. American Association of Petroleum Geologists Bulletin, v. 66,
p. 989-1020.
Golden Software Inc., (2013). Surfer Version 11.4.958, Golden, Co.
Gosnold, W.D., Jr., 1984, Geothermal resources of the Williston Basin, North Dakota,
GRC Transactions, v. 8, p. 431-436.
Gosnold, W. D., Jr. 1990. Heat flow in the Great Plains of the United States, Journal of
Geophysical Research, v. 95, p. 353-374.
Gosnold, W.D., Jr.1999. Stratabound geothermal resources in North Dakota and South
Dakota: Natural Resources Research, v. 8, no. 3, p. 177-193

38
Gosnold, W.D. Jr., Crowell, A.M., 2014. Heat Flow and Geothermal Research in the
Mid-Continent: Geothermal Resources Council Transactions, v. 38. p. 127-131.
Green, A.G., Cumming, G.L., and Cedarwell, D. 1979. Extension of the Superior-
Churchill boundary zone into southern Canada: Canadian Journal of Earth
Sciences, v. 16, p. 1691-1701.
Green, A.G., Hajnal, Z., Weber, W. 1985. An Evolutionary Model of the Western
Churchill Province and Western Margin of the Superior Province in Canada and
the North-Central United States: Tectonophysics, v. 116, p. 281-322.
Green, A.G., Weber, W., Hajnal, Z. 1985. Evolution of Proterozoic Terrains beneath the
Williston Basin. Geology, v. 13, p. 624-628.
IHS Inc., (2013). PETRA Version 3.8.3, Tulsa, Ok.
International Heat Flow Commission (IHFC). 2011. Global Heat Flow Database.
http://www.heatflow.und.edu/index2.html. Accessed February 2015.
Jones. A.G. 1988. A Magnetotelluric Investigation under the Williston Basin Of
Southeastern Saskatchewan: Discussion. Canadian Journal of Earth Science, v.
25, p.1132-1139.
Jones, A.G., Savage, P.J. 1986. North American Central Plains Conductivity Anomaly
Goes East. Geophysical Research Letters, v. 13, p. 685-688.
Klasner, J.S., and King, E.R. 1986. Precambrian Basement Geology of North and South
Dakota: Canadian Journal of Earth Sciences, v. 23, p. 1083-1102.
Lachenbruch, A. H. 1968. Preliminary geothermal model of the Sierra Nevada. Journal of
Geophysical Research, v. 73(22), p. 6977-6989.
Lachenbruch. A.H. 1970. Crustal Temperature and Heat Production: Implications of the
Linear Heat Flow Relation, Journal of Geophysical Research, v. 75. p. 3292-3300.
LeFever, R.D. 1988. Subsidence History of Williston Basin in North Dakota. AAPG
Search and Discovery Article #91033.
Majorowicz, J.A., Jones, F.W., Lam, H.L., and Jessop, A.M. 1984. The Variability of
Heat Flow Both Regional and With Depth in Southern Alberta, Canada: Effect of
Groundwater Flow. Tectonophysics, v. 106, p. 1-29.

39
Majorowicz, J.A., Jones, F.W., and Jessop, A.M. 1986. Geothermics of the Williston
Basin in Canada In Relation To Hydrodynamics and Hydrocarbon Occurrences.
Geophysics, v. 51(3), p. 767-779.
Majorowicz, J.A. Jones, F.W., and Ertman, M.E., 1989. Model of Terrestrial Thermal
Effects in the Area of the Crustal Electrical Conductors of the Williston Basin:
Canadian Journal of Exploration Geophysics, v. 25, no. 1, p. 45-49.
Majorowicz, J., Chan, J., Crowell, J., Gosnold, W., Heaman, L. M., Kück, J.,
Nieuwenhuis, G., Schmitt, D. R., Unsworth, M., Walsh, N., and Weides, S., 2014.
The first deep heat flow determination in crystalline basement rocks beneath the
Western Canadian Sedimentary Basin: Geophysical Journal International, v. 196,
no. 3, p. 1267-1905.
McKenna, T.E., Sharp, J.M. 1998. Radiogenic Heat Production in Sedimentary Rocks of
the Gulf Of Mexico Basin, South Texas. AAPG Bulletin, v. 82, no. 3, p. 484-496.
Morgan, P. 1984. The Thermal Structure and Thermal Evolution of the Continental
Lithosphere, Physics and Chemistry of the Earth. v. 12, p. 107-193.
Nelson K.D., Baird D.J., Walters J.J., Hauck, M. Brown, L.D., Oliver, J.E., Ahern, J.L.,
Hajnal, Z., Jones, A.G., Sloss, L.L. 1993. Trans-Hudson Orogen and Williston
basin in Montana and North Dakota: New COCORP Deep-profiling Results.
Geology, v. 21, no. 5, p. 447-450.
(NOAA) National Oceanic and Atmospheric Administration, U.S. Department of
Commerce, National Climatic Data Center. 2015. http://www.ncdc.noaa.gov/
Porter, J.W., Price, R.A., McCrossan, R.G. 1982. The Western Canada Sedimentary
Basin.
Philosophical Transactions of the Royal Society of London. Series A,
Mathematical and Physical Sciences, v. 305, p. 169-192.
Roy, R. F., Blackwell, D. D., and Birch, F. 1968. Heat generation of plutonic rocks and
continental heat flow provinces, Earth Planet. Sci. Lett., 5, 1-12.
Roy, R.F. Decker, E.R., Blackwell, D.O., Birch, F. 1968. Heat flow in the United States,
Journal of Geophysical Research, v. 11, p. 5207-5221.
Scattolini, R. 1977. Heat Flow and Heat Production Studies in North Dakota. Ph.D.
Dissertation, University of North Dakota, Grand Forks.
Sims, P.K., Peterman, Z.E., Hildenbrand, T.G., Mahan, S. 1991. Precambrian Basement
Map of the Trans-Hudson Orogen and Adjacent Terranes, Northern Great Plains,
U.S.A. USGS Miscellaneous Investigations Series Map 1-2214.

40
Thamke, J.N., Lecain, G.D., Ryterd.W., Sando, R., Long, A.J. 2014. Hydrogeologic
Framework of the Uppermost Principal Aquifer Systems in the Williston and
Powder River Structural Basins, United States and Canada. USGS Scientific
Investigations Report 2014–5047
Trabant, C., Hutko, A. R., Bahavar, M., Karstens, R., Ahern T., and Aster, R., 2012.
Data products at the IRIS DMC: stepping-stones for research and other
application, Seismological Research Letters, v. 83, p. 846-854.
Turcotte, D.L., Ahern, J.L., 1977. On the thermal and subsidence history of sedimentary
basins. Journal of Geophysical Research, v. 82
Vedanti, N., Srivastava, R. P., Pandey, O. P., and Dimri, V. P., 2011. Fractal behavior in
continental crustal heat production: Nonlinear Processes in Geophysics, v. 18, no.
1, p. 119-124.
Whitehead, R.L., 1996. Groundwater Atlas of the United States, Segment 8: Montana,
North Dakota, South Dakota, Wyoming. USGS Hydrologic Investigations Atlas
730-I.